Abstract
Amidst the challenges posed by global climate change and China’s dual-carbon objectives, the advancement of low-carbon innovative development within urban renewal projects faces obstacles arising from the divergent interests of multiple stakeholders. This research identifies the government, social capital entities, and design research institutes as principal stakeholders and develops a tripartite evolutionary game model incorporating sixteen critical variables. The findings indicate that governmental incentive policies facilitate the system’s progression toward a stable equilibrium. Notably, when the intensity of incentives surpasses a specific threshold, a positive feedback mechanism emerges between social capital engagement and design quality. Consequently, the study proposes a collaborative framework characterized by “dynamic incentives, risk sharing, and mutual recognition of standards,” which underscores the co-evolutionary dynamics among system design, technological innovation, and market participation. This framework offers a novel approach to addressing prevalent challenges in urban renewal, including inadequate incentives, elevated risks, and low efficiency in outcome conversion.
1. Introduction
In the context of global climate change, the acceleration of low-carbon technological innovation has emerged as a critical pathway for achieving the objectives outlined in the Paris Agreement []. Contemporary international scholarship suggests that the transition to a low-carbon economy extends beyond mere technological advancements; it requires a comprehensive restructuring of infrastructure, institutional arrangements, and social behaviors. Theories of sociotechnical transitions emphasize that innovation within energy service systems must foster the integrated development of technology, policy frameworks, knowledge dissemination, and behavioral change [,,]. Moreover, research paradigms that transcend technocentric perspectives emphasize the importance of reconfiguring power dynamics and transforming social practices [,,]. Empirical evidence from international contexts indicates that achieving systemic breakthroughs is challenging when relying exclusively on either market-driven or government-led strategies [,,]. For example, private capital often faces techno-economic barriers that hinder low-carbon investments [,], while carbon trading policies have been implemented to mitigate financing constraints and stimulate corporate innovation [,]; Additionally, the European Union has restructured global competition regulations through mechanisms such as the Carbon Border Adjustment Mechanism (CBAM) [,,]. Nevertheless, developing countries remain vulnerable due to disparities in technological capabilities [,,]. Recent studies have begun to explore the network attributes of low-carbon innovation ecosystems, such as analyzing risk interdependence and propagation dynamics within innovation networks []. However, current international research exhibits limitations in elucidating the micro-level mechanisms underlying the dynamic interactions among multiple stakeholders, particularly the conflicts of interest among governments, capital providers, and technological institutions [,]. The majority of studies concentrate on the impacts of isolated policies and technologies (e.g., carbon taxes, subsidies) [,], which complicates the comprehensive understanding of the evolving dynamics of policy incentives and stakeholder strategies [,].
As the largest emerging economy globally, China has offered a distinctive model for international practices through initiatives such as low-carbon city pilot programs [,], innovative urban policy frameworks [,], and other extensive policy experiments. Research indicates that while these low-carbon city pilots can stimulate green technological innovation [,], there exists considerable regional heterogeneity in their capacity to incentivize innovation [,]. Concurrently, although governmental investment in science and technology and the advancement of the digital economy can partially mitigate corporate financing constraints [,], voluntary environmental regulations may impede non-green innovation activities [,,]. Such dynamics can result in efficiency losses within specific pilot policies due to conflicting interests [,]. Moreover, the potential for disruptive innovations in sectors such as solar energy and electric transportation, often driven by design research institutions, remains underexploited []. Additionally, social capital encounters cooperation challenges within public–private partnership (PPP) projects operating under dynamic payment mechanisms [,]. Collectively, these observations highlight that current scholarship lacks a comprehensive understanding of the synergistic interactions between technological innovation and institutional transformation. Specifically, there is an insufficient in-depth analysis of the selection processes for technological trajectories, the calibration of institutional adaptations, and the mechanisms governing benefit distribution [,].
In summary, the advancement of urban low-carbon innovation is confronted with several challenges, including regional variations in the efficacy of governmental incentive policies [,,], financing constraints and market risks faced by social capital [,,], and the insufficient utilization of technological institutions in driving technological transformation [,]. Achieving a balance among the interests of government entities, social capital, and technological organizations, while establishing an effective synergistic mechanism, constitutes a critical challenge in the development of urban low-carbon innovation [,,]. This study concentrates on the low-carbon innovative development within Chinese cities. Noting the limited attention in existing literature to the primary contradictions and conflicts of interest in this domain, the research identifies government, social capital, and design research institutes as the principal stakeholders. Employing social network analysis to ascertain the core demands among these actors, a tripartite evolutionary game model is developed to investigate the conflicts of interest among them. Utilizing data simulations derived from Chinese urban contexts and conducting analyses with Matlab R2023a software, the study elucidates the influence of incentive policies on system stability. The findings aim to inform mechanism design strategies that foster collaboration among multiple stakeholders, thereby advancing urban renewal through low-carbon innovation and facilitating multi-party value co-creation in terms of objectives, resources, and actions.
2. Analysis of Interests
With the rapid development of society and the economy, urban renewal increasingly considers the complex and comprehensive demands of multiple stakeholders. In this study, the core subjects of interest were identified as a tripartite group: the government [,,], social capital [,,], and the design research institutes [,]. To ensure the representativeness and accuracy of the study, information sources were carefully selected based on the distinct characteristics of each subject.
The government perspective indicates that the data primarily originate from official government websites, policy documents, and public speeches by press spokespersons. From a social capital perspective, the data are sourced from enterprise annual reports, industry reports, and the official websites of relevant enterprises. The design research institute’s perspective relies on data from professional journals, academic papers, and public project reports from design research institutes, which are used to analyze and refine the core demands of each subject, as illustrated in Table 1.

Table 1.
Claims of Subjects of Interest.
To systematically examine the correlation of appeals among the parties involved, this study categorizes the core appeals of the government, social capital, and design and research institutes for each project listed in Table 1. These appeals are further classified along two dimensions: ‘low carbon’ and innovation.’ The attributes of 22 core appeals are delineated, and corresponding codes are assigned, as presented in Table 2. Subsequently, a two-mode network matrix of ‘subject-appeal’ relationships is constructed (Table 3), linking the three subjects in each project with their respective appeal items. A value of 1 is assigned if a subject explicitly or implicitly expresses a particular appeal within the project; otherwise, a value of 0 is recorded. Utilizing the NetDraw software, a visual representation of the inter-subject appeal relationship network is generated (Figure 1). In this figure, circular nodes denote the participants, while directed edges indicate the presence of appeal correlations or mutual influence among the subjects. This visualization effectively illustrates the interaction structure of appeals among the three parties during the process of urban low-carbon innovation. It serves as a foundation for identifying key points of conflict in subsequent analyses.
Table 2.
Appeal code.
Table 3.
‘Subject-demand’ bimodal matrix.
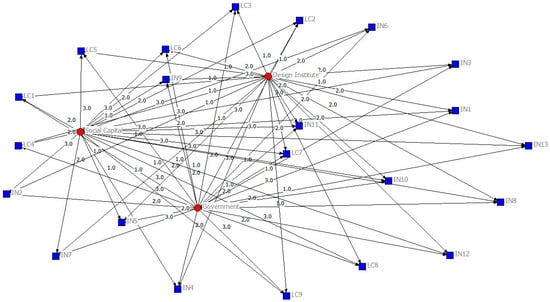
Figure 1.
Inter-subjective claim relationships.
The situation of the most likely conflicting claims between the various interests in the urban low-carbon innovation process is shown in Figure 2.
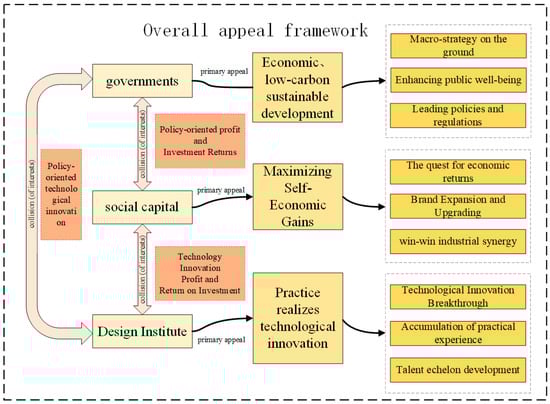
Figure 2.
Conflicting central claims of subjects of interest.
3. The Construction of the Interest Balancing Mechanism of Multiple Subjects for Urban Low-Carbon Innovative Development
3.1. Evolutionary Game Modeling Assumptions
The logical relationship among the three subjects of evolutionary game theory—the government, social capital, and the design research institute—presented in this paper is illustrated in Figure 3.
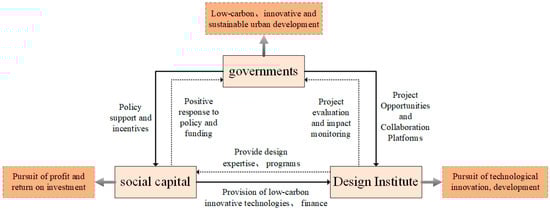
Figure 3.
Logical relationship diagram of evolutionary game subjects.
3.1.1. Model Assumption
Assumption 1.
The three stakeholders—local government, social capital, and design research institutes—are all of limited rationality. The action strategy set for the local government is A = [A1, formulating incentive policies; A2, no incentive policies]. “Formulating incentive policies” means that the government supports social capital and design research institutes to actively participate in urban renewal through policy benefits, tax reductions, and other policy support, thereby reducing carbon emissions and providing funding, technology, and renovation plan support; “no incentive policies” means that the local government only conveys the requirements from higher authorities to its subordinates. The action strategy set for social capital is B = [B1, active support; B2, passive support]. “Active participation” refers to social capitalist willingness to invest funds and adopt green, low-carbon innovative technologies for urban transformation, thereby meeting the low-carbon innovation development requirements of urban renewal. “Passive participation” refers to the challenges in securing funding for low-carbon innovative development within the city. The action strategy set for design research institutes is C = [C1, high-quality design; C2, low-quality design]. “High-quality design” refers to the design research institute’s strict adherence to project requirements and standards, investing sufficient professionals and effort to ensure that the design plan is scientifically reasonable and highly innovative. Although the client constrains the design research institute in the overall design direction, it still has a certain degree of autonomy in the specific implementation process, allowing it to optimize design plans, allocate resources reasonably, and improve design quality to ensure the project’s successful implementation; “low-quality design” means that the design research Institute’s design plan only follows the client’s requirements, using mature solutions that carry lower risk but lack innovation.
Assumption 2.
Let the probability that the government chooses to “formulate incentive policies” be x, then the probability of choosing “no incentive policies” is 1 − x; let the probability that social capital chooses to “actively support” be y, then the probability of choosing “passively support” is 1 − y; let the probability that the design research institute chooses “high-quality design” be z, then the probability of choosing “low-quality design” is 1 − z, where x, y, z ∈ [0, 1].
Assumption 3.
When the government opts for a non-incentive policy, there is a scenario where both capital and research institutions choose to participate actively. In this situation, even if the local government has not made significant contributions to the city’s low-carbon innovation development, the collaborative efforts of capital and research institutions can still lead to a certain level of low-carbon innovation development in the city, allowing the government to gain some reputational benefits. In this case, the environmental benefits obtained from the government’s passive strategic behavior are assumed to be Ca2. Correspondingly, when the government adopts an active strategy, it will achieve a higher social environmental benefit, Ca1, compared to Ca2.
Assumption 4.
Local governments that opt for proactive strategies will focus their efforts on two main areas. Firstly, they will seek to stimulate capital investment to foster technological advancement. Let us assume the cost associated with supporting green innovation technology, denoted as T, encompasses tax incentives and subsidies for capital investment from the government, as well as any related recognition benefits. Secondly, the extent of government involvement will significantly influence the quality of designs provided by research institutes. Let us denote the basic intervention cost for the government concerning design research institutes as P, and the level of intervention as k. Consequently, the cost for the government to encourage research institutes to offer high-quality designs for urban low-carbon innovation development is kP.
3.1.2. Parameterization
This paper establishes the following parameters and, by analyzing the key variables in the relationships among the three parties, lays the groundwork for constructing the dynamic evolution game equations in subsequent sections, as illustrated in Table 4.
Table 4.
Key variables in the tripartite stakeholder relationship.
Based on the aforementioned assumptions, a total of eight strategic combinations for the government, social capital, and design research institute game have been identified. This is detailed in Table 5.
Table 5.
Strategy combinations and benefit matrices of the three parties of interest.
3.2. Game Modeling of Urban Low-Carbon Innovation Interests
3.2.1. Replicated Dynamic Equations for Three-Way Evolutionary Games
In the process of constructing a low-carbon innovative society within the context of urban renewal, the interests of the government, social capital, and the design research institute can be analyzed by constructing an evolutionary game model. This model reveals how the different strategy choices and benefits among the three parties are influenced by each other’s strategies, as demonstrated through the dynamic replication process indicated by the magnitudes of x, y, and z. The expected benefits and average expected benefits of the three parties under positive and negative strategies can be calculated, and the dynamic replication equations for the government, social capital, and design research institute can be listed, respectively. The expected returns and average expected returns of each subject under positive and negative strategies can be calculated, and the dynamic replication equations for the government, social capital, and design research institute can be listed, respectively. The process of building the game theory model is as follows []:
- The government should adopt the “development of positive incentives” strategy for the expected return of W11 (the income matrix of the government ’s choice of positive strategy is shown in Table 6), select the “formal” strategy for the expected return of W12 (the income matrix of the government ’s choice of negative strategy is shown in Table 7), and calculate the average expected return of W1 using the government’s behavioral strategy to replicate the dynamic equation.W11 = (Ca1-T-kP)yz + (Ca1-T-kP)y(1 − z) + (Ca1-kP)(1 − y)z + (Ca1-kP)(1 − y)(1 − z)W12 = Ca2yz + Ca2y(1 − z) + 0 + 0W1 = xW11 + (1 − x)W12 = Ca1x + Ca2y-kPx-Ca2xy-TxyU(x) = dx/dt = x(W11−W1) = x(x − 1)(kP-Ca1+Ca2y+Ty)
Table 6. Matrix of benefits when the government chooses to develop a positive incentive strategy A1.
Table 7. Matrix of benefits when the government does not choose to develop a positive incentive strategy A2.
- Behavioral strategies of social capital replicate dynamic equations.W21 = (Cb1+T-D-∆D)xz + (Cb1+T-D-∆D-e)x(1 − z) + (Cb1-D-∆D)(1 − x)z + (Cb1-D-∆D-e)(1 − x)(1 − z)W22 = (Cb2+g-D-f)xz + (Cb2-D)x(1 − z) + (Cb2+g-D-f)(1 − x)z + (Cb2-D)(1 − x)(1 − z)W2 = yW21 + (1 − y)W22 = Cb2-D-∆Dy+Cb1y-Cb2y-ey-fz+gz+eyz+fyz-gyz+TxyU(y) = dy/dt = y(W21 − W2) = y(y − 1)(∆D-Cb1+Cb2+e-ez-fz+gz-Tx)
- Design the research Institute’s behavioral strategy to replicate the dynamic equations:W31 = (R+∆R-H1)xy + (R-H2-g)x(1 − y) + (R+∆R-H1)(1 − x)y + (R-H2-g)(1 − x)(1 − y)W32 = (R-H2)xy + (R-H2)x(1 − y) + (R-H2)(1 − x)y + (R-H2)(1 − x)(1 − y)W3 = zW31 + (1 − z)W32 = R-H2-gz+∆Ryz+gyz-H1yz+H2yzU(z) = dz/dt = z(W31−W3) = −z(z − 1)(∆Ry-H1y+H2y-g+gy)
3.2.2. Stability Analysis of Low-Carbon Innovation Development in Cities
Associating U(x), U(y), and U(z) yields the equation representing the replicated power system for the government, social capital, and design research institutes as:
Friedman’s research indicates that the conflict of interest and the level of engagement in urban low-carbon innovation can be quantified using the Jacobian matrix to determine the evolutionary stable equilibrium solution of the replicator dynamics system. The Jacobian matrix for the replicator dynamics system, which is relevant to the construction of a low-carbon innovative society during urban renewal, is as follows:
In the urban renewal low-carbon innovative social development replication dynamic system, let U(x) = U(y) = U(z) = 0; we can identify 12 stable equilibrium points of the low-carbon innovative social replication dynamic system, which are Q1 (0,0,0); Q2 (1,0,0); Q3 (0,1,0); Q4 (0,0,1); Q5 (1,1,0); Q6 (1,0,1); Q7 (0,1,1); Q8 (1,1,1); Q9 (1,g/(∆R+g-H1+H2),(∆D-Cb1+Cb2+e-T)/(e+f-g)); Q10 ((∆D-Cb1+Cb2-f+g)/T,(Ca1-kP)/(Ca2+T),1); Q11 (0,g/(∆R+g-H1+H2),(∆D-Cb2+f+g)); Q12 ((∆D-Cb1+Cb2+e)/T,(Ca1-kP)/(Ca2+T),0). Here, Q1, Q2, Q3, Q4, Q5, Q6, Q7, and Q8 define the boundaries of the domain of the evolutionary game {(x, y, z)|x = 0,1; y = 0,1; z = 0,1}. The equilibrium interval can be determined as M = {(x, y, z)|0 ≤ x ≤ 1, 0 ≤ y ≤ 1, 0 ≤ z ≤ 1}, within which there also exist equilibrium points Q9, Q10, Q11, and Q12 that satisfy the conditions. However, due to their non-asymptotic stability in the replication dynamic system formed by the government, social capital, and design research institute, after being substituted into the Jacobian matrix, all eigenvalues are positive numbers, which does not meet the criteria for determining the evolutionary stable point of ll eigenvalues not being positive. Essentially, they are transitional equilibrium points and cannot achieve long-term stable coexistence of the three parties. Therefore, this study discusses the asymptotic stability of the eight pure strategy Nash equilibria only.
Given the domain x, y, z ∈ [0, 1], which comprises 8 equilibrium points, and considering that all key variables in the relationship of the subject of interest are greater than 0, each equilibrium point will be analyzed individually. This is due to the large number of parameters influencing the system of the evolutionary game and the complexity of the relationships. Additionally, an equilibrium point is considered stable when the eigenvalues of the Jacobi matrix are non-positive.
As g > 0 is a constant, it does not meet the conditions for all eigenvalues of the Jacobi matrix to be non-positive; therefore, Q4 and Q6 cannot be points of evolutionary stability. For the stability of other equilibrium points, it is first necessary to determine the various eigenvalues λ that meet the conditions for being non-positive. The stability of Q1 also needs to be determined by examining the positivity and negativity of Ca1-kP. Since Ca1 represents the benefits obtained by the government from actively promoting the development of urban low-carbon innovations, and kP indicates the basic intervention cost for the government to promote the Institute to provide high-quality design, based on government policy, the government’s intervention for design research institutes is primarily auxiliary. The output cost will be lower relative to the benefits gained, so Ca1-kP > 0, indicating that Q1 is a non-stable point. If Q2 could be a stable point, it would also need to satisfy Cb1-ΔD-Cb2-e+T < 0, indicating that the benefits of government and social capital participation in urban low-carbon innovation and transformation are less than the losses incurred by design research institutes providing low-quality design to support capital. In this situation, social capital, being primarily self-interested, will certainly choose to hinder the construction, ultimately affecting the government’s active building efforts. The result would be contradictory to the expectation, so Cb1-ΔD-Cb2-e+T > 0, indicating that Q2 is a non-stable point. For Q3, Q5, Q7, and Q8, it is also necessary to satisfy Cb1-ΔD-Cb2-e+T < 0, and Q2 can become a stable point. Q7 and Q8 also need to judge the positivity and negativity of ΔR-H1+H2. If ΔR-H1+H2 > 0, it means that the revenue gained by the Institute from providing high-quality design is higher than the cost invested in providing high-quality design. The primary objective of developing a low-carbon innovative city is to foster urban development and stimulate economic growth, ensuring that the cost expenditure is less than the economic benefit, which suggests that Q3 and Q5 are unstable points. Q7 and Q8 also need to determine the positivity and negativity of Ca1-Ca2+T+kP. For the government to actively participate in the city’s low-carbon innovation construction, the ultimate gain is an indeterminate value. When Ca1-Ca2+T+kP > 0, Q8 is a non-stable point, and vice versa, Q7 is a non-stable point. Therefore, whether Q7 or Q8 is a stable point needs to be classified and discussed, and the results are shown in Table 8.
Table 8.
Eigenvalues and equilibrium points of the Jacobi matrix for pure strategy stability.
4. Simulation Analysis of Urban Low-Carbon Innovation Benefit Evolution Subjects
Based on the analysis above, when the equilibrium point is Q7 (A2, no incentives; B1, active support; C1, high-quality design) and Q8 (A1, develop incentives; B1, active support; C1, high-quality design), there may be a stable equilibrium point. Therefore, the following numerical simulation is carried out under the condition of meeting the equilibrium points Q7 and Q8.
4.1. Initial Parameter Setting and Change Analysis
4.1.1. Simulation Parameterization of Government Policy Regulation []
Incentive Intensity: Ranging from 0 (indicating no incentive) to 1 (indicating the highest level of incentive). If the incentive policy intensity is set at 0.3, it equates to a financial subsidy of 5 million yuan per project and a 15% reduction in tax incentives; when the intensity is increased to 0.7, the financial subsidy rises to 8 million yuan per project and the tax incentives are reduced by 20%.
Policy Implementation Efficiency: The values range from 0.5 (indicating moderate efficiency) to 1 (indicating efficient implementation). In cities with a policy implementation efficiency of 0.5, the issuance of subsidies is typically delayed by 2–3 months, and the tax preference approval process takes an average of 3–4 months; with an implementation efficiency of 1, subsidy issuance is completed within 1 month, and tax preference approval is completed in 1–2 months.
4.1.2. Simulation Parameterization of Social Capital Participation []
Willingness to Invest: This metric ranges from 0 (indicating no investment intention) to 1 (representing the maximum willingness to invest). With a willingness to invest of 0.3, social capital allocated to low-carbon innovation projects constitutes 10% of the total investment budget. If the willingness to invest increases to 0.7, the investment in such projects rises to 30% of the budget.
Risk Appetite: The range for this is from 0.3 (denoting a low risk appetite) to 0.7 (indicating a high risk appetite). Social capital with a low risk preference will only engage in projects with an expected annualized return of 8–10%. In contrast, capital with a high risk appetite is willing to participate at expected annualized returns of 5–7%.
4.1.3. Simulation Parameterization with the Participation of Design Research Institutes []
Design Quality: This metric ranges from 0.5, indicating a moderate level of design quality, to 1, signifying an exceptional level of design quality. At a design quality score of 0.5, the utilization rate of renewable energy stands at 20%, and the building energy efficiency standard is set at 60%. As design quality improves to 0.8, the utilization rate of renewable energy climbs to 35%, and the building energy efficiency standard increases to 85%.
Innovation Ability: The spectrum for this attribute extends from 0.3, indicating a low level of innovation ability, to 0.7, denoting a high level of innovation ability. Design research institutes with year. Low innovation ability typically publishes 1–2 papers on low-carbon design annually and participates in industry innovation seminars 1–2 times a year. In contrast, those with a high innovation ability publish 4–5 papers and participate in seminars 3–4 times annually.
4.2. Simulation Validation of Subjective Collaborative Innovation
The model is assigned numerical values corresponding to the real situation (the parameter assignment basis is shown in Table 9), and numerical simulation is performed using MATLAB R2023a. Array 1: kP = 50; Ca1 = 350; Ca2 = 100; T = 300; ΔD = 250; Cb1 = 800; Cb2 = 300; e = 100; f = 100; g = 50; ΔR = 150; H1 = 400; H2 = 200 to satisfy the equilibrium point Q7. Then, the influence of Ca1, T, ΔD, Cb1, ΔR, and H1 on the process of the evolutionary game and outcome is analyzed. The parameter values are derived from empirical survey data of low-carbon innovation projects in Xi’an. The temporal resolution is established at one month per time step, corresponding to the approximately two-year implementation cycle of the urban renewal project, resulting in a total of 50 simulation steps. The simulation employs the ode45 solver in MATLAB R2023a. Convergence is defined by the criteria that the changes in variables x, y, and z do not exceed 10−4, and that the average income variation among the three stakeholders remains within 10,000 yuan over five consecutive time steps, thereby ensuring the stability and reliability of the simulation outcomes.
Table 9.
The initial value setting and the basis of the main simulation parameters.
4.2.1. Simulation Validation of Low-Carbon Collaborative Innovation in Government
To analyze the impact of changes in T on the evolutionary game process and outcomes, T is set to 150, 300, and 450, respectively. The simulation results, depicting the dynamic equation system evolving over 50 iterations, are presented in Figure 4a. Initially, government benefits increase and then decrease, peaking at T = 300. Moderate technical support costs can effectively motivate social capital and design research institutes to engage actively in the city’s low-carbon innovation, thereby enhancing overall benefits. However, when T is excessively high (T = 450), it results in resource waste or a diminishing incentive effect, leading to a decline in government benefits.
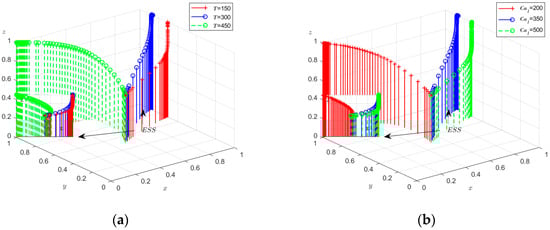
Figure 4.
(a) The impact of government on the benefits obtained from the cost of capital to support low-carbon innovation technologies: Simulation Validation of Low Carbon Co-Innovation with Social Capital; (b) The impact of benefits gained from active government promotion on urban low-carbon innovative development (Appendix A).
The simulation results, which replicated the system of dynamic equations 50 times with Ca1 values of 200, 350, and 500, are presented in Figure 4b. These results indicate that the government’s motivation to foster low-carbon innovation increases. As Ca1 values rise, the government is more inclined to actively promote such initiatives, as they yield more efficient benefits. This, in turn, encourages social capital and research institutes to actively engage in the advancement of low-carbon innovation within the city.
To analyze the impact of changes in ΔD on the evolutionary game process and outcomes, ΔD was set to 100, 250, and 300, respectively. The simulation results, depicting the dynamic equation system evolving for 50 iterations, are presented in Figure 5a. The figure illustrates that the incremental cost of capital for the entire urban low-carbon innovation construction is excessively high, leading to a significant increase in the cost of social capital participating in low-carbon innovation construction. This rise in cost tends to diminish the enthusiasm for participation. Conversely, a lower incremental cost is more conducive to stimulate the enthusiasm of social capital to engage in urban low-carbon innovation and transformation actively.
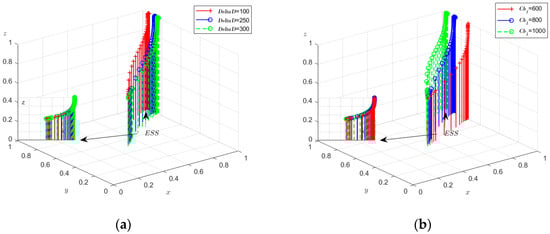
Figure 5.
(a) The impact of capital on the incremental cost of constructing low-carbon innovations throughout the city; (b) The effect of the benefits gained from the active involvement of social capital in the transformation of urban low-carbon innovations (Appendix A).
By assigning Cb1 values of 600, 800, and 1000, respectively, the simulation results of the dynamic system of equations evolving for 50 iterations are shown in Figure 5b. The results indicate that higher levels of social capital actively participating in urban low-carbon innovation and transformation yield more substantial benefits for social capital. This, in turn, encourages a greater willingness to invest in capital and technology, providing robust support for the development of urban low-carbon innovation.
4.2.2. Simulation Validation of Low-Carbon Co-Innovation in Design Research Institutes
To analyze the impact of changes in H1 on the evolutionary game process and outcomes, H1 was set to 300, 400, and 500, respectively. The simulation results, which replicate the dynamic equation system evolving over 50 iterations, are presented in Figure 6a. Here, an increase in the cost of technological inputs for the Institute (H1) following the development of urban low-carbon innovation facilities correlates with a downward trend in the Design Research Institutes’ revenue. When H1 is low, Design Research Institutes can offer high-quality design solutions at a reduced cost, leading to higher revenue. Conversely, when H1 is excessively high, the cost pressure on the Design Research Institutes escalates, causing a decline in their revenue. Moderate costs for technological inputs can effectively motivate Design Research Institutes to provide high-quality design solutions, whereas excessively high costs can stifle their innovative drive.
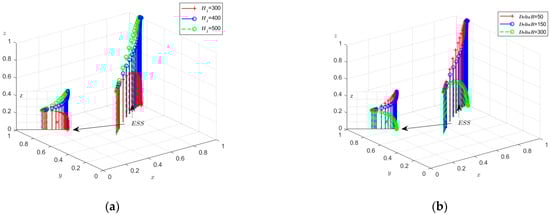
Figure 6.
(a) The impact of technological input costs on the Institute following the development of low-carbon innovation facilities in cities; (b) The impact of revenue generated from the provision of high-quality design by research institutes (Appendix A).
By assigning ΔR the values of 50, 150, and 300, respectively, the simulation results, which replicate the dynamic equation system evolving over 50 iterations, are depicted in Figure 6b. The revenue (ΔR) earned by the Institute for providing high-quality design solutions increases incrementally. As the revenue of the Design Research Institutes continues to rise, they are incentivized to adopt a high-quality design strategy, which in turn leads to higher economic returns.
4.2.3. Array Simulation Evolution
Figure 7a depicts the condition where the equilibrium point is Q7, while Figure 7b corresponds to the equilibrium point being Q8, with the parameters set as follows: kP = 20; Ca1 = 380; Ca2 = 70; T = 270; ΔD = 250; Cb1 = 800; Cb2 = 300; e = 100; f = 100; g = 50; ΔR = 150; H1 = 340; H2 = 200. Both sets of values were iterated 50 times from various initial strategic combinations, and the outcomes are presented in Figure 7.
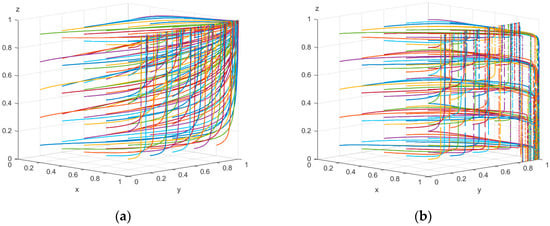
Figure 7.
Results of 50 evolutions of arrays (a,b) (Appendix A).
Based on the simulation results, at the equilibrium point Q7 (A2 no incentives, B1 active support, C1 high-quality design), where government incentives are absent, social capital and design research institutes must adjust their decisions according to their own cost–benefit analyses. The active support from social capital may arise from its potential long-term benefits for low-carbon innovation projects. Even without government incentives, it is willing to take the risk that design and research institutes will provide high-quality designs, establish an industry reputation, and create opportunities for long-term collaboration. Over time, the three-party strategy stabilizes through continuous trial and error, as the interests of all parties gradually become balanced. However, this model, lacking government incentives, may struggle with development momentum and scale limitations, making it challenging to meet the needs of large-scale low-carbon innovative development in cities.
When the equilibrium point is Q8 (A1 setting incentives, B1 active support, C1 high-quality design), the convergence of strategy choices among all parties occurs more rapidly. The government’s incentive policies, financial subsidies, and tax concessions can increase the expected return of social capital by reducing its investment risk and the design costs of design research institutes. Social capital receives more financial support and policy facilitation due to incentive policies and actively makes capital investments; under policy incentives, design research institutes are more motivated to invest resources in innovative design to obtain policy incentives and market recognition. Government incentives play a crucial role in promoting tripartite cooperation and urban low-carbon innovative development and can accelerate resource integration and project promotion.
With incentive policies in place (Q8), the system evolution is more efficient and stable, and all parties can quickly reach a consensus on cooperation. Without incentive policies (Q7), although some results can be achieved, the process is more cumbersome and less efficient. Therefore, the government should enhance the formulation and implementation of incentive policies, refine the policy details, balance the interests of all parties, and fully mobilize the enthusiasm of social capital and design research institutes to achieve efficient and sustainable urban development.
4.3. Comparative Verification of International Experience
At the policy insight level, it is necessary to further anchor the practical adaptability within China’s differentiated institutional environment. Underdeveloped cities commonly face issues such as limited fiscal capacity, weak willingness of market participants to engage, and long project return cycles. Local governments find it difficult to bear the high upfront subsidy responsibilities typical of traditional PPP projects. In some regions, there are also problems with poor coordination in policy implementation and imperfect regulatory mechanisms. Simply replicating the “high subsidy + high return” PPP model from developed areas is prone to resulting in “policy paralysis.” It is advisable to leverage the linkage mechanism between central government fiscal transfer payments and local government special bonds, tying subsidies to project carbon reduction outcomes and operational efficiency. This approach can alleviate local fiscal pressure while ensuring project sustainability. Additionally, clearly defining the responsibilities and boundaries of all parties and establishing a cross-departmental collaborative advancement mechanism can help avoid administrative barriers that hinder the implementation of cost-sharing solutions.
From an international comparative perspective, the simulation results of this study exhibit both similarities and unique characteristics when compared to international advanced practices. These can be examined in three aspects:
Firstly, regarding the policy incentive model, this study identifies that government incentive policies can significantly expedite system convergence. The evolution efficiency at the incentive equilibrium point is approximately 40% higher than that of non-incentive scenarios, aligning with the operational logic of mainstream international low-carbon special funds. Such funds typically offer investment subsidies of 20% to 30% for low-carbon projects, which can boost social capital participation by over 65%. When China’s incentive intensity increases from 0.3 to 0.7, the proportion of social capital investment rises from 10% to 30%, achieving parity with international levels, though there remains a gap in absolute terms. The core reason for this is that China’s low-carbon project investment return cycle (5–8 years) exceeds the international average (3–5 years). Moving forward, it will be necessary to optimize the subsidy period and exit mechanism.
Secondly, in terms of subject coordination efficiency, the critical conditions for stable cooperation among the three parties in this study are closely tied to the mature international public–private cooperation and technical support model of professional institutions. By clarifying the division of powers and responsibilities, some international cities can increase the efficiency of social capital investment by 25%, and the adoption rate of innovative schemes by design institutions is 70%. In China’s simulation, the high-quality design probability of design research institutes needs to exceed 0.5 to maintain system stability, indicating that the innovation capacity of local design institutions still requires strengthening. We can draw from international practices that link technical benefits with preferential policies to associate the low-carbon benefits of design schemes with tax reductions and exemptions.
Lastly, concerning technology cost control, this study demonstrates that for every 10% reduction in low-carbon incremental costs, the probability of social capital participation increases by 8%, which is highly consistent with the practical effect of the international multi-party sharing technology cost’ mechanism. Some countries can reduce the cost of low-carbon technologies, such as photovoltaic building integration, by 40% within 5 years by sharing the cost of R&D through government, enterprises, and scientific research institutions. Currently, the initial value of low-carbon incremental cost in China is higher than the average level of similar projects worldwide. It is necessary to adopt this kind of technical research cooperation model, promote the joint development of technology research and development between design and research institutes and social capital, and shorten the cycle of achievement transformation.
Additionally, some international cities incorporate residents’ demands into the game model and increase residents’ participation through the ‘low-carbon contribution and community service exchange’ mechanism, which can enhance the success rate of projects by 35%. This suggests that the current model in our country can be further improved at the social level and also provides a direction for the subsequent expansion of the subject dimension.
5. Conclusions
Based on the practical context of global climate governance and China’s “dual-carbon” goal, this study examines the balance of interests among the three main parties—government, social capital, and design research institutes—as its starting point. It reveals the interaction mechanism between the main body’s strategy and the systematic evolution law in constructing a low-carbon innovative society, utilizing social network analysis, evolutionary game modeling, and numerical simulation. Unlike traditional studies that concentrate on a single policy tool or technical path, this study innovatively integrates the conflict of interests among multiple subjects into a unified analytical framework. It emphasizes the synergistic evolutionary logic of “institutional design—technological innovation—market participation,” which is crucial for addressing the issue of “insufficient incentives—high risk” in urban renewal. This approach offers a new perspective for tackling the problem of “insufficient incentives, high risk, and inefficient transformation” in urban renewal. The internationalization and expansion of this approach necessitate that all countries deepen their cooperation based on mutual respect for differences, and jointly build a new paradigm of inclusive, efficient, and sustainable low-carbon innovation governance for global cities. The specific findings of the study are as follows:
- Systemic catalytic effect of government incentive policies:
By lowering the threshold for social capital participation, such as through financial subsidies and tax incentives, and by designing innovation costs for research institutes, including support for technology transformation, the government can significantly accelerate the convergence of the system to a stable equilibrium. The synergy between the efficiency of policy implementation and the spillover effect of technology serves as the key driving factor. This implies that the design of precise policy tools should consider both “strength” and “efficiency”—the former activates the willingness of the leading actors to participate, while the latter ensures that policy dividends will be realized quickly to avoid the decay of incentives due to the lag in implementation.
- 2.
- Strategic interaction and the positive feedback mechanism of multiple subjects:
When the incentive strength surpasses the critical value, social capital participation and design quality enter a virtuous cycle. In other words, high-quality design boosts the project’s low-carbon value, drawing in additional social capital investments. Furthermore, the active engagement of capital offers financial backing for technological innovation. Conversely, without incentives, entities depend on a long-term cost–benefit game, which can easily lead to a “low participation-low innovation” lock-in state. This implies that policymaking should concentrate on the “threshold effect,” dismantling initial cooperation barriers through progressive, high-intensity incentives, and fostering the synergistic inertia of market participants.
- 3.
- Differentiation and Internationalization of Mechanism Design:
Regional disparities in China’s low-carbon city pilot projects suggest that more developed areas can utilize market-based mechanisms, such as carbon trading and Environmental, Social, and Governance (ESG) investments, to drive technology spillover effects. Conversely, less developed regions require enhanced initial risk guarantees, including financial assurances and special funds, to reduce the barriers to capital investment. Internationally, the “dynamic incentives—risk sharing—mutual recognition of standards” model offers a replicable approach for developing nations. By recognizing cross-border technology standards and establishing a global platform for capital and technology integration, the model can effectively address the “technology-system” disconnect. This approach can transform the low-carbon transition from isolated “pilot exploration” to a phase of “large-scale synergy.”
This study has made incremental discoveries in the theoretical construction and empirical analysis of the mechanism for balancing the interests of multiple stakeholders. Future research will concentrate on enhancing the sensitivity analysis dimension. Building upon the current one-dimensional analysis of a single parameter, a two-dimensional sensitivity analysis map will be further developed and simulated. Specifically, it will focus on the combination of two sets of core parameters, exploring the interaction between government incentive intensity and social capital risk preference. Through simulation, it will mimic the marginal effect of incentive intensity adjustment on the probability of social capital participation under various risk preference conditions and clarify the quantitative boundary for differentiated policy formulation.
On the other hand, the coupling relationship between the innovation income and the technology input cost of the design research institutes will be analyzed. The heat map generated by the simulation results will visually present the standard influence interval of the different combinations of the two on the design quality probability. The aim is to accurately identify the optimal parameter threshold that can simultaneously enhance the enthusiasm of the design organization and the project benefit, thereby increasing the robustness of the research conclusions and providing a more accurate reference for parameter setting and policy adjustment in urban low-carbon innovation practice.
Author Contributions
Y.Z.: Conceptualization, Methodology, Writing—Review & Editing; Z.L.: Formal analysis, Investigation, Writing—Original Draft; W.Z.: Supervision, Project administration, Resources. All authors have read and agreed to the published version of the manuscript.
Funding
This work is supported by The NSFC (51808424); Yinchuan City Science and Technology Plan Project (2023SFZD06); National Social Science Fund Western Project (25XGL044); Ningxia Key R&D Program Project (2025BEE02011); The Ministry of education of Humanities and Social Science project (23YJCZH309); Social Science Foundation Project of Shaanxi Province (2024R008); Xi’an Jianda Institute of Urban Planning & Design Co., Ltd. (Program NO.X20240057); Ningxia Autonomous Region Key Research and Development Project (2023BEG03056).
Institutional Review Board Statement
Ethical review and approval were waived for this study by Xi’an University of Architecture and Technology due to this is a low-risk, non-invasive research, the participants do not include vulnerable groups, and the collected information cannot identify specific individuals.
Informed Consent Statement
Informed consent was obtained from all subjects involved in the study.
Data Availability Statement
The original contributions presented in this study are included in the article. Further inquiries can be directed to the corresponding author.
Acknowledgments
We are grateful to Xi’an University of Architecture and Technology (XAUAT) for providing a research platform and learning channel for the paper writing. At the same time, we thank the respondents for taking the time to participate in the questionnaire survey. Moreover, we would like to express our sincere gratitude to the editors and Editors-in-Chief of Sustainability for taking the time to guide the writing and revision of this paper, and to Sustainability for providing us with a platform for scientific research.
Conflicts of Interest
Author Wei Zhang was employed by the company Xi’an University of Architecture and Technology Design and Research Institute Co. The remaining authors declare that the research was conducted in the absence of any commercial or financial relationships that could be con-strued as a potential conflict of interest. The authors declare that this study received funding from The NSFC (51808424); Yinchuan City Science and Technology Plan Project (2023SFZD06); National Social Science Fund Western Project (25XGL044); Ningxia Key R&D Program Project (2025BEE02011); The Ministry of education of Humanities and Social Science project (23YJCZH309); Social Science Foundation Project of Shaanxi Province (2024R008); XI’AN JIANDA INSTITUTE OF URBAN PLANNING & DESIGN CO., LTD (Program NO.X20240057), Ningxia Autonomous Region Key Research and Development Project (2023BEG03056). The funder was not involved in the study design, collection, analysis, interpretation of data, the writing of this article, or the decision to submit it for publication.
Appendix A
Appendix A.1. Figure 4, Figure 5 and Figure 6 Partial MATLAB Code
| clc,clear; figure(5); %Ca1=200 kP=50;Ca1=200;Ca2=100;T=300;DeltaD=250;Cb1=800;Cb2=300;e=100;f=100;g=50;DeltaR=150;H1=400;H2=200; [t,y]=ode45(@(t,y) ditan(t,y,kP,Ca1,Ca2,T,DeltaD,Cb1,Cb2,e,f,g,DeltaR,H1,H2) ,[0 50],[0.5 0.5 0.5]); %plot3(y(:,1),y(:,2),y(:,3),‘r+’,‘linewidth’,1); stem3(y(:,1),y(:,2),y(:,3),‘r+’,‘linewidth’,1); hold on; %Ca1=350 kP=50;Ca1=350;Ca2=100;T=300;DeltaD=250;Cb1=800;Cb2=300;e=100;f=100;g=50;DeltaR=150;H1=400;H2=200; [t,y]=ode45(@(t,y) ditan(t,y,kP,Ca1,Ca2,T,DeltaD,Cb1,Cb2,e,f,g,DeltaR,H1,H2),[0 50],[0.5 0.5 0.5]); %plot3(y(:,1),y(:,2),y(:,3),‘b-’,‘linewidth’,1); stem3(y(:,1),y(:,2),y(:,3),‘b-’,‘linewidth’,1); hold on; %Ca1=500 kP=50;Ca1=500;Ca2=100;T=300;DeltaD=250;Cb1=800;Cb2=300;e=100;f=100;g=50;DeltaR=150;H1=400;H2=200; [t,y]=ode45(@(t,y) ditan(t,y,kP,Ca1,Ca2,T,DeltaD,Cb1,Cb2,e,f,g,DeltaR,H1,H2),[0 50],[0.5 0.5 0.5]); %plot3(y(:,1),y(:,2),y(:,3),‘g--’,‘linewidth’,1); stem3(y(:,1),y(:,2),y(:,3),‘g--’,‘linewidth’,1); hold on; set(gca,‘XTick’,[0:0.2:1],‘YTick’,[0:0.2:1],‘ZTick’,[0:0.2:1]) axis([0 1 0 1 0 1]) xlabel(‘$x$’,‘interpreter’,‘latex’);ylabel(‘$y$’,‘interpreter’,‘latex’);zlabel(‘$z$’,‘interpreter’,‘latex’,‘Rotation’,360,‘position’,[-0.1 1 1.1]); grid on hold on set(0,‘defaultfigurecolor’,‘w’) legend({‘{\it\fontname{Bodoni MT}Ca_{1}}=200’,‘{\it\fontname{Bodoni MT}Ca_{1}}=350’,‘{\it\fontname{Bodoni MT}Ca_{1}}=500’},‘location’,‘northeast’); title(‘’,‘FontWeight’,‘bold’,‘position’,[0 0 -0.2]); text(0.4 ,0.2 ,0.3,‘$ESS$’,‘interpreter’,‘latex’); annotation(‘arrow’,[0.55 0.35],[0.35 0.32]); annotation(‘arrow’,[0.58 0.58],[0.38 0.45]); % the small figure axes(‘position’,[0.13 0.32 0.2 0.2]); kP=50;Ca1=200;Ca2=100;T=300;DeltaD=250;Cb1=800;Cb2=300;e=100;f=100;g=50;DeltaR=150;H1=400;H2=200; [t,y]=ode45(@(t,y) ditan(t,y,kP,Ca1,Ca2,T,DeltaD,Cb1,Cb2,e,f,g,DeltaR,H1,H2),[0 50],[0.5 0.5 0.5]); %plot3(y(:,1),y(:,2),y(:,3),‘r+’,‘linewidth’,1); stem3(y(:,1),y(:,2),y(:,3),‘r+’,‘linewidth’,1); hold on kP=50;Ca1=350;Ca2=100;T=300;DeltaD=250;Cb1=800;Cb2=300;e=100;f=100;g=50;DeltaR=150;H1=400;H2=200; [t,y]=ode45(@(t,y) ditan(t,y,kP,Ca1,Ca2,T,DeltaD,Cb1,Cb2,e,f,g,DeltaR,H1,H2),[0 50],[0.5 0.5 0.5]); %plot3(y(:,1),y(:,2),y(:,3),‘b-’,‘linewidth’,1); stem3(y(:,1),y(:,2),y(:,3),‘b-’,‘linewidth’,1); hold on kP=50;Ca1=500;Ca2=100;T=300;DeltaD=250;Cb1=800;Cb2=300;e=100;f=100;g=50;DeltaR=150;H1=400;H2=200; [t,y]=ode45(@(t,y) ditan(t,y,kP,Ca1,Ca2,T,DeltaD,Cb1,Cb2,e,f,g,DeltaR,H1,H2),[0 50],[0.5 0.5 0.5]); %plot3(y(:,1),y(:,2),y(:,3),‘g--’,‘linewidth’,1); stem3(y(:,1),y(:,2),y(:,3),‘g--’,‘linewidth’,1); hold on set(gca,‘XTick’,[0:0.2:1],‘YTick’,[0:0.2:1],‘ZTick’,[0:0.2:1]) axis([0 1 0 1 0 1]) set(gca,‘XTickLabel’,‘’,‘YTickLabel’,‘’,‘ZTickLabel’,‘’) grid on hold on set(0,‘defaultfigurecolor’,‘w’) view([0 0]); xlabel(‘x’,‘position’,[0.8 1 0.3]) zlabel(‘z’,‘position’,[0.1 1 0.8],‘Rotation’,360) |
Appendix A.2. Figure 7 Partial MATLAB Code
| clc,clear; figure(11); kP=20,Ca1=380,Ca2=70,T=270,DeltaD=250,Cb1=800,Cb2=300,e=100,f=100,g=50,DeltR=150,H1=340,H2=200; for i=0.1:0.2:1 for j=0.1:0.2:1 for k=0.1:0.2:1 [t,y]=ode45(@(t,y) ditan(t,y,kP,Ca1,Ca2,T,DeltaD,Cb1,Cb2,e,f,g,DeltR,H1,H2),[0 50],[i j k]); %plot3(y(:,1),y(:,2),y(:,3),‘linewidth’,1); plot3(y(:,1),y(:,2),y(:,3),‘rp’,‘linewidth’,1); set(gca,‘XTick’,[0:0.2:1],‘YTick’,[0:0.2:1],‘ZTick’,[0:0.2:1]) hold on axis([0 1 0 1 0 1]) view([45 10]) end end end grid on hold on xlabel(‘x’,‘Rotation’,0); ylabel(‘y’,‘Rotation’,0); zlabel(‘z’,‘Rotation’,360,‘position’,[0 0 1.05]); title(‘’,‘FontWeight’,‘bold’,‘position’,[1 0 -0.13]); clc,clear; figure(12); Rp=150,Cph=105,Cpl=0,Cp=10,Bt=50,Fp=25,Mp=15,Ct=10,Ft=18,Mt=12,Cg=15,Tg=40; for i=0.1:0.2:1 for j=0.1:0.2:1 for k=0.1:0.2:1 [t,y]=ode45(@(t,y) ditan(t,y,Rp,Cph,Cpl,Cp,Bt,Fp,Mp,Ct,Ft,Mt,Cg,Tg),[0 50],[i j k]); plot3(y(:,1),y(:,2),y(:,3),‘linewidth’,1); set(gca,‘XTick’,[0:0.2:1],‘YTick’,[0:0.2:1],‘ZTick’,[0:0.2:1]) hold on axis([0 1 0 1 0 1]) view([45 10]) end end end grid on hold on xlabel(‘x’,‘Rotation’,0); ylabel(‘y’,‘Rotation’,0); zlabel(‘z’,‘Rotation’,360,‘position’,[0 0 1.05]); title(‘’,‘FontWeight’,‘bold’,‘position’,[1 0 -0.13]); |
References
- Malhotra, A.; Schmidt, T.S. Accelerating low-carbon innovation. Joule 2020, 4, 2259–2267. [Google Scholar] [CrossRef]
- Geels, F.W.; Schwanen, T.; Sorrell, S.; Jenkins, K.; Sovacool, B.K. Reducing energy demand through low carbon innovation: A socio-technical transitions perspective and thirteen research debates. Energy Res. Soc. Sci. 2018, 40, 23–35. [Google Scholar] [CrossRef]
- Pan, A.; Zhang, W.; Shi, X.; Dai, L. Climate policy and low-carbon innovation: Evidence from low-carbon city pilots in China. Energy Econ. 2022, 112, 106129. [Google Scholar] [CrossRef]
- Pan, A.; Zhang, W.; Xie, Q.; Dai, L.; Zhang, Y. Do carbon emissions accelerate low-carbon innovation? Evidence from 285 Chinese prefecture-level cities. Environ. Sci. Pollut. Res. 2021, 28, 50510–50524. [Google Scholar] [CrossRef]
- Horne, R.; Moloney, S. Urban low carbon transitions: Institution-building and prospects for interventions in social practice. Eur. Plan. Stud. 2019, 27, 336–354. [Google Scholar] [CrossRef]
- Shahani, F.; Pineda-Pinto, M.; Frantzeskaki, N. Transformative low-carbon urban innovations: Operationalizing transformative capacity for urban planning. Ambio 2022, 51, 1179–1198. [Google Scholar] [CrossRef]
- Tyfield, D.; Ely, A.; Geall, S. Low carbon innovation in China: From overlooked opportunities and challenges to transitions in power relations and practices. Sustain. Dev. 2015, 23, 206–216. [Google Scholar] [CrossRef]
- Auld, G.; Mallett, A.; Burlica, B.; Nolan-Poupart, F.; Slater, R. Evaluating the effects of policy innovations: Lessons from a systematic review of policies promoting low-carbon technology. Glob. Environ. Change 2014, 29, 444–458. [Google Scholar] [CrossRef]
- Evro, S.; Oni, B.A.; Tomomewo, O.S. Global strategies for a low-carbon future: Lessons from the US, China, and EU’s pursuit of carbon neutrality. J. Clean. Prod. 2024, 461, 142635. [Google Scholar] [CrossRef]
- Yin, H.; Zhao, J.; Xi, X.; Zhang, Y. Evolution of regional low-carbon innovation systems with sustainable development: An empirical study with big-data. J. Clean. Prod. 2019, 209, 1545–1563. [Google Scholar] [CrossRef]
- Briera, T.; Lefèvre, J. Reducing the cost of capital through international climate finance to accelerate the renewable energy transition in developing countries. Energy Policy 2024, 188, 114104. [Google Scholar] [CrossRef]
- Polzin, F. Mobilizing private finance for low-carbon innovation–A systematic review of barriers and solutions. Renew. Sustain. Energy Rev. 2017, 77, 525–535. [Google Scholar] [CrossRef]
- Qi, S.-Z.; Zhou, C.-B.; Li, K.; Tang, S.-Y. Influence of a pilot carbon trading policy on enterprises’ low-carbon innovation in China. Clim. Policy 2021, 21, 318–336. [Google Scholar] [CrossRef]
- Xi, B.; Jia, W. Research on the impact of carbon trading on enterprises’ green technology innovation. Energy Policy 2025, 197, 114436. [Google Scholar] [CrossRef]
- Bellora, C.; Fontagné, L. EU in search of a Carbon Border Adjustment Mechanism. Energy Econ. 2023, 123, 106673. [Google Scholar] [CrossRef]
- Chang, J. Implementation of the EU carbon border adjustment mechanism and China’s policy and legal responses. Environ. Impact Assess. Rev. 2025, 110, 107683. [Google Scholar] [CrossRef]
- Yang, H.; Zhang, X.; Liu, B.; Huang, Y. Evaluation of green low-carbon innovation development efficiency: An improved two-stage non-cooperative DEA model. J. Clean. Prod. 2023, 400, 136662. [Google Scholar] [CrossRef]
- Chen, X.; Li, Z.; Gallagher, K.P.; Mauzerall, D.L. Financing carbon lock-in in developing countries: Bilateral financing for power generation technologies from China, Japan, and the United States. Appl. Energy 2021, 300, 117318. [Google Scholar] [CrossRef]
- Wang, W.; Li, D.; Zhou, S.; Wang, Y.; Yu, L. Exploring the key influencing factors of low-carbon innovation from urban characteristics in China using interpretable machine learning. Environ. Impact Assess. Rev. 2024, 107, 107573. [Google Scholar] [CrossRef]
- Zhao, C.; Dong, K.; Wang, K.; Taghizadeh-Hesary, F. How can Chinese cities escape from carbon lock-in? The role of low-carbon city policy. Urban Clim. 2023, 51, 101629. [Google Scholar] [CrossRef]
- Fan, R.; Qi, Y.; Wang, Y.; Chen, R. Identifying Critical Risks in Low-Carbon Innovation Network Ecosystem: Interdependent Structure and Propagation Dynamics. Systems 2025, 13, 599. [Google Scholar] [CrossRef]
- Wang, T.; Song, Z.; Zhou, J.; Sun, H.; Liu, F. Low-carbon transition and green innovation: Evidence from pilot cities in China. Sustainability 2022, 14, 7264. [Google Scholar] [CrossRef]
- Yuan, X.-M.; Zheng, C.-C. Evolutionary game and simulation analysis of low-carbon technology innovation with multi-agent participation. IEEE Access 2022, 10, 11284–11295. [Google Scholar] [CrossRef]
- Nie, G.-Q.; Zhu, Y.-F.; Wu, W.-P.; Xie, W.-H.; Wu, K.-X. Impact of voluntary environmental regulation on green technological innovation: Evidence from Chinese manufacturing enterprises. Front. Energy Res. 2022, 10, 889037. [Google Scholar] [CrossRef]
- Liu, D.; Feng, M.; Liu, Y.; Wang, L.; Hu, J.; Wang, G.; Zhang, J. A tripartite evolutionary game study of low-carbon innovation system from the perspective of dynamic subsidies and taxes. J. Environ. Manag. 2024, 356, 120651. [Google Scholar] [CrossRef]
- Liu, K.; Huang, T.; Xia, Z.; Xia, X.; Wu, R. The impact assessment of low-carbon city pilot policy on urban green innovation: A batch-time heterogeneity perspective. Appl. Energy 2025, 377, 124489. [Google Scholar] [CrossRef]
- Chen, C.; Lin, Y.; Lv, N.; Zhang, W.; Sun, Y. Can government low-carbon regulation stimulate urban green innovation? Quasi-experimental evidence from China’s low-carbon city pilot policy. Appl. Econ. 2022, 54, 6559–6579. [Google Scholar] [CrossRef]
- Ci, F.; Wang, Z.; Hu, Q. Spatial pattern characteristics and optimization policies of low-carbon innovation levels in the urban agglomerations in the Yellow River Basin. J. Clean. Prod. 2024, 439, 140856. [Google Scholar] [CrossRef]
- Jiang, N.; Jiang, W.; Chen, H. Innovative urban design for low-carbon sustainable development: Evidence from China’s innovative city pilots. Sustain. Dev. 2023, 31, 698–715. [Google Scholar] [CrossRef]
- Xiao, D.; Fan, J.; Wang, W.; Wang, J.; Hou, L. Innovation city and low-carbon future: A quasinatural experiment from China. Environ. Sci. Pollut. Res. 2023, 30, 98004–98019. [Google Scholar] [CrossRef]
- Zou, C.; Huang, Y.; Wu, S.; Hu, S. Does “low-carbon city” accelerate urban innovation? Evidence from China. Sustain. Cities Soc. 2022, 83, 103954. [Google Scholar] [CrossRef]
- Chen, M. A study of low-carbon development, urban innovation and industrial structure upgrading in China. Int. J. Low-Carbon Technol. 2022, 17, 185–195. [Google Scholar] [CrossRef]
- Zhang, J.; Chu, Z.; Sun, Z. Impact of low-carbon city pilot policies on urban green innovation from the perspective of spatial and temporal heterogeneity. Environ. Sci. Pollut. Res. 2023, 30, 114358–114374. [Google Scholar] [CrossRef]
- Chen, W. Digital economy development, corporate social responsibility and low-carbon innovation. Corp. Soc. Responsib. Environ. Manag. 2023, 30, 1664–1679. [Google Scholar] [CrossRef]
- Hu, Z.; Li, S. Innovation-driven policy and low-carbon technology innovation: Research driven by the impetus of national innovative city pilot policy in China. Sustainability 2023, 15, 8723. [Google Scholar] [CrossRef]
- Hu, S.; Wang, M.; Wu, M.; Wang, A. Voluntary environmental regulations, greenwashing and green innovation: Empirical study of China’s ISO14001 certification. Environ. Impact Assess. Rev. 2023, 102, 107224. [Google Scholar] [CrossRef]
- Tian, Y.; Song, W.; Liu, M. Assessment of how environmental policy affects urban innovation: Evidence from China’s low-carbon pilot cities program. Econ. Anal. Policy 2021, 71, 41–56. [Google Scholar] [CrossRef]
- Wang, A.; Si, L.; Hu, S. Can the penalty mechanism of mandatory environmental regulations promote green innovation? Evidence from China’s enterprise data. Energy Econ. 2023, 125, 106856. [Google Scholar] [CrossRef]
- Pan, Q.; Zhao, S. The impact of low-carbon city pilot policy on urban green technology innovation: Based on government and public perspectives. PLoS ONE 2024, 19, e0306425. [Google Scholar] [CrossRef]
- Yao, Y.; Shen, X. Environmental protection and economic efficiency of low-carbon pilot cities in China. Environ. Dev. Sustain. 2021, 23, 18143–18166. [Google Scholar] [CrossRef]
- Wilson, C. Disruptive low-carbon innovations. Energy Res. Soc. Sci. 2018, 37, 216–223. [Google Scholar] [CrossRef]
- Jia, C.; Zhang, R.; Wang, D. Evolutionary game analysis of low-carbon technology innovation diffusion under PPP mode in China. PLoS ONE 2022, 17, e0279493. [Google Scholar] [CrossRef] [PubMed]
- Wang, S.; Liu, C.; Zhou, Z. Government-enterprise green collaborative governance and urban carbon emission reduction: Empirical evidence from green PPP programs. Environ. Res. 2024, 257, 119335. [Google Scholar] [CrossRef]
- Zhang, R.-J.; Tai, H.-W.; Cao, Z.-X.; Cheng, K.-T.; Wei, C.-C. Innovation ecosystem based on low-carbon technology: Value co-creation mechanism and differential game analysis. Technol. Forecast. Soc. Change 2025, 210, 123852. [Google Scholar] [CrossRef]
- Zhou, Z.; Li, M.; Chi, X.; Khan, A.U. Game Analysis of Green Technology Innovation Ecosystem Evolution at Carbon Peaking. Sustainability 2025, 17, 2728. [Google Scholar] [CrossRef]
- Cheng, Z.; Wang, L.; Zhang, Y. Does smart city policy promote urban green and low-carbon development? J. Clean. Prod. 2022, 379, 134780. [Google Scholar] [CrossRef]
- Fu, D.; Zhang, L. How can low-carbon help high-quality urban development?—Empirical evidence from low-carbon city pilot policies. PLoS ONE 2024, 19, e0302683. [Google Scholar] [CrossRef]
- Tie, M.; Qin, M.; Song, Q.; Qi, Y. Why does the behavior of local government leaders in low-carbon city pilots influence policy innovation? Resour. Conserv. Recycl. 2020, 152, 104483. [Google Scholar] [CrossRef]
- Lin, B.; Ma, R. How does digital finance influence green technology innovation in China? Evidence from the financing constraints perspective. J. Environ. Manag. 2022, 320, 115833. [Google Scholar] [CrossRef] [PubMed]
- Wang, S.; Liu, J.; Qin, X. Financing constraints, carbon emissions and high-quality urban development—Empirical evidence from 290 Cities in China. Int. J. Environ. Res. Public Health 2022, 19, 2386. [Google Scholar] [CrossRef] [PubMed]
- Zhan, C.; de Jong, M. Financing eco cities and low carbon cities: The case of Shenzhen International Low Carbon City. J. Clean. Prod. 2018, 180, 116–125. [Google Scholar] [CrossRef]
- Sun, Y.; Chen, M.; Yang, J.; Ying, L.; Niu, Y. Understanding technological input and low-carbon innovation from multiple perspectives: Focusing on sustainable building energy in China. Sustain. Energy Technol. Assess. 2022, 53, 102474. [Google Scholar] [CrossRef]
- Xu, N.; Zhang, H.; Li, T.; Ling, X.; Shen, Q. How big data affect urban low-carbon transformation—A quasi-natural experiment from China. Int. J. Environ. Res. Public Health 2022, 19, 16351. [Google Scholar] [CrossRef] [PubMed]
- Chen, L.; Bai, X.; Chen, B.; Wang, J. Incentives for green and low-carbon technological innovation of enterprises under environmental regulation: From the perspective of evolutionary game. Front. Energy Res. 2022, 9, 793667. [Google Scholar] [CrossRef]
- Xing, Z.; Huang, J.; Wang, J. Unleashing the potential: Exploring the nexus between low-carbon digital economy and regional economic-social development in China. J. Clean. Prod. 2023, 413, 137552. [Google Scholar] [CrossRef]
- Zhou, K.; Ren, T. Low-carbon technology collaborative innovation in industrial cluster with social exclusion: An evolutionary game theory perspective. Chaos Interdiscip. J. Nonlinear Sci. 2021, 31, 033124. [Google Scholar] [CrossRef]
- Li, X.; Liu, T.; Zhang, H.; Dong, J. The Influence of Community Involvement Intention to Stakeholder Perception for Threats of Hazardous Chemicals. Manag. Rev. 2020, 32, 298–308. [Google Scholar]
- Lu, X. Research on the Construction of Low Carbon Innovative Society from the Perspective of Urban Renewal: Taking Beijing as an Example. Ecol. Econ. 2024, 40, 63–69. [Google Scholar]
- Qu, X. Optimizing the Path of Villagers’ Self-Governance in Practicing Whole-process People’s Optimizing the Path of Villagers’ Self-Governance in Practicing Whole-process. People’s Acad. J. Zhongzhou 2025, 3, 83–90. [Google Scholar]
- Chao, H.; Liu, L.; Xiao, J. A Study on the Adaptability of the ″Government Guided and Market Led″ Urban Renewal Model: Two-levels Analysis of Redeveloping Shenzhen. Urban Dev. Stud. 2024, 31, 39–47. [Google Scholar]
- Li, N.; Song, Z. Practical Dilemma and Countermeasures of Green City Renewal from the Perspective of Spatial Justice. Local Gov. Res. 2022, 4, 37–50+78. [Google Scholar]
- Wang, C.; Zhang, J.; Jiang, J. Conservation and Renewal of Historical and Cultural Neighborhoods under the Perspective of Micro-Renewal: Urban Design of Pingjiang Historical and Cultural Neighborhood in Suzhou. Urban Plan. Forum 2017, 6, 96–104. [Google Scholar]
- Huang, Z.; Han, D.; Yi, C.; Bi, T.; Fan, Z. Research on the Governance Model of Urban Renewal from the Perspective of Social Network. Urban Dev. Stud. 2022, 29, 15–25. [Google Scholar]
- Yang, X.; Mao, Q.; Gao, W.; Song, C. Thoughts on the third-party professional forces to assist public participation in urban renewal: Taking Hubei renewal as an example. City Plan. Rev. 2019, 43, 78–84. [Google Scholar]
- Zhu, L.L.; Rong, J.M.; Zhang, S.Y. Tripartite evolutionary game and simulation analysis of drug safety and quality supervision under government reward and punishment mechanism. Chin. J. Manag. Sci. 2021, 29, 55–67. [Google Scholar] [CrossRef]
- National Development and Reform Commission (NDRC) of the People’s Republic of China. Notice on Issuing the Special Management Measures for Central Budgetary Investment in Energy Conservation and Carbon Reduction (Fa Gai Huan Zi Gui [2024] No. 338). Available online: https://zfxxgk.ndrc.gov.cn/web/iteminfo.jsp?id=20368 (accessed on 21 March 2025).
- Communist Party of China (CPC) Central Committee; State Council of the People’s Republic of China. Opinions on Accelerating the Comprehensive Green Transition of Economic and Social Development. Available online: https://www.gov.cn/zhengce/202408/content_6967663.htm (accessed on 21 March 2025).
- GB 55015-2021; General Code for Energy Efficiency and Renewable Energy Application in Buildings. China Architecture & Building Press: Beijing, China, 2021.
- Chinese Academy of Social Sciences. Report on the Influence of China’s Urban Brands; Chinese Academy of Social Sciences: Beijing, China, 2023; Available online: https://www.cssn.cn/jjx/jjs_xszx/202312/t20231228_5723273.shtml (accessed on 21 March 2025).
- GB 55026-2022; Code for Urban Water Supply Project. China Architecture & Building Press: Beijing, China, 2022.
Disclaimer/Publisher’s Note: The statements, opinions and data contained in all publications are solely those of the individual author(s) and contributor(s) and not of MDPI and/or the editor(s). MDPI and/or the editor(s) disclaim responsibility for any injury to people or property resulting from any ideas, methods, instructions or products referred to in the content. |
© 2025 by the authors. Licensee MDPI, Basel, Switzerland. This article is an open access article distributed under the terms and conditions of the Creative Commons Attribution (CC BY) license (https://creativecommons.org/licenses/by/4.0/).