Abstract
This study takes Sichuan’s major economic zones as a case to explore the evolution of ecological environment development. By improving the traditional ecological footprint model based on the concept of “provincial hectare,” we analyzed the characteristics of ecological utilization and ecological security status in Sichuan’s economic zones from 2013 to 2022. A comprehensive evaluation was conducted through factor analysis driven by geographical detectors. The results indicate that (1) from 2013 to 2022, Sichuan Province generally exhibited a “supply falling short of demand” situation, with a slight decrease in per capita ecological carrying capacity and a significant decreasing trend in GDP ecological footprint. The industrial structure of the Panxi and Chengdu Plain economic zones was relatively reasonable, with a notable improvement in resource utilization efficiency, while the Northeastern Sichuan Economic Zone lagged behind. (2) The ecological security focus was distributed in the southeastern region, showing an overall “northeast–southwest” distribution pattern. The ecological restoration in the Southern and Northwestern Sichuan Economic Zones needs to be strengthened. (3) The output value of the secondary industry, R&D expenditure, and urban construction land were the main factors influencing ecological footprint changes. The average urban temperature interacted with other factors, showing a significant effect.
1. Introduction
The rapid development of the economy and society is inseparable from the cost placed on the ecological environment. The path of pollution first and then treatment has brought serious natural disasters to human society. The huge population pressure and resource consumption brought about by the urbanization process have aggravated the deterioration of the urban ecological environment [1,2,3]. Urban expansion leads to problems such as land strain, water scarcity, and ecosystem degradation, which pose a threat to the quality of life and health of urban residents [4,5,6]. In assessing ecosystem services, the need to consider the integration of ecological and social factors should be emphasized, and there is an urgent need for integrated monitoring methods [7,8,9]. Therefore, a tool is needed to continuously monitor the changes in the ecological footprint, quantify the impact of human activities on the ecological environment, and demonstrate the balance between the supply and demand of ecological resources [10]. The ecological footprint method proposed by William Rees, W.E. (1992), as a comprehensive environmental assessment tool, reflects the balance between supply and demand of ecological resources by quantifying the impact of human activities on the ecological environment [11]. By monitoring the change trend of ecological footprint, environmental problems can be promptly detected, and this provides a scientific basis for formulating sustainable development strategies [12,13,14].
As the officially designated national strategic hinterland for 2024 by the central government, Sichuan Province in the southwest, with its large population and abundant resources, holds significant research value in terms of ecological security [15,16]. According to the latest information from the Emergency Management Department of Sichuan Province in 2023, floods and geological disasters are the main factors causing direct economic losses. The drought disasters concentrated in the northeastern, southern, and western economic zones of Sichuan Province have the longest-lasting impact on Sichuan Province. In regions where natural disasters occur relatively frequently, the contradiction between ecological protection and economic development tends to be more pronounced [17,18,19]. Chair Xi Jinping’s concept of “Green Footprint” undoubtedly provides a new direction for balancing ecological protection and coordinated economic development in this context.
There are some limitations on the existing research on the ecological footprint. First of all, most of the research is limited to a single geographical or administrative unit [20,21,22], and there is a lack of analysis from a differentiated perspective. Ecological problems are often closely related to human economic activities, and the adaptability of inter-regional coordination problems is crucial to solving ecological problems [23,24]. From the perspective of economic areas, this study analyzed the spatiotemporal evolution of the ecological footprint of each region [25,26,27]. Compared with the traditional provincial, municipal, or county analysis, the economic zone, as a region unit with both macro vision and micro detail, can more accurately identify the current situation and problems of regional ecological coordinated development, effectively connecting the scope of provinces, cities, prefectures, and counties [28]. It can also facilitate the rational allocation and collaborative governance of ecological resources between regions and timely find and solve related problems.
Secondly, most researchers have often overlooked the role of natural factors themselves when analyzing the impact of socioeconomic factors on ecological footprint [29]. This study involves an interactive analysis of the two, highlighting the importance of natural factors in ecological changes and providing more comprehensive theoretical support for regional ecological risk management.
Finally, studies often offer broad development recommendations without addressing regional differences [30]. Unlike traditional views on ecological resource distribution, economic behavior often directly influences the actual spatial occupation and consumption of these resources [31,32]. Recognizing this, our study divided the area into five economic zones, guided by the economic zone perspective and Sichuan Province’s official development plan. This approach surpasses single administrative boundaries, effectively linking provincial and municipal resource deployment with a focus on smaller regional perspectives [33]. It creates a differentiated development model that considers natural endowments, industrial structure, and ecological functions. This framework allows for a comprehensive analysis of how human economic activities systematically impact the ecological environment, shedding light on the mechanisms driving ecological pressure evolution. This study examines the spatial differentiation patterns of ecological footprints to analyze the ecological and environmental pressures associated with various economic development paths. It offers specific sustainable development recommendations for the five major economic zones in Sichuan Province, intending to guide regional ecological protection and economic growth more effectively. While the primary focus is on understanding the shifts in ecological security patterns within Sichuan’s economic zones, the research findings also offer valuable insights and case studies applicable to ecological development globally.
2. Materials and Methods
2.1. Study Area
Sichuan Province, the economic hub of western China, achieved a GDP of over 6 trillion yuan in 2023. Despite this economic success, it faces significant ecological challenges as the “ecological barrier of the upper reaches of the Yangtze River.” Figure 1 illustrates how Sichuan’s complex topography, frequent geological activity, and monsoon climate contribute to a high risk of natural disasters, highlighting the ecological costs of economic development. To balance regional growth and environmental protection, the “Sichuan Provincial Territorial Spatial Planning (2021–2035)” outlines a strategy for the coordinated development of five major economic zones. These zones vary in resource endowment and development focus: the Chengdu Plain Economic Zone (EZ1) serves as a concentrated economic core; the Southern Sichuan (EZ2) and Panxi Economic Zones (EZ5) are centered on industry and strategic resources, respectively; the Northeastern Sichuan Economic Zone (EZ3) has a robust agricultural foundation; and the Northwestern Sichuan (EZ4) is designated as a key ecological functional zone. Collectively, these zones represent a spectrum from “high development” to “key protection,” offering an ideal regional case study to examine the spatiotemporal evolution and driving factors of the ecological footprint under diverse development models.
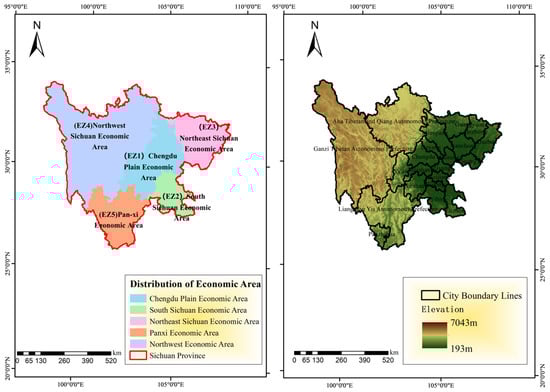
Figure 1.
Administrative Division of Sichuan Province.
2.2. Data Resources
The data for this study, spanning 2013–2022, were sourced from authoritative official channels. The specific sources, selection criteria, and their roles in the research are detailed as follows: Socioeconomic and R&D data were obtained from the China Urban Statistical Yearbook, the Sichuan Provincial Statistical Yearbook, and various statistical bulletins. These official sources provide comprehensive time series and standardized statistics, offering reliable data for ecological footprint accounting and comparable impact factors for geographic detector analysis [34]. Land-use data are from the National Bureau of Statistics’s Third National Land Survey. This legally valid and highly accurate dataset identifies various types of ecologically productive land, forming the core basis for calculating ecological carrying capacity and analyzing the ecological impact of construction land. Topographic data were sourced from the DEM data available on the Chinese Academy of Sciences’ Geospatial Data Cloud Platform. These data are both highly accurate and easily accessible, effectively illustrating how topographic factors like elevation and slope influence the spatial differentiation of ecological carrying capacity.
This paper’s ecological footprint calculation adheres to established academic algorithms, comprising two main components: the biological resource account and the energy resource account [35] (Table 1). The biological resource account includes agricultural, forestry, livestock, and fishery products. These were classified based on the specific land type required for their production [36,37,38]. For instance, although pigs, poultry, and eggs fall under livestock products, their breeding depends heavily on feed from arable land. Hence, their ecological footprint is categorized under arable land [39,40]. Conversely, livestock products primarily relying on natural pasture are classified as grassland [41]. The energy resource account encompasses fossil fuel consumption and the direct use of construction land [42]. This detailed accounting method minimizes bias in land type classification, ensuring that key outcomes, such as per capita ecological footprint and ecological deficit or surplus, accurately reflect regional conditions. It is this approach that enhances the scientific rigor and credibility of the conclusions.

Table 1.
Accounts of ecological footprint.
The unit calorific value data of the biological consumption indicators mentioned in the above table are derived from the 1993 edition of the Revised Handbook of Agricultural Technology and Economics.
2.3. Methods
In this study, the equivalence and yield factors used in the calculations were modified by referencing relevant studies in regional ecological economics and analysis in China, enabling the results to better reflect the actual conditions reported in those studies [43,44]. On this basis, the ecological footprint model based on provincial hectares was used to calculate the per capita ecological footprint, the per capita ecological carrying capacity, and the ecological footprint per 10,000 Yuan GDP in each prefecture, city, and economic area. Then, the ecological security centroid plot was drawn to evaluate the consumption and utilization efficiency of regional resources. In addition, this study utilized a geospatial detector for factor analysis to identify the driving factors behind spatial differentiation in ecological footprints. This method, widely used in environmental management and regional development research, effectively probes spatial differentiation and its driving mechanisms [25,45,46,47,48]. Unlike traditional regression methods, the geospatial detector does not depend on linear assumptions. It adeptly handles categorical variables and uncovers nonlinear relationships and interaction effects between factors [49]. This makes it particularly suitable for analyzing spatial issues like ecological footprints, which are influenced by complex socioeconomic factors (Table 2).
Table 2.
The formula of ecological security spatial evolution.
To support the critical assessment of this study’s findings, the following validation approaches are suggested. The ecological footprint calculation adopted a “provincial hectare” model tailored to the conditions of Sichuan Province. The bioresource accounts were established based on regional characteristics, incorporating southern specialty crops such as sugarcane and tea. To ensure the accuracy of municipal-level agricultural product data, after cross-referencing provincial statistical yearbooks with prefectural-level statistical yearbooks, relevant district and county agricultural bureaus were contacted to obtain more precise sub-regional data. All data were uniformly cleaned and organized using Stata software (Version 17.0). For key parameters, the equivalence factor was calculated as the ratio of the average ecological productivity of all similar ecologically productive land in the province to the average ecological productivity of all ecologically productive land in the province. The yield factor was determined as the ratio of the average productivity of a specific land type in each locality to the average productivity of all similar land types in the province, thereby correcting for regional productivity differences. Energy account consumption data were uniformly sourced from local statistical yearbooks at various levels. Furthermore, the driving factors for the geographical detector were selected based on theoretical and empirical research related to economic development and the ecological environment in Sichuan Province, ensuring their regional representativeness.
3. Results
3.1. Variation Characteristics of Ecological Footprint
3.1.1. Per Capita Ecological Footprint
Over the past decade, Sichuan Province has experienced significant fluctuations in its per capita ecological footprint, influenced by alternating phases of economic expansion and environmental governance (Figure 2). During the first period (W1: 2013–2018), the provincial average increased from 1.6541 hm2 to 1.7677 hm2, largely driven by industrialization and urbanization. This was followed by a moderate decline during the early phase of W2 (2018–2019), attributed to clean energy promotion under the 13th Five-Year Plan, before rising again to 1.8891 hm2 by 2022.
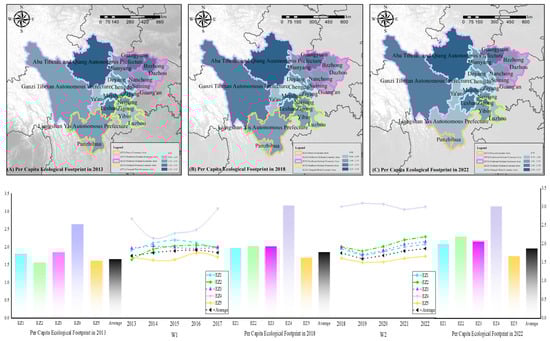
Figure 2.
Spatiotemporal evolution of per capita ecological footprint in Sichuan Province.
Regional disparities among the five economic zones are pronounced. The Northwestern Sichuan Economic Area (EZ4) consistently recorded the highest footprint, rising from 2.6402 hm2 in 2013 to 3.1224 hm2 in 2019. In contrast, the Panxi Economic Area (EZ5) maintained the lowest level across the study period, recording 1.6138 hm2 in 2013 and 1.6807 hm2 in 2022. The Southern Sichuan Economic Area (EZ2) exhibited the most substantial growth—increasing by 41.61% between 2013 and 2022—reflecting intense industrial and urban pressures.
Analysis at the prefectural level reinforces these trends. For instance, in EZ2, Zigong and Yibin saw their footprints rise markedly from 2013 to 2022. Similarly, in EZ4, Ngawa and Ganzi prefectures consistently recorded high values, aligning with the zone’s resource-intensive development pathway. Conversely, Panzhihua in EZ5 showed a more contained increase, underscoring the zone’s success in sustaining lower ecological impacts. These patterns highlight how place-specific economic policies have variably shaped the trade-off between development and ecological load across Sichuan.
3.1.2. Per Capita Ecological Carrying Capacity
Sichuan Province’s per capita ecological carrying capacity remained relatively stable from 2013 to 2022, with the provincial average decreasing marginally from 0.5477 hm2 to 0.5470 hm2. However, distinct trends emerged across its five economic zones and prefecture-level cities, particularly between the two study periods: W1 (2013–2018) and W2 (2018–2022) (Figure 3).
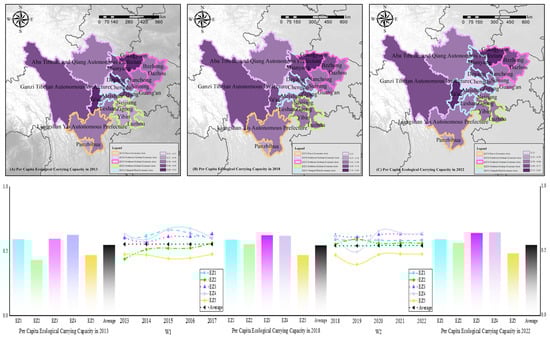
Figure 3.
Spatiotemporal evolution of per capita ecological carrying capacity in Sichuan Province.
During W1, the Southern Sichuan Economic Area (EZ2) experienced the most pronounced decline, while the Panxi Economic Area (EZ5) also decreased notably. In contrast, the Chengdu Plain Economic Area (EZ1) and Northeastern Sichuan Economic Area (EZ3) saw modest gains. At the city level, Chengdu more than doubled its carrying capacity, and Neijiang, Zigong, and Meishan also registered increases exceeding 10%. Conversely, Deyang, Leshan, Dazhou, and Liangshan Prefecture experienced declines.
In W2, the Northwestern Sichuan Economic Area (EZ4) recorded the largest decline, particularly influenced by a 36.32% drop in Ganzi Prefecture from 2019 to 2022. Meanwhile, the Southern Sichuan Economic Area (EZ2) showed recovery, with Zigong, Luzhou, Leshan, and Yibin each increasing by over 10%. By 2022, Guangyuan maintained the highest average carrying capacity among cities, whereas Chengdu remained the lowest.
These shifts reflect the impact of regional environmental and industrial policies, ecological restoration projects in ecologically fragile zones, and urban industrial transformation in core cities, underscoring the varied effectiveness of sustainability measures across different regional contexts.
3.1.3. Ecological Footprint per 10,000 Yuan GDP
Over the past decade, the ecological footprint per 10,000 yuan GDP in Sichuan Province has shown a consistent declining trend, reflecting improved resource utilization efficiency at both provincial and city levels. Between 2013 and 2022, the provincial average decreased from 0.5656 hm2 to 0.3018 hm2, with notable variations across economic zones and cities (Figure 4).
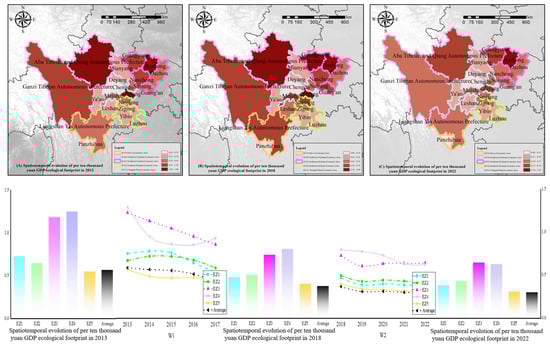
Figure 4.
Spatiotemporal evolution of per ten thousand yuan GDP ecological footprint in Sichuan Province.
During the W1 period (2013–2018), all five major economic zones experienced significant reductions. The Chengdu Plain Economic Area (EZ1) and Panxi Economic Area (EZ5) maintained the lowest levels, falling to 0.4749 hm2 and 0.4023 hm2, respectively, by 2018. In contrast, the Northeastern Sichuan (EZ3) and Northwestern Sichuan (EZ4) Economic Areas recorded higher values, though still showing considerable decreases. At the city level, Chengdu and Panzhihua consistently had the lowest footprints, while Aba Prefecture, Ziyang, and Bazhong remained high.
In the W2 period (2018–2022), the declining trend continued, with the provincial average dropping further to 0.3018 hm2. The Northwestern Sichuan Economic Area (EZ4) showed the most pronounced improvement, falling from 0.8050 hm2 to 0.6314 hm2. Most cities exhibited further reductions by 2022, with Mianyang, Suining, Nanchong, Bazhong, and Aba Prefecture decreasing by over 40% since 2013. These changes are closely linked to regional industrial restructuring and clean energy transitions, particularly in Chengdu and the Panxi area, where industrial upgrading and circular economy initiatives have enhanced resource efficiency. In contrast, the persistently higher footprints in Northeastern and Northwestern Sichuan reflect their reliance on agriculture and resource-intensive industries.
The overall decline underscores the effectiveness of environmental policies and technological advances in decoupling economic growth from ecological impact, though regional disparities highlight the need for tailored strategies based on local economic structures.
3.2. Variation Characteristics of Ecological Security Centroid
This paper analyzes the spatial variation trajectory of ecological security in Sichuan Province for the years 2013, 2018, and 2022, focusing on the ecological security centroid (Figure 5). The results show that the ecological security centroid in Sichuan Province has primarily been located in the southeastern Chengdu City, near the northeastern part of Meishan City, over the past decade. Spatially, it is densely distributed, presenting an overall pattern oriented from “northeast to southeast.” Affected by human activities, the ecological security centroid shifted westward by 9.4639 km from 2013 to 2018. The extension trend of the short axis of the standard deviation ellipse was more obvious than that of the long axis, and the scope of ecological security expanded to the northwest, indicating that at this stage, the ecological issues in the northwest of Sichuan Province were particularly prominent, mainly involving Ganzi and Aba prefectures, especially Ganzi prefecture, facing the challenges from industrial, agricultural and domestic pollution sources. Compared with 2013, the emission of sulfur dioxide in wastewater in Ganzi prefecture increased by 29.71% in 2018, and the ecological pressure increased annually. From 2018 to 2022, the ecological security centroid shifted to the southeast by 5.7265 km. The long axis and short axis of the standard deviation ellipse had a convergence trend, and the gap in shortening distance was small, indicating that the ecological environment of the northwestern region of Sichuan Province, especially the western region, had been restored to a certain extent. In this period, Ganzi Prefecture experienced significant ecological improvement. In 2022, the emission of sulfur dioxide in wastewater decreased by 20.15% compared with that in 2018, and chemical oxygen demand emissions in exhaust gas decreased by 13.04%. The regional ecological problems were alleviated, and the environmental pressure was reduced. With the improvement of science and technology, the use of agricultural machinery and different improvement and restoration measures, the productivity of the same land type has been significantly improved, and the ecological pressure has been reduced. In addition, Sichuan Province, as an important ecological strategic area in Southwest China, has carried out a series of ecological restoration and ecological protection measures in recent years, which have greatly improved the overall ecological environment of the province.
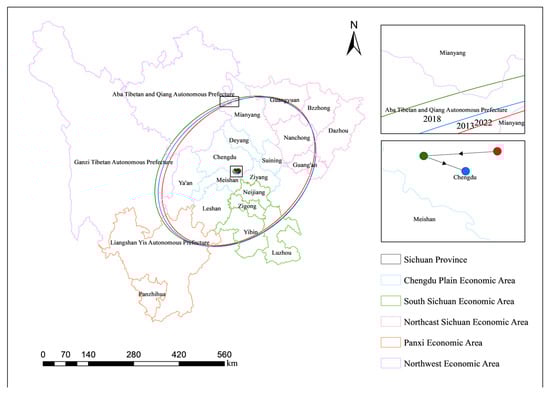
Figure 5.
Trajectory of ecological security gravity center movement in Sichuan Province.
3.3. Analysis of the Main Influencing Factors of Ecological Footprint
This study examines the spatiotemporal differentiation of ecological footprints across the five major economic zones, utilizing the geographic detector method. The analysis uses the per capita ecological footprint of the entire province as the dependent variable to explore its spatial driving mechanisms. This provincial scale is appropriate as the zones are influenced by consistent provincial policies and natural patterns, aiding in identifying common dominant factors and supporting regional collaborative governance.
The choice of driving factors aligns with the distinguishing features of the five major economic zones. Economically, per capita GDP (X2) and the share of secondary industry (X3) effectively delineate the higher development level of the Chengdu Plain Economic Zone relative to the others [59]. The total output value of agriculture, forestry, animal husbandry, and fishery (X13) captures the agricultural–ecological characteristic of the Northeastern and Northwestern Sichuan Economic Zones, while R&D investment intensity (X4) reflects each zone’s emphasis on technological innovation.
From a social-consumption perspective, population density (X1) indicates the intensity of human activity across zones. Urbanization rate (X5) and urban construction land (X11) underscore the Chengdu Plain Economic Zone’s high degree of urbanization, and urban and rural consumption expenditure (X6, X7) reveal differences in consumption patterns and lifestyles among the zones [60].
Regarding natural background, temperature (X8) and precipitation (X9) capture the climatic contrasts between the Northwestern Sichuan Ecological Economic Zone and the Panxi Economic Zone [61,62]. Urban sewage treatment rate (X10) indicates differences in environmental governance, and cultivated land area (X12) further characterizes the agricultural–ecological nature of the Northeastern and Northwestern Sichuan Economic Zones [63,64].
The factor system integrates province-wide commonalities with the distinct characteristics of the five major economic zones, enabling a comprehensive analysis of the spatial differentiation mechanisms of the ecological footprint. After all factors passed the collinearity test, a geographic detector analyzed their independent and interactive explanatory power, constructing a complete analytical chain from macro mechanisms to regional heterogeneity.
3.3.1. Single Factor Detection Analysis
The single-factor analysis results (Table 3, Figure 6) indicate that secondary industry output (X3), R&D expenditure (X4), and urban construction land (X11) consistently have a significant correlation with the per capita ecological footprint. This correlation varies among the five major economic zones. In the Chengdu Plain Economic Zone, R&D expenditure has a notably inhibitory effect, aligning with the “Chengdu Plain Economic Zone Green Development Promotion Regulations.” Conversely, the Panxi Economic Zone experiences primary pressure from its secondary industry, highlighting the path dependence of its resource-based industrial structure. Meanwhile, the Northeastern Sichuan Economic Zone has effectively managed ecological pressure from construction land, adhering to the “Qinba Mountain Area Ecological Protection Plan”.
Table 3.
Socioeconomic factors influencing ecological security.
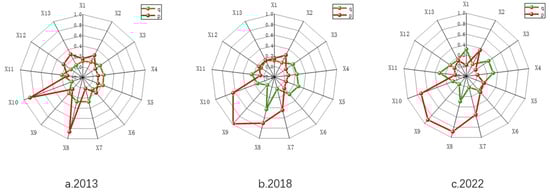
Figure 6.
Radar chart of single factor intensity influencing per capita ecological footprint in Sichuan Province.
The time-series analysis showed that rural per capita consumption expenditure (X7) had its strongest impact in 2013, consistent with a consumption upgrade driven by the “new rural construction” and particularly evident in the northeastern and northwestern Sichuan economic zones. By 2018, the urbanization rate (X5) and urban per capita consumption expenditure (X6) emerged as the dominant drivers, especially in the Chengdu Plain Economic Zone, where the construction of the “Chengdu-Chongqing Twin-City Economic Circle” accelerated population agglomeration and shifted ecological pressure. By 2022, the influence of cultivated land area (X12) had grown markedly, most notably in the main agricultural production areas of northeastern Sichuan, reflecting an intensification of the people–land contradiction under the implementation of the “Sichuan Province Cultivated Land Protection Regulations.”
3.3.2. Dual-Factor Interactive Detection Analysis
The dual-factor interaction analysis results revealed that the primary relationship among the factors was nonlinear reinforcement (Figure 7). The urban average temperature (X8) consistently demonstrated a significant impact during the interaction, underscoring the fundamental role of climate conditions in shaping ecological pressures.
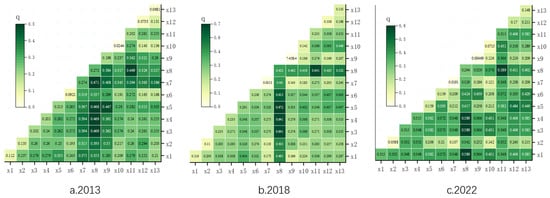
Figure 7.
Heatmap of dual-factor interaction influencing per capita ecological footprint in Sichuan Province.
From a temporal perspective, the interaction between temperature (X8) and rural consumption (X7) was strongest in 2013 (q = 0.471), with the effect particularly pronounced in the Northwestern Sichuan Ecological Economic Zone. This finding reflects the fundamental constraint that climate conditions impose on agricultural and pastoral production and confirms the mechanism by which climate-sensitive livelihood systems are vulnerable to consumption upgrading. In 2018, the interaction between temperature (X8) and urbanization rate (X5) was prominent (q = 0.672), most evident in the Chengdu Plain Economic Zone. This pattern reflects the synergistic increase in the urban heat island effect and energy consumption during rapid urbanization and aligns with theoretical expectations of the “urban climate–energy coupling mechanism”. By 2022, the interaction between temperature and multiple factors—population density (X1), secondary industry output (X3), R&D expenditure (X4), and urban construction land (X11)—had further strengthened (q = 0.589), with this effect especially pronounced in the Panxi Economic Zone. This finding indicates that, under the construction of the “National Strategic Resource Innovation and Development Pilot Zone,” climate conditions have become deeply integrated into socioeconomic operations, producing a new paradigm of “climate–economic system coupling pressure.” The evolution shows that the mechanism generating ecological pressure in Sichuan Province shifted from a localized “climate–rural consumption” interaction to a systemic, multidimensional coupling of “climate–urbanization–industrialization,” offering a new perspective for explaining the differentiated formation paths of ecological pressure across economic zones.
4. Discussion
Sichuan Province maintained a state of ecological deficit from 2013 to 2022, indicating persistent pressure on regional ecosystems. During this period, the per capita ecological footprint rose by 0.1136 hm2, reaching its peak in 2014. Notably, spatial trajectory analysis of the ecological security centroid reveals a distinct southwestward migration trend, which aligns with the rapid development patterns observed in the Southern Sichuan Economic Zone (EZ2) and the Panzhihua–Xichang Economic Zone (EZ5), suggesting a significant shift in the spatial distribution of ecological pressure. Despite this, per capita ecological carrying capacity consistently exceeded the footprint, sustaining an ecological surplus between 0.1583 hm2 and 0.2057 hm2 and reflecting an overall trajectory of sustainable development [65,66]. A marked decline in the ecological footprint per 10,000 yuan GDP further signals enhanced resource efficiency, driven by industrial upgrading and technological progress. This improvement is closely linked to Sichuan’s recent promotion of the “5 + 1” modern industrial system and its innovation-driven development strategy, offering valuable insights for western regions aiming to balance economic growth with ecological conservation [67,68,69].
Factor detection analysis reveals that secondary industry output and R&D expenditure were the dominant drivers of the ecological footprint, while urban average temperature exhibited the strongest interactive effects in two-factor analysis. The pronounced influence of industrial structure underscores Sichuan’s ongoing deep industrialization phase. However, the prominent role of R&D expenditure highlights the dual effects of innovation activities [70,71,72]. While technological advances reduce the per-unit ecological footprint, they may also stimulate the expansion of emerging industries, thereby generating new ecological pressures [73,74,75]. The interaction between temperature and economic factors further indicates that climatic conditions modulate industrial and energy demand [76,77]. This finding provides important insights for formulating differentiated regional environmental policies in Sichuan in the context of climate change.
Notably, the economic zone-based framework adopted in this study uncovers spatial patterns often masked by conventional administrative-unit analysis. Distinct developmental dynamics emerged across the five major economic regions: the Chengdu Plain Economic Area (EZ1) operated as an integrated high-pressure cluster; the Southern Sichuan Economic Area (EZ2) experienced the most rapid footprint expansion, revealing intense developmental stress; both the Northeastern (EZ3) and Northwestern (EZ4) Sichuan Economic Areas remained dependent on resource-intensive sectors; and the Panzhihua–Xichang Economic Area (EZ5) sustained a relatively lower ecological footprint. These findings validate the scientific value of functional economic zoning in environmental governance [78,79]. More importantly, they reveal the unique challenges that different regions face in coordinating ecological and economic development. This research provides an empirical basis for targeted environmental management [80,81].
These cross-jurisdictional findings underscore the value of functional regionalization in designing coordinated environmental strategies [82,83]. The discussion reveals that the core of Sichuan’s ecological management lies in reconciling the tension between regional development disparities and unified environmental goals. The southwestward shift of the ecological pressure centroid and the heterogeneity of economic zones are not isolated phenomena; they are intrinsically linked to the province’s industrial layout and innovation factor flow. This deepens the understanding of the complex mechanisms behind the spatial evolution of the ecological footprint, moving beyond simple driver identification to a systemic analysis of their spatial interaction effects.
4.1. Academic Contributions
This study accomplished a dual breakthrough in methodology and perspective. Methodologically, an enhanced ecological footprint was developed model based on “provincial hectares” and tailored to economic zones. This model addresses the limitations of traditional approaches by incorporating regional disparities, thereby providing a practical framework for analyzing ecological supply and demand across multiple economic zones at the provincial level. Furthermore, a geographic detector was applied to examine the driving mechanisms of ecological footprints, identifying key factors—such as secondary industry output, R&D investment, and temperature—and their interaction effects. This approach enhances the understanding of synergistic dynamics between natural and economic factors within human–land system coupling. From an analytical perspective, the investigation systematically examined the formation and evolution of ecological pressure across five major economic zones through three dimensions: overall trends, regional differentiation, and driving mechanisms. The analysis offers empirical evidence and theoretical support for the design of differentiated ecological governance strategies and policy development.
4.2. Research Prospects
Future research can be further deepened in the following aspects: (1) strengthening inter-regional ecological linkage research and explore ecological compensation and collaborative governance mechanisms between economic zones; (2) introducing dynamic simulation methods, construct a multi-scenario analysis framework, and predict the ecological effects of different policy paths; and (3) promoting ecological value accounting and green development performance evaluation to provide more accurate decision support for regional ecological civilization construction. Furthermore, future research should incorporate dynamic simulations and inter-regional comparisons to further elucidate the mechanisms underlying the spatial differentiation of ecological footprint evolution, providing scientific support for ecological co-construction and environmental co-protection within the Chengdu–Chongqing economic circle.
5. Conclusions
The construction of the five major economic regions in Sichuan Province has brought challenges and opportunities to the ecological environment while promoting economic growth. Therefore, starting from the ecological supply and demand of the five economic areas, this paper discusses the new path of coordinated development of the regional economy and ecological protection and puts forward the following suggestions (Figure 8):
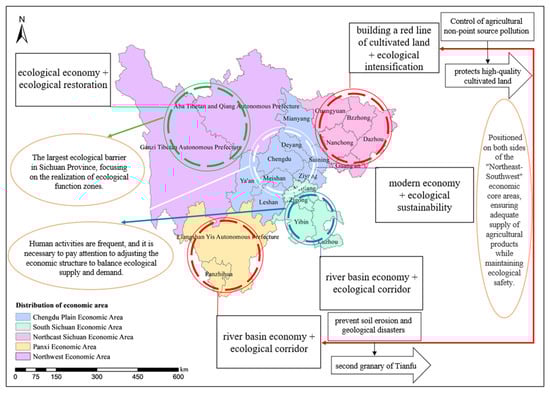
Figure 8.
Policy recommendation diagram.
- (1)
- Chengdu Plain Economic Area: Future development should maintain the “modern economy + ecological sustainability” model by enhancing R&D-driven emission reduction and strictly controlling urban land expansion.
- (2)
- Southern Sichuan Economic Area: The core strategy should center on the “basin economic ecological corridor” concept aligned with the Belt and Road Initiative, focusing on protecting critical river corridors while establishing watershed ecological compensation mechanisms.
- (3)
- Northeastern Sichuan Economic Area: Emphasize “building ecologically intensive farmland along the red line” through advanced agricultural technologies and high-standard farmland development.
- (4)
- Northwestern Sichuan Economic Area: Adopt an ‘ecological economy + ecological restoration’ approach by developing eco-tourism and plateau-specific agriculture, coupled with climate adaptation measures.
- (5)
- Pan-xi Economic Area: Strengthen the ‘agricultural economy + soil and water conservation’ to establish a distinctive ‘Second Granary of Tianfu’, while promoting green mineral development and enhanced ecological protection.
In summary, it is recommended that Sichuan pursue these targeted, zone-specific policies, which collectively embody the promotion of renewable energy in resource-intensive regions and the strengthening of ecological compensation mechanisms. The overarching goal is to align economic and urban development with functional regional carrying capacity.
Author Contributions
H.H.: writing—original draft preparation, conceptualization, methodology, software, validation, formal analysis, data curation, visualization, software, validation, formal analysis, data curation, visualization. X.Z.: review and editing, resources, funding acquisition. All authors have read and agreed to the published version of the manuscript.
Funding
This research received no external funding.
Institutional Review Board Statement
Not applicable.
Informed Consent Statement
Not applicable.
Data Availability Statement
The data supporting the findings of this study are available within the article.
Conflicts of Interest
The authors declare no conflicts of interest.
References
- Yao, J.; Xu, P.; Huang, Z. Impact of Urbanization on Ecological Efficiency in China: An Empirical Analysis Based on Provincial Panel Data. Ecol. Indic. 2021, 129, 107827. [Google Scholar] [CrossRef]
- Ali, R.; Kuriqi, A.; Kisi, O. Human–Environment Natural Disasters Interconnection in China: A Review. Climate 2020, 8, 48. [Google Scholar] [CrossRef]
- Sukumaran, K. Impact of Human Activities Inducing and Triggering of Natural Disasters. In A System Engineering Approach to Disaster Resilience, Proceedings of the VCDRR 2021, Virtual, 15–20 March 2021; Ghosh, C., Kolathayar, S., Eds.; Springer Nature: Singapore, 2022; pp. 17–31. [Google Scholar]
- Mishra, H. Environmental Degradation and Impacts on Agricultural Production: A Challenge to Urban Sustainability. In Sustainable Urban Environment and Waste Management: Theory and Practice; Parray, J.A., Shameem, N., Haghi, A.K., Eds.; Springer Nature: Singapore, 2025; pp. 53–92. ISBN 978-981-96-1140-9. [Google Scholar]
- Karwacka, M.; Ciurzyńska, A.; Lenart, A.; Janowicz, M. Sustainable Development in the Agri-Food Sector in Terms of the Carbon Footprint: A Review. Sustainability 2020, 12, 6463. [Google Scholar] [CrossRef]
- Festus, I.A.; Omoboye, I.F.; Andrew, O.B. Urban Sprawl: Environmental Consequence of Rapid Urban Expansion. Malays. J. Soc. Sci. Humanit. MJSSH 2020, 5, 110–118. [Google Scholar] [CrossRef]
- Danielsen, F.; Eicken, H.; Funder, M.; Johnson, N.; Lee, O.; Theilade, I.; Argyriou, D.; Burgess, N.D. Community Monitoring of Natural Resource Systems and the Environment. Annu. Rev. Environ. Resour. 2022, 47, 637–670. [Google Scholar] [CrossRef]
- Rial, R.C. Biofuels versus Climate Change: Exploring Potentials and Challenges in the Energy Transition. Renew. Sustain. Energy Rev. 2024, 196, 114369. [Google Scholar] [CrossRef]
- Sharifi, A. Resilience of Urban Social-Ecological-Technological Systems (SETS): A Review. Sustain. Cities Soc. 2023, 99, 104910. [Google Scholar] [CrossRef]
- Bi, M.; Yao, C.; Xie, G.; Liu, J.; Qin, K. Improvement and Application of the Three-Dimensional Ecological Footprint Model. Ecol. Indic. 2021, 125, 107480. [Google Scholar] [CrossRef]
- Ahsan, S.S. Evaluation of Environmental Footprint Indicators for the Calculation of Personal Overshoot Day. Ph.D. Thesis, Politecnico di Torino, Torino, Italy, 2023. [Google Scholar]
- Hong, Z.; Xiao, K. Digital Economy Structuring for Sustainable Development: The Role of Blockchain and Artificial Intelligence in Improving Supply Chain and Reducing Negative Environmental Impacts. Sci. Rep. 2024, 14, 3912. [Google Scholar] [CrossRef]
- Jie, H.; Khan, I.; Alharthi, M.; Zafar, M.W.; Saeed, A. Sustainable Energy Policy, Socio-Economic Development, and Ecological Footprint: The Economic Significance of Natural Resources, Population Growth, and Industrial Development. Util. Policy 2023, 81, 101490. [Google Scholar] [CrossRef]
- Yang, Y.; Meng, G. The Evolution and Research Framework of Carbon Footprint: Based on the Perspective of Knowledge Mapping. Ecol. Indic. 2020, 112, 106125. [Google Scholar] [CrossRef]
- Zhou, C.; Zhang, R.; Loginova, J.; Sharma, V.; Zhang, Z.; Qian, Z. Institutional Logic of Carbon Neutrality Policies in China: What Can We Learn? Energies 2022, 15, 4391. [Google Scholar] [CrossRef]
- Zhou, C.; Zhang, W.; Richardson-Barlow, C. Navigating Ecological Civilisation: Polycentric Environmental Governance and Policy Regulatory Framework in China. Energy Res. Soc. Sci. 2025, 128, 104347. [Google Scholar] [CrossRef]
- Hallegatte, S.; Vogt-Schilb, A.; Rozenberg, J.; Bangalore, M.; Beaudet, C. From Poverty to Disaster and Back: A Review of the Literature. Econ. Disasters Clim. Change 2020, 4, 223–247. [Google Scholar] [CrossRef]
- Ma, Y.; Feng, G.-F.; Chang, C.-P. From Traditional Innovation to Green Innovation: How an Occurrence of Natural Disasters Influences Sustainable Development? Sustain. Dev. 2024, 32, 2779–2796. [Google Scholar] [CrossRef]
- Bănică, A.; Kourtit, K.; Nijkamp, P. Natural Disasters as a Development Opportunity: A Spatial Economic Resilience Interpretation. Rev. Reg. Res. 2020, 40, 223–249. [Google Scholar] [CrossRef]
- Galli, A.; Iha, K.; Pires, S.M.; Mancini, M.S.; Alves, A.; Zokai, G.; Lin, D.; Murthy, A.; Wackernagel, M. Assessing the Ecological Footprint and Biocapacity of Portuguese Cities: Critical Results for Environmental Awareness and Local Management. Cities 2020, 96, 102442. [Google Scholar] [CrossRef]
- Zambrano-Monserrate, M.A.; Ruano, M.A.; Ormeño-Candelario, V.; Sanchez-Loor, D.A. Global Ecological Footprint and Spatial Dependence between Countries. J. Environ. Manag. 2020, 272, 111069. [Google Scholar] [CrossRef]
- Ke, H.; Dai, S.; Yu, H. Spatial Effect of Innovation Efficiency on Ecological Footprint: City-Level Empirical Evidence from China. Environ. Technol. Innov. 2021, 22, 101536. [Google Scholar] [CrossRef]
- Wang, D.; Xue, S.; Lu, Z.; Zhou, Y.; Hou, Y.; Guo, M. Dynamic evolution and spatial–temporal disparities decomposition of high-quality economic development in China. Environ. Dev. Sustain. 2024, 26, 19491. [Google Scholar] [CrossRef]
- Fang, C. On Integrated Urban and Rural Development. J. Geogr. Sci. 2022, 32, 1411–1426. [Google Scholar] [CrossRef]
- Wu, D. Spatially and Temporally Varying Relationships between Ecological Footprint and Influencing Factors in China’s Provinces Using Geographically Weighted Regression (GWR). J. Clean. Prod. 2020, 261, 121089. [Google Scholar] [CrossRef]
- Song, M.; Zhang, L.; Gao, Y.; Li, E. Spatiotemporal Evolution and Influence Mechanism of the Carbon Footprint of Energy Consumption at County Level in the Yellow River Basin. Sci. Total Environ. 2023, 883, 163710. [Google Scholar] [CrossRef]
- Liu, T.; Wang, H.-Z.; Wang, H.-Z.; Xu, H. The Spatiotemporal Evolution of Ecological Security in China Based on the Ecological Footprint Model with Localization of Parameters. Ecol. Indic. 2021, 126, 107636. [Google Scholar] [CrossRef]
- Wang, G.; Yang, D.; Xia, F.; Zhong, R.; Xiong, C. Three Types of Spatial Function Zoning in Key Ecological Function Areas Based on Ecological and Economic Coordinated Development: A Case Study of Tacheng Basin, China. Chin. Geogr. Sci. 2019, 29, 689–699. [Google Scholar] [CrossRef]
- Zeb, A.; Shuhai, N.; Ullah, O. Socioeconomic Determinants of Ecological Footprints: Bridging the Gap between Developed and Developing Nations. Environ. Dev. Sustain. 2025. [Google Scholar] [CrossRef]
- Deng, X.; Wang, Y.; Song, M. Development Geography for Exploring Solutions to Promote Regional Development. Geogr. Sustain. 2023, 4, 49–57. [Google Scholar] [CrossRef]
- Zhang, Y.; Dilanchiev, A. Economic Recovery, Industrial Structure and Natural Resource Utilization Efficiency in China: Effect on Green Economic Recovery. Resour. Policy 2022, 79, 102958. [Google Scholar] [CrossRef]
- Glenk, K.; Johnston, R.J.; Meyerhoff, J.; Sagebiel, J. Spatial Dimensions of Stated Preference Valuation in Environmental and Resource Economics: Methods, Trends and Challenges. Environ. Resour. Econ. 2020, 75, 215–242. [Google Scholar] [CrossRef]
- Hoppe, T.; Miedema, M. A Governance Approach to Regional Energy Transition: Meaning, Conceptualization and Practice. Sustainability 2020, 12, 915. [Google Scholar] [CrossRef]
- Han, J.; Tan, Z.; Chen, M.; Zhao, L.; Yang, L.; Chen, S. Carbon Footprint Research Based on Input–Output Model—A Global Scientometric Visualization Analysis. Int. J. Environ. Res. Public Health 2022, 19, 11343. [Google Scholar] [CrossRef] [PubMed]
- Jóhannesson, S.E.; Heinonen, J.; Davíðsdóttir, B. Data Accuracy in Ecological Footprint’s Carbon Footprint. Ecol. Indic. 2020, 111, 105983. [Google Scholar] [CrossRef]
- Sobhani, P.; Esmaeilzadeh, H.; Sadeghi, S.M.M.; Wolf, I.D.; Esmaeilzadeh, Y.; Deljouei, A. Assessing Spatial and Temporal Changes of Natural Capital in a Typical Semi-Arid Protected Area Based on an Ecological Footprint Model. Sustainability 2022, 14, 10956. [Google Scholar] [CrossRef]
- Jain, U.; Nagrami, F.U.H.; Sharma, B.; Priyambada; Parul; Sharma, U. Natural Resources. In Epidemiology and Environmental Hygiene in Veterinary Public Health; John Wiley & Sons, Ltd.: Hoboken, NJ, USA, 2025; pp. 329–338. ISBN 978-1-394-20818-0. [Google Scholar]
- Feng, T.; Xiong, R.; Huan, P. Productive Use of Natural Resources in Agriculture: The Main Policy Lessons. Resour. Policy 2023, 85, 103793. [Google Scholar] [CrossRef]
- Soltani, E.; Soltani, A.; Alimagham, M.; Zand, E. Ecological Footprints of Environmental Resources for Agricultural Production in Iran: A Model-Based Study. Environ. Sci. Pollut. Res. 2021, 28, 68972–68981. [Google Scholar] [CrossRef]
- Lu, Y.; Ma, W.; Shao, L. Strategies to Mitigate the Environmental Footprints of Meat, Egg and Milk Production in Northern China. J. Clean. Prod. 2024, 443, 141027. [Google Scholar] [CrossRef]
- Delaby, L.; Finn, J.A.; Grange, G.; Horan, B. Pasture-Based Dairy Systems in Temperate Lowlands: Challenges and Opportunities for the Future. Front. Sustain. Food Syst. 2020, 4, 543587. [Google Scholar] [CrossRef]
- Holechek, J.L.; Geli, H.M.E.; Sawalhah, M.N.; Valdez, R. A Global Assessment: Can Renewable Energy Replace Fossil Fuels by 2050? Sustainability 2022, 14, 4792. [Google Scholar] [CrossRef]
- Wang, H.; Huang, J.; Zhou, H.; Deng, C.; Fang, C. Analysis of Sustainable Utilization of Water Resources Based on the Improved Water Resources Ecological Footprint Model: A Case Study of Hubei Province, China. J. Environ. Manag. 2020, 262, 110331. [Google Scholar] [CrossRef]
- Dong, H.; Feng, Z.; Yang, Y.; Li, P.; You, Z. Dynamic Assessment of Ecological Sustainability and the Associated Driving Factors in Tibet and Its Cities. Sci. Total Environ. 2021, 759, 143552. [Google Scholar] [CrossRef] [PubMed]
- Han, J.; Dalaibaatar, E. A Study on the Influencing Factors of China’s Ecological Footprint Based on EEMD–GeoDetector. Sustainability 2023, 15, 6680. [Google Scholar] [CrossRef]
- Ren, D.; Cao, A. Analysis of the Heterogeneity of Landscape Risk Evolution and Driving Factors Based on a Combined GeoDa and Geodetector Model. Ecol. Indic. 2022, 144, 109568. [Google Scholar] [CrossRef]
- Gan, Q.; Liao, L.; Kang, X.; Xu, Z.; Fu, T.; Cao, Y.; Feng, Y.; Dong, J.; Lan, S. Cultural Ecosystem Services and Disservices in Protected Areas: Hotspots and Influencing Factors Based on Tourists’ Digital Footprints. Ecosyst. Serv. 2024, 70, 101680. [Google Scholar] [CrossRef]
- Zhang, K.; Feng, R.; Zhang, Z.; Deng, C.; Zhang, H.; Liu, K. Exploring the Driving Factors of Remote Sensing Ecological Index Changes from the Perspective of Geospatial Differentiation: A Case Study of the Weihe River Basin, China. Int. J. Environ. Res. Public Health 2022, 19, 10930. [Google Scholar] [CrossRef]
- Wang, W.; Yang, Y. Spatial-Temporal Differentiation Characteristics and Driving Factors of China’s Energy Eco-Efficiency Based on Geographical Detector Model. J. Clean. Prod. 2024, 434, 140153. [Google Scholar] [CrossRef]
- Yang, Y.; Lu, H.; Liang, D.; Chen, Y.; Tian, P.; Xia, J.; Wang, H.; Lei, X. Ecological Sustainability and Its Driving Factor of Urban Agglomerations in the Yangtze River Economic Belt Based on Three-Dimensional Ecological Footprint Analysis. J. Clean. Prod. 2022, 330, 129802. [Google Scholar] [CrossRef]
- Yang, Y.; Cai, Z. Ecological Security Assessment of the Guanzhong Plain Urban Agglomeration Based on an Adapted Ecological Footprint Model. J. Clean. Prod. 2020, 260, 120973. [Google Scholar] [CrossRef]
- Wu, F.; Mo, C.; Dai, X.; Li, H. Spatial Analysis of Cultivated Land Productivity, Site Condition and Cultivated Land Health at County Scale. Int. J. Environ. Res. Public Health 2022, 19, 12266. [Google Scholar] [CrossRef]
- Ulucak, R.; Khan, S.U.D. Determinants of the Ecological Footprint: Role of Renewable Energy, Natural Resources, and Urbanization. Sustain. Cities Soc. 2020, 54, 101996. [Google Scholar] [CrossRef]
- Yao, X.; Chen, W.; Song, C.; Gao, S. Sustainability and Efficiency of Water-Land-Energy-Food Nexus Based on Emergy-Ecological Footprint and Data Envelopment Analysis: Case of an Important Agriculture and Ecological Region in Northeast China. J. Clean. Prod. 2022, 379, 134854. [Google Scholar] [CrossRef]
- Ma, X.; Yuan, H. Ecological Footprint and Carrying Capacity of Agricultural Water-Land-Energy Nexus in China. Ecol. Indic. 2024, 168, 112786. [Google Scholar] [CrossRef]
- Liu, Y.; Zhou, X.; Zhang, Q.; Zeng, L.; Kang, Y.; Luo, J. Study on Sustainable Developments in Guangdong Province from 2013 to 2018 Based on an Improved Ecological Footprint Model. Sci. Rep. 2022, 12, 2310. [Google Scholar] [CrossRef]
- Sun, F.; Jia, Z.; Shen, J.; Xu, C.; Huang, X.; Shang, Z.; Li, S.; Zhang, S. Research on the Accounting and Spatial Effects of Emergy Ecological Footprint and Industrial Green GDP--The Case of Yangtze River Economic Belt. Ecol. Indic. 2024, 163, 112055. [Google Scholar] [CrossRef]
- Guo, J.; Ren, J.; Huang, X.; He, G.; Shi, Y.; Zhou, H. The Dynamic Evolution of the Ecological Footprint and Ecological Capacity of Qinghai Province. Sustainability 2020, 12, 3065. [Google Scholar] [CrossRef]
- Ma, L.; Huang, T.; Chen, H.; Mao, J.; Cheng, Z.; Wang, Y. Evolving Trends and Driving Factors Analysis of Green Development Level in Chengdu Plain Economic Zone. Front. Environ. Sci. 2025, 13, 1598148. [Google Scholar] [CrossRef]
- Liao, Q.; Chen, C.; Lin, Z.; Liu, Y.; Cao, J.; Shao, Z.; Kou, Y. Multifunctional Analysis of Agriculture from the Perspective of Tradeoff/Synergy: A Case Study of Sichuan Province in Western China. Sustainability 2025, 17, 1761. [Google Scholar] [CrossRef]
- He, Z.; Liu, B.; Liu, J.; Xia, X.; Han, S.; Pan, K.; Li, J.; Tang, L. Research on the Coupling Effect of Water Security and Socio-Economy in Five Economic Zones of Sichuan Province, China. Hydrol. Res. 2024, 55, 834–858. [Google Scholar] [CrossRef]
- Xiao, H.; Shao, H.; Long, J.; Zhang, S.; He, S.; Wang, D. Spatial-Temporal Pattern Evolution and Geological Influence Factors Analysis of Ecological Vulnerability in Western Sichuan Mountain Region. Ecol. Indic. 2023, 155, 110980. [Google Scholar] [CrossRef]
- He, W.; Wang, F.; Feng, N. Research on the Characteristics and Influencing Factors of the Spatial Correlation Network of Cultivated Land Utilization Ecological Efficiency in the Upper Reaches of the Yangtze River, China. PLoS ONE 2024, 19, e0297933. [Google Scholar] [CrossRef] [PubMed]
- Wei, W.; Yin, G.; Xie, S.; Sun, Q.; Zhang, Z.; Li, G. The Spatio-Temporal Patterns and Influencing Factors of Different New Agricultural Business Entities in China—Based on POI Data from 2012 to 2021. Agriculture 2023, 13, 1512. [Google Scholar] [CrossRef]
- Wang, W.; Yang, G. Sustainable Carrying Capacity: Integrating SDGs to Assess Evidence of Sustainable Development: A Case Study of the Yangtze River Economic Belt in China. J. Clean. Prod. 2025, 486, 144569. [Google Scholar] [CrossRef]
- Pourebrahim, S.; Hadipour, M.; Emlaei, Z.; Heidari, H.; Goh, C.T.; Lee, K.E. Analysis of Environmental Carrying Capacity Based on the Ecological Footprint for the Sustainable Development of Alborz, Iran. Sustainability 2023, 15, 7935. [Google Scholar] [CrossRef]
- Zhao, C.; Liu, B. Effects of Environmental Audits on Green Development Efficiency: Evidence from China. Int. J. Audit. 2025, Early view. [Google Scholar] [CrossRef]
- Xu, S.; Chen, Y.; Liulov, O.V.; Pimonenko, T.V. Green Technology Innovation and High-Quality Economic Development: Spatial Spillover Effect. Prague Econ. Pap. 2023, 32, 292–319. [Google Scholar] [CrossRef]
- Yang, J.; Wang, T.; Zhang, M.; Hu, Y.; Liu, X. The Coordinated Development and Identification of Obstacles in the Manufacturing Industry Based on Economic-Social-Resource-Environmental Goals. Systems 2025, 13, 78. [Google Scholar] [CrossRef]
- Ding, Y.; Yin, F.; Chin, L.; Zhou, K.; Taghizadeh-Hesary, F.; Li, Y. Can Government R&D Expenditure Promote Innovation? New Evidence from 37 OECD Countries. Technol. Econ. Dev. Econ. 2025, 31, 572–596. [Google Scholar] [CrossRef]
- Tajaddini, R.; Gholipour, H.F. Economic Policy Uncertainty, R&D Expenditures and Innovation Outputs. J. Econ. Stud. 2020, 48, 413–427. [Google Scholar] [CrossRef]
- Dritsaki, M.; Dritsaki, C. R&D Expenditures on Innovation: A Panel Cointegration Study of the E.U. Countries. Sustainability 2023, 15, 6637. [Google Scholar] [CrossRef]
- Kayani, U.N.; Nasim, I.; Aysan, A.F.; Bashir, F.; Iqbal, U. Emerging Trends of Carbon Emissions and Foreign Direct Investment: Accounting for Ecological Footprints, Renewable Energy, Globalization, and Technological Innovations in BRICS. Environ. Sci. Pollut. Res. 2024, 31, 41586–41599. [Google Scholar] [CrossRef]
- Sadiq, M.; Wen, F. Environmental Footprint Impacts of Nuclear Energy Consumption: The Role of Environmental Technology and Globalization in Ten Largest Ecological Footprint Countries. Nucl. Eng. Technol. 2022, 54, 3672–3681. [Google Scholar] [CrossRef]
- Koseoglu, A.; Yucel, A.G.; Ulucak, R. Green Innovation and Ecological Footprint Relationship for a Sustainable Development: Evidence from Top 20 Green Innovator Countries. Sustain. Dev. 2022, 30, 976–988. [Google Scholar] [CrossRef]
- Serrano, K.; Pardo, F.; Ibáñez, A.M.; Farinós, J.E. The Impact of Climate Change on the Performance of Agricultural Companies Worldwide. Corp. Soc. Responsib. Environ. Manag. 2025, 32, 6475–6493. [Google Scholar] [CrossRef]
- Yuanzhe, L.; Wei, S.; Dongsheng, Z.; Jiangbo, G. Progress in Research on the Influences of Climatic Changes on the Industrial Economy in China. J. Resour. Ecol. 2020, 11, 1–12. [Google Scholar] [CrossRef]
- Xu, K.; Wang, J.; Wang, J.; Wang, X.; Chi, Y.; Zhang, X. Environmental Function Zoning for Spatially Differentiated Environmental Policies in China. J. Environ. Manag. 2020, 255, 109485. [Google Scholar] [CrossRef]
- Wang, Q.; Wei, Y.; Chen, L.; Pei, H.; Wang, P.; Wang, B.; Yang, T. Impact of Ecological Governance Policies on County Ecosystem Change in National Key Ecological Functional Zones: A Case Study of Tianzhu County, Gansu Province. Ecol. Indic. 2023, 154, 110748. [Google Scholar] [CrossRef]
- Gao, L.; Fu, L.; Tsai, S.-B. An Empirical Study on Coordinated Development between Ecological Environment and Regional Economy by Big Data Mathematical Model Analysis in Tibetan Area. Math. Probl. Eng. 2022, 2022, 3074901. [Google Scholar] [CrossRef]
- Dong, Q.; Zhong, K.; Liao, Y.; Xiong, R.; Wang, F.; Pang, M. Coupling Coordination Degree of Environment, Energy, and Economic Growth in Resource-Based Provinces of China. Resour. Policy 2023, 81, 103308. [Google Scholar] [CrossRef]
- Zhong, Y.; Shang, D. Legislative Coordination in Regional Environmental Governance and Pathways to Implementation. J. Humanit. Arts Soc. Sci. 2025, 9. [Google Scholar] [CrossRef]
- Tian, Z.; Hu, R. Promoting Environmental Sustainability through Interorganisational Education: A Network Analysis of China’s Blue Sky Action Plan. Educ. Lifelong Dev. Res. 2024, 1, 170–179. [Google Scholar] [CrossRef]
Disclaimer/Publisher’s Note: The statements, opinions and data contained in all publications are solely those of the individual author(s) and contributor(s) and not of MDPI and/or the editor(s). MDPI and/or the editor(s) disclaim responsibility for any injury to people or property resulting from any ideas, methods, instructions or products referred to in the content. |
© 2025 by the authors. Licensee MDPI, Basel, Switzerland. This article is an open access article distributed under the terms and conditions of the Creative Commons Attribution (CC BY) license (https://creativecommons.org/licenses/by/4.0/).