Abstract
Understanding the spatial dependence and changes in urban ecological resilience is critical to achieving regional sustainability. This study uses exploratory spatial data analysis and a dynamic spatial Durbin model to investigate urban ecological resilience in the Huai River Ecological Economic Belt from 2011 to 2023. The results show the following: (1) Resilience generally improves, but differences within the region increase. Over time, the region forms a stable “core–periphery” spatial pattern. (2) Technological innovation is the main local factor boosting resilience. Industrial upgrading, urbanization, and technological progress have a strong positive impact on neighboring areas. However, economic growth causes negative spillovers, and environmental regulation has a limited cross-regional effect. These findings show complex spatial interactions behind ecological resilience. The study provides practical guidance on strengthening regional cooperation and leveraging innovation to foster high-resilience development.
1. Introduction
The Huaihe River Ecological Economic Belt, a strategically vital region connecting China’s “Belt and Road Initiative” and the Yangtze River Economic Belt, and a main route for the South-to-North Water Diversion Project, faced acute pressures from water scarcity, pollution, and ecosystem degradation amidst its economic development [1,2]. Building the capacity of cities within the basin to withstand, adapt to, and transform in response to these intertwined environmental and economic shocks—a core aspect of “urban ecological resilience”—has thus become a critical imperative for the region’s security and sustainable development.
Within this agenda, “ecological resilience” is crucial. It emphasizes how ecosystems maintain their structure and function while resisting and absorbing external stressors. It also highlights their ability to adapt and reorganize through learning [3,4]. Through such processes, cities can ultimately transition toward more sustainable and desirable states [5]. This focus on resilience aligns with China’s national strategic priorities. The national “Guidelines on Accelerating the Construction of Resilient Cities” (2021) and the subsequent Central Urban Work Conference (2025) explicitly integrated resilient city development into the national urbanization strategy, emphasizing a systematic approach to urban governance. Pioneering cities exemplify this shift. Chengdu, for instance, pioneered the “Park City” model, reshaping the urban–nature relationship through integrated greenway networks and eco-oriented industrial transformation. Meanwhile, Shenzhen exemplified technology-driven resilience, deploying IT and big data across a city-wide ecological monitoring network for real-time early warning and intelligent management of environmental risks.
However, despite these national advances and the conceptual recognition of ecological resilience, significant knowledge gaps persist regarding its manifestation and drivers in strategically important yet understudied basin regions, such as the Huaihe River Ecological Economic Belt. First, while studies acknowledged spatial clustering of resilience, few systematically explained how socioeconomic drivers—such as industrial upgrading or technological innovation—generated spatial spillover effects that shape both local and neighboring cities. Second, research from an integrated basin-wide perspective remained scarce, with existing work often focusing on national scales or on developed urban clusters, thereby overlooking medium-sized basins like the Huaihe River Ecological Economic Belt, which exhibit distinct interconnectedness and internal disparities [6].
This study addresses three core questions for the Huaihe River Ecological Economic Belt. (1) What spatiotemporal patterns define urban ecological resilience? (2) What are the main factors driving these patterns? (3) Do these drivers produce spatial spillover effects across administrative boundaries? Answering these questions is critical for advancing the region’s goal of ecological priority and green development. The answers will provide targeted guidance for cross-jurisdictional governance.
To answer these questions, this study presents a dual-dimensional framework integrating both local effects and spatial spillover effects. Five core drivers—economic development, industrial upgrading, urbanization, environmental regulation, and technological innovation—are analyzed within a unified spatial framework to determine their direct and indirect impacts on resilience. By examining the Huaihe River Ecological Economic Belt, a representative yet understudied basin region, this study aims to offer theoretical insights and practical guidance for cross-regional governance, upstream–downstream collaboration, and approaches to strengthen urban ecological resilience.
2. Literature Review and Hypothesis Development
2.1. The Conceptual Evolution and Assessment of Urban Ecological Resilience
The concept of resilience underwent significant theoretical refinement. Holling (1973) [7] introduced the concept of resilience into the natural sciences. He defined ecological resilience as a system’s ability to regain stability after disturbance [7]. Since then, scholars offered various definitions and frameworks. For example, Pickett et al. (2014) described urban ecological resilience as the resistance, recovery, and adaptability of urban systems to shocks [4]. Over time, the concept of resilience thinking has evolved. It shifted from “engineering resilience,” focused on returning to equilibrium [8], to “ecological resilience,” emphasizing multiple stable states [9], and then to “evolutionary resilience,” which highlights continuous adaptation and transformation [10]. In parallel, evaluation systems advanced from single indicators to multidimensional approaches. The “resistance–adaptation–transformation/recovery” framework gained widespread adoption [11,12]. It captured the full process of ecosystem responses to disturbances. Methodologically, quantitative techniques such as entropy-weighted indices and entropy-weighted TOPSIS were frequently used. For instance, Yu et al. (2025) developed an ecological resilience model and used entropy-weighted TOPSIS to measure resilience across 281 prefecture-level cities in China [13]. These studies provided important references for quantitative assessment. These assessment frameworks provided key tools for quantifying resilience that underpinned the identification of its spatial distribution patterns.
2.2. Identification of Spatial Pattern
The established assessment frameworks enabled numerous studies to delineate the spatiotemporal heterogeneity of urban ecological resilience in various major regions. Research in both the Yangtze River Economic Belt and the Yellow River Basin consistently identified significant spatial disparities and a trend of club convergence, often revealing a distinct “core–periphery” structure [14,15]. Methodologies such as the Theil index [16], standard deviation ellipses [17], the Dagum coefficient [18], and spatial autocorrelation analysis [19] were instrumental in quantifying these patterns, disparities, and clustering effects, offering critical insights into the spatiotemporal evolution of resilience.
Nonetheless, this field of inquiry remains largely descriptive, focused on identifying “where resilience clusters or diverges—using tools like Moran’s I to map its configuration—without sufficiently addressing the underlying causes (“why”). This limitation was particularly evident given that existing research predominantly focused on the national scale or large river systems such as the Yangtze and Yellow Rivers. The Huaihe River Ecological Economic Belt, however, presented a distinct case as a tightly integrated “watershed community” linked by hydrology, industry, and ecological compensation, yet marked by internal disparities [20]. Its emergent spatial pattern should therefore should have been interpreted not as a mere static snapshot, but as a dynamic consequence of endogenous drivers—including industrial structure, innovation, and policy—interacting through spatial externalities. Thus, there was a pressing need to look beyond simplistic attributions to “distance” or “location” and to probe the mechanistic roles of these cross-regional driving factors.
2.3. Key Drivers and the Spatial Externality Mechanism
2.3.1. Effect of Economic Development on Urban Ecological Resilience
In the early stages of economic growth, rising resource demand leads to ecological space encroachment and aggravated pollution, reducing resilience [21]. As economies advance, transitions occur through industrial upgrading, increased environmental awareness, and enhanced fiscal capacity for governance. These factors gradually offset earlier ecological losses and foster a green transition [22]. This progression indicated a U-shaped relationship, marked by an “economic turning point” for resilience, forming the basis for the following research hypothesis.
Hypothesis H1.
Economic development is hypothesized to exert a U-shaped (convex) nonlinear effect on urban ecological resilience.
2.3.2. Effect of Industrial Upgrading on Urban Ecological Resilience
Heavy industries characterized by high energy use and emissions imposed substantial ecological stress [23]. As these are replaced by advanced industrial structures led by high-tech sectors and modern services, efficiency improves, and regional resilience is enhanced through knowledge spillovers and more environmentally friendly production modes [24], thereby providing the basis for the following research hypothesis.
Hypothesis H2.
Industrial upgrading is hypothesized to have significant and positive effects on urban ecological resilience.
2.3.3. Effect of Urbanization on Urban Ecological Resilience
During the early stage of rapid land urbanization, ecological space is reduced and resistance capacity weakened. At this stage, the concentration of people and industries increases emissions beyond environmental thresholds. Although infrastructure upgrades accompanied this phase, negative ecological impacts typically dominated [25], thereby providing the basis for the following research hypothesis.
Hypothesis H3.
Urbanization is hypothesized to have significant and negative effects on urban ecological resilience.
2.3.4. Effect of Environmental Regulations on Urban Ecological Resilience
Stringent regulation, through emission standards, ecological taxation, and environmental investment, first acted to restrain pollution, then stimulated firms’ “innovation compensation” effects [26]. These processes operated via both end-of-pipe treatment and source-level prevention, together enhancing ecological stability and recovery capacity [27] and providing the foundation for the following research hypothesis.
Hypothesis H4.
Stronger environmental regulation is hypothesized to have significant and positive effects on urban ecological resilience.
2.3.5. Effect of Technological Innovation on Urban Ecological Resilience
Green innovation provided advanced solutions for energy conservation, emission reduction, resource cycling, and ecosystem restoration. Such innovations directly alleviated ecological pressure [28]. Subsequently, broader technological progress improves total factor productivity. This progression enabled transitions away from extensive growth models and offered sustained momentum for resilience [29], forming the basis for the following research hypothesis.
Hypothesis H5.
Technological innovation is hypothesized to have significant and positive effects on urban ecological resilience.
2.3.6. Spatial Spillover Effects
Because natural ecosystems were interconnected and people’s activities had a ripple effect, ecological resilience revealed spatial links [30]. It yielded benefits, such as improved environments resulting from sharing knowledge or working together, but it also posed problems, including the spread of pollution or the emergence of new risks that migrate from one area to another. Building on this, we propose the following hypothesis:
Hypothesis H6.
Urban ecological resilience is hypothesized to exhibit significant spatial dependence.
The determinants of urban ecological resilience are theorized to generate complex spatial spillover effects that transcend administrative boundaries. Specifically, economic development may exert negative spillovers by creating a “siphon effect,” in which advanced cities attract green talent and capital from neighbors, and by potentially relocating polluting activities to less developed areas [31]. Industrial upgrading has negative effects, as core cities may relocate phased-out, polluting industries to neighboring regions with less stringent environmental regulations, creating a “pollution haven” [32]. Urbanization may generate negative spillovers by exporting environmental pressures, such as increased waste, traffic congestion, and resource scarcity, to surrounding areas [33]. Environmental regulation can produce positive spillovers through policy imitation and a “race to the top,” in which stringent standards in one city pressure neighboring governments to strengthen their own regulations [34]. Technological innovation has positive spillovers, as green technologies and knowledge diffuse across regions through patents, talent mobility, and inter-firm collaboration, thereby enhancing collective resilience [35]. Green technologies spread across regions through patents, people moving, and companies working together, which helped all regions become more resilient [31]. Based on the above discussion, we advance the following hypothesis:
Hypothesis H7.
The determinants of urban ecological resilience are hypothesized to generate complex spatial spillover effects.
Hypothesis H7a.
Economic development is hypothesized to have significant and negative spatial spillover effects on urban ecological resilience.
Hypothesis H7b.
Industrial upgrading is hypothesized to have significant and negative spatial spillover effects on urban ecological resilience.
Hypothesis H7c.
Urbanization is hypothesized to have significant and negative spatial spillover effects on urban ecological resilience.
Hypothesis H7d.
Environmental regulation is hypothesized to have significant and positive spatial spillover effects on urban ecological resilience.
Hypothesis H7e.
Technological innovation is hypothesized to have significant and positive spatial spillover effects on urban ecological resilience.
3. Data Sources and Methodology
3.1. Research Area
Based on the “Huaihe River Ecological Economic Belt Development Plan”, this study identified the research area as 25 prefecture-level cities distributed across Jiangsu, Anhui, Shandong, and Henan Provinces. The region formed a river-basin economic system in which ecological integrity and socio-economic development were deeply intertwined. This unique context offered an excellent case for analyzing the spatial and temporal dynamics of urban ecological resilience. The study period covered 2011 to 2023.
The year 2011 marks the starting point, as it signifies the beginning of China’s 12th Five-Year Plan, the first to emphasize “green development” and a resource-saving, eco-friendly society. This marked the beginning of a new phase in China’s ecological progress. Using this baseline helped show how national policy shaped ecological resilience in the region. Since 2011, China has enhanced its environmental data systems, releasing indicators such as PM2.5 and detailed pollution data, thereby increasing the reliability of the data. Extending the study to 2023 allowed it to cover post-pandemic issues, such as economic recovery and ecological protection, thereby enhancing its policy relevance.
3.2. Variable Selection
3.2.1. Dependent Variable: Comprehensive Urban Ecological Resilience Index
Building on the principles of evolutionary resilience theory, this study developed a three-dimensional analytical framework. It consisted of resistance, adaptability, and transformability. Resistance captured the ability of urban ecosystems to absorb shocks and prevent functional decline [36]. It was largely determined by ecological assets such as green spaces, forests, and water bodies. In our indicator system (Table 1), this dimension was operationalized through metrics that quantified the city’s natural capital stock. These included per capita park green space, built-up area green coverage rate, and water area ratio. These elements constituted the fundamental “green infrastructure” that physically buffered the city against disturbances. We specifically included the proportion of protected areas, as this reflected the most stable and legally secured core of natural capital. This provided essential insurance against biodiversity loss and ecological degradation. Adaptability referred to a city’s capacity to adjust its structures, policies, and behaviors in response to gradual pressures [37]. This was reflected in pollution control, resource circulation, and institutional responses. To measure proactive governance and management capacity, our framework used indicators such as the comprehensive utilization rate of industrial solid waste, urban sewage treatment rate, and the proportion of environmental protection expenditure. These metrics directly reflected operational efficiency and financial commitment in mitigating pollution and managed resource flows. They represented the system’s active efforts to maintain equilibrium. Transformability referred to the fundamental ability to break unsustainable development trajectories and created new pathways through knowledge innovation, technological advancements, and institutional reform [12]. Unlike traditional recovery-oriented resilience, transformability emphasized “building back better”. This was driven by factors such as human capital and R&D investment. These enable cities to turn crises into opportunities for sustainable development [38]. Accordingly, we gauged this forward-looking capacity through indicators that signaled a socio-ecological shift. The number of green patents captured innovation explicitly directed toward environmental solutions. The number of college students proxied the long-term human capital base for knowledge absorption and creation. The proportion of high-tech enterprises indicated an economic restructuring towards a more innovative and potentially less resource-intensive paradigm.

Table 1.
Evaluation indicator system of urban ecological resilience.
This three-part model clarified how urban ecosystems operated and offered practical recommendations for city leaders (see Table 1). Leaders should move from reactive crisis management to integrating resilience and sustainability into long-term urban planning and policy.
3.2.2. Core Explanatory and Control Variables
To test the theoretical framework, several core explanatory variables were selected. Economic development was measured by real per capita GDP and its squared term, capturing non-linear effects and assessing the Environmental Kuznets Curve (EKC) hypothesis [39]. This variable clarified how development stages affect ecological outcomes, as posited by the framework. Industrial upgrading was measured by the ratio of value added in the tertiary sector to the secondary sector, indicating progress in industrial upgrading and the green transition. A higher ratio indicated a shift toward services, which the framework associates with increased ecological resilience [40]. Urbanization was represented by the proportion of built-up land area to total municipal land, reflecting the intensity of urban spatial expansion [41]. The framework holds that increasing urbanization encroaches on ecological land and fragments habitats, potentially weakening ecological resistance. Environmental regulation intensity was measured by the share of investment in pollution control within local public spending. This metric demonstrates governmental commitment and regulatory capacity, directly supporting the framework’s ecological goals [42]. Technological innovation capacity was reflected in the number of invention patents granted per 10,000 residents, indicating regional knowledge creation and innovation strength, which were key to green transformation and ecological adaptability within the framework [43].
Control variables were included. Ecological endowment is proxied by the normalized difference vegetation index (NDVI), which quantifies terrestrial vegetation, relevant for assessing natural ecological resources within the framework [44]. Infrastructure was measured by per capita urban road area to reflect accessibility and physical development, both of which potentially affected urban ecological dynamics [45]. Openness is indicated by the ratio of total imports and exports to GDP. Population density was measured as the number of permanent residents per square kilometer of the built-up area. This measure accounts for agglomeration effects and environmental pressures, which are fundamental drivers of both economic activity and ecological stress [46].
All data were obtained from authoritative statistical yearbooks and official bulletins to ensure accuracy and consistency (Table 2).
Table 2.
Index of influence factors of urban ecological resilience.
3.3. Data Sources
The dataset covered 25 prefecture-level cities across Jiangsu, Shandong, Henan, Anhui, and Hubei Provinces within the Huaihe River Ecological Economic Belt for the years 2011–2023. However, areas with significant data gaps, such as Tongbai County, Dawu County, and Guangshui City, were excluded. As a result, a balanced panel dataset of 325 observations was ultimately constructed. Data were primarily obtained from the annual editions of the “China Urban Statistical Yearbook” covering the period 2011–2023 (Note: The 2024 edition, which contains the official 2023 data, is the source for the most recent observations), the “China Urban Construction Statistical Yearbook”, as well as local statistical and environmental bulletins. The normalized vegetation index (NDVI) was a 30 m resolution dataset sourced from the Resource and Environmental Science Data Center of the Chinese Academy of Sciences (http://www.resdc.cn/). All monetary data were deflated to 2011 constant prices.
Owing to the very low proportion and random distribution of missing values across all variables (Appendix A, Table A1), missing data were imputed using linear interpolation, a method appropriate for the gradual evolution of time-series data [47]. he robustness of this approach was rigorously evaluated via a sensitivity analysis, wherein the model estimates from the interpolated data were compared against those from a complete-case analysis (i.e., with missing values deleted). The results demonstrated no substantive differences in the magnitude, direction, or significance of the core explanatory variables’ coefficients between the two approaches (Appendix A, Table A2), and affirmed the robustness of our primary conclusions. We were therefore confident that linear interpolation has not materially biased the estimation results of the Spatial Durbin Model.
3.4. Methodology
3.4.1. Urban Resilience Evaluation Model
To objectively evaluate urban resilience, this study employed the entropy-weighted TOPSIS method [13]. Assuming the research period was t years, the number of cities was n, and the number of indicators was m, a three-dimensional data matrix X = (xtij)n × t × p was constructed, where xtij denoted the original value of the j-th indicator for the i-th city in the t-th year. Given that the indicators possessed different units and orders of magnitude, which necessitated standardization, the min-max method was employed to prevent potential distortions caused by zero values in the information entropy calculation.
In Equation (1), x′ij is the standardized index value, xij is the original data of the j-th indicator of the i-th city, max(xj) and min(xj) are the maximum and minimum values, respectively, of the j-th index.
Then, the proportion of the i-th city in the j-th indicator was determined as follows:
The information entropy value of the j-th index ej was obtained as:
The difference coefficient of the j-th index was calculated as:
The index weight value ωj was computed as:
The comprehensive score zi was calculated as:
3.4.2. Kernel Density Estimation
Building on this evaluation, kernel density estimation—a non-parametric method—constructed a continuous probability curve to describe the distribution of random variables [48]. By plotting kernel density curves for different years, we were able to visualize the spatial distribution, shape, and polarization tendencies of urban ecological resilience over time. This provided clear insights into the dynamic evolution of absolute disparities among cities.
3.4.3. Exploratory Spatial Data Analysis
- (1)
- Global Spatial Autocorrelation (Moran’s I)
To measure the degree of spatial correlation, we calculated Moran’s I, which ranges between −1 and 1 [49]. A significantly positive value indicates spatial clustering, while a significantly negative value suggests spatial heterogeneity. A value close to zero reflects randomness. The formula for calculating Moran’s I is as follows:
where n refers to the total number of spatial units analyzed; Wij denotes the spatial weight between unit i and unit j as specified in the spatial weight matrix W; Ri and Rj represent the index values for the i-th and j-th units, respectively; is the mean value of the index across all units; and s2 indicates the variance of the index values.
- (2)
- Local Spatial Autocorrelation
We further explored local spatial dynamics using the local Moran’s I. This method allowed us to detect geographic clusters such as “high–high” (hot spots) or “low–low” (cold spots), as well as areas of divergence (“high–low” or “low–high”). By constructing cluster maps, we were able to more precisely identify the spatial concentration and differentiation of urban ecological resilience.
- (3)
- Construction of an Improved Spatial Weight Matrix
To better capture inter-city spatial interactions, we developed an “economic-geographic distance” matrix. Specifically, we defined the spatial weight between two cities as a function of both the distance between their administrative centers and the difference in per capita GDP. This matrix incorporated the economic disparity component using a Gaussian kernel function, constructed as follows:
As a next step, to mitigate the sensitivity of absolute differences to scale, economic distance was primarily measured by the logarithmic difference in per capita GDP between cities:
Furthermore, a Gaussian kernel was employed to rescale the economic distance, thereby mitigating the problem of excessive weights arising from infinitesimal economic differences.
Here, the bandwidth parameter σ was set to the standard deviation of economic disparities across all city pairs, thereby ensuring the function’s responsiveness to the underlying data distribution. Subsequently, the normalized economic weights were integrated with the geographical weights.
Afterward, these integrated economic and geographical components were combined to synthesize the final spatial weight matrix, marking the transition to matrix construction.
where dij represented the distance between the regional administrative centers of unit i and unit j, while ei and ej denoted the average real GDP per capita of the i-th and j-th units, respectively.
Finally, to ensure comparability, the synthesized spatial weight matrix was row-standardized so that the weights for each city summed to 1.
This design reflected both physical distance and economic similarity, consistent with theoretical insights that ecological spillovers spread not only through geographic channels, such as pollution diffusion and ecological flows, but also through economic linkages, including policy learning, technological spillovers, and industrial relocation [50]. To validate robustness, results were compared with those from a purely geographic distance matrix.
3.4.4. Dynamic Spatial Durbin Model
To account for the dual temporal and spatial dimensions of urban ecological resilience, we adopted the dynamic spatial Durbin model (SDM). Traditional panel models neglect spatial dependence, while static spatial models fail to incorporate temporal persistence [51]. The dynamic SDM addressed both by including spatial and temporal lags of the dependent variable, thereby offering a richer understanding of spatiotemporal interactions.
The model can be expressed as:
Here, UER represented urban ecological resilience, X denoted explanatory variables (including control variables), ρ was the spatial correlation coefficient, and Wij was the spatial weight matrix. City-specific and time-specific effects were denoted by and . was the spatial error term.
A key feature of the DSDM is that the estimated coefficients (β for explanatory variables and θ for spatially lagged variables) could not be interpreted directly as marginal effects (i.e., immediate, one-to-one impacts). Instead, changes in explanatory variables affected not only the local unit but also propagated through neighboring regions via spatial feedback (reciprocal impacts between areas). Following LeSage and Pace [52], we therefore decomposed effects into direct impacts (within-region effects) and indirect impacts (spillovers to other regions).
4. Empirical Results and Analysis
4.1. Spatiotemporal Dynamics of Urban Ecological Resilience
4.1.1. Temporal Patterns of Urban Ecological Resilience
The spatiotemporal dynamics of urban ecological resilience in the Huaihe River Ecological Economic Belt from 2011 to 2023 were systematically examined. Using the entropy-weighted TOPSIS method—a multi-criteria decision-making approach that assigned indicator weights based on data variability—the overall resilience level exhibited a sustained upward trend, with the average index rising from 0.318 in 2011 to 0.453 in 2023, corresponding to a growth rate of 42.5%. During the research period, the median line showed an overall fluctuating but moderately increasing trend. This suggested that urban ecological resilience generally improved over time. The improvement was likely due to policy interventions, ecological protection, and sustainable urban development projects. The gap between the mean and median values widened, indicating that some cities achieved much greater resilience gains than others (Figure 1).
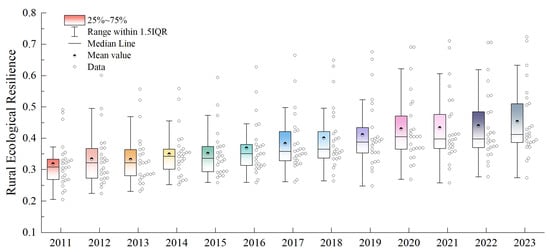
Figure 1.
Trends of urban ecological resilience in the Huaihe River Ecological Economic Belt from 2011 to 2023.
The spatiotemporal trends in urban ecological resilience were analyzed using kernel density estimation. As a non-parametric technique, this method was particularly well-suited for estimating the distribution patterns and dynamic evolution of continuous random variables. A comparison of the kernel density curves for the four key benchmark years—2011, 2015, 2019, and 2023—revealed significant and systematic changes in their distribution characteristics. Specifically, the distribution center of the density curves showed a distinct rightward shift, indicating a systematic improvement in the overall level of urban ecological resilience. Meanwhile, the width of the primary peak of the distribution noticeably narrowed, suggesting that the distribution of resilience values among cities transitioned from a relatively dispersed state in the early period to a more convergent pattern, with regional absolute differences tending to decrease. Furthermore, the distribution morphology evolved from a potentially broad or slightly multi-peaked pattern in the early years to a distinct unimodal distribution. This series of changes clearly demonstrated that the developmental path of urban ecological resilience in the Huaihe River Ecological Economic Belt shifted from an initially diversified and uneven mode to one of overall balance and synergistic enhancement (Figure 2).
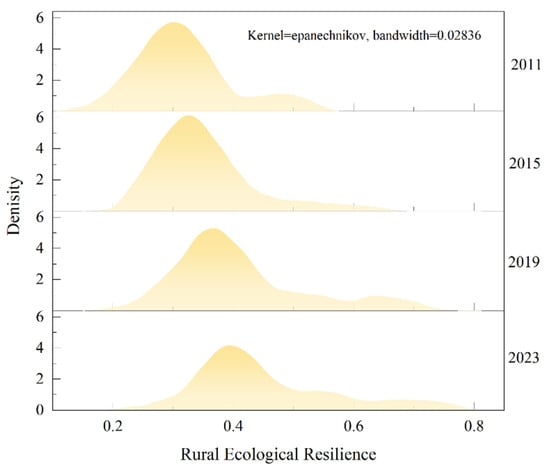
Figure 2.
Kernel density distribution of urban ecological resilience in the Huaihe River Ecological Economic Belt for Specific Years.
4.1.2. Spatial Patterns of Urban Ecological Resilience
Using ArcGIS 10.7 with the natural breaks method, resilience scores were classified and mapped (Figure 3) to examine spatial evolution. Spatially, resilience exhibited pronounced non-uniformity and hierarchical patterns.
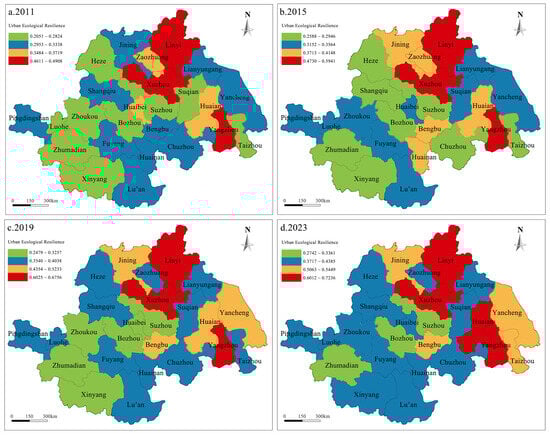
Figure 3.
Spatial distribution of urban ecological resilience in the Huaihe River Ecological Economic Belt for Specific Years.
High-resilience clusters were consistently concentrated in the areas surrounding Linyi, Xuzhou, and Yangzhou. These cities maintained leading positions throughout the study period, forming regional growth poles. Cities such as Huaian, Jining, and Bengbu formed a secondary tier of high resilience. They also displayed notable catch-up momentum. Conversely, upstream and midstream cities, including Bozhou, Suzhou, and Zhumadian, remained at relatively low resilience levels despite absolute improvements. This reflected strong path-dependent “lock-in” effects. At the provincial scale, cities in Jiangsu showed higher and more balanced resilience. Shandong exhibited polarization, with Linyi being the dominant area. Anhui and Henan demonstrated marked intra-provincial disparities.
These spatial patterns resulted from the combined effects of economic capacity, policy resources, and geographic location. Economically developed regions were better equipped to invest in ecological infrastructure and green industrial transformation, while regional central cities attracted concentrated policy support. Conversely, peripheral areas faced both economic and environmental pressures, leading to relative lagging behind. To achieve high-quality development throughout the Huaihe River Ecological Economic Belt, it was crucial to actively address path dependence and implement coordinated strategies that ensured a more equitable spatial distribution of resilience gains.
4.2. Spatial Evolution of Urban Ecological Resilience
Using an economic-geography-based spatial weight matrix, the spatial associations of urban ecological resilience across the Huaihe River Ecological Economic Belt were examined.
4.2.1. Global Spatial Patterns
Global Moran’s I statistics, which measured spatial autocorrelation, indicated significant, increasingly stronger positive spatial autocorrelation in urban ecological resilience across the 2011–2023 period (Table 3), confirming H6. As illustrated in Table 3, the index demonstrated a clear upward trajectory, rising from 0.227 in 2011 to a peak of 0.294 in 2023. This consistent year-on-year growth signified intensifying spatial clustering and regional convergence. This trend likely reflected the cumulative effects of deepening regional integration, particularly the establishment of ecological compensation mechanisms and joint green infrastructure initiatives. A key catalyst in this process was the “Huaihe River Ecological Economic Belt Development Plan” implemented in 2018, which provided a formal framework for cross-city cooperation and was evident in the sustained higher levels of spatial synergy observed in the post-2018 data.
Table 3.
Global Moran’s I index of urban ecological resilience in the Huaihe River Ecological Economic Belt.
4.2.2. Local Spatial Patterns
Local Moran’s I analysis, which identified spatial clusters or outliers, revealed expanding high–high (H-H) clusters downstream and contracting low–low (L-L) clusters upstream and midstream, illustrating positive spatial spillover effects and gradual mitigation of resilience deficits in marginal areas (Figure 4). These patterns underscored the combined influence of economic development, policy endowments, and geographic location, highlighting the need to break path dependencies and promote the spatial diffusion of resilience gains to support high-quality, coordinated regional development.
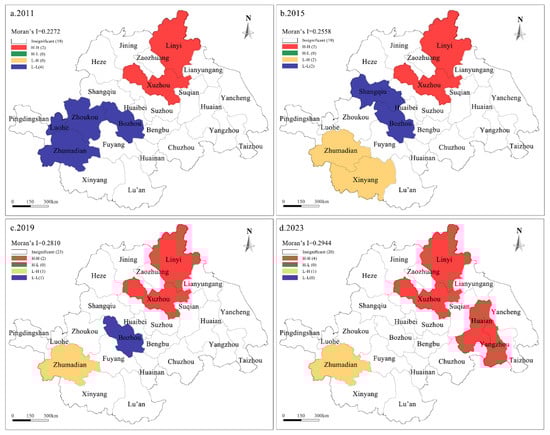
Figure 4.
LISA cluster map of the urban resilience level in Huaihe River Ecological Economic Belt from 2011 to 2023.
4.3. Drivers of Urban Ecological Resilience and Spatial Interactions
4.3.1. Model Selection and Diagnostics
- (1)
- Multicollinearity Test
Prior to spatial econometric modeling, we examined potential multicollinearity among the independent variables using Variance Inflation Factors (VIF). As reported in Table 4, all VIF values were substantially below the conservative threshold of 5. This confirmed that severe multicollinearity was not present and would not bias the estimation results of subsequent spatial models.
Table 4.
Results of VIF test.
- (2)
- Spatial Dependence and Model Selection
The global Moran’s I statistic indicated significant spatial autocorrelation in urban ecological resilience, underscoring the need for spatial econometric modeling. We followed Elhorst’s systematic approach to select the most appropriate model [53]. Lagrange multiplier tests robustly rejected the null hypothesis of no spatial autocorrelation (Table 5), invalidating conventional panel models. We then estimated a general Spatial Durbin Model (SDM). Both Wald and likelihood ratio tests rejected the simplification of the SDM to either the spatial lag model (SLM) or the spatial error model (SEM), confirming the SDM’s superiority in capturing the region’s complex spatial spillovers. Finally, a significant Hausman test (p < 0.01) supported the use of fixed effects over random effects [54]. Consequently, a two-way fixed-effects SDM with a geo-economic distance spatial weight matrix was selected as the optimal baseline model.
Table 5.
Results of spatial regression models.
- (3)
- Residual Distribution Diagnostics
After estimating the selected two-way fixed-effects SDM, we diagnosed the distribution of its residuals. A Breusch-Pagan test yielded a p-value of 0.125. This result failed to reject the null hypothesis of homoscedasticity. The residuals approximately followed a normal distribution and displayed no clear pattern of heteroscedasticity. These results indicated that the model’s residual distribution met the key classical assumptions.
- (4)
- Residual Spatial Autocorrelation Test
The critical final step was to verify whether the chosen SDM had fully absorbed spatial dependence in the data. We computed the Global Moran’s I for the regression residuals of the baseline model. The result was non-significant (Moran’s I = −0.021, p-value = 0.315). This provided strong evidence that the residuals were spatially random. This completed the diagnostic logic. The initial significant spatial autocorrelation in the dependent variable had been successfully captured and explained by the SDM’s spatial econometric structure. This finding validated our model specification as sufficient and reliable.
4.3.2. Estimation Results of the Spatial Econometric Model
This study employed a suite of SDMs to rigorously examine the drivers of urban ecological resilience and their spatial interactions. To do so, our modeling strategy involved estimating both static and dynamic specifications using three spatial weight matrices. Based on systematic model comparison diagnostics, we selected the models incorporating the geo-economic nested distance matrix as our baseline due to their optimal performance. Accordingly, Table 6 reported the results from these static and dynamic SDMs. For completeness and to verify robustness, results from models utilizing pure geographic and economic distance matrices were archived in Appendix A Table A3.
Table 6.
Estimation results of spatial Durbin model.
Building on this foundation, in all models, the spatial autoregressive coefficient (ρ) was positive and statistically significant at the 1% level. This provided further evidence that, after accounting for various driving factors, urban ecological resilience in the Huaihe River Ecological Economic Belt exhibited robust positive spatial dependence. In other words, the development of ecological resilience in this region was not isolated but involved substantial regional linkages and cooperative effects, once again confirming Hypothesis H6.
In the dynamic models, the lagged dependent variable (LnUERt−1) had a significant positive coefficient, indicating clear temporal path dependence. This meant resilience in the previous period strongly influenced the current period, showing ecological resilience persisted over time.
Building on these findings, the goodness-of-fit (R2) for all models exceeded 0.7, indicating strong explanatory power. Notably, the models based on the geo-economic distance matrix exhibited the highest R2 values, indicating that this matrix best reflected the complex spatial interactions were present in the region. Consequently, it was used as the baseline for subsequent analyses.
4.3.3. Decomposition of Direct and Spillover Effects
Further, using a partial differential approach, we decomposed the direct and spatial spillover effects of all variables (Table 7). Results from the spatial effect decomposition confirmed a significant negative direct effect of economic development (lnGDP) on local ecological resilience (β = −0.214, p = 0.006). To rigorously validate the hypothesized U-shaped relationship, we followed the procedure recommended by Lind & Mehlum [55]. The analysis confirmed a statistically significant U-shape. The calculated turning point is at a per capita GDP of 40,355 RMB. Importantly, the 95% confidence interval for this turning point lay entirely within our data range. The sample distribution around this turning point was also meaningful: approximately 76.61% of city-year observations were on the left side of the curve, while 24.39% are on the right.
Table 7.
Results of spatial effect decomposition.
This U-shaped pattern provided nuanced evidence that resonated with the Environmental Kuznets Curve (EKC) hypothesis in the context of ecological resilience. For the majority (76.61%) of cities yet to reach the turning point, the dominant “scale effect” of economic expansion was likely to intensify resource consumption and pollution, outweighing any positive “technical effect” and thus suppressing local resilience. However, for the 24.39% of cities that have surpassed this development threshold, our findings suggested that the ongoing economic growth had begun to align with, and even enhance, ecological resilience. This shift potentially stemmed from increased investment in green infrastructure, the adoption of advanced technologies, and a structural transition towards a more service-oriented economy. Therefore, Hypothesis H1 was supported.
The direct effects of industrial upgrading (lnIU) and environmental regulation (lnER) were both significantly negative (β = −0.135, p < 0.061; β = −0.130, p < 0.011, respectively). At the present stage of development, increases in the share of the tertiary sector and stricter environmental policies have not contributed to improvements in local urban ecological resilience. Instead, these factors might have exerted pressure due to extensive development patterns. Accordingly, Hypotheses H2 and H4 were not supported. In industrial upgrading, the negative association might have stemmed from the fact that the measured expansion of the tertiary sector (lnIU) in our sample was primarily driven by resource-intensive service industries (e.g., traditional commerce, transportation), rather than by knowledge-intensive or low-pollution services. Regarding environmental regulation, the immediate compliance costs imposed on firms might have outweighed the short-term benefits, potentially inhibiting productive investment and temporarily increasing negative pressure on resilience. Furthermore, the possibility of a non-linear relationship or a time-lag effect could not be ruled out, where benefits only materialized after a certain threshold or time period, which our current linear model might not have captured.
Urbanization level (lnUL) had a significantly negative direct effect (β = −0.196, p < 0.004). The rapid expansion of built-up areas at that time suppressed local ecological resilience. Thus, Hypothesis H3 was confirmed. In contrast, technological innovation (lnTI) exerted a significantly positive direct effect (β = 0.159, p < 0.009). This confirmed that innovation was a primary driver of local ecological resilience, supporting Hypothesis H5.
Analysis of spatial spillover effects revealed complex interregional interactions among driving factors. Economic development (lnGDP) had a significant negative spillover effect (β = −0.194, p < 0.014), supporting for Hypothesis H7a. This suggested that local economic growth might have imposed competitive or siphoning pressures on neighboring cities. In contrast, industrial upgrading (lnIU) and urbanization (lnUL) showed significant positive spillover effects (β = 0.220, p < 0.009; β = 0.315, p < 0.003). Thus, Hypotheses H7b and H7c were not supported. A city’s industrial upgrading and urban growth could not have benefited surrounding areas through knowledge diffusion and functional redistribution. Technological innovation (lnTI) also showed a significant positive knowledge spillover, supporting Hypothesis H7e. This emphasized the value of regional collaborative innovation. However, environmental regulation (lnER) showed no statistically significant spillover effect (β = 0.069, p < 0.001), thus, Hypotheses H7d was not supported. This suggested that cross-regional coordination of environmental policy had yet to materialize.
Beyond statistical significance, the magnitude of the direct and spillover effects revealed the practical importance of each driver in shaping urban ecological resilience. Technology Innovation (lnTI) was the most robust and positive driver. It had the largest positive direct effect among all variables. A 1% increase in local R&D investment and patent output was linked to a 0.159% increase in local ecological resilience. The positive and highly significant spillover and total effects further confirmed that technological progress was not just a local solution but also a regional asset. It generated knowledge spillovers that benefited neighboring cities.
Economic Development (lnGDP) and Urbanization Level (lnUL) presented the most substantial challenges at the local level. Both factors have the strongest negative direct effects. This underscored that the current patterns of economic growth and urban land expansion were the primary sources of pressure on local ecological systems. However, their spatial stories differed. Urbanization showed a strong positive spillover effect, suggesting that while a city’s own sprawl was detrimental, the growth of neighboring cities might have been associated with functional complementarity (e.g., industrial transfer) that benefited the focal city. In contrast, the significant negative spillover from economic development pointed to a “siphoning effect,” in which one city’s growth competed with its neighbors for resources.
Industrial Upgrading (lnIU) played a paradoxical but ultimately positive role. Its negative direct effect suggested potential short-term costs or the prevalence of low-value-added services in the local tertiary sector. However, it possessed the second-largest positive spillover effect, indicating that a city’s industrial transformation could have significantly boosted the ecological resilience of its neighbors, likely through industrial chain cooperation and demonstration effects. The positive total effect confirmed its net benefit at the regional scale.
Environmental Regulation (lnER) had a significant negative direct effect, with no compensating positive spillover, resulting in an insignificant total effect. This implied that the current regulatory approach may primarily have served as a cost burden on local economies, without effectively stimulating innovation or fostering regional coordination.
In summary, the effect size analysis clearly prioritized technology innovation as the most potent and unambiguously positive lever for enhancing resilience. Meanwhile, rethinking the quality of economic growth and urban expansion was the most critical task for mitigating local ecological pressure. The significant spatial spillovers associated with most factors underscored that regional policy coordination was not just beneficial but essential for achieving ecological resilience in the Huaihe River Economic Belt.
4.3.4. Robustness Tests
To assess the reliability of the spatial econometric results, we performed a series of robustness checks. Six regression models were constructed by altering model specifications and spatial weight matrices. Specifically, we included both a static SDM and a dynamic SDM with a lagged dependent variable (lnUER) to address potential endogeneity in ecological resilience. For spatial structure, we used three types of weight matrices: geographic distance, economic distance, and a geo-economic nested distance matrix. The estimation results for all six models, presented in Table 6 and Appendix A Table A3, displayed strong consistency.
To further address potential concerns about omitted variables—particularly those related to demographic pressure, human capital, and governmental capacity—we conducted an additional robustness check by incorporating population density, education level (measured by the proportion of population with college education), and fiscal capacity (measured by local general budgetary expenditure as a share of GDP) as supplementary controls. The results of this expanded specification (Model 7 in Table 6) confirmed that the inclusion of these additional variables did not alter the significance or direction of our core explanatory variables.
In all models, the spatial autoregressive coefficient (ρ) was consistently and significantly positive at the 1% level, indicating that urban ecological resilience showed strong and stable spatial dependence. This central finding persisted regardless of model specification or spatial weighting. Furthermore, the main explanatory variables maintained their coefficients’ signs and statistical significance, reinforcing the robustness of our findings. Collectively, these results confirmed that the empirical conclusions regarding factors that shape urban ecological resilience in the Huaihe River Ecological Economic Belt were reliable, robust, and resilient to alternative model assumptions.
5. Discussion
This study empirically analyzed the spatiotemporal evolution and drivers of urban ecological resilience in the Huaihe River Ecological Economic Belt, uncovered the region’s complex dynamics and influencing factors. These results prompted several important discussions.
5.1. The Coexistence of Growth and Polarization in Resilience
Our analysis revealed a critical trend: the aggregate urban ecological resilience improved significantly. At the same time, the disparities among cities widened. This pattern suggested that the drivers of ecological resilience may be subject to a “Matthew Effect” [56], similar to patterns in economic development. Initially, advantaged core cities like Linyi and Xuzhou entered self-reinforcing cycles of improvement. In contrast, peripheral regions faced significant challenges in catching up. This trend challenged the assumption that overall growth leads to equitable development. It underscored the need for governance frameworks to include equity-oriented instruments—such as targeted fiscal transfers and capacity-building programs for lagging regions—to prevent a permanent resilience gap from forming.
5.2. Path Dependence and the Lock-In of Spatial Hierarchies
The stable core–periphery structure provided a clear example of path dependence in regional ecological development. Downstream cities’ sustained advantage likely stemmed from historically accumulated investments, infrastructure, and policy networks [57]. This finding suggested that, without deliberate intervention to break these path dependencies, the spatial hierarchy risks becoming locked in. Therefore, our results called for transformative policies—for instance, major cross-regional ecological restoration projects or governance reforms that allocate resources and authority to upstream areas—to effectively disrupt established patterns rather than merely implementing incremental changes.
5.3. Direct Effects of Driving Factors
The U-shaped relationship between economic development and resilience provided empirical support for the Environmental Kuznets Curve (EKC) hypothesis within the basin. A pivotal nuance, however, was that most cities remained on the downward-sloping segment of the curve. This indicated that, for the majority, the negative scale and composition effects of economic growth overwhelm the positive contributions of technological advancement and structural change—a situation contrasting with more developed economies that have surpassed the EKC turning point. The negative direct effects of industrial upgrading and environmental regulation presented a paradox. The adverse impact of industrial upgrading likely reflected the dominance of low-value-added, potentially polluting services within the expanding tertiary sector, rather than a shift toward high-end green industries [58]. Similarly, the negative effect of environmental regulation may have been attributed to the prevalence of simplistic, costly command-and-control measures that impose compliance burdens without inducing innovation, aligning with the distinction made by the Porter Hypothesis [42]. These results pointed to a lack of policy sophistication and highlighted the need for smarter, innovation-inducing policy designs. In this context, technological innovation stood out as the sole driver with an unambiguously positive and robust direct effect, cementing its role as a fundamental force for decoupling economic activity from environmental degradation. This finding provided compelling evidence for policies that prioritize R&D and the diffusion of green technology. For example, the rise of the digital economy could facilitate green development by driving technological progress, thereby boosting regional ecological resilience [59].
5.4. Synergy and Competition in Spatial Interactions
The confirmed strong spatial dependence highlighted that ecological resilience is a regionally interconnected phenomenon. Spillover effects acted as a “double-edged sword.” Positive spillovers from industrial upgrading, urbanization, and innovation suggest regional synergies through knowledge diffusion and complementarity. Conversely, the negative spillover from economic development revealed competitive “siphoning effects,” where a city’s growth attracted key resources (e.g., talent, green investment) away from its neighbors [60]. This tension between synergy and competition reflected the complex reality of regional interaction. It implied that regional coordination policies must not only foster cooperation but also address negative competitive externalities, potentially through benefit-sharing mechanisms.
6. Conclusions and Police Implication
6.1. Conclusions
Using panel data from 2011 to 2023, this study applied the entropy-weighted TOPSIS method, spatial autocorrelation analysis, and dynamic spatial Durbin models. The goal was to investigate the spatiotemporal dynamics and determinants of urban ecological resilience in the Huaihe River Ecological Economic Belt. The main conclusions were as follows:
(1) Regional ecological resilience generally improved over time. At the same time, the gaps among cities widened. Despite an upward trend, disparities within the region continued to increase. This indicated a polarization trend, suggesting that ecological resilience gains were not evenly distributed.
(2) The region had a persistent “core–periphery” structure. High-resilience cities, such as Linyi, Xuzhou, and Yangzhou, consistently formed the core. Upstream peripheral cities remained at low levels of resilience. This pattern showed path dependence and a rigid spatial hierarchy.
(3) Urban ecological resilience was strongly interdependent. High–high clusters expanded, showing positive spatial spillovers, while low–low clusters kept localized “resilience depressions.”
(4) Drivers of Resilience: The determinants of ecological resilience were complex and showed different effects locally and across neighboring cities. At the local level, economic development had a U-shaped relationship with resilience. Industrial upgrading, urban expansion, and environmental regulation suppress local resilience. In contrast, technological innovation consistently promoted resilience and served as the primary local driver. At the spatial level, industrial upgrading, urbanization, and technological innovation generated significant positive spillovers, fostering regional collaboration. Meanwhile, economic growth created negative spillover effects, and the cross-regional impact of environmental regulation was insignificant.
6.2. Policy Recommendations
Based on these conclusions, we recommend actions to strengthen the ecological resilience of the Huaihe River Ecological Economic Belt and support balanced, high-quality regional development:
- (1)
- Differentiated and Targeted Regional Governance
Effective regional governance must adopt a differentiated strategy, tailoring support to high- and low-resilience cities. This means “growth poles” like Xuzhou, Linyi, and Yangzhou should not only focus on their own green transition. They should also establish concrete “pairing assistance” mechanisms. Examples include co-building industrial parks in enclaves, forming joint ventures, and providing technical assistance to support less resilient neighbors. At the same time, for low-resilience “depressions” like Bozhou and Suzhou, support should shift. Move from general fiscal transfers to targeted investments in specific, high-impact ecological projects, such as advanced sewage treatment, wetland restoration, and eco-agriculture demonstration zones. These projects are critical to breaking the “poverty-environment” trap. They will generate local green employment and directly enhance ecological conditions.
- (2)
- A Coordinated Governance Framework with Specific Institutions
To promote cross-regional cooperation and reduce the “siphoning effect” of central cities, a robust governance framework is needed. This framework should include concrete institutional arrangements. First, create a “Huaihe River Basin Ecological Compensation Fund”. This fund should operate on the “beneficiaries pay, protectors benefit” model. Downstream beneficiaries provide financial transfers to upstream conservers. A third party will quantify ecological assets and monitor compliance. Second, establish a legally empowered “Joint Regional Planning Committee” with city representatives. This committee will enforce binding regional environmental plans and unified industrial access standards. Third, encourage “chain integration” to shift from competition to complementarity. Guide core cities (like Xuzhou and Yangzhou) to focus on R&D and marketing. Peripheral cities should host supporting manufacturing and eco-tourism. Also, promote the “enclave economy” with tax and GDP sharing in jointly developed industrial parks.
- (3)
- Integrating Ecology and Industry through Specific Technologies
A strategic, technology-driven approach is needed to align economic growth with ecological health. Cities should strengthen R&D and focus on key green technologies in three main areas. First, use watershed management technologies to address agricultural non-point source pollution and aid river remediation. Second, adopt green production technologies, including precision agriculture and cleaner manufacturing, to support a circular economy. Third, invest in clean energy technologies for rural use, such as distributed solar and biomass solutions. Support these efforts by creating regional green technology R&D alliances and technology transfer platforms. These platforms will enhance industry-university collaboration, speed commercialization, and help businesses lower environmental compliance costs. Ultimately, this will advance both ecological conservation and economic development.
7. Limitations and Future Research Directions
7.1. Data Constraints
The reliability of our findings depended on the quality and coverage of publicly available data. Although we used authoritative sources such as the China Urban Statistical Yearbook, certain variables of interest, such as real-time pollution emissions or detailed green financing flows at the city level, were not systematically reported. Furthermore, our measure of ecological resilience, while comprehensive, could be refined with more granular data—for instance, on biodiversity or soil quality—were it consistently available across all cities and years. Future studies would benefit from integrating emerging data sources, such as satellite night-time light data and social media data, to construct more dynamic and multifaceted resilience indicators.
7.2. Potential Endogeneity Issues
This study employed a dynamic Spatial Durbin Model with two-way fixed effects to control for time-invariant omitted variables and to capture the path dependence of the dependent variable. However, potential endogeneity concerns may have persisted. Specifically, while the current specification included the lagged dependent variable, it did not fully account for the potential lagged effects of core explanatory variables, such as industrial upgrading and environmental regulation. The time-lagged nature of their impacts could introduce bias into the estimates of immediate effects. Although the robustness of our findings was supported by multiple model specifications, future research could adopt more comprehensive dynamic frameworks that incorporate lags of explanatory variables or employ instrumental variables derived from policy shocks to further strengthen causal inference.
7.3. Generalizability to Other Basin Regions
The empirical findings and policy implications of this study were derived from the specific socio-ecological context of the Huaihe River Ecological Economic Belt. This region was characterized by its unique basin topography, distinct “core–periphery” economic structure, and specific national strategic positioning. Consequently, the direct extrapolation of our results to other major river basins, such as the Yangtze River Economic Belt or the Yellow River Basin, which differ in developmental stage, scale, and policy priorities, should be undertaken with caution. We recommend that future research test the applicability of our analytical framework in other geographically interconnected but contextually diverse regions, thereby helping distill universally applicable principles of ecological resilience from context-specific factors.
Funding
This research was funded by Soft Science Program Research Project in Henan Province, grant number 232400410176.
Institutional Review Board Statement
Not applicable.
Informed Consent Statement
Not applicable.
Data Availability Statement
The evaluation data selected in this article are all derived from the “China Urban Statistical Yearbook” (2011–2023), the “China Urban Construction Statistical Yearbook”, as well as local statistical and environmental bulletins. The normalized vegetation index (NDVI) is a 30m resolution dataset sourced from the Resource and Environmental Science Data Center of the Chinese Academy of Sciences (http://www.resdc.cn/).
Conflicts of Interest
The author declares no conflicts of interest.
Appendix A
Table A1.
Missing data statistics results.
Table A1.
Missing data statistics results.
| Indicators | Number of Missing Values | Percentage of Missing Data (%) |
|---|---|---|
| Per capita park green space area | 2 | 0.616 |
| Built-up area green coverage rate | 0 | 0.000 |
| Water area ratio | 5 | 1.538 |
| Proportion of protected areas to total land area | 2 | 0.616 |
| Comprehensive utilization rate of general industrial solid waste | 0 | 0 |
| Urban sewage treatment rate | 0 | 0 |
| Harmless treatment rate of domestic waste | 0 | 0 |
| Proportion of environmental protection expenditure to public fiscal expenditure | 0 | 0 |
| Number of green patents | 2 | 0.616 |
| Number of college students per 10,000 people | 0 | 0 |
| Proportion of high-tech enterprises to total enterprises | 6 | 1.846 |
| per capita GDP | 0 | 0 |
| the ratio of value added in the tertiary to the secondary sector | 0 | 0 |
| the proportion of built-up land area relative to total municipal land area | 0 | 0 |
| the share of environmental pollution control investment in local public expenditure | 0 | 0 |
| the number of invention patents granted per 10,000 residents | 3 | 0.923 |
| the normalized difference vegetation index | 0 | 0 |
| per capita urban road area. | 0 | 0 |
Table A2.
Sensitivity analysis results of missing data.
Table A2.
Sensitivity analysis results of missing data.
| Variables | Delete Missing Data | Using Interpolated Data | ||||
|---|---|---|---|---|---|---|
| β | T Statistics | p-Value | β | T Statistics | p-Value | |
| LnUERt−1 | 0.268 | 3.255 | 0.001 | 0.266 | 3.291 | 0.001 |
| lnGDP | −0.301 | −3.539 | 0.001 | −0.301 | −3.547 | 0.000 |
| ln(GDP) 2 | 0.222 | 4.021 | 0.005 | 0.224 | 4.037 | 0.005 |
| lnIU | −0.110 | −1.866 | 0.030 | −0.105 | −1.887 | 0.032 |
| lnUL | −0.295 | −3.844 | 0.005 | −0.296 | −3.838 | 0.006 |
| lnER | −0.190 | −2.917 | 0.002 | −0.191 | −2.914 | 0.001 |
| lnTI | 0.229 | 3.094 | 0.007 | 0.239 | 3.287 | 0.005 |
| lnEE | 0.143 | 3.901 | 0.001 | 0.143 | 3.920 | 0.000 |
| lnIL | 0.092 | 3.004 | 0.001 | 0.095 | 3.175 | 0.001 |
| lnOP | 0.088 | 2.658 | 0.017 | 0.084 | 2.926 | 0.016 |
| lnPD | −0.095 | −2.470 | 0.002 | −0.098 | −2.466 | 0.002 |
| W × lnGDP | −0.149 | −3.355 | 0.004 | −0.147 | −3.681 | 0.003 |
| W × lnIU | 0.236 | 2.760 | 0.001 | 0.236 | 2.794 | 0.001 |
| W × lnUL | 0.086 | 3.158 | 0.000 | 0.085 | 3.495 | 0.001 |
| W × lnER | −0.059 | −1.602 | 0.025 | −0.054 | −1.588 | 0.029 |
| W × lnTI | 0.201 | 3.385 | 0.000 | 0.166 | 3.085 | 0.002 |
| ρ | 0.300 | 2.994 | 0.002 | 0.304 | 3.227 | 0.001 |
| R2 | 0.802 | 0.811 | ||||
| N | 325 | 325 | ||||
Table A3.
Robustness test results.
Table A3.
Robustness test results.
| Variables | Static SDM | Dynamic SDM | ||||||
|---|---|---|---|---|---|---|---|---|
| Model I (Geographic Distance Matrix) | Model II (Economic Distance Matrix) | Model IV (Geographic Distance Matrix) | Model V (Economic Distance Matrix) | |||||
| β | p-Value | β | p-Value | β | p-Value | β | p-Value | |
| LnUERt−1 | 0.353 | 0.014 | 0.192 | 0.001 | ||||
| lnGDP | −0.372 | 0.022 | −0.465 | 0.001 | −0.264 | 0.001 | −0.240 | 0.001 |
| ln(GDP) 2 | 0.134 | 0.016 | 0.222 | 0.016 | 0.150 | 0.009 | 0.212 | 0.005 |
| lnIU | −0.180 | 0.028 | −0.315 | 0.024 | −0.088 | 0.033 | −0.255 | 0.011 |
| lnUL | −0.289 | 0.003 | −0.077 | 0.019 | −0.161 | 0.007 | −0.152 | 0.002 |
| lnER | −0.082 | 0.059 | −0.176 | 0.033 | −0.147 | 0.016 | −0.380 | 0.000 |
| lnTI | 0.104 | 0.018 | 0.280 | 0.000 | 0.163 | 0.055 | 0.272 | 0.028 |
| lnEE | 0.255 | 0.000 | 0.106 | 0.005 | 0.227 | 0.001 | 0.219 | 0.009 |
| lnIL | 0.261 | 0.001 | 0.133 | 0.002 | 0.183 | 0.003 | 0.112 | 0.002 |
| lnOP | 0.112 | 0.377 | 0.062 | 0.206 | 0.045 | 0.100 | 0.099 | 0.017 |
| W × lnGDP | 0.108 | 0.011 | −0.210 | 0.020 | 0.238 | 0.013 | −0.179 | 0.011 |
| W × lnIU | 0.340 | 0.003 | 0.259 | 0.015 | 0.265 | 0.024 | 0.274 | 0.003 |
| W × lnUL | 0.062 | 0.005 | 0.216 | 0.002 | 0.114 | 0.005 | 0.135 | 0.006 |
| W × lnER | 0.044 | 0.281 | −0.122 | 0.168 | 0.088 | 0.299 | −0.068 | 0.185 |
| W × lnTI | 0.207 | 0.000 | 0.153 | 0.000 | 0.090 | 0.004 | 0.148 | 0.002 |
| ρ | 0.345 | 0.001 | 0.297 | 0.002 | 0.311 | 0.000 | 0.292 | 0.001 |
| R2 | 0.725 | 0.782 | 0.749 | 0.736 | ||||
| N | 325 | 325 | 325 | 325 | ||||
References
- Wang, H.; Feng, R.; Li, X.; Yang, Y.; Pan, Y. Land use change and its impact on ecological risk in the Huaihe River Eco-Economic Belt. Land 2023, 12, 1247. [Google Scholar] [CrossRef]
- Zhu, Y.; He, G.; Zhang, G.; Wang, X.; Yang, C. Research on Spatio-Temporal Characteristics and Obstacle Diagnosis of Ecosystem Security in Huaihe River Economic Belt. Pol. J. Environ. Stud. 2021, 30, 5377–5389. [Google Scholar] [CrossRef]
- Gunderson, L.H. Ecological resilience—In theory and application. Annu. Rev. Ecol. Syst. 2000, 31, 425–439. [Google Scholar] [CrossRef]
- Pickett, S.T.; McGrath, B.; Cadenasso, M.L.; Felson, A.J. Ecological resilience and resilient cities. Build. Res. Inf. 2014, 42, 143–157. [Google Scholar] [CrossRef]
- Shaker, R.R.; Mackay, B.R. Hidden patterns of sustainable development in Asia with underlying global change correlations. Ecol. Indic. 2021, 131, 108227. [Google Scholar] [CrossRef]
- Yao, X.; Chen, Y.; Zheng, X.; Li, H.; Chen, Y.; Kong, L.; Ou, C. Spatiotemporal characteristics and influential factors of coupling coordination degree of urbanization and ecological environment in the Huaihe River ecological economic belt. Sci. Rep. 2025, 15, 12287. [Google Scholar] [CrossRef] [PubMed]
- Holling, C.S. Resilience and stability of ecological systems. Annu. Rev. Ecol. Syst. 1973, 4, 1–23. [Google Scholar] [CrossRef]
- Bozza, A.; Asprone, D.; Fabbrocino, F. Urban resilience: A civil engineering perspective. Sustainability 2017, 9, 103. [Google Scholar] [CrossRef]
- Wu, J.; Wu, T. Ecological resilience as a foundation for urban design and sustainability. In Resilience in Ecology and Urban Design: Linking Theory and Practice for Sustainable Cities; Springer: Dordrecht, The Netherlands, 2012; pp. 211–229. [Google Scholar]
- Nunes, D.M.; Pinheiro, M.D.; Tomé, A. Does a review of urban resilience allow for the support of an evolutionary concept? J. Environ. Manag. 2019, 244, 422–430. [Google Scholar] [CrossRef]
- Bautista-Puig, N.; Benayas, J.; Manana-Rodríguez, J.; Suárez, M.; Sanz-Casado, E. The role of urban resilience in research and its contribution to sustainability. Cities 2022, 126, 103715. [Google Scholar] [CrossRef]
- Wang, S.M.; Niu, J.L. Spatio-temporal evolution and influencing factors of urban ecological resilience in the Yellow River Basin. Acta Ecol. Sin. 2023, 43, 8309–8320. (In Chinese) [Google Scholar]
- Yu, X.; Liu, Y.; He, H.; Yang, B. Revealing the Spatial Effects of New-Type Urbanization on Urban Ecological Resilience: Evidence from 281 Prefecture-Level Cities in China. Land 2025, 14, 1851. [Google Scholar] [CrossRef]
- Wang, Z.; Liu, W. A comparative study of urban ecological resilience in the Yangtze River Economic Belt and the Yellow River Basin. Humanit. Soc. Sci. Commun. 2024, 11, 1471. [Google Scholar] [CrossRef]
- Zhang, Z.; Wu, Y. Spatiotemporal Evolution and Influencing Factors of Urban Ecological Resilience: Evidence from the Yellow River Basin, China. Sustainability 2025, 17, 7114. [Google Scholar] [CrossRef]
- Wang, S.; Niu, J. Dynamic evolution and obstacle factors of urban ecological resilience in Shandong Peninsula urban agglomeration. Econ. Geogr. 2022, 42, 51–61. (In Chinese) [Google Scholar]
- Liao, Z.; Zhang, L. Spatio-temporal pattern evolution and dynamic simulation of urban ecological resilience in Guangdong Province, China. Heliyon 2024, 10, e25127. [Google Scholar] [CrossRef]
- Li, G.; Wang, L. Study of regional variations and convergence in ecological resilience of Chinese cities. Ecol. Indic. 2023, 154, 110667. [Google Scholar] [CrossRef]
- Alberti, M.; Marzluff, J.M. Ecological resilience in urban ecosystems: Linking urban patterns to human and ecological functions. Urban Ecosyst. 2004, 7, 241–265. [Google Scholar] [CrossRef]
- Zhang, T.; Wang, X.; Li, X.; Zhu, X.; Li, L.; Chen, L. Spatio-Temporal Differentiation and Influencing Factors of Urban Ecological Resilience in Xuzhou City. Land 2025, 14, 1048. [Google Scholar] [CrossRef]
- Li, Z.; Chang, J.; Li, C.; Gu, S. Ecological restoration and protection of national land space in coal resource-based cities from the perspective of ecological security pattern: A case study in Huaibei City, China. Land 2023, 12, 442. [Google Scholar] [CrossRef]
- Tamazian, A.; Rao, B.B. Do economic, financial and institutional developments matter for environmental degradation? Evidence from transitional economies. Energy Econ. 2010, 32, 137–145. [Google Scholar] [CrossRef]
- Li, J.; Lin, B. Ecological total-factor energy efficiency of China’s heavy and light industries: Which performs better? Renew. Sustain. Energy Rev. 2017, 72, 83–94. [Google Scholar] [CrossRef]
- Shahzad, U.; Ferraz, D.; Nguyen, H.H.; Cui, L. Investigating the spill overs and connectedness between financial globalization, high-tech industries and environmental footprints: Fresh evidence in context of China. Technol. Forecast. Soc. Change 2022, 174, 121205. [Google Scholar] [CrossRef]
- Štrbac, S.; Kašanin-Grubin, M.; Pezo, L.; Stojić, N.; Lončar, B.; Ćurčić, L.; Pucarević, M. Green infrastructure designed through nature-based solutions for sustainable urban development. Int. J. Environ. Res. Public Health 2023, 20, 1102. [Google Scholar] [CrossRef]
- Duan, D.; Xia, Q. Does environmental regulation promote environmental innovation? An empirical study of cities in China. Int. J. Environ. Res. Public Health 2021, 19, 139. [Google Scholar] [CrossRef]
- Chang, K.C.; Wang, D.; Lu, Y.; Chang, W.; Ren, G.; Liu, L.; Zhou, X. Environmental regulation, promotion pressure of officials, and enterprise environmental protection investment. Front. Public Health 2021, 9, 724351. [Google Scholar] [CrossRef] [PubMed]
- Liu, G.; Liang, K. The role of technological innovation in enhancing resource sustainability to achieve green recovery. Resour. Policy 2024, 89, 104659. [Google Scholar] [CrossRef]
- Li, Y.; He, Z. The Impact of Agricultural Total Factor Productivity and Green Finance Development on Ecological Resilience. Financ. Res. Lett. 2025, 84, 107829. [Google Scholar] [CrossRef]
- Cumming, G.S.; Allen, C.R. Protected areas as social-ecological systems: Perspectives from resilience and social-ecological systems theory. Ecol. Appl. 2017, 27, 1709–1717. [Google Scholar] [CrossRef]
- Tang, Y.; Wang, Y. Impact of digital economy on ecological resilience of resource-based cities: Spatial spillover and mechanism. Environ. Sci. Pollut. Res. 2023, 30, 41299–41318. [Google Scholar] [CrossRef]
- Zhou, Y.; Kong, Y.; Sha, J.; Wang, H. The role of industrial structure upgrades in eco-efficiency evolution: Spatial correlation and spillover effects. Sci. Total Environ. 2019, 687, 1327–1336. [Google Scholar] [CrossRef]
- Ding, W.; Liu, J. Nonlinear and spatial spillover effects of urbanization on air pollution and ecological resilience in the Yellow River Basin. Environ. Sci. Pollut. Res. 2023, 30, 43229–43244. [Google Scholar] [CrossRef]
- Zhang, M.; Ren, Y. Impact of environmental regulation on ecological resilience a perspective of “Local-neighborhood” effect. J. Beijing Inst. Technol. (Soc. Sci. Ed.) 2022, 24, 16–29. (In Chinese) [Google Scholar]
- Radmehr, R.; Shayanmehr, S.; Baba, E.A.; Samour, A.; Adebayo, T.S. Spatial spillover effects of green technology innovation and renewable energy on ecological sustainability: New evidence and analysis. Sustain. Dev. 2024, 32, 1743–1761. [Google Scholar] [CrossRef]
- Yang, L.; Yang, H.; Zhao, X.; Yang, Y. Study on urban resilience from the perspective of the complex adaptive system theory: A case study of the Lanzhou-Xining urban agglomeration. Int. J. Environ. Res. Public Health 2022, 19, 13667. [Google Scholar] [CrossRef] [PubMed]
- Apostu, S.A.; Vasile, V.; Vasile, R.; Rosak-Szyrocka, J. Do smart cities represent the key to urban resilience? Rethinking urban resilience. Int. J. Environ. Res. Public Health 2022, 19, 15410. [Google Scholar] [CrossRef]
- Zhang, M.; Zhao, Y.; Mo, D. Coordinated development and convergence of urban ecological resilience and land use intensity in the Yellow River Basin. J. Nat. Resour. 2025, 40, 2479–2496. (In Chinese) [Google Scholar] [CrossRef]
- Liao, Z.; Zhang, L. Spatiotemporal interaction characteristics and transition mechanism of tourism environmental efficiency in China. Sci. Rep. 2023, 13, 14196. [Google Scholar] [CrossRef]
- Wang, G.; Gao, J.; Li, Y. Does Low-Carbon Transition Promote Regional Sustainable Development? Evidence from the Huaihe River Ecological Economic Belt. Sustainability 2024, 16, 9107. [Google Scholar] [CrossRef]
- Alam, I.; Nahar, K.; Morshed, M.M. Measuring urban expansion pattern using spatial matrices in Khulna City, Bangladesh. Heliyon 2023, 9, e13193. [Google Scholar] [CrossRef] [PubMed]
- Wang, G.; Guo, X.; Wu, G.; Zhu, Y. Investigating the effects of environmental regulation on industrial ecological efficiency in China using a panel smooth transition regression model. Sustainability 2023, 15, 15408. [Google Scholar] [CrossRef]
- Tsai, K.H.; Liao, Y.C. Innovation capacity and the implementation of eco-innovation: Toward a contingency perspective. Bus. Strategy Environ. 2017, 26, 1000–1013. [Google Scholar] [CrossRef]
- Hu, M.; Xia, B. A significant increase in the normalized difference vegetation index during the rapid economic development in the Pearl River Delta of China. Land Degrad. Dev. 2019, 30, 359–370. [Google Scholar] [CrossRef]
- Song, J.; Gao, Q.; Hu, X.; Lei, J. The impact of digital transformation of infrastructure on carbon emissions: Based on a “local-neighborhood” perspective. PLoS ONE 2024, 19, e0307399. [Google Scholar] [CrossRef]
- Zhu, Q.; Xie, C.; Liu, J.B. The impact of population agglomeration on ecological resilience: Evidence from China. Math. Biosci. Eng. 2023, 20, 15898–15917. [Google Scholar] [CrossRef] [PubMed]
- Niako, N.; Melgarejo, J.D.; Maestre, G.E.; Vatcheva, K.P. Effects of missing data imputation methods on univariate blood pressure time series data analysis and forecasting with ARIMA and LSTM. BMC Med. Res. Methodol. 2024, 24, 320. [Google Scholar] [CrossRef]
- Medrano, J.; Kheddar, A.; Lesne, A.; Ramdani, S. Radius selection using kernel density estimation for the computation of nonlinear measures. Chaos Interdiscip. J. Nonlinear Sci. 2021, 31, 83131. [Google Scholar] [CrossRef] [PubMed]
- Bofa, A.; Zewotir, T. Key predictors of food security and nutrition in Africa: A spatio-temporal model-based study. BMC Public Health 2024, 24, 885. [Google Scholar] [CrossRef]
- Wang, H.; Wang, W. Pattern evolution and spatial spillover effect of urban resilience in the Yangtze River Delta. Geogr. Geo-Inf. Sci. 2024, 40, 57–66. (In Chinese) [Google Scholar]
- Li, Z.; Li, J. The influence mechanism and spatial effect of carbon emission intensity in the agricultural sustainable supply: Evidence from china’s grain production. Environ. Sci. Pollut. Res. 2022, 29, 44442–44460. [Google Scholar] [CrossRef]
- LeSage, J.P.; Dominguez, M. The importance of modeling spatial spillovers in public choice analysis. Public Choice 2012, 150, 525–545. [Google Scholar] [CrossRef]
- Elhorst, J.P. Specification and estimation of spatial panel data models. Int. Reg. Sci. Rev. 2003, 26, 244–268. [Google Scholar] [CrossRef]
- Baltagi, B.H.; Liu, L. Random effects, fixed effects and Hausman’s test for the generalized mixed regressive spatial autoregressive panel data model. Econom. Rev. 2016, 35, 638–658. [Google Scholar] [CrossRef]
- Lind, J.T.; Halvor, M. With or without U? The appropriate test for a U-shaped relationship. Oxf. Bull. Econ. Stat. 2010, 72, 109–118. [Google Scholar] [CrossRef]
- Jayaraman, A.; Sudhir, C.R.; Palaniappan, R. Food system resilience: Unraveling power relations and the Matthew effect in farmers networks. Technol. Forecast. Soc. Change 2024, 200, 123144. [Google Scholar] [CrossRef]
- Porter, M.E. Location, competition, and economic development: Local clusters in a global economy. Econ. Dev. Q. 2000, 14, 15–34. [Google Scholar] [CrossRef]
- Oteng-Abayie, E.F.; Duodu, E.; Oduro, S.; Tawiah, B.S. Greening the future: Unveiling the link between industrial structure upgrading and pollution emission in sub-Saharan Africa. Cogent Econ. Financ. 2023, 11, 2257069. [Google Scholar] [CrossRef]
- Wang, H.; Peng, G.; Du, H. Digital economy development boosts urban resilience—Evidence from China. Sci. Rep. 2024, 14, 2925. [Google Scholar] [CrossRef] [PubMed]
- Duan, S.; Chen, H.; Han, J. Green Innovation Quality in Center Cities and Economic Growth in Peripheral Cities: Evidence from the Yangtze River Delta Urban Agglomeration. Systems 2025, 13, 642. [Google Scholar] [CrossRef]
Disclaimer/Publisher’s Note: The statements, opinions and data contained in all publications are solely those of the individual author(s) and contributor(s) and not of MDPI and/or the editor(s). MDPI and/or the editor(s) disclaim responsibility for any injury to people or property resulting from any ideas, methods, instructions or products referred to in the content. |
© 2025 by the author. Licensee MDPI, Basel, Switzerland. This article is an open access article distributed under the terms and conditions of the Creative Commons Attribution (CC BY) license (https://creativecommons.org/licenses/by/4.0/).