Abstract
Sustainable landslide risk management is critical for achieving resilient communities and supporting the United Nations Sustainable Development Goals, particularly in vulnerable mountainous regions of developing countries. This study presents experimental evidence supporting dimensionless analysis approaches for characterizing granular flow behavior, contributing to cost-effective landslide hazard assessment frameworks. We designed a 4 m experimental flume to investigate the influence of particle characteristics on flow velocity and runout distance, using two materials with contrasting shapes but similar density (~460 kg/m3) and nominal size (~5 mm): uniform crystal beads (φ = 25.2°) and non-uniform crushed granite particles (φ = 36.9°). High-resolution imaging (30 fps, 2336 × 1752 pixels) captured 30 flow experiments from initiation to deposition. Results demonstrate significant differences in flow behavior: crystal beads achieved 50% longer runout distances and 46% higher maximum velocities (380 cm/s vs. 260 cm/s) compared to granite particles. The Savage number () effectively captured fundamental flow-regime differences, with granite particles exhibiting values seven times lower than crystal beads (3.69 vs. 23.91, p < 0.001), indicating greater frictional energy dissipation relative to collisional energy transfer. The Bagnold number confirmed inertially dominated regimes ( > 106) with negligible viscous effects in both materials. These findings demonstrate that accessible material characterization using standard triaxial testing and dimensionless analysis can significantly improve landslide runout prediction accuracy, supporting evidence-based decision-making for sustainable territorial planning and community protection. This research supports the development of practical risk assessment methodologies implementable in resource-limited settings, promoting sustainable development through improved natural hazard management.
1. Introduction
Landslide hazards pose significant threats to sustainable development, particularly in mountainous regions where vulnerable communities often lack adequate resources for comprehensive risk management. The United Nations Sustainable Development Goals (SDGs), especially SDG 11 (Sustainable Cities and Communities) and SDG 13 (Climate Action), emphasize the critical need for resilient infrastructure and effective disaster risk reduction strategies. Understanding granular flow mechanisms significantly impacts various applications, ranging from industrial processes [1,2] to assessment of natural hazards, including powder snow avalanches [3,4,5] and flow-like landslides such as debris flows and rock avalanches [6,7]. The latter are the focus of this study due to their devastating impact on sustainable development.
In such scenarios, comprehending the role of various interactions among components forming the flowing mass is crucial for assessing the velocity and runout distance of flow-like landslides. The implications of these processes are significant for multiple purposes, including the design of mitigation structures [8,9] and landslide risk assessment for downstream communities [10,11,12], which directly support sustainable territorial development and community resilience.
The development of granular flows, such as debris flows, mud flows, or rock avalanches, results from complex interactions among elements composing the flowing mass [13]. This mass typically consists of a mixture of different materials in fluid and solid phases. At the microscale, granular flow kinetics are influenced by (1) particle–particle interactions and (2) particle–fluid interactions [13]. Regarding particle–particle interactions, two important mechanisms are involved: brief collisional contact between particles, which dissipates energy through damping-like behavior, and long-term frictional interaction that dissipates energy due to prolonged particle contact. Particle–fluid interactions are primarily related to the rheology of the fluid phase, commonly water [14,15,16], resulting in energy dissipation through viscous-like behavior.
Accounting for these processes at larger scales, such as the mesoscale (i.e., considering the flowing mass as a continuum), may unveil the key processes driving material displacement, which is essential for sustainable risk management frameworks. This approach represents a key feature in modeling complex phenomena at real scale. In this way, characterization of granular flows, specifically within the scope of landslide processes, can be performed using dimensionless numbers indicating the dominance of the forces interacting in the flow: characteristic numbers relating the friction, collision, and viscous interactions [6] or an inertia-based approach directly considering the effects of the dominating actions on the flow shear rate [17].
Replication of these processes under real-scale conditions is extremely difficult, leading to nearly unpredictable uncertainties given the complex nature of the phenomenon. Therefore, laboratory-scale observations of the process are crucial for the statistical validation of the theoretical basis and for the development of cost-effective methodologies that can be implemented in resource-constrained environments. In this manner, experimental evidence on granular flows may unveil the key processes in particle flows, contributing to the sustainable understanding of their effects in real-scale conditions.
Granular flows simulating landslide runout processes can be replicated under controlled conditions in the laboratory or at experimental sites within a wide variety of scales. Some investigations have reported the use of large artificial flumes [18,19] and even natural gullies for the testing or recording of the runout and deposition of flowing material ranging from a few to thousands of cubic meters [20,21]. Other investigations have scaled down the problem by using smaller flume tests; with bidimensional flow-based experimental modeling, some studies have used soil–water mixtures to study the influence of the shape of the flume transversal section, grain size composition, and water content on the motion and deposition of the flowing mass [22,23], while others have used dry granular flows to investigate the effect of the shape of the flow bed in the runout process [24,25,26] and even that of three-dimensional granular flows in irregular 3D terrain [27,28].
The aim of the present study is to demonstrate, through experimental evidence, the influence of particle interactions at three flow stages—initiation, intermediate flow development, and runout or deposition—contributing to sustainable landslide risk management. It also seeks to show how flow characterization can capture the key mechanisms driving longer or shorter runout distances, supporting evidence-based decision-making for territorial planning and community protection. To this end, novel experimental investigations are presented using a 4 m-long and 10 cm-wide flume with high-resolution image acquisition that recorded the material flow, demonstrating cost-effective experimental approaches that can inform sustainable hazard assessment methodologies.
The experimental campaign utilized two different materials with similar unit weights, nominal sizes, and colors but differing in particle shape (quasi-spherical white glass beads vs. white crushed granite particles). The flow was characterized using various dimensionless quantities at its maximum velocity in the acceleration zone, demonstrating their influence on the final runout and deposition, with implications for sustainable risk management and community resilience strategies.
2. Material and Methods
2.1. Experimental Design and Flow-Regime Characterization
Our experimental approach was designed considering resource efficiency and scalability principles relevant to sustainable research practices. Flow regimes were characterized using dimensionless numbers proposed in the literature [6,17], supporting cost-effective approaches that can be adapted to different contexts. This characterization was conducted considering quasi-steady flow conditions when flow velocity remained approximately constant in the central portion of the acceleration zone.
The dimensionless numbers describe, within a mesoscale approach, the contribution of different microscale interactions in the flow process. We analyzed particle–particle interactions (collisional and frictional) and particle–fluid interactions using two approaches: stress-based [6,17] and inertia-based [6,17] methods. This approach supports sustainable risk assessment by providing a physically based framework that can be adapted to different materials and conditions without requiring extensive site-specific calibration.
The Savage number characterizes energy transfer by intergranular collisions relative to energy transfer by frictional interactions:
where is the mixture shear rate at the flow base (s−1), is the solid particle diameter (m); N is the number of solid particles above the analyzed flow depth; is the gravitational acceleration (9.81 m/s2); is the material friction coefficient; and and are solid and fluid phase densities, respectively. Specifically, varies according to the tested material, while corresponds to air density under standard conditions (1.23 kg/m3).
The Bagnold number relates the inertial grain stress to the viscous shear stress:
where is the solid fraction within the flowing material and is the effective viscosity of the fluid (Pa·s).
The friction number, derived from the ratio between the Bagnold and Savage numbers, relates friction stress to viscous stress:
Comparable dimensionless numbers were used according to an inertia-based approach—specifically, the particle inertia-dominated regime:
Particle inertia-dominated regime:
Viscous resistance-dominated regime:
Fluid inertia-dominated regime:
where is the confining pressure (Pa).
The selection of these dimensionless numbers is justified by their complementary physical interpretations. While stress-based parameters () characterize force balance at the particle scale, inertia-based parameters ( describe kinematic regimes independent of normal stress assumptions [17]. This dual approach provides robust flow characterization applicable across different confinement conditions. Thresholds commonly cited in the literature include > 0.1 for collision-dominated flows and > 200 for inertial regimes [6,29]. Our experimental conditions were designed to span these transition zones, enabling clear regime identification.
2.2. Cost-Effective Experimental Flume Test Design
The experiments were conducted in the laboratories of Universidad Industrial de Santander (UIS), Colombia, demonstrating sustainable research practices that can be replicated in developing countries. An experimental flume was built for the testing of dry flows of disaggregated materials using locally available materials and standard equipment. The flume has a 10 cm width and consists of two parallel walls of plexiglass supported from behind by a rigid wall. The design is intended to evaluate a maximum of 3 L of material at each time, resembling some of the characteristics of different experimental flume tests already presented in the literature [16,30,31].
Specifically, it is constituted by an inclined section, named here the acceleration zone, with 40° inclination and 2 m length, and a horizontal section, named here the deposition zone, of 2 m length. The two sections are connected by a curved section of 20 cm. The flow characterization described in Section 2.1 was conducted when the flowing mass reached quasi-stationary flow conditions in the central part of the acceleration zone.
The experimental flume is equipped with a trap gate to keep the material still 45 cm below the top of the flume. The opening mechanism of the gate is operated remotely at the beginning of any test by activating an electric motor with 120 V–3000 rpm adapted to the top of the gate, as shown in Figure 1. The Main Data Acquisition (MDA) system of the flume is composed of a camera shooting at 30 frames per second with 2336 × 1752 pixel resolution in frontal view, demonstrating cost-effective monitoring approaches that could be adapted for field applications.

Figure 1.
Opening process of the gate remotely operated by a 120 V electric motor and initial flow steps in an experimental flume test.
For this reason, the frontal wall of the flume is transparent with thick markings every 5 cm, while the back part is black, increasing the contrast between the flowing material and the flume structure. The MDA is triggered right after the trap gate starts opening, and the exact opening time is sensed with an optical sensor adapted to the side of the trap door to precisely record the initiation time of any test.
Two different materials were used (see details in Section 2.3). The overall experimental program, composed of 30 study units, replicates the same test 15 times for each selected material. Each study unit consists of the release and capture of the flow process of 3 L of granular material from initiation to deposition. The acquisition procedure of any study unit lasts at least 3 s. A sequence of a complete study unit, from initiation to deposition, can be seen in Figure 2.
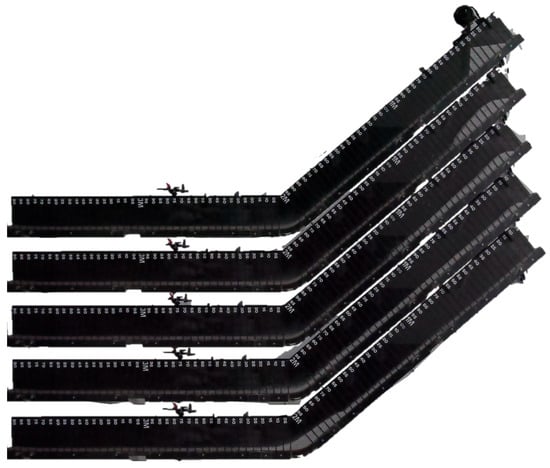
Figure 2.
Material flow process in an experimental flume test at times of (in descending order) 0.258 s, 0.559 s, 0.903 s, and 2.322 s.
The roughness of the flow base of the flume was controlled by covering it with continuous 120 SIA sandpaper, which was replaced at the end of every study unit. In turn, the friction with the walls was controlled by cleaning each side wall using low-viscosity oil at the end of all tests.
2.3. Scaling for Resilience Estimation
A scaling factor () was estimated using distance and velocity measurements and estimations from both a real scale landslide event and laboratory experiments. Based on the scaling factor, the vulnerability of the exposed elements was estimated based on the results of each model, enabling an evaluation of the implications of estimating the Landslide Risk Degree (LRD) using different modeling approaches. The adopted vulnerability model is presented in Equation (1) [32]. This model is particularly relevant to the present study, as it was originally developed for international applications but has since been incorporated into the Colombian guideline for landslide hazard, vulnerability, and risk assessment [32,33].
V, I, and S are the vulnerability, landslide intensity, and susceptibility of the exposed elements.
Accordingly, landslide resilience can be estimated as a function of vulnerability and different response indicators related to the societal response to catastrophic events [34]. In general terms, resilience can take the form of Equation (8).
where represents indicators of recovery, absorption, and adaptation capacities while , , , and are coefficients that weight the relative importance of each indicator. In this specific case, is not considered, as no absorption measures (such as retaining walls or nets) are considered to physically intercept the flowing mass. Similarly, and are excluded, since the time scale under analysis encompasses only the duration of the landslide event itself, thereby neglecting any subsequent response or adaptation processes. Under these assumptions, Equation (8) simplifies to Equation (9).
Landslide intensity and susceptibility were estimated differently according to two different conceptual experiments or scenarios considered here: (a) a landslide impacting a highway and (b) a landslide impacting an inhabited zone.
(a) Landslide impacting a highway
Consider the case in which a landslide threatens a highway, as sketched in Figure S1. For simplicity, vulnerability and resilience will only be considered to affect the highway structure, neglecting the vulnerability of persons.
In this case, the landslide intensity () was estimated as , where represents the distance along the highway affected by the landslide, derived from the LRD estimation, and is the total roadway width. The latter was taken as 24 m, corresponding to six standard lanes of 3.5 m each, plus 1.5 m side banks.
The road susceptibility () was computed as , where 3 m is the minimum lane width required for a vehicle to continue safely, and is the total paved width available in the analyzed section (24 m).
(b) Landslide impacting an inhabited zone
Now, consider an event threatening an inhabited zone, as sketched in Figure S2 in the Supplementary Materials. The landslide event in this case exposes structural elements to the landslide path in an inhabited zone. Once again, for simplicity, we are considering only the vulnerability and resilience of the exposed structures.
Susceptibility in this case was estimated using an integral methodological approach considering structural type, height, and age [35]. Equation (10) shows how calculations were performed.
In turn, landslide intensity was estimated considering the effects of velocity, flow depth, and pressure on the structures potentially at risk. Equation (4) shows how calculations were performed.
is the intensity ratio relating the landslide pressure exerted on the structure () and the maximum limit pressure () that the structure can hold. The pressure in the structure was estimated based on landslide velocity as . A limit pressure of 8 kN was adopted, as suggested by [35], for the structures considered here. In turn, is the intensity ratio relating the landslide flow depth () and the total height of the structure (), assumed here as 4 m.
Therefore, consider, as sketched in Figure 7, houses of ~3.5 m width posed in the trajectory of a flowing mass. In this example, there are three lines of houses potentially on the landslide runout way. Consider line 1 of houses starting right after the change of direction at 225 cm, line 2 starting at 250 cm, and line 3 starting at 275 cm.
2.4. Material Selection and Characterization
Two different granular materials were tested in the experimental flume. As can be seen in Figure 3, the selected materials are white crushed granite (Figure 3a) and white crystal beads (Figure 3b). Their white color enhances the contrast with the rear wall of the flume, easing image processing. In terms of unit weight, they present similar characteristics, but the crystal beads are highly uniform. while the crushed granite is much less uniform, increasing the contact surface between grains and, thus, the friction angle, as well as their interactions during the flowing phase. To further investigate this aspect, both materials were subjected to mechanical resistance tests.
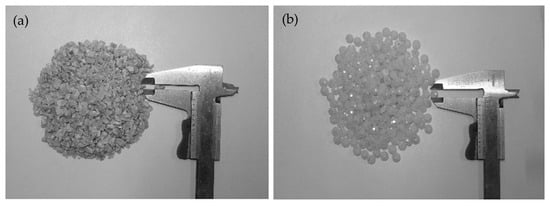
Figure 3.
Materials used for the flow tests: (a) white crushed granite and (b) white crystal beads.
Both materials were subjected to triaxial compression tests under relatively low confining pressures (2 kPa to 30 kPa) to determine the angle of internal friction, as shown in Figure 4a. To perform the tests, a sample of 550 cm3 of loose, dry granular material was prepared in a latex membrane of 0.635 mm thickness, mounted inside the triaxial cell.
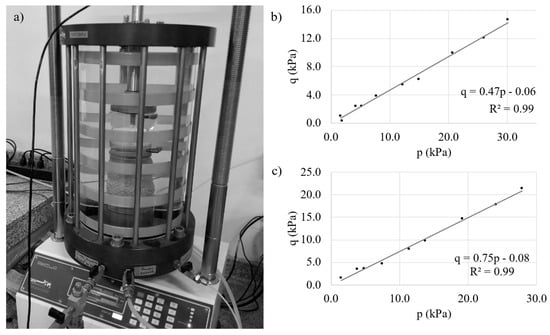
Figure 4.
Triaxial tests performed on the investigated materials: (a) cell montage and p-q diagrams for (b) white crushed granite and (c) white crystal beads.
The triaxial tests were carried out to simulate drained conditions in conventional testing procedures, so the fluid (air) in the pores of the sample was allowed to freely flow out, avoiding any pore air overburden. The p-q diagrams derived from the triaxial tests are shown in Figure 4b,c. Table 1 summarizes the main properties of the tested materials.

Table 1.
Properties of materials shown in Figure 3 used in the flow tests.
Specifically, the particle diameter of the crushed granite was assumed to be equal to the maximum nominal size as, according to the sieving analysis, the material passed through sieve no. 4 (mesh size of 4.75 mm) and was retained by sieve no. 6 (mesh size of 3.35 mm). Moreover, it is important to note that the friction-angle values of the materials reported in Table 1 approximately coincide with some values already reported in the literature [36,37].
2.5. Image Processing for Accessible Monitoring Applications
The processing phase of all frames captured by the MDA was conducted using the MATLAB®R2020a image processing toolbox. The algorithm was applied for every study unit following the workflow shown in Figure 5.

Figure 5.
Workflow of image processing for the estimation of the position and height of the mass profile in the experimental flume.
First, all files containing the pictures corresponding to a single study unit were read in the form of arrays containing 3 bands corresponding to red, green, and blue (RGB) colors. The color intensity at each band can vary from 0 to 255 units. In this case, to save computational efforts, only the first band (i.e., red band) was selected, thereby discarding the other two (i.e., green, and blue) for further analysis. Then, an area of interest was set to analyze exclusively the pixels containing the flume path. Therefore, the color intensity distribution was analyzed to select an intensity value to distinguish pixels containing granular material from those that do not contain any granular material. Figure 6 shows the overall color intensity histogram of study unit S3P1. In this case, pixels with intensities greater than 50 were considered to contain mass. This threshold was determined through statistical analysis of the intensity distribution, which showed a clear bimodal separation at this value.
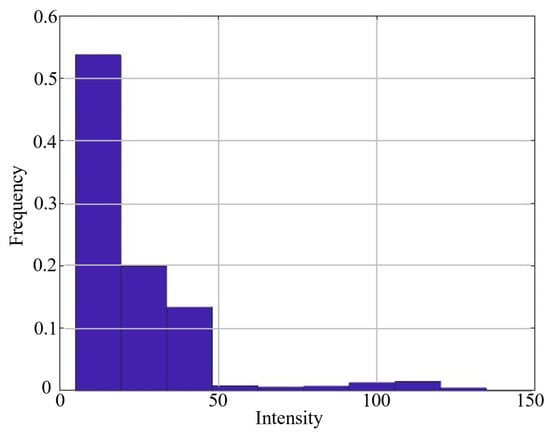
Figure 6.
Color intensity distribution of the red band in frames of tests S3P1–S3P15.
To eliminate noise in the processed images, further data corrections were applied to each picture after the binarization process. Specifically, pixels containing a 0 value but surrounded by pixels containing 1 were considered as 1. Also, pixel clusters containing 1 with fewer than 100 pixels (equivalent to approximately 0.1% of the total flume area) were considered as noise, so the entire cluster was assigned a 0 value. An example of a complete data process, up to image binarization, is shown in Figure 7: from the original frame shot by the acquisition system (Figure 7a) to the area of interest considering the red color band only (Figure 7b) and to the final clean and binarized image (Figure 7c).
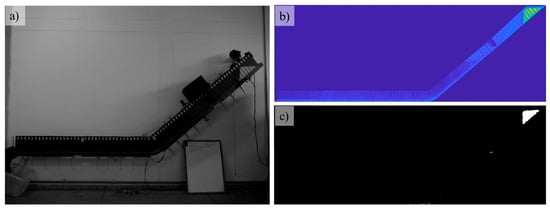
Figure 7.
Different stages of image processing for the first frame of experimental unit S3P1: (a) original loaded picture; (b) area of interest using only the red color band; (c) binarized image revealing the mass position.
To associate each pixel to the mass position, the analysis of the flume was divided into three parts: (1) the inclined section, noted as the acceleration part; (2) the curved section, noted as the transition part; and (3) the horizontal section, noted as the deposition part. In any case, the distances were taken all parallel to the flume base by simply considering a constant distance relationship between pixels in each segment and the real distance measured on the flume base: . In this way, the flowing mass depth was also assessed accordingly. Figure 8 shows the mass profile resulting from the processed frame shown in Figure 7c.
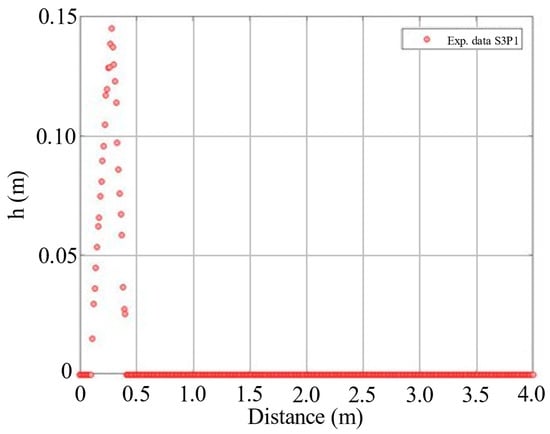
Figure 8.
Flow depth profile assessed from the binarized image in the first frame (t = 0 s) of experimental unit S3P1.
Based on the resulting flowing mass position and depth analysis, the instantaneous velocity was also analyzed. Control points were established every 5 cm from where the instantaneous velocity of the frontal surge of the flowing mass was evaluated.
3. Results and Discussion
3.1. Material Flow Behavior and Sustainable Risk Assessment Implications
Figure 9 shows several frames captured at different moments of the flow process for the results from tests S3P1–S3P30. Specifically, Figure 9a,b display the flow profiles of crystal (S3P1–S3P15) and granite (S3P16–S3P30) at the same point in time as the flow develops in the acceleration section, corresponding to the initiation and progression of the flow across the inclined plane. Figure 9a shows the mass position at the initial time (t = 0 s), while Figure 9b depicts the mass position shortly before the flowing mass enters the transition and deposition zones. Furthermore, Figure 9c,d illustrate the flow profiles of the materials as they enter the deposition section of the flume, passing through the curved part and finally coming to rest on the horizontal plane.
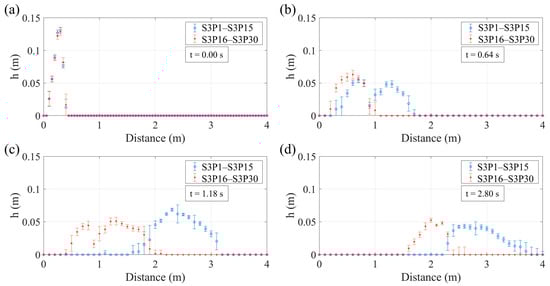
Figure 9.
Flow profile depth (h) and position and relative standard error for h at different experimental times: (a) t = 0 s, the beginning of the experiments; (b) t = 0.64 s, after the initiation of the experiment while the materials are still in the acceleration part; (c) t = 1.18 s, after the initiation of the experiment once the materials started moving on the deposition part; and (d) t = 2.8 s, after the initiation of the experiment when both materials come to rest.
The points in Figure 9 represent the mass position along the flume and the corresponding instantaneous flow depth (h), while the whiskers represent the standard deviation of h across the 15 samples. It can be observed that, at the same flow times, the crystal beads reach further distances than the crushed granite, especially in the acceleration zone. This indicates that the flowing glass mass of crystal beads gained more kinetic energy upon entering the transition and deposition zones compared to the crushed granite.
Quantitative analysis of frontal surge propagation revealed statistically significant differences between materials (Table 2). Crystal beads reached the transition zone (2.0 m) in 0.71 ± 0.04 s (mean ± SD, n = 15), while granite particles required 0.95 ± 0.06 s. At t = 0.7 s, the crystal beads’ center of mass was positioned at 90 ± 7 cm, compared to 75 ± 5 cm for granite. Final runout distances were 265 ± 18 cm (crystal) versus 210 ± 12 cm (granite), representing a 26% increase (95% CI: 19–33%, p < 0.001).
Table 2.
Comparative flow characteristics (mean ± SD, n = 15).
After passing through the transition zone, the crushed granite particles come to rest with their center of mass at approximately 2.1 m, while the center of mass of the crystal beads at rest lies around 2.65 m (approximately 26% farther). However, during the flow process, the mass of crystal beads contracts slightly upon hitting the curve in the transition zone but expands immediately afterward, with some frontal particles reaching the end of the flume and extending beyond the 4.0 m mark. In contrast, the flow of crushed granite contracts upon entering the transition zone, and the front of the flow remains almost stationary beyond this point. Few particles advance past the transition zone, not even reaching the end of the flume and coming to rest at around 2.6 m. This indicates that the runout distance of the crystal beads exceeds that of the crushed granite flow by more than 50%.
Even though the materials used in the experiments share many characteristics, the results indicate that the velocity (related to the kinetic energy and inertia of the flowing mass) developed by granite is significantly lower than that of the glass beads, naturally influencing the runout of the flowing masses. These results align with various studies conducted in controlled laboratory environments [38], demonstrating that particle shape and uniformity significantly affect the energy dissipation mechanism. Early qualitative results suggest that the density of the flowing mass may affect particle interactions, whether frictional (long-term) or collisional (short-term) [38].
More specifically, the irregular shape of granite particles appears to play a clear role in energy dissipation during the flow and deposition processes [39]. These concepts, when applied to dry granular flows, may still be relevant for understanding avalanches up to a certain volume [40]. In fact, the occurrence of several high-mobility landslides supports this idea. While some events involve displacements of several meters or kilometers from the source, others come to a halt when encountering an obstacle or change direction when reaching a road or a small flume [41,42,43,44].
3.2. Flow Velocity Development and Its Practical Implications
Figure 10 shows the instantaneous velocities of the frontal surges recorded at different control points along the experimental flume for the flow experiments with crystal beads (S3P1–S3P15) and crushed granite (S3P16–S3P30). The points represent the mean instantaneous velocity for each sample group, and the whiskers indicate the standard deviation among measurements within each group.
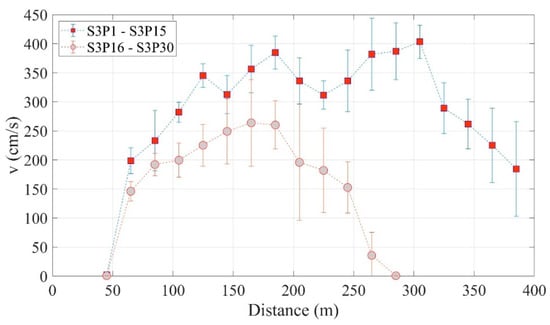
Figure 10.
Instant flow velocity of the frontal surge of tested materials: glass beads (S3P1–S3P15) and crushed granite (S3P16–S3P30).
As can be seen in Figure 10, immediately after the flowing masses are released in the acceleration zone, although the glass beads initially develop slightly higher velocities, creating a growing gap between the recordings, both frontal surges exhibit relatively high acceleration. This gap continues to widen as the frontal surge’s acceleration approaches a constant value just before the materials reach the transition zone (200 cm to 225 cm), where both flowing masses clearly experience a slight deceleration due to the change in direction.
However, while the velocity decreases to zero shortly after entering the deposition zone in the case of crushed granite, the frontal portion of the crystal beads accelerates again, causing some particles to roll to the end of the flume. These differences in the behavior of the frontal velocities between the two materials may be due to two factors related to the interactions among the particles in the flowing mass that are crucial for sustainable risk assessment. First, the higher velocities (i.e., greater kinetic energy) achieved by the crystal beads in the acceleration zone provide them with more energy, allowing them to travel farther in the deposition zone. Second, the inertia of the rear mass of the crystal beads exerts additional force, pushing the front particles forward and overcoming their deceleration.
To explore these concepts further, Figure 11 illustrates the position of the flowing mass at three different times for a single test with crystal beads (Figure 11a) and crushed granite (Figure 11b). Each time point represents a characteristic stage of the flow: at the end of the acceleration phase, as the mass passes through the transition zone, and when it is near rest in the deposition zone.
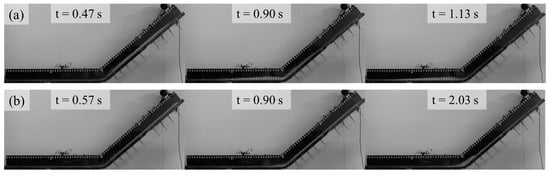
Figure 11.
Typical instantaneous mass positions in two flume tests for (a) crystal beads and (b) crushed granite at (from left to right) the end of the transition zone, when the mass breaks into the deposition zone, and right before entering rest.
As shown in Figure 11, the crystal beads, which develop higher frontal velocities than the crushed granite, reach the transition zone first, with a time difference of around 0.1 s. However, after crossing the transition zone, the crystal beads travel farther into the deposition zone compared to the granite particles, whose mass remains nearly stationary until it comes to a complete rest. In contrast, the crystal beads continue to move forward, driven by the inertia of the rear mass.
The velocity development of the frontal surge is an index of the maximum kinetic energy developed by the flowing mass, providing evidence of the macroscopic effects of micromechanical interactions within the flowing mass. This feature may be relevant for some practical applications in landslide risk mitigation, such as in the design of landslide protection barriers [9,45,46], and for sustainable infrastructure planning that balances cost-effectiveness with community safety.
The maximum shear rate () estimated 50 cm down the acceleration zone, whenever the flow presents maximum acceleration, is about 417 s−1 for the crystal beads and 290 s−1 for the granite particles. The frontal flow velocities found here are comparable to those reported in other studies, ranging from 3 to 4 m/s, aligning with observations from various laboratory experiments [24,25,30,31,44,47]. This consistency supports the applicability of these findings to sustainable landslide risk management strategies.
3.3. Dimensionless Analysis for Sustainable Hazard Characterization
Table 3 displays the dimensionless numbers characterizing the material flow in the acceleration part of the flume under quasi-steady conditions, providing fundamental insights applicable to sustainable landslide hazard assessment. Such conditions were considered here when the flowing mass completely deployed in the acceleration zone, instants before the frontal mass flow reached the transition zone. The frontal velocity in that part experiences nearly null acceleration, as can be derived from Figure 10. In both cases, the frontal surge reached a nearly constant velocity of approximately 380 cm/s for the crystal beads and 260 cm/s for the crushed granite. The dimensionless numbers specifically account for particle–particle and air–particle interactions, as the experiments were conducted with dry granular flows.
Table 3.
Dimensionless numbers for the characterization of material flow in the acceleration part of the experimental flume.
Statistical analysis using independent-samples t-tests confirmed that all dimensionless numbers differed significantly between materials (p < 0.01), validating the distinct flow-regime characteristics. The seven-fold difference in (p < 0.01) demonstrates statistically robust evidence that particle shape fundamentally alters the collision-to-friction ratio in granular flows.
The fluid viscosity is negligible, as the fluid in the flowing materials is air at 20 °C under atmospheric pressure conditions. This is confirmed by the small viscous-resistance inertial number (), varying by orders of magnitude between 10−8 and 10−7. The Bagnold number also confirms this picture; in both cases, , reflecting the clear dominance of granular collision stresses over fluid viscosity stresses, with nominal values within ranges already reported in the literature [6,29].
In any case, such a large number shows the clear dominance of particle inertia, as confirmed by a relatively high for both types of granular flow [17]. Therefore, the remaining important interactions driving the motion in the fluid mass are particle–particle interactions: friction and collisions. In this sense, the Savage number helps disentangle the relationship between those different interactions, showing a clear dominance of collisional stresses over friction stresses with in both cases, in line with reported values in laboratory and natural scales in different types of granular flows [23,48].
However, the lower uniformity of crushed granite particles, which also contributes to their higher friction angle, provides a larger particle–particle contact surface, allowing for longer interactions between particles compared to the crystal beads. The for crystal beads is around seven times greater than the characterizing crushed granite, providing a clear indication of the importance of collisional interactions in the acceleration of the two flows. This seven-fold difference demonstrates how particle characteristics can dramatically influence flow behavior, with direct implications for sustainable hazard assessment and territorial planning.
This seven-fold difference in demonstrates how relatively simple material characterization achievable with basic laboratory equipment and standard triaxial testing can capture fundamental differences in flow behavior. This approach significantly reduces the need for expensive rheological testing and complex numerical modeling while maintaining predictive accuracy for runout distances. The methodology is particularly suitable for resource-limited contexts in developing countries, where local technical teams can conduct preliminary hazard assessments using accessible equipment and procedures.
3.4. Implications for Sustainable Development and Climate Resilience
The experimental design aimed to capture and represent key physical and morphological features of debris flows. The flows reproduce predominant momentum direction flows with a distinctive change in slope. Notably, in many small to medium-sized events, such processes exhibit a natural tendency to decelerate or even come to rest when a change in flow direction occurs [49].
Consider the landslide shown in Figure 12. This event mobilized approximately m3 of material and traveled about 80 m downslope, reaching a major highway that connects a principal city with its airport [49]. Remarkably, the landslide came to a stop just a few meters after crossing onto the highway.
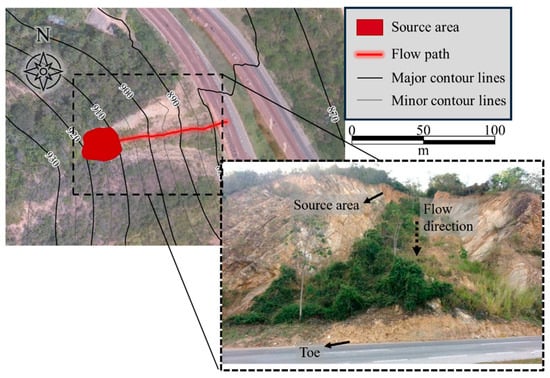
Figure 12.
Small to medium-sized landslide occurring in Giron (Santander, Colombia).
The event was investigated through a back-analysis of the landslide flow, which indicated that the solid phase of the mixture played a dominant role in controlling the mass deceleration and eventual deposition. This interpretation is consistent with the notion that the main physical characteristics of debris flows, as previously discussed, can be effectively reproduced in laboratory-scale experiments. Table 4 summarizes the geometric characteristics of both the large-scale landslide and the corresponding experimental flume setup.
Table 4.
Geometric comparison between the large-scale landslide and the laboratory flume experiment.
The total fall height and the horizontal runout ratio () of the experimental and real-scale landslides are very similar. More interestingly, the ratios between the remaining quantities observed in the experimental setup and those of the natural event correspond to a characteristic length scale of . For the assessment of vulnerability and resilience, it is essential to examine the scaling of time, flow depth, and velocity (Table 5). Velocity scales with , following the relation of . Flow depth scales with the length ratio (), while time scales with .
Table 5.
Scaling relationships for velocity, flow depth, and time between the laboratory experiment and the natural landslide.
In this case, the use of a scale ratio of provides a representative approximation of the real landslide event exposed here. Building on this scaling relationship, the subsequent exploration of vulnerability and resilience concepts is conducted with reference to this specific scale factor.
For simplicity, consider the case of granite in the forthcoming analyses of landslide resilience estimation (a) on highways and (b) in inhabited zones:
(a) Landslide resilience on a highway: ()
Recall the case sketched in Figure S1 in the Supplementary Materials. In this case, landslide vulnerability and resilience depend mainly on the landslide runout. Specifically, the farthest particles in the flume reached about 275 cm, or 50 cm after the change of direction on the horizontal zone. Thus, the scaled affected highway distance is . In that sense, applying with m, the landslide intensity would be .
In turn, the road susceptibility () is computed as , where 3 m is the minimum lane width required for a vehicle to continue safely and is the total paved width available in the analyzed section (24 m), yielding .
Finally, applying Equation (7) yields , and subsequently, using Equation (9), the calculated road resilience is .
(b) Landslide resilience in an inhabited area: ()
Landslide susceptibility and intensity were assessed differently in this case. Considering Equation (10), was assumed as suggested by [32]. Downslope structures were considered in this case, as represented in the sketch shown in Figure S2. It is plausible to consider such structures to belong to “rock masonry, concrete and timber” within medium fragility with . Accordingly, , considering houses of two and three floors, and , considering houses should have already served about half their lifetime. Applying Equation (10), .
House lines 1 and 2 are evidently reached by the main landslide body at its final position, but line 3 is right on the edge, with a few beads reaching it position (as similarly shown in Figure S2). Therefore, houses with a ~3.5 m width are posed in the trajectory of a flowing mass.
According to this example, there are three lines of houses potentially on the landslide’s runout way. Consider line 1 of houses starting right after the change of direction at 225 cm, line 2 starting at 250 cm, and line 3 starting at 275 cm. Lines 1 and 2 are evidently reached by the main landslide body at its final position, but line 3 is right on the edge, with a few beads reaching its position.
Table 6 shows the vulnerability and resilience estimations considering progressively evacuation of houses in line s1, 2, and 3.
Table 6.
Scaled physical parameters, intensity indices, and resulting vulnerability and resilience estimates for three representative house lines affected by the modeled landslide.
Runout distance prediction remains challenging despite advances in numerical modeling [15,50,51,52]. Our results suggest that dimensionless characterization offers a middle path between empirical correlations [10] and complex multi-phase models [14,15,16]. While physically based models like r.avaflow [14] and D-Claw [16] provide detailed predictions, they require extensive parameterization (>15 parameters) often unavailable in data-scarce regions.
Our approach reduces this to three measurable quantities—particle size (δ), friction angle (φ), and density ()—from which all dimensionless numbers derive. The seven-fold difference we observed aligns with field observations where landslides of similar volume exhibit vastly different runout [41,43], suggesting particle characteristics may explain part of this variance previously attributed to unknown factors. However, our dry granular simplification limits direct application to saturated debris flows where pore pressure [16] and rheology [15] dominate. The methodology is most applicable to (1) initial screening of potential source materials, (2) dry rock avalanche scenarios [40], and (3) comparative analysis of mitigation structure designs [9,45].
Many models aim to be highly accurate and are physically robust [50,51] but often require precise assessments of the triggered volume of soil or rock and the composition of the flowing material. However, uncertainties in these aspects present significant challenges to the practical application of many physically based models, particularly in resource-limited settings.
Some recent studies have attempted to address many of these issues by proposing innovative model calibration procedures [43,53,54]. Nevertheless, physical validation through intensive laboratory rheological testing is still required. Continuing the application of physically based flow models may further complicate an already complex phenomenon. Simplifying this complexity through flow regime characterization, as demonstrated in this study, could offer a promising approach to the development of practical and reliable tools for assessing landslide runout in localized and detailed studies, supporting sustainable risk management in vulnerable communities.
These practical considerations are particularly relevant in the Colombian context where this research was conducted. Many mountainous municipalities lack resources for sophisticated numerical modeling software or specialized expertise. The dimensionless analysis framework demonstrated here requires only basic flume equipment, standard cameras, and conventional triaxial testing capabilities—resources typically available at regional universities and technical institutes. This accessibility enables local authorities to develop preliminary hazard assessments and prioritize areas for detailed investigation, optimizing the use of limited financial and technical resources.
Climate change is expected to alter precipitation patterns and increase the frequency of extreme weather events, potentially exacerbating landslide hazards. The fundamental insights provided by this research contribute to the building of climate resilience by improving our understanding of landslide processes. This enhanced understanding can support the development of adaptive management strategies that can respond to changing hazard conditions while maintaining cost-effectiveness and social acceptability. These insights form the foundation for the development of comprehensive sustainability frameworks that integrate scientific understanding with practical implementation strategies.
3.5. Scale Effects and Experimental Limitations
While this study provides valuable insights into granular flow mechanics, several limitations must be considered when extrapolating results to field-scale landslides:
Scaling considerations: Laboratory flows (3 L) represent volumes 5–7 orders of magnitude smaller than typical debris flows (102–106 m3). Previous research [29,48] suggests that dimensionless parameters like and maintain physical relevance across scales, but absolute velocity predictions require careful consideration of scale-dependent effects such as air entrainment and lateral confinement. The Froude number (Fr = v/√(gh)) similarity principle, commonly used in hydraulic modeling, may provide guidance for the scaling of dynamic similarity, though particle-level interactions introduce additional complexity not present in continuum flow models.
Material simplification: Real landslides involve complex mixtures of particle sizes, shapes, and water content. Our dry, two-material approach isolates particle shape effects but cannot capture pore pressure dynamics or grain size distribution effects critical in natural events [13,14,15,16]. The absence of interstitial fluid limits direct application to saturated debris flows, where pore pressure dissipation and liquefaction phenomena significantly alter flow behavior. Future studies should investigate grain size polydispersity effects and progressive saturation conditions to bridge this gap between idealized experimental conditions and natural complexity.
Boundary conditions: The controlled flume environment (fixed roughness via 120 SIA sandpaper, smooth plexiglass walls, and a constant 40° slope) differs from irregular natural terrain. Field applications require adjustment factors accounting for topographic complexity, vegetation effects, and variable substrate conditions [43,55]. The two-dimensional confinement of the flume also restricts lateral spreading phenomena observed in unconfined natural flows [27,28].
Temperature and atmospheric effects: Experiments conducted under standard laboratory conditions (20 °C, 1 atm, corresponding to = 1.23 kg/m3 and μ = 1.81 × 10⁻⁵ Pa·s for air) may not represent high-altitude scenarios where reduced air density affects drag forces or extreme temperature conditions where viscosity variations become significant. However, the negligible values (10−6 order) obtained in this study suggest that reasonable atmospheric variations would not fundamentally alter the identification of a collision-dominated regime.
Despite these limitations, the dimensionless framework presented here provides a physically based foundation for preliminary hazard assessment, which is particularly valuable in resource-constrained settings where detailed site-specific modeling is impractical. The methodology enables rapid screening of potential landslide materials and identification of critical source areas requiring detailed investigation, supporting cost-effective risk management strategies aligned with sustainable development objectives.
4. Conclusions and Sustainability Implications
4.1. Scientific Contributions to Sustainable Risk Management
This experimental investigation provides fundamental insights contributing to more sustainable and scientifically rigorous approaches to landslide risk management. The study presents a systematic comparison of two dry granular flows involving different particle morphologies, conducted using a cost-effective flume setup consisting of a 2 m inclined section (40° acceleration zone), a 2 m horizontal section (deposition zone), and a 20 cm curved transition connecting the two parts. The experimental design, requiring only standard equipment available at regional universities, demonstrates that sophisticated understanding of flow mechanics does not necessarily require expensive infrastructure.
The tested materials—crushed granite particles and uniform crystal beads—share similar physical properties, including released volume (3 L), nominal particle size (4.75–6.00 mm), and material density (443–480 kg/m3). However, particle shape differences resulted in substantially different internal friction angles: 36.9° for non-uniform crushed granite versus 25.2° for highly uniform spherical beads. This 11.7° difference in friction angle, achievable through standard triaxial testing under low confining pressures (2–30 kPa), proved sufficient to characterize fundamentally different flow behaviors.
Key Experimental Findings
- (1)
- Flow mobility and energy dissipation: Crystal beads exhibited significantly higher mobility than crushed granite across all flow stages. Maximum velocities in the acceleration zone reached 380 ± 22 cm/s for crystal beads, compared to 260 ± 18 cm/s for granite (46% increase, p < 0.001). Final runout distances were 265 ± 18 cm versus 210 ± 12 cm, respectively (26% increase, p < 0.001), with some crystal bead particles reaching beyond the 4 m flume length, while granite flows stopped consistently around 2.6 m.
- (2)
- Dimensionless flow characterization: The Savage number () effectively distinguished collision-dominated from friction-dominated regimes. Crystal beads exhibited = 23.91 ± 2.14, compared to = 3.69 ± 0.42 for granite particles (7-fold difference, p < 0.001), demonstrating that the smooth, spherical nature of crystal beads promotes particle collisions as the dominant energy transfer mechanism, while the irregular shape of granite enhances sustained frictional contact.
- (3)
- Regime validation: The Bagnold number confirmed purely inertial regimes > 106) for both materials, with negligible fluid viscosity effects (~10−6). This validates the particle–particle interaction framework and justifies neglecting air–particle viscous effects in dry granular flow modeling at these scales.
- (4)
- Physical mechanisms: The sustained momentum and longer runout of crystal beads result from two complementary mechanisms: (i) higher kinetic energy accumulated during acceleration due to lower frictional dissipation and (ii) continued forward push from rear mass inertia during deposition. In contrast, granite flows experience rapid energy dissipation upon entering the transition zone, with front particles decelerating faster than rear particles can provide forward momentum.
Practical implications for sustainable risk assessment: These results have direct relevance for landslide susceptibility and risk mitigation in resource-limited contexts. The findings demonstrate the following:
- -
- Material screening is feasible: Simple laboratory characterization (particle size distribution, triaxial testing, and visual shape assessment), combined with dimensionless analysis, provides preliminary flow regime identification without expensive rheological testing or complex numerical modeling.
- -
- Runout prediction can be improved: Understanding whether source materials exhibit collision-dominated (high ) or friction-dominated (low ) behavior helps bound expected runout distances. Our results suggest collision-dominated materials may travel 50–100% farther than friction-dominated materials with similar volume and initial conditions.
- -
- Design parameters can be informed: The observed differences in velocity and impact force (46% velocity increase translates to >100% kinetic energy increase) directly affect protective barrier design requirements, with collision-dominated flows requiring more robust structures [9,45,46].
- -
- Cost-effective monitoring is possible: The image processing methodology demonstrated here (standard camera, MATLAB processing, and threshold-based binarization) can be adapted for field monitoring applications or educational demonstrations in developing regions.
Limitations and scaling considerations: As discussed in Section 3.5, several limitations must be acknowledged. The 3-L laboratory scale represents volumes five to seven orders of magnitude smaller than typical field-scale debris flows. While dimensionless parameters theoretically maintain relevance across scales [29,48], absolute predictions require careful consideration of scale-dependent effects. The dry granular simplification excludes pore pressure effects critical in saturated natural events [13,14,15,16]. The controlled boundary conditions (fixed roughness, smooth walls, and constant slope) differ from irregular natural terrain requiring adjustment factors [43,55]. Despite these limitations, the fundamental physics revealed herein—that particle shape governs the collision-to-friction ratio, which, in turn, determines mobility—remain applicable across scales. The methodology provides a physically based screening tool particularly valuable where detailed site-specific modeling is impractical due to resource constraints.
4.2. Contributions to Sustainable Development Goals
This research meaningfully advances several United Nations Sustainable Development Goals through practical, implementable scientific contributions: ** SDG 11 (Sustainable Cities and Communities): ** The accessible experimental methodology and dimensionless analysis framework support evidence-based land-use planning in mountainous regions. By enabling preliminary hazard characterization using standard university laboratory equipment, the approach democratizes scientific risk assessment capabilities. Local authorities can identify high-risk source materials and prioritize detailed investigations, optimizing limited technical and financial resources. The 50% runout difference observed between material types demonstrates that material characterization substantially improves hazard zone delineation accuracy, directly informing safer urban development decisions.
SDG 13 (Climate Action): Climate change projections indicate increased frequency of extreme precipitation events in mountainous regions, potentially triggering more landslides [41]. Understanding fundamental flow mechanics—specifically, how particle characteristics control runout through collision versus friction dominance—provides foundational knowledge for adaptive risk management strategies. The framework enables rapid assessment of newly exposed source materials as climate-driven landscape changes alter slope stability conditions. Cost-effective screening identifies critical areas requiring monitoring or intervention, supporting efficient allocation of climate adaptation resources.
SDG 1 (No Poverty): Landslide disasters disproportionately impact economically vulnerable communities in mountainous regions, potentially trapping survivors in poverty through the destruction of homes, infrastructure, and livelihoods. Improved risk assessment capabilities—achievable through the practical methodologies demonstrated here—enable better protective measures and early warning systems. The emphasis on cost-effectiveness ensures that resource-constrained communities can implement scientifically sound risk reduction strategies without requiring expensive external expertise or proprietary software. This capacity building supports community resilience and reduces disaster-induced economic vulnerabilities.
Broader sustainability implications: Beyond specific SDG contributions, this research exemplifies sustainable scientific practice by achieving rigorous understanding through the use of accessible methods, prioritizing replicability and knowledge transfer, and explicitly considering implementation constraints in developing regions. The experimental design emphasizes locally available materials (plexiglass, standard cameras, and conventional triaxial equipment) and open-source processing tools (MATLAB algorithms adaptable to Python (2022) or R), facilitating technology transfer and capacity building. The dimensionless analysis framework reduces dependence on expensive commercial software while maintaining physical rigor, supporting the democratization of hazard assessment capabilities. This philosophical approach—sophisticated understanding through simple means—aligns with core sustainability principles of resource efficiency and equitable access to knowledge.
Future research directions: Building upon these foundations, future investigations should address the following:
- (1)
- Grain size polydispersity: Natural landslides involve wide particle size distributions. Systematic investigation of polydisperse mixtures would reveal whether dimensionless characterization remains robust or requires refinement for realistic grain size distributions.
- (2)
- Saturation effects: Progressive introduction of interstitial fluid (water content of 0–30%) would bridge the gap between dry granular flows and saturated debris flows, elucidating transition thresholds where pore pressure begins dominating flow behavior.
- (3)
- Scale-up validation: Larger experimental facilities (10–100 m3 volumes) or field-scale validation using instrumented natural debris flows would quantify scale-dependent effects and refine extrapolation procedures from laboratory to field applications.
- (4)
- Three-dimensional effects: Unconfined flow experiments over irregular 3D terrain [27,28] would characterize lateral spreading and channelization phenomena not captured in 2D flume studies, improving predictions for complex natural topography.
- (5)
- Material library development: Systematic testing of diverse geological materials (volcanic ash, weathered schist, limestone fragments, and glacial till) would establish a reference database correlating material properties with dimensionless flow parameters, enabling rapid preliminary assessment based on geological mapping.
- (6)
- Integration with monitoring: Coupling laboratory-derived dimensionless characterization with real-time monitoring systems (seismic sensors and hydrological stations) could enable dynamic hazard assessment that adjusts to changing conditions during extreme events. These research directions maintain the core philosophy of accessible, implementable science supporting sustainable risk management in vulnerable communities worldwide.
Supplementary Materials
The following supporting information can be downloaded at: https://www.mdpi.com/article/10.3390/su172210236/s1, Figure S1. Schematic representation of a landslide affecting a highway in experimental scale, Figure S2. Schematic representation of a landslide affecting an inhabited zone in experimental scale
Author Contributions
Conceptualization, D.C.R.Q. and M.A.T.C.; methodology, M.A.T.C.; software, D.C.R.Q.; validation, M.A.T.C., G.C.C. and D.C.R.Q.; formal analysis, D.C.R.Q.; investigation, M.A.T.C.; writing—original draft preparation, D.C.R.Q.; writing—review and editing, G.C.C.; visualization, G.C.C.; supervision, M.A.T.C.; project administration, M.A.T.C.; funding acquisition, M.A.T.C. All authors have read and agreed to the published version of the manuscript.
Funding
This Study is part of the research Project entitled “Método para la estimación de distancias de viaje de movimientos en masa con base en aproximaciones geométricas”, which was funded by “PATRIMONIO AUTÓNOMO FONDO DE FINANCIAMIENTO PARA LA CIENCIA, LA TECNOLOGÍA Y LA INNOVACIÓN FRANCISCO JOSÉ DE CALDAS” granted to Universidad Nacional de Colombia by Ministerio de Ciencia, Tecnología e Innovación—MinCiencias (Grant no. 80740-509-2020, Call 852-2019).
Institutional Review Board Statement
Not applicable.
Informed Consent Statement
Not applicable.
Data Availability Statement
All raw data can be kindly provided by the corresponding author upon request.
Acknowledgments
The results presented in this research were derived within two initiatives funded by the Ministry of Science, Technology and Research of Colombia (MinCiencias): the research project entitled “Method for estimating runout distances of landslides based on geometric approximations” (Call 852 of 2019) and the research scholarship titled “Jovenes Investigadores e Innovadores” (Call 761 of 2016).
Conflicts of Interest
The authors declare no conflicts of interest.
References
- Boton, M.; Azéma, E.; Estrada, N.; Radjaï, F.; Lizcano, A. Quasistatic rheology and microstructural description of sheared granular materials composed of platy particles. Phys. Rev. E 2013, 87, 032206. [Google Scholar] [CrossRef]
- Börzsönyi, T.; Szabó, B.; Törös, G.; Wegner, S.; Török, J.; Somfai, E.; Bien, T.; Stannarius, R. Orientational order and alignment of elongated particles induced by shear. Phys. Rev. Lett. 2012, 108, 228302. [Google Scholar] [CrossRef] [PubMed]
- Salm, B. Contribution to avalanche dynamics. In International Symposium on Scientific Aspects of Snow and Ice Avalanches; IAHS: Davos, Switzerland, 1965; pp. 199–214. [Google Scholar]
- Beghin, P.; Olagne, X. Experimental and theoretical study of the dynamics of powder snow avalanches. Cold Reg. Sci. Technol. 1991, 19, 317–326. [Google Scholar] [CrossRef]
- Sovilla, B.; McElwaine, J.N.; Louge, M.Y. The structure of powder snow avalanches. Comptes Rendus Phys. 2015, 16, 97–104. [Google Scholar] [CrossRef]
- Iverson, R.M. The physics of debris flows. Rev. Geophys. 1997, 35, 245–296. [Google Scholar] [CrossRef]
- Ma, T.; Chen, H.; Zhang, K.; Shen, L.; Sun, H. The rheological intelligent constitutive model of debris flow: A new paradigm for integrating mechanics mechanisms with data-driven approaches by combining data mapping and deep learning. Expert Syst. Appl. 2025, 269, 126405. [Google Scholar] [CrossRef]
- Vagnon, F.; Segalini, A. Debris flow impact estimation on a rigid barrier. Nat. Hazards Earth Syst. Sci. 2016, 16, 1691–1697. [Google Scholar] [CrossRef]
- Cuomo, S.; Di Perna, A.; Martinelli, M. Design Protection Barriers Against Flow-Like Landslides. In Progress in Landslide Research and Technology; Springer: Cham, Switzerland, 2023; pp. 123–136. [Google Scholar] [CrossRef]
- Fannin, R.J.; Wise, M.P. An empirical-statistical model for debris flow travel distance. Can. Geotech. J. 2001, 38, 982–994. [Google Scholar] [CrossRef]
- Gregoretti, C.; Degetto, M.; Boreggio, M. GIS-based cell model for simulating debris flow runout on a fan. J. Hydrol. 2016, 534, 326–340. [Google Scholar] [CrossRef]
- Fan, L.; Lehmann, P.; McArdell, B.; Or, D. Linking rainfall-induced landslides with debris flows runout patterns towards catchment scale hazard assessment. Geomorphology 2017, 280, 1–15. [Google Scholar] [CrossRef]
- Iverson, R.M. Debris-flow mechanics. In Debris-Flow Hazards and Related Phenomena; Springer: Berlin/Heidelberg, Germany, 2005; pp. 105–134. [Google Scholar] [CrossRef]
- Mergili, M.; Fischer, J.T.; Krenn, J.; Pudasaini, S.P. R.avaflow v1, an advanced open-source computational framework for the propagation and interaction of two-phase mass flows. Geosci. Model Dev. 2017, 10, 553–569. [Google Scholar] [CrossRef]
- Pudasaini, S.P.; Mergili, M. A Multi-Phase Mass Flow Model. J. Geophys. Res. Earth Surf. 2019, 124, 2920–2942. [Google Scholar] [CrossRef]
- George, D.L.; Iverson, R.M. A depth-averaged debris-flow model that includes the effects of evolving dilatancy. II. Numerical predictions and experimental tests. Proc. R. Soc. A Math. Phys. Eng. Sci. 2014, 470, 20130820. [Google Scholar] [CrossRef]
- Delannay, R.; Valance, A.; Mangeney, A.; Roche, O.; Richard, P. Granular and particle-laden flows: From laboratory experiments to field observations. J. Phys. D Appl. Phys. 2017, 50, 053001. [Google Scholar] [CrossRef]
- Burns, W.J. USGS debris flow flume at H. J. Andrews Experimental Forest. Or. Geol. 2006, 67, 11–12. [Google Scholar]
- Iverson, R.M.; Costa, J.E.; LaHusen, R.G. Debris-Flow Flume at H.J. Andrews Experimental Forest, Oregon; USGS Open-File Report 92-483; U.S. Geological Survey: Reston, VA, USA, 1992; pp. 2–3.
- McArdell, B.W.; Hirschberg, J.; Graf, C.; Boss, S.; Badoux, A. Illgraben debris-flow characteristics 2019–2022. EnviDat 2023. [Google Scholar] [CrossRef]
- Yune, C.Y.; Kim, B.J.; Jun, K.J.; Park, S.D.; Lee, S.W.; Kim, G.H.; Lee, C.W.; Paik, J.C. Real-scale experiment of debris flow in a natural gulley: Key findings and lessons learned. Landslides 2023, 20, 2757–2774. [Google Scholar] [CrossRef]
- Ng, C.W.W.; Choi, C.E.; Law, R.P.H. Longitudinal spreading of granular flow in trapezoidal channels. Geomorphology 2013, 194, 84–93. [Google Scholar] [CrossRef]
- De Haas, T.; Braat, L.; Leuven, J.R.F.W.; Lokhorst, I.R.; Kleinhans, M.G. Effects of debris flow composition on runout, depositional mechanisms, and deposit morphology in laboratory experiments. J. Geophys. Res. F Earth Surf. 2015, 120, 1949–1972. [Google Scholar] [CrossRef]
- Greve, R.; Hutter, K. Motion of a granular avalanche in a convex and concave curved chute- Experiments and theoretical predictions. Phil. Trans. R. Soc. A 1993, 342, 573–600. [Google Scholar] [CrossRef]
- Savage, S.B.; Hutter, K. The motion of a finite mass of granular material down a rough incline. J. Fluid Mech. 1989, 199, 177. [Google Scholar] [CrossRef]
- Xiao, S.; Su, L.; Jiang, Y.; Qu, X.; Xu, M.; Hu, X.; Liu, Z. Experimental investigation on the impact force of the dry granular flow against a flexible barrier. Landslides 2020, 17, 1465–1483. [Google Scholar] [CrossRef]
- Gray, J.M.N.T.; Wieland, M.; Hutter, K. Gravity-driven free surface flow of granular avalanches over complex basal topography. Proc. R. Soc. Lond. A 1999, 455, 1841–1874. [Google Scholar] [CrossRef]
- Iverson, R.M.; Logan, M.; Denlinger, R.P. Granular avalanches across irregular three-dimensional terrain: 2. Experimental tests. J. Geophys. Res. Earth Surf. 2004, 109, 1–16. [Google Scholar] [CrossRef]
- Denlinger, R.P.; Iverson, R.M. Flow of variably fluidized granular masses across three-dimensional terrain: 2. Numerical predictions and experimental tests. J. Geophys. Res. 2001, 106, 553. [Google Scholar] [CrossRef]
- Hutter, K.; Koch, T.; Plüss, C.; Savage, S.B. The Dynamics of Avalanches of Granular-Materials from Initiation to Runout Part II. Experiments. Acta Mech. 1995, 109, 127–165. [Google Scholar] [CrossRef]
- Jiang, Y.J.; Towhata, I. Experimental study of dry granular flow and impact behavior against a rigid retaining wall. Rock Mech. Rock Eng. 2013, 46, 713–729. [Google Scholar] [CrossRef]
- Ávila, G.E.; Cubillos, C.E.; Granados, A.E.; Bello, E.; Rodríguez, É.A.; Rodríguez, C.E.; Ruiz, G.L. Guía Metodológica Para Estudios de Amenaza, Vulnerabilidad y Riesgo Por Movimientos en Masa; Buitrón Paz, V.E., Molina Ochoa, M.J., Eds.; Servicio Geológico Colombiano: Bogotá, Colombia, 2015; Issue 31.
- Roman Quintero, D.C.; Ortiz Contreras, J.D.; Tapias Camacho, M.A.; Oviedo-Ocaña, E.R. Empirical Estimation of Landslide Runout Distance Using Geometrical Approximations in the Colombian North–East Andean Region. Sustainability 2024, 16, 793. [Google Scholar] [CrossRef]
- Tian, N.; Lan, H. The indispensable role of resilience in rational landslide risk management for social sustainability. Geogr. Sustain. 2023, 4, 70–83. [Google Scholar] [CrossRef]
- Du, J.; Yin, K.; Lacasse, S.; Nadim, F. Quantitative Vulnerability Estimation of Structures for Individual Landslide: Application to the Metropolitan Area of San Salvador, El Salvador. Electron. J. Geotech. Eng. 2014, 19, 1251–1264. [Google Scholar]
- Xu, W.D.; Li, X.F.; Yang, W.W.; Jia, H.J. Triaxial test on glass beads simulating coarse-grained soil. Res. Cold Arid Reg. 2022, 14, 274–280. [Google Scholar] [CrossRef]
- Deganutti, A.M.; Tecca, P.R.; Genevois, R. Characterization of friction angles for stability and deposition of granular material. Italian journal of engineering geology and environment. Ital. J. Eng. Geol. Environ. 2011, 313–318. [Google Scholar] [CrossRef]
- Garcia Aragon, J.A. Granular-fluid chute flow: Experimental and numerical observations. J. Hydraul. Eng. 1995, 121, 355–364. [Google Scholar] [CrossRef]
- Cagnoli, B.; Romano, G.P. Effect of grain size on mobility of dry granular flows of angular rock fragments: An experimental determination. J. Volcanol. Geotherm. Res. 2010, 193, 18–24. [Google Scholar] [CrossRef]
- Davies, T.R.; McSaveney, M.J. Runout of dry granular avalanches. Can. Geotech. J. 1999, 36, 313–320. [Google Scholar] [CrossRef]
- Hürlimann, M.; Coviello, V.; Bel, C.; Guo, X.; Berti, M.; Graf, C.; Hübl, J.; Miyata, S.; Smith, J.B.; Yin, H.Y. Debris-flow monitoring and warning: Review and examples. Earth Sci. Rev. 2019, 199, 102981. [Google Scholar] [CrossRef]
- Blahut, J.; van Westen, C.J.; Sterlacchini, S. Analysis of landslide inventories for accurate prediction of debris-flow source areas. Geomorphology 2010, 119, 36–51. [Google Scholar] [CrossRef]
- Peruzzetto, M.; Mangeney, A.; Grandjean, G.; Levy, C.; Thiery, Y.; Rohmer, J.; Lucas, A. Operational Estimation of Landslide Runout: Comparison of Empirical and Numerical Methods. Geosciences 2020, 10, 424. [Google Scholar] [CrossRef]
- Zhou, G.G.D.; Li, S.; Song, D.; Choi, C.E.; Chen, X. Depositional mechanisms and morphology of debris flow: Physical modelling. Landslides 2019, 16, 315–332. [Google Scholar] [CrossRef]
- Albaba, A.; Lambert, S.; Faug, T. Dry granular avalanche impact force on a rigid wall: Analytic shock solution versus discrete element simulations. Phys. Rev. E 2018, 97, 052903. [Google Scholar] [CrossRef]
- Shen, W.; Zhao, T.; Zhao, J.; Dai, F.; Zhou, G.G.D. Quantifying the impact of dry debris flow against a rigid barrier by DEM analyses. Eng. Geol. 2018, 241, 86–96. [Google Scholar] [CrossRef]
- Greve, R.; Koch, T.; Hutter, K. Unconfined flow of granular avalanches along a partly curved surface. II. Experiments and numerical computations. Proc. R. Soc. Lond. A 1994, 445, 415–435. [Google Scholar]
- Zhou, G.G.D.; Ng, C.W.W. Dimensional analysis of natural debris flows. Can. Geotech. J. 2010, 47, 719–729. [Google Scholar] [CrossRef]
- Iverson, R.M. Scaling and design of landslide and debris-flow experiments. Geomorphology 2015, 244, 9–20. [Google Scholar] [CrossRef]
- Palacio Cordoba, J.; Mergili, M.; Aristizábal, E. Probabilistic landslide susceptibility analysis in tropical mountainous terrain using the physically based r.slope.stability model. Nat. Hazards Earth Syst. Sci. 2020, 20, 815–829. [Google Scholar] [CrossRef]
- Kattel, P.; Kafle, J.; Fischer, J.T.; Mergili, M.; Tuladhar, B.M.; Pudasaini, S.P. Interaction of two-phase debris flow with obstacles. Eng. Geol. 2018, 242, 197–217. [Google Scholar] [CrossRef]
- Iverson, R.M.; Denlinger, R.P. Flow of variably fluidized granular masses across three-dimensional terrain 1. Coulomb mixture theory. J. Geophys. Res. 2001, 106, 537–552. [Google Scholar] [CrossRef]
- Aaron, J.; McDougall, S.; Nolde, N. Two methodologies to calibrate landslide runout models. Landslides 2019, 16, 907–920. [Google Scholar] [CrossRef]
- Sun, X.; Zeng, P.; Li, T.; Zhang, T.; Feng, X.; Jimenez, R. Run-out distance exceedance probability evaluation and hazard zoning of an individual landslide. Landslides 2021, 18, 1295–1308. [Google Scholar] [CrossRef]
- Zhao, H.; Kowalski, J. Bayesian active learning for parameter calibration of landslide run-out models. Landslides 2022, 19, 2033–2045. [Google Scholar] [CrossRef]
Disclaimer/Publisher’s Note: The statements, opinions and data contained in all publications are solely those of the individual author(s) and contributor(s) and not of MDPI and/or the editor(s). MDPI and/or the editor(s) disclaim responsibility for any injury to people or property resulting from any ideas, methods, instructions or products referred to in the content. |
© 2025 by the authors. Licensee MDPI, Basel, Switzerland. This article is an open access article distributed under the terms and conditions of the Creative Commons Attribution (CC BY) license (https://creativecommons.org/licenses/by/4.0/).