You are currently viewing a new version of our website. To view the old version click .
Sustainability
  • Article
  • Open Access

15 November 2025

Resident Satisfaction-Based Evaluation Framework and Policy Optimization for Small-Town Infrastructure: Evidence from Wuhan, China

,
and
School of Civil Engineering and Architecture, Wuhan Polytechnic University, Wuhan 430023, China
*
Author to whom correspondence should be addressed.
Sustainability2025, 17(22), 10223;https://doi.org/10.3390/su172210223 
(registering DOI)

Abstract

This study evaluates resident satisfaction with small-town infrastructure and generates a policy-ready ranking of improvement priorities using a modified importance–performance analysis (IPA) that infers indicator importance statistically rather than from self-reported scores. We surveyed small towns in the new districts of Wuhan, China, and developed a resident satisfaction-based evaluation framework spanning road and transport, basic living facilities, public services, public activity space, and townscape and character. We assessed reliability in SPSS, estimated implicit importance via partial correlations with overall satisfaction, and mapped indicators into quadrants to set priorities. Results indicate that overall performance is perceived as generally good, yet road and transport and townscape and character consistently emerge as high importance/low satisfaction domains, and there was notable variation across towns. The framework offers a replicable, user-centered diagnostic that turns resident feedback into a ranked set of priority indicators to guide targeted investment and operations, with transferability to comparable regions.

1. Introduction

Small towns in developing countries face critical infrastructure deficits as they undergo rapid urbanization and economic transformation []. These settlements serve as crucial bridges between urban centers and rural areas [], yet their infrastructure development often lags significantly behind both metropolitan areas and development needs [], creating persistent gaps between service provision and resident expectations []. Addressing these gaps is integral to sustainable urban development and advances SDG 11 by improving the accessibility, quality, reliability, and safety of local infrastructure in small towns, thereby enabling more inclusive, resilient, and sustainable settlements [].
This inadequacy stems primarily from systematic resource constraints []. Infrastructure deficits stem not merely from shortcomings in municipal or regional management, but rather from structural territorial imbalances resulting from large-scale political decisions, such as the reform of the hukou system, the promotion of strategic urban hubs, and the balancing of development between the eastern and western regions []. Municipal governments typically allocate limited budgets to basic maintenance activities—environmental sanitation, green space upkeep, and emergency repairs—rather than comprehensive upgrades []. This reactive approach, while necessary for immediate functionality, fails to address underlying capacity deficits and rarely translates into meaningful improvements in residents’ quality of life []. China’s experience exemplifies these broader challenges: as the world’s largest developing economy, China has invested substantially in small-town infrastructure through various national initiatives [], yet resource limitations and prioritization challenges persist across most of its small towns [], providing a representative case for examining infrastructure development in resource-constrained settings.
Current infrastructure evaluation approaches predominantly employ objective, engineering-based indicators such as facility coverage rates and technical specifications []. While these supply-side metrics provide measurable benchmarks, they may not adequately capture residents’ actual experiences and priorities. Government performance-oriented assessments, though valuable for administrative accountability, similarly focus on input–output ratios rather than on user satisfaction and service quality from the demand perspective []. Recent research has increasingly recognized the importance of resident-centered approaches, yet applications of satisfaction-based assessments in small town infrastructure contexts remain limited, particularly for translating evaluation results into actionable prioritization guidance in resource-constrained environments []. Traditional needs assessments identify deficits but provide limited guidance on which improvements would most effectively enhance residents’ well-being per unit of investment. This challenge necessitates evaluation approaches that assess current performance from users’ perspectives and systematically identify improvement priorities [,].
This study addresses these gaps by developing and applying a resident satisfaction-based framework for evaluating small-town infrastructure and identifying improvement priorities under resource constraints. We focus on small towns in the new urban districts of Wuhan, China for three reasons. First, Wuhan is a national hub in central China where rapid peri-urban expansion and town reclassification have produced a dense constellation of small towns undergoing continuous infrastructure upgrading—an appropriate setting for evaluating resident satisfaction with everyday services under resource constraints []. Second, these new districts exhibit pronounced within-city heterogeneity (e.g., industrial parks versus ecological conservation zones; inner peri-urban versus outer rural fringes), providing sufficient variation in service performance and lived experience to test the framework across contrasting contexts. Third, the governance and delivery arrangements for small-town infrastructure in Wuhan are broadly representative of many rapidly urbanizing regions in China; by contrast, core urban districts are excluded because their infrastructure standards, financing, and management regimes are structurally different from small-town settings—the true focus of this study. While Wuhan serves as the empirical case, the proposed framework is designed to be portable and informative for comparable regions.The research examines two primary questions: (1) What is the quality of small-town infrastructure services from the perspective of resident satisfaction? (2) How can priority areas for improvement be identified under resource constraints?
Using a modified importance–performance analysis that statistically derives indicator importance rather than relying on direct respondent assessments, this research provides an evidence-based tool for infrastructure prioritization in small towns.The methodology is demonstrated through a comprehensive case study of Chinese small towns, offering transferable insights for developing countries facing similar challenges.

2. Data and Methodology

2.1. Evaluation Framework and Indicators

To evaluate resident satisfaction with small-town infrastructure in a rigorous and operational way, we synthesized evidence from international scholarship and domestic policy practice and aligned indicator design with residents’ everyday experience rather than engineering inputs. We also invited domain experts in planning, transport, public services, and small-town governance to review and refine the indicator system, ensuring its scientific rigor and representativeness. Guided by the principles of validity, internal coherence, and feasibility, we constructed a five-dimensional framework tailored to Wuhan’s small towns—road and transport, basic living facilities, public services, public activity space, and townscape and character—covering 26 s-level indicators (Table 1).Indicator selection followed six principles: resident observability, outcome relevance, actionability, balanced coverage, feasibility/clarity, and non-redundancy. Overlap control was ensured through expert screening, pilot wording, and checks of internal consistency and inter-indicator associations; conceptually proximate items are kept distinct by separate operational definitions and decision levers.
Table 1. Evaluation framework and questionnaire items for small-town infrastructure.
Road and transport (A). Accessibility is the primary performance attribute of transport systems and a key determinant of perceived service quality; accordingly, we include road-network accessibility (A1) and road quality (A2) as foundational indicators. Ancillary road facilities (A3) are standard criteria in transport evaluation and strongly linked to user utility and satisfaction []. For public transport (A4), user-centered quality attributes (reliability, comfort, and information) are established predictors of satisfaction []. For parking facilities (A5), the evidence base shows that supply, pricing and management materially affect congestion, access, and user experience, justifying its inclusion [].
Basic living facilities (B). Basic living facilities (B) are elevated to a first-level dimension since safe water, sanitation, waste services, and reliable electricity are essential urban services with direct impacts on public health and everyday quality of life. International policy frameworks [] explicitly prioritize universal and reliable access to these services. Water supply (B1) is captured via reliability and perceived quality because unsafe/intermittent water supply has well-documented health and satisfaction implications []. Electricity supply (B2) is tracked through reliability, given the robust links between outages and household welfare []. Stormwater drainage (B3) reflects flood-risk management and the performance of blue-green infrastructure; best practice stresses sustainable urban drainage for service reliability and amenity []. Waste collection and recycling (B4) and sewage treatment (B5) are standard municipal services with demonstrated public-health and environmental effects, thus salient to residents’ satisfaction [,]. Public toilets (B6) are included as a basic service with direct experiential salience in small-town daily life.
Public services (C). We include public services (C) as a first-level dimension because education, health care, and cultural/leisure and convenience services underpin daily functioning and opportunity, and are consistently linked to subjective well-being and life satisfaction []. Educational facilities (C1) are specified by accessibility and learning environment because school environments are recognized determinants of student well-being and equity of access []. Health care facilities (C2) are measured by perceived accessibility and adequacy in line with established access dimensions (availability, accessibility, acceptability, and quality) []. Cultural and recreational facilities (C3), leisure and sports services (C4), commercial services (C5), elder care services (C6) and convenience services (C7) capture the service bundle that supports daily living in “15-min” communities and increasingly shape satisfaction in Chinese towns [].
Public activity space (D). Public activity space (D) warrants first-level status as the availability and quality of parks/green space, squares, and walkable pedestrian networks are associated with physical and mental health, social cohesion, and higher satisfaction with the local environment []. A large body of evidence links parks and green spaces (D1) to physical and mental health and to perceived neighborhood quality; hence, greening is treated as a core indicator []. Public squares (D2), accessible facilities (D3), and pedestrian pathways (D4) operationalize walkability, inclusivity, and everyday public-realm performance—dimensions consistently associated with higher satisfaction and active use of space [,]. Design guidance further supports a quality-led approach to public-space provision [].
Townscape and character (E). Townscape and character (E) is defined as a first-level dimension because place identity, heritage conservation, and visual coherence shape place attachment, evaluative judgements, and amenity. International guidance (e.g., UNESCO’s Historic Urban Landscape recommendation; Carmona’s “place value” synthesis) emphasizes integrating heritage and design quality in contemporary urban development. Landmark features (E1), heritage conservation (E2), and townscape integration (E4) capture place identity and coherence, which are central to residents’ attachment and evaluative judgements []. Given the strong visual salience of overhead utility lines (E3) in many Chinese small towns, we track residents’ perceptions of visual clutter; international evidence shows clear amenity penalties and public willingness to pay for undergrounding where feasible [].
Beyond perception-based indicators, recent work shows that digital urban models and AI-driven/self-learning design frameworks can turn multi-source data into adaptive, data-driven infrastructure planning []. For example, self-learning building frameworks demonstrate how sensing–analysis–feedback loops continuously adjust form and operations to incoming data []; related computational design studies use algorithmic modeling to optimize performance under environmental constraints []. These approaches are complementary to our modified IPA: the AI layer can simulate and update improvement options in real time, while our framework provides the resident-centered performance targets and ranked priorities to steer those updates. Exploring such coupling is outside the present survey’s scope but offers a clear path to evolve the framework in future work.
All second-level indicators are operationalized as five-point resident satisfaction items and are thus treated as dimensionless variables. This design has two main benefits. First, it enables cross-domain comparability and aggregation (item → indicator → dimension → overall) without mixing heterogeneous engineering units. Second, by standardizing polarity (higher = better, with reverse-coding where needed) and applying a linear rescaling to 20–100 for presentation only, we improve interpretability while preserving the original 1–5 order information for analysis. At the same time, dimensionless perception measures have trade-offs: they summarize experienced performance relative to users’ expectations rather than reporting physical quantities, and they may compress extreme values typical of unit-based metrics. We therefore interpret results as diagnostic associations and priority signals, not as engineering specifications.

2.2. Questionnaire Design and Data Collection

2.2.1. Questionnaire Design

Based on the indicator system defined in Section 2.1, we operationalized each second-level indicator as one or more questionnaire items. To ensure rigor and completeness, we convened a three-member expert panel—urban planning, infrastructure engineering/development, and sociology—to conduct a content-validity review of the instrument, confirming that all items were clearly worded, aligned with the study objectives, and covered infrastructure services salient to residents’ everyday lives (Table 1).
We used a five-point Likert scale, coding responses as 5 = very satisfied, 4 = satisfied, 3 = neutral, 2 = dissatisfied, and 1 = very dissatisfied. Respondents rated each indicator accordingly, and the numerical scores reflected their satisfaction with small-town infrastructure.

2.2.2. Preliminary Research and Reliability Testing

Reliability analysis assesses the internal consistency of questionnaire responses []. We evaluate internal consistency using Cronbach’s alpha. The coefficient is computed according to Equation (1):
α = K K 1 1 S i 2 S x 2
In Equation (1), α denotes Cronbach’s alpha; K is the number of items in the scale; S i 2 is the within-item variance for item i; and S x 2 is the variance of the total test score, where x is the sum of all item scores. In practice, α 0.80 indicates high internal consistency (strong reliability); 0.70 α 0.80 is generally considered acceptable; and α < 0.70 suggests inadequate internal consistency and that the questionnaire may require revision [].
Prior to fieldwork, the instrument underwent expert review and small-scale comprehensibility checks (cognitive debriefing/try-outs), which informed minor wording refinements; these procedures were used solely for instrument refinement and were not included in the analytic sample. After the main survey and data cleaning, we assessed the reliability of the full sample using Cronbach’s alpha, which indicated good internal consistency across all first-level dimensions and the overall scale.
Using SPSS 27.0.1.0, we conducted reliability tests on the questionnaire data. Cronbach’s alpha for all indicators exceeded 0.80, indicating high internal consistency. The overall alpha was 0.950, suggesting excellent reliability. Results are reported in Table 2.
Table 2. Cronbach’s alpha by indicator.

2.2.3. Formal Investigation and Data Collection

We administered the survey in 56 small towns selected to be broadly typical of Wuhan’s six new districts (Dongxihu, Hannan, Caidian, Jiangxia, Huangpi, and Xinzhou). Data collection combined online and offline methods. To enhance representativeness, the sample intentionally covered diversity in gender, age, occupation, and length of residence. We used two complementary approaches to broaden reach: (i) an open (untargeted) distribution, in which questionnaires were shared on public social media platforms and online communities to invite small-town residents to participate; and overall, 1500 questionnaires were distributed. After excluding 103 questionnaires that were invalid or not returned, 1397 valid questionnaires remained, yielding a valid response rate of 93.13%.

2.2.4. Descriptive Statistics

Road and transport (Table 3). Except for satisfaction with the current condition of road traffic facilities (3.82), public transport (3.88), and public parking (3.90), the mean score for every other item is at least 4.00 on the five-point scale. This suggests generally high perceived performance and indicates that services largely meet current needs across the sampled small towns. In terms of dispersion, satisfaction with the current condition of road traffic facilities shows a higher standard deviation (and variance) than the other items in the road-and-transport dimension, indicating greater heterogeneity in respondents’ views.
Table 3. Descriptive statistics for the road and transport dimension.
Basic living facilities (Table 4). Item means ranged from 4.05 to 4.42, indicating generally high satisfaction and broadly comparable evaluations. The highest mean was for satisfaction with electricity supply (4.42). In terms of dispersion, satisfaction with sewage treatment records the largest standard deviation (0.797) and variance (0.635) among items within the first-level dimension of basic living facilities, suggesting greater heterogeneity across towns for this service.
Table 4. Descriptive statistics for the basic living facilities dimension.
Public services (Table 5). All of the item means exceeded 4.00 and exhibited limited spread, indicating generally high satisfaction across indicators. The highest mean was for satisfaction with commercial services (4.38), whereas satisfaction with health care facilities was relatively lower (4.17). In terms of dispersion, satisfaction with cultural and recreational facilities shows the largest standard deviation (0.687) and variance (0.471) among items within the first-level dimension of public service facilities, suggesting greater heterogeneity across towns for this service.
Table 5. Descriptive statistics for the public services dimension.
Public activity space (Table 6). All item means exceed 4.00, indicating generally strong performance. The highest mean is observed for satisfaction with barrier-free facilities in public activity spaces (4.33). By contrast, satisfaction with town greening (4.02) and satisfaction with health/fitness trails (4.03) are relatively lower, remaining below the average across items in the first-level dimension of public activity space. In terms of dispersion, satisfaction with town greening shows the largest standard deviation (0.809) and variance (0.654), suggesting greater cross-town heterogeneity in perceived greening quality.
Table 6. Descriptive statistics for the public activity space dimension.
Townscape and character (Table 7). The means for satisfaction with the current townscape (current status) and satisfaction with the alignment between townscape and local character are 3.93 and 3.94, respectively, with both below other items in this first-level dimension (townscape and character). In terms of dispersion, these two items also exhibit the largest standard deviation and variance within the dimension, indicating greater cross-town heterogeneity in perceived townscape quality and in the townscape’s fit with local character.
Table 7. Descriptive statistics for the townscape and character dimension.

2.3. Data Analysis

2.3.1. Satisfaction Scoring and Data Processing

Scoring proceeded in three steps: (i) compute scores for the 26 s-level indicators; (ii) aggregate them into five first-level dimensions; and (iii) derive each town’s overall satisfaction score. Prior to computing composite scores, we mapped the five response categories on a five-point Likert scale to numeric values, as shown in Table 8.
Table 8. Value mapping for questionnaire response options.
Following the value mapping described above, we compute satisfaction scores using a unified rule. Specifically, the overall satisfaction score for each of the 26 s-level indicators is calculated using Equation (2):
Q t i = A i × 100 + B i × 80 + C i × 60 + D i × 40 + E i × 20 z i
where Q t i denotes the satisfaction score for the i-th indicator; A i , B i , C i , D i , and E i are the numbers of valid responses selecting “very satisfied”, “satisfied”, “neutral”, “dissatisfied”, and “very dissatisfied”, respectively; and Z i is the total number of valid questionnaires.
The satisfaction score for each first-level dimension is the arithmetic mean of the scores of its constituent second-level indicators. Accordingly, the overall infrastructure satisfaction score for each small town in Wuhan is computed as the mean of the five first-level dimension scores, as in Equation (3) below:
Q z = Q T 1 + Q T 2 + Q T 3 + Q T 4 + Q T 5 5
where Q z denotes the satisfaction score for infrastructure construction in Wuhan’s small towns, and Q T 1 Q T 5 denote the satisfaction scores for the five first-level dimensions, respectively.
For selected variables, we conduct cross-tabulations and multivariate analyses to inform subsequent correlation tests and the prioritization of improvement areas. This linear, monotonic mapping preserves ordering and relative differences while expressing results in a familiar “percent-like” unit. For statistical inference and the modified IPA, the original 1–5 scale is retained to stay comparable with prior studies and to keep thresholds interpretable. Minor deviations between the 20–100 display scores and “20 × mean” may arise from routine quality filters, subgroup balancing/weighting, and missing-data handling rules; these do not affect ranks, tests, or IPA quadrant assignments.

2.3.2. Modified Importance–Performance Analysis

Traditional importance–performance analysis (IPA) asks respondents to rate both the importance and the performance/satisfaction of each attribute [], which increases subjectivity and respondent burden []. Accordingly, we adopt a modified IPA that collects only satisfaction (performance) ratings and statistically infers each indicator’s importance. Specifically, using overall resident satisfaction as the dependent variable, we compute in SPSS the partial correlation between each second-level indicator and overall satisfaction (controlling for the remaining indicators); this partial correlation is taken as the indicator’s derived importance []. We then place each indicator on a two-axis matrix—with mean satisfaction on one axis and derived importance on the other—to form the four-quadrant IPA map, which distinguishes advantage enhancement zone, effort maintenance zone, secondary improvement zone, and key improvement zone, thereby highlighting weaknesses that warrant urgent action and the policy domains most suitable for optimization []. We classify indicators into four zones using a two-axis matrix of satisfaction (x-axis) and derived importance (y-axis). For each indicator i , the following is true:
  • Satisfaction ( S i ) is the mean of its five-point satisfaction items (analysis on the 1–5 scale).
  • Derived importance ( I i ) is the partial correlation between the indicator and overall satisfaction, estimated while conditioning on the remaining indicators (associations, not causal effects). To ensure comparability with S i , we classify importance by the magnitude of I i (larger absolute values = more influential).
To draw quadrants, we center each axis at the sample’s central tendency (we use the median of S i and of I i across all indicators; results are robust to using means). Indicators are then assigned as follows:
  • Advantage Enhancement Zone (High S, Low I): strong perceived performance; lower marginal influence—protect advantages, consider selective enhancement.
  • Effort Maintenance Zone (High S, High I): strong performance in attributes that matter most—maintain effort and monitor.
  • Secondary Improvement Zone (Low S, Low I): weaker performance with lower influence—opportunistic or low-cost fixes.
  • Key Improvement Zone (Low S, High I): weak performance in highly influential attributes—first-order priorities for investment/operations.

2.4. Study Area

This study applies the proposed framework to Wuhan, a national central city in central China that is undergoing rapid urbanization. Wuhan follows a “1 + 6” spatial structure consisting of one central urban core and six peripheral new districts (PNDs) that serve as transitional zones between the metropolitan core and rural hinterlands, making them strategic research sites for examining infrastructure development in small towns. Wuhan is an inland waterfront metropolis and thus has some local specificities. Our claims do not presume statistical representativeness for all Chinese small towns. Rather, Wuhan’s PNDs provide substantial internal heterogeneity (industrial parks, ecological conservation areas, inner peri-urban fringes, and rural edges), allowing the framework to be tested across contrasting contexts within one metropolitan system. The method—a resident-centered evaluation with a five-dimension/26-indicator structure and a modified IPA that derives implicit importance—is geography-agnostic and intended to be portable. The survey instrument and analytical pipeline are provided so that other regions can replicate and compare results; future work will extend the application to additional provinces to further examine generalizability.
Wuhan is a highly urbanized metropolis. The central urban districts are fully urbanized, with continuous built-up areas and municipal services delivered at metropolitan standards. Administratively, they are organized as urban subdistricts rather than town-level units, and there is no “small-town” category in these districts. Because the object of this study is town-level settlements, including the central districts would fall outside the definitional scope and would confound the analysis with fundamentally different governance and service regimes. We, therefore, restrict the sample to town-level units in the six peripheral new districts, where small towns still exist as the relevant unit of infrastructure provision and resident experience. All 56 small towns meeting the study criteria across the six PNDs were included in the analysis, providing a robust empirical basis for assessing infrastructure conditions and identifying improvement priorities.
To ensure that the analysis focused on genuine small towns rather than highly urbanized neighborhoods, we constructed a census-style sampling frame with the following rules:
(i)
Towns must lie within the boundaries of the six PNDs and be administered as town-level units;
(ii)
Towns that have become functionally integrated with the central urban districts, e.g., continuous built-up fabric and urban service standards comparable to core districts, were excluded to avoid mixing fundamentally different governance and service regimes;
(iii)
Towns needed to retain independent local management of basic services (e.g., water, sanitation, and local roads) so that resident satisfaction reflects small-town service conditions.
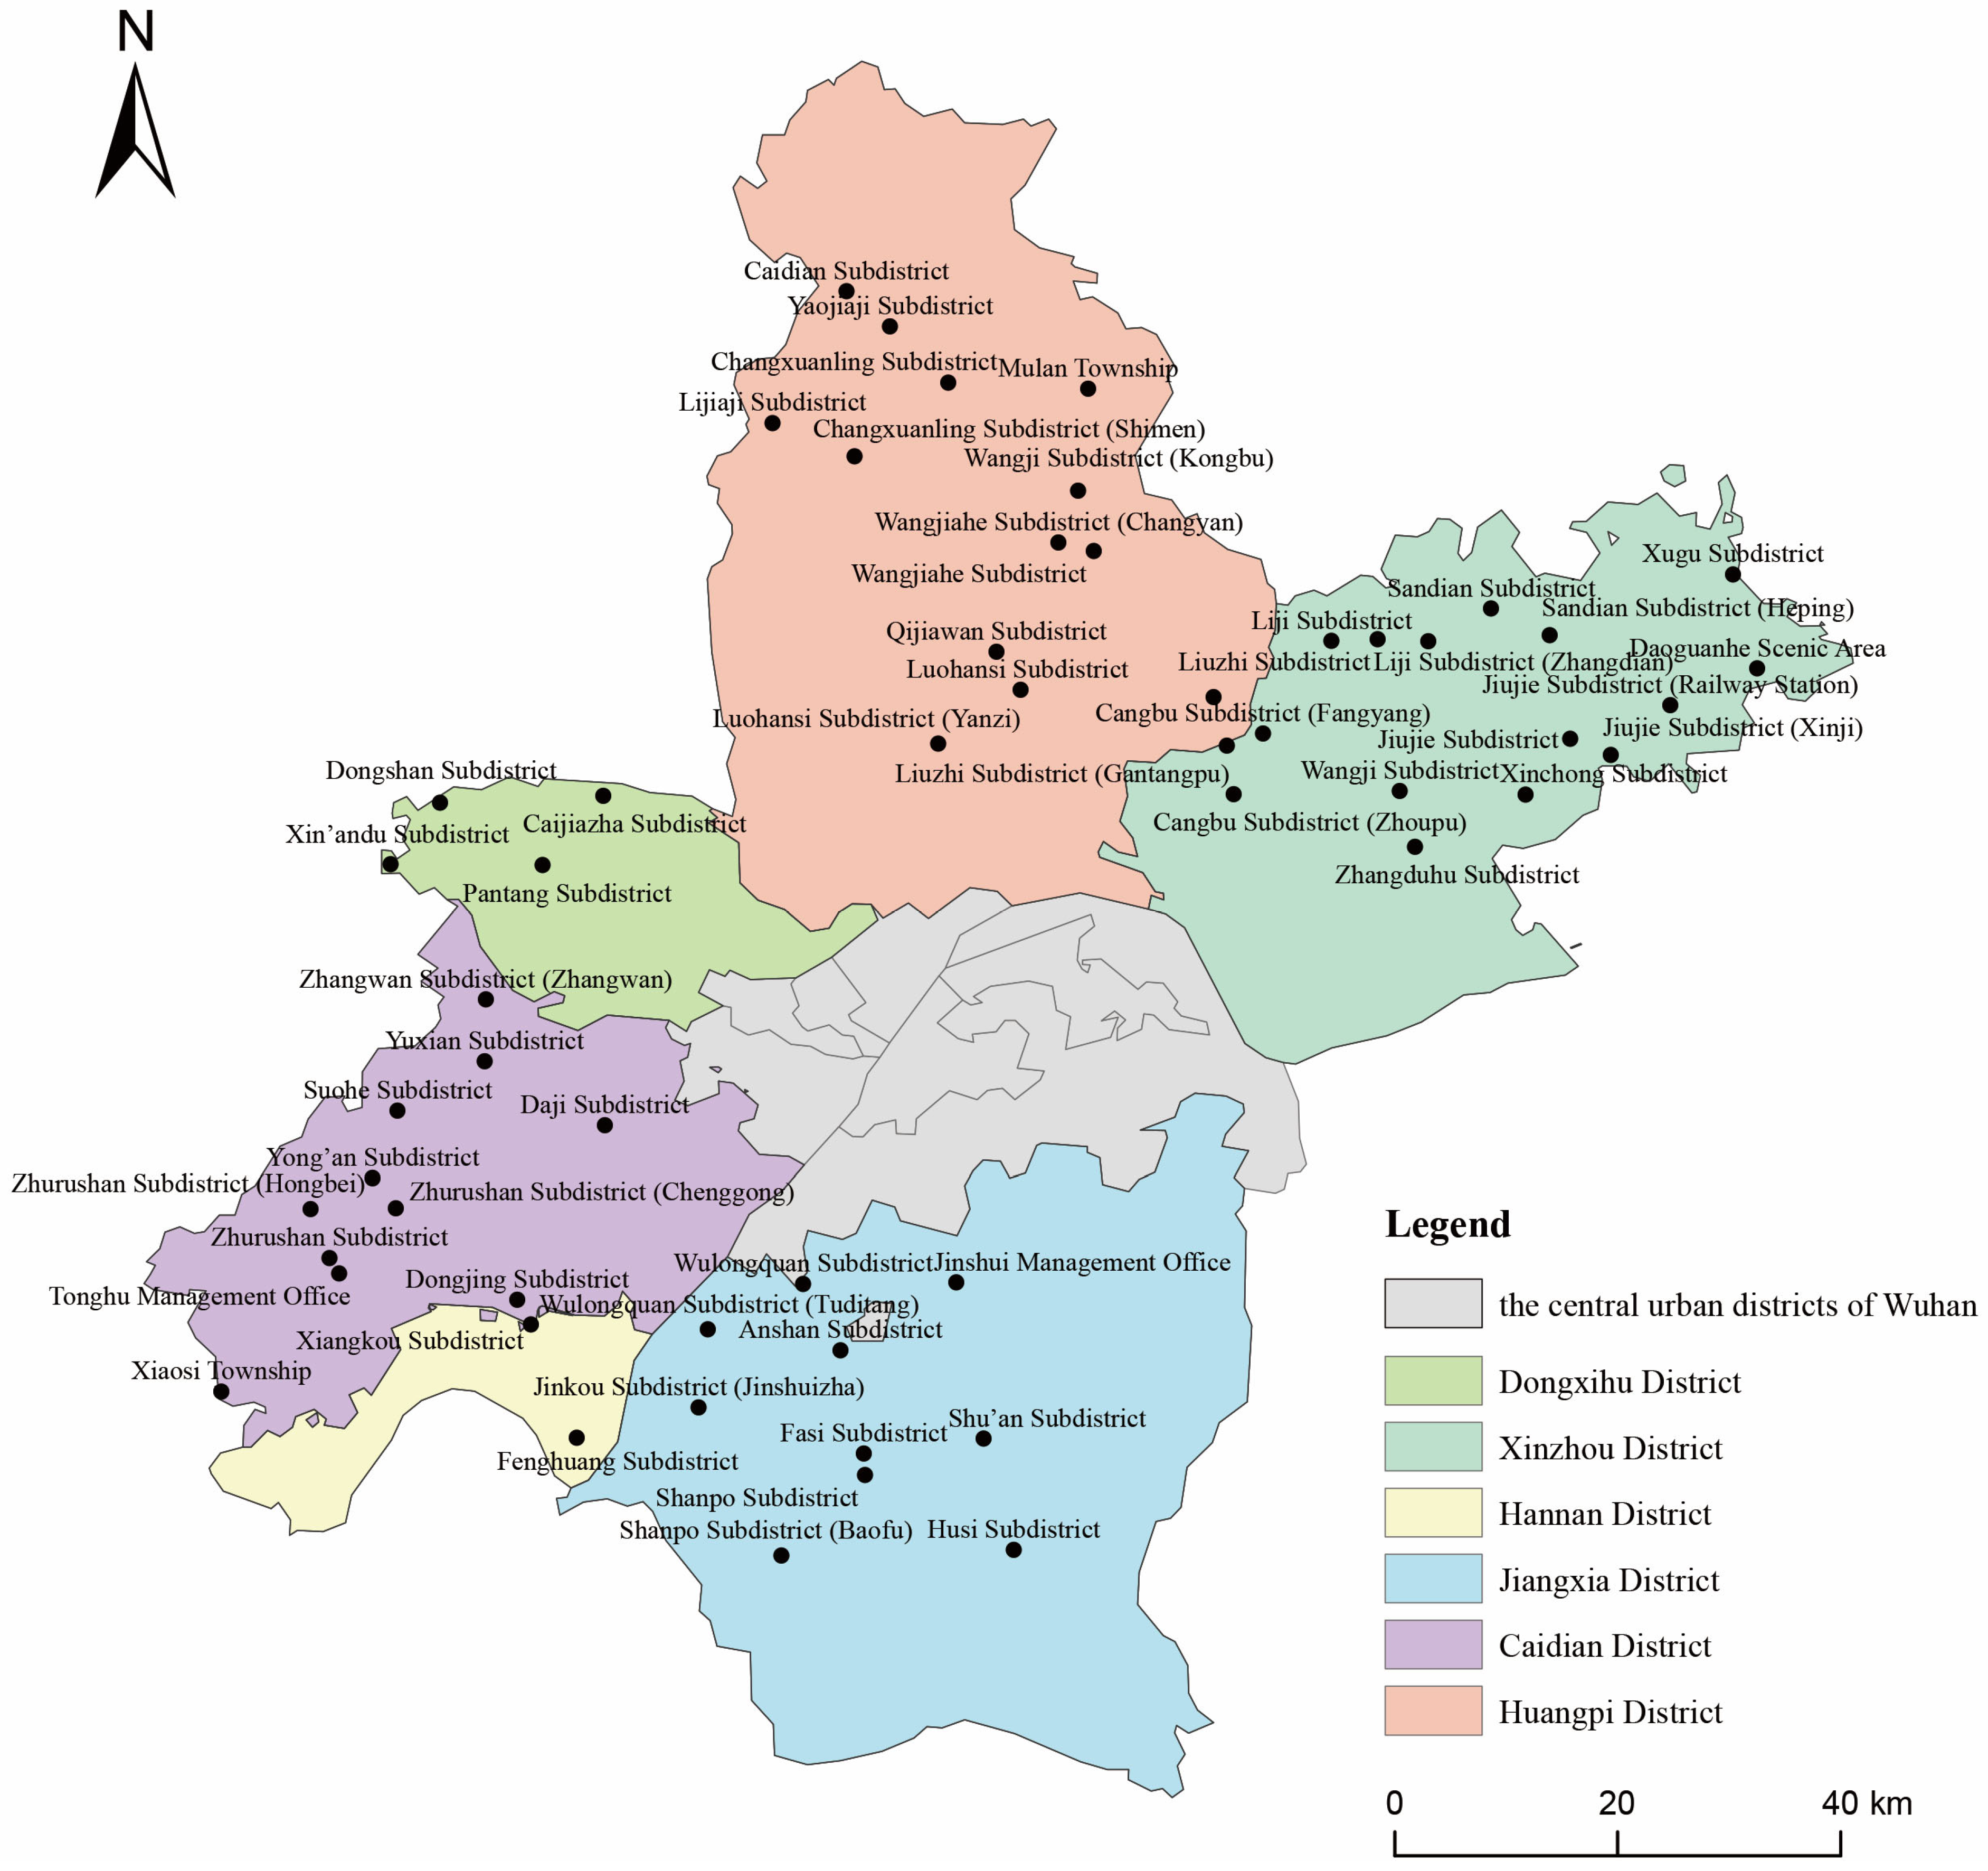
Applying these criteria produced all 56 eligible small towns across the six PNDs; the number, therefore, reflects a complete enumeration of the study population rather than an arbitrary sample. The spatial distribution and composition of the towns are shown in Figure 1.
Figure 1. Geographic distribution of selected small towns in Wuhan.

3. Results

3.1. Analysis of Satisfaction Score Results

Using the satisfaction calculation method mentioned earlier, specific performance values were calculated for each indicator level. The overall satisfaction score for infrastructure development in small towns within the study scope was determined to be 83.10, indicating a generally favorable level of satisfaction.

3.1.1. Analysis of First-Level Dimension Results

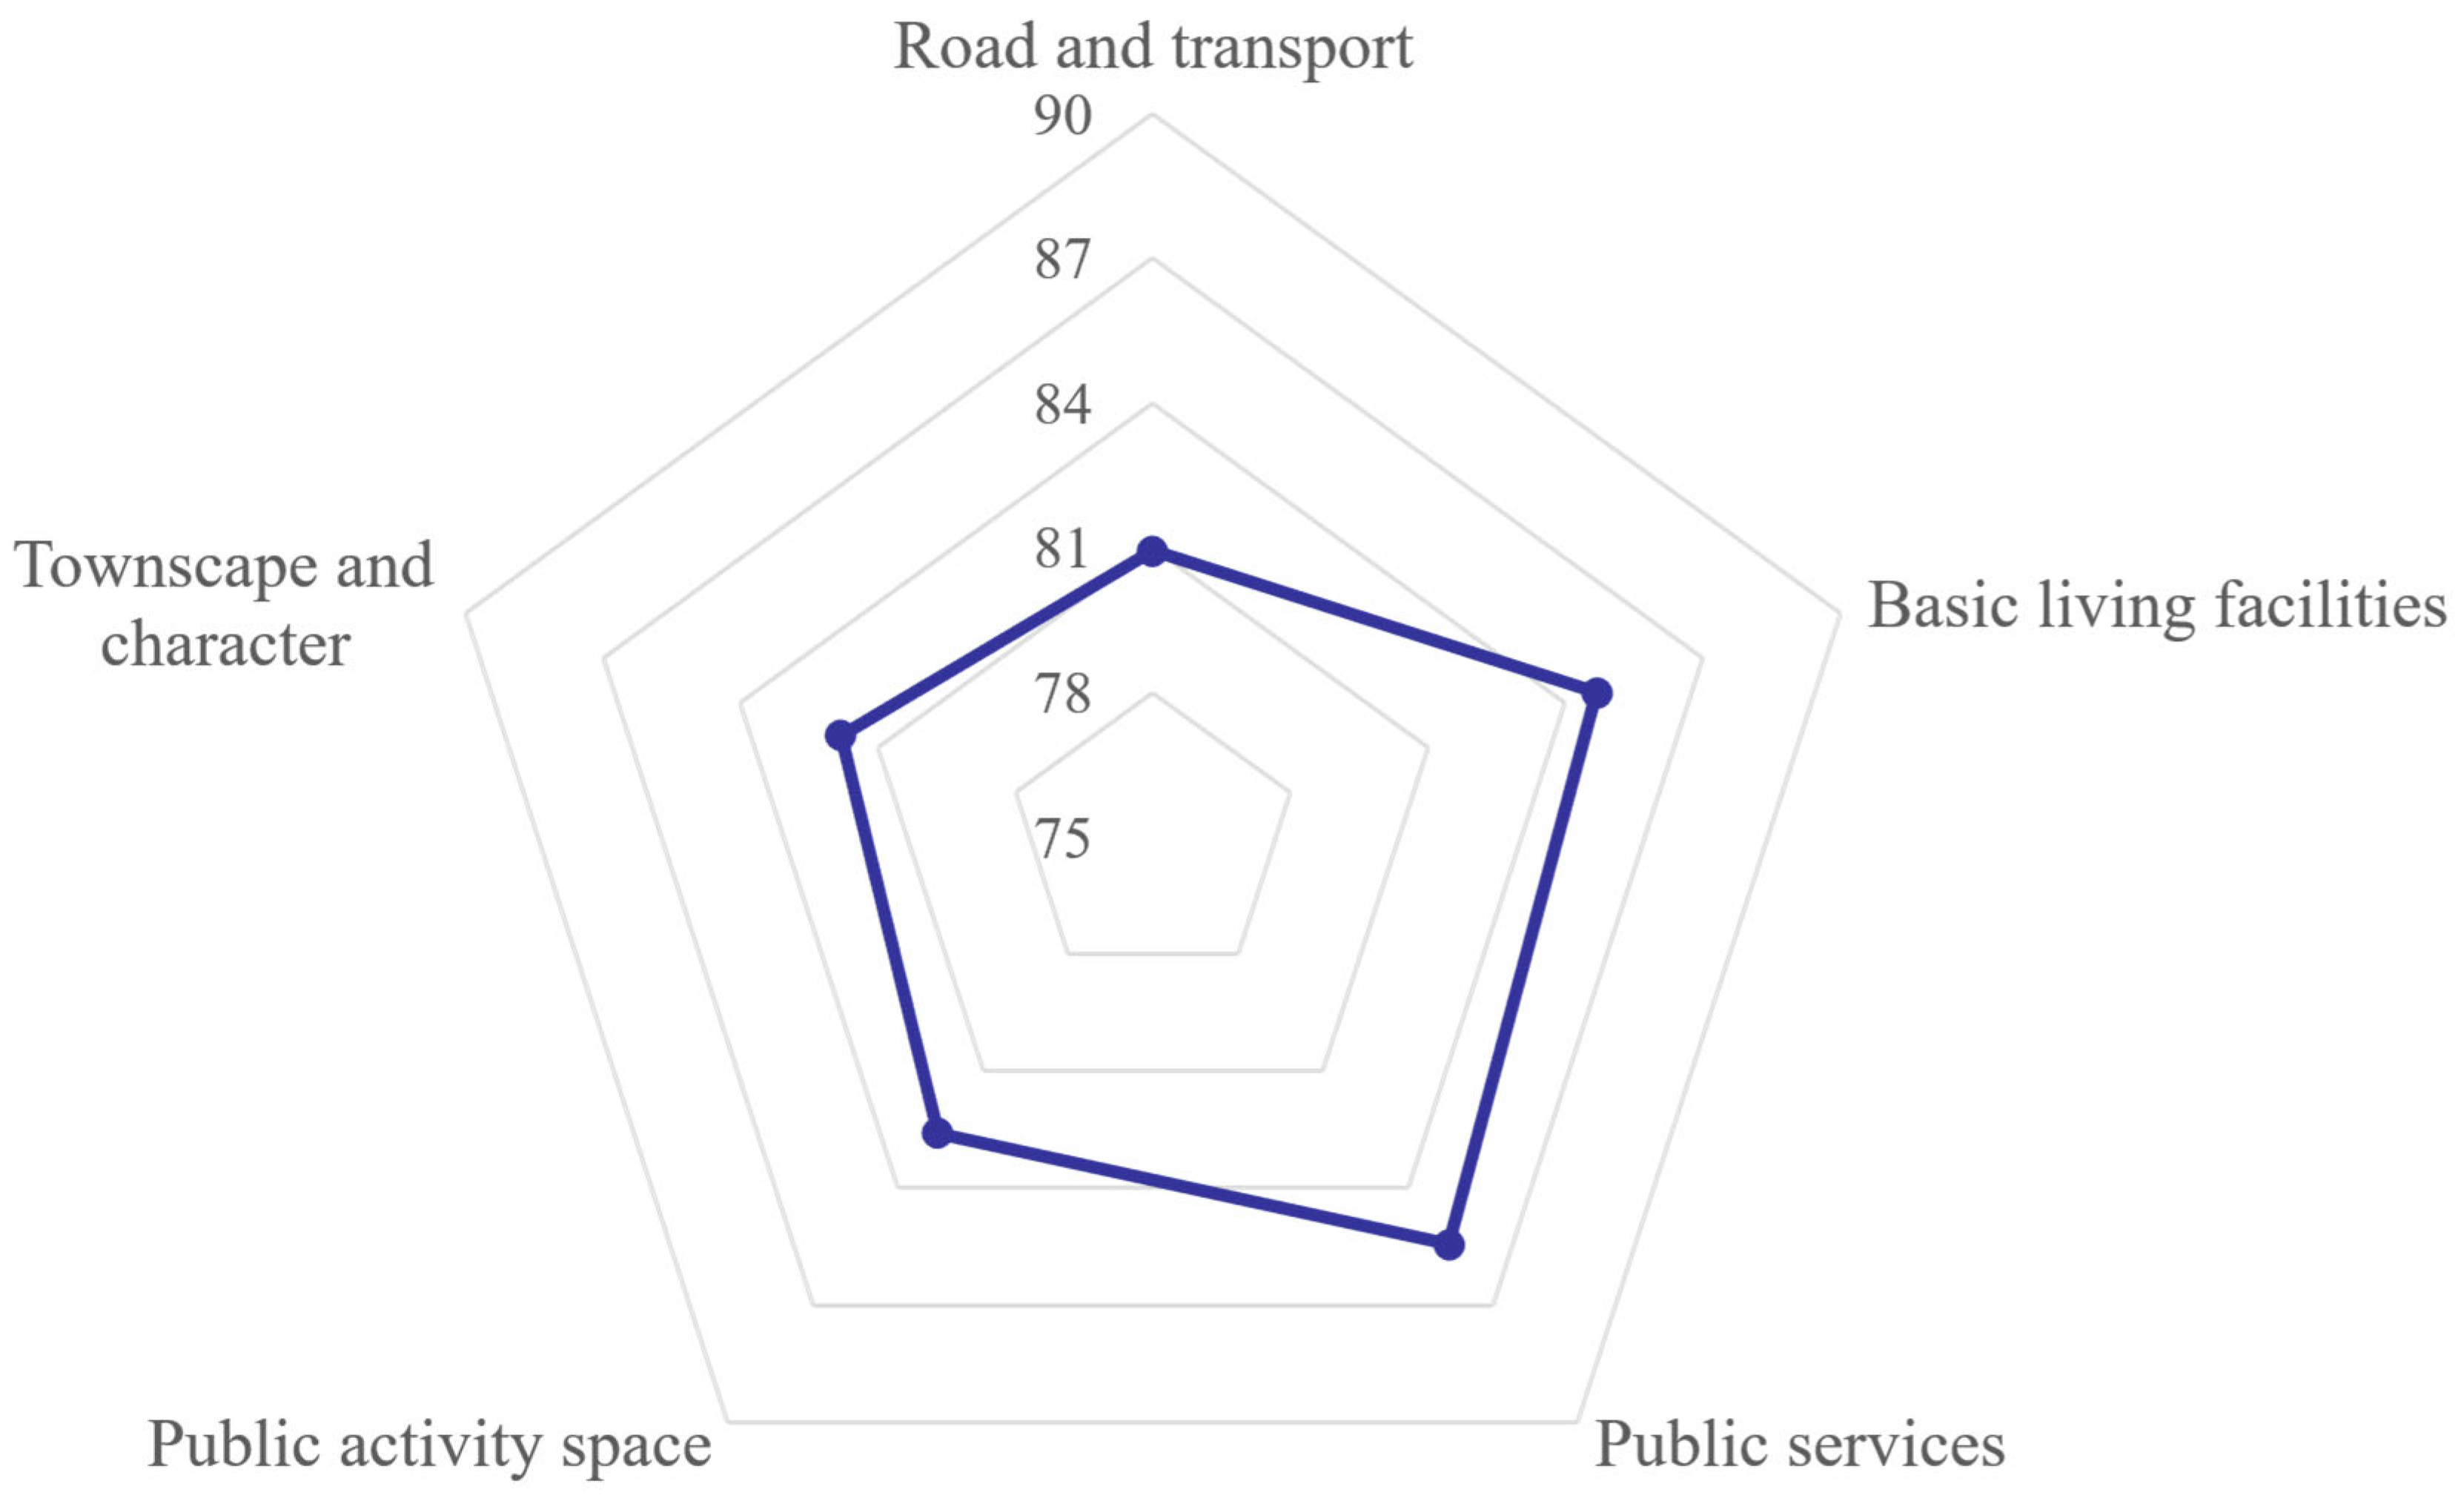
In the new districts of Wuhan, the five first-level dimensions for assessing small-town infrastructure development—road and transport; basic living facilities; public services; public activity space; and townscape and character—score 80.94, 84.69, 85.45, 82.59, and 81.81, respectively (Figure 2). Overall dispersion across dimensions is modest, with all scores above 80. Public services and basic living facilities performed best, whereas road and transport lag slightly.
Figure 2. Radar chart of first-level dimension scores for small-town infrastructure evaluation.

3.1.2. Analysis of Second-Level Indicator Results

To more clearly characterize within-dimension satisfaction, beyond analyzing the five first-level dimensions, we further conducted a detailed comparative analysis of the 26 s-level indicators nested within them.
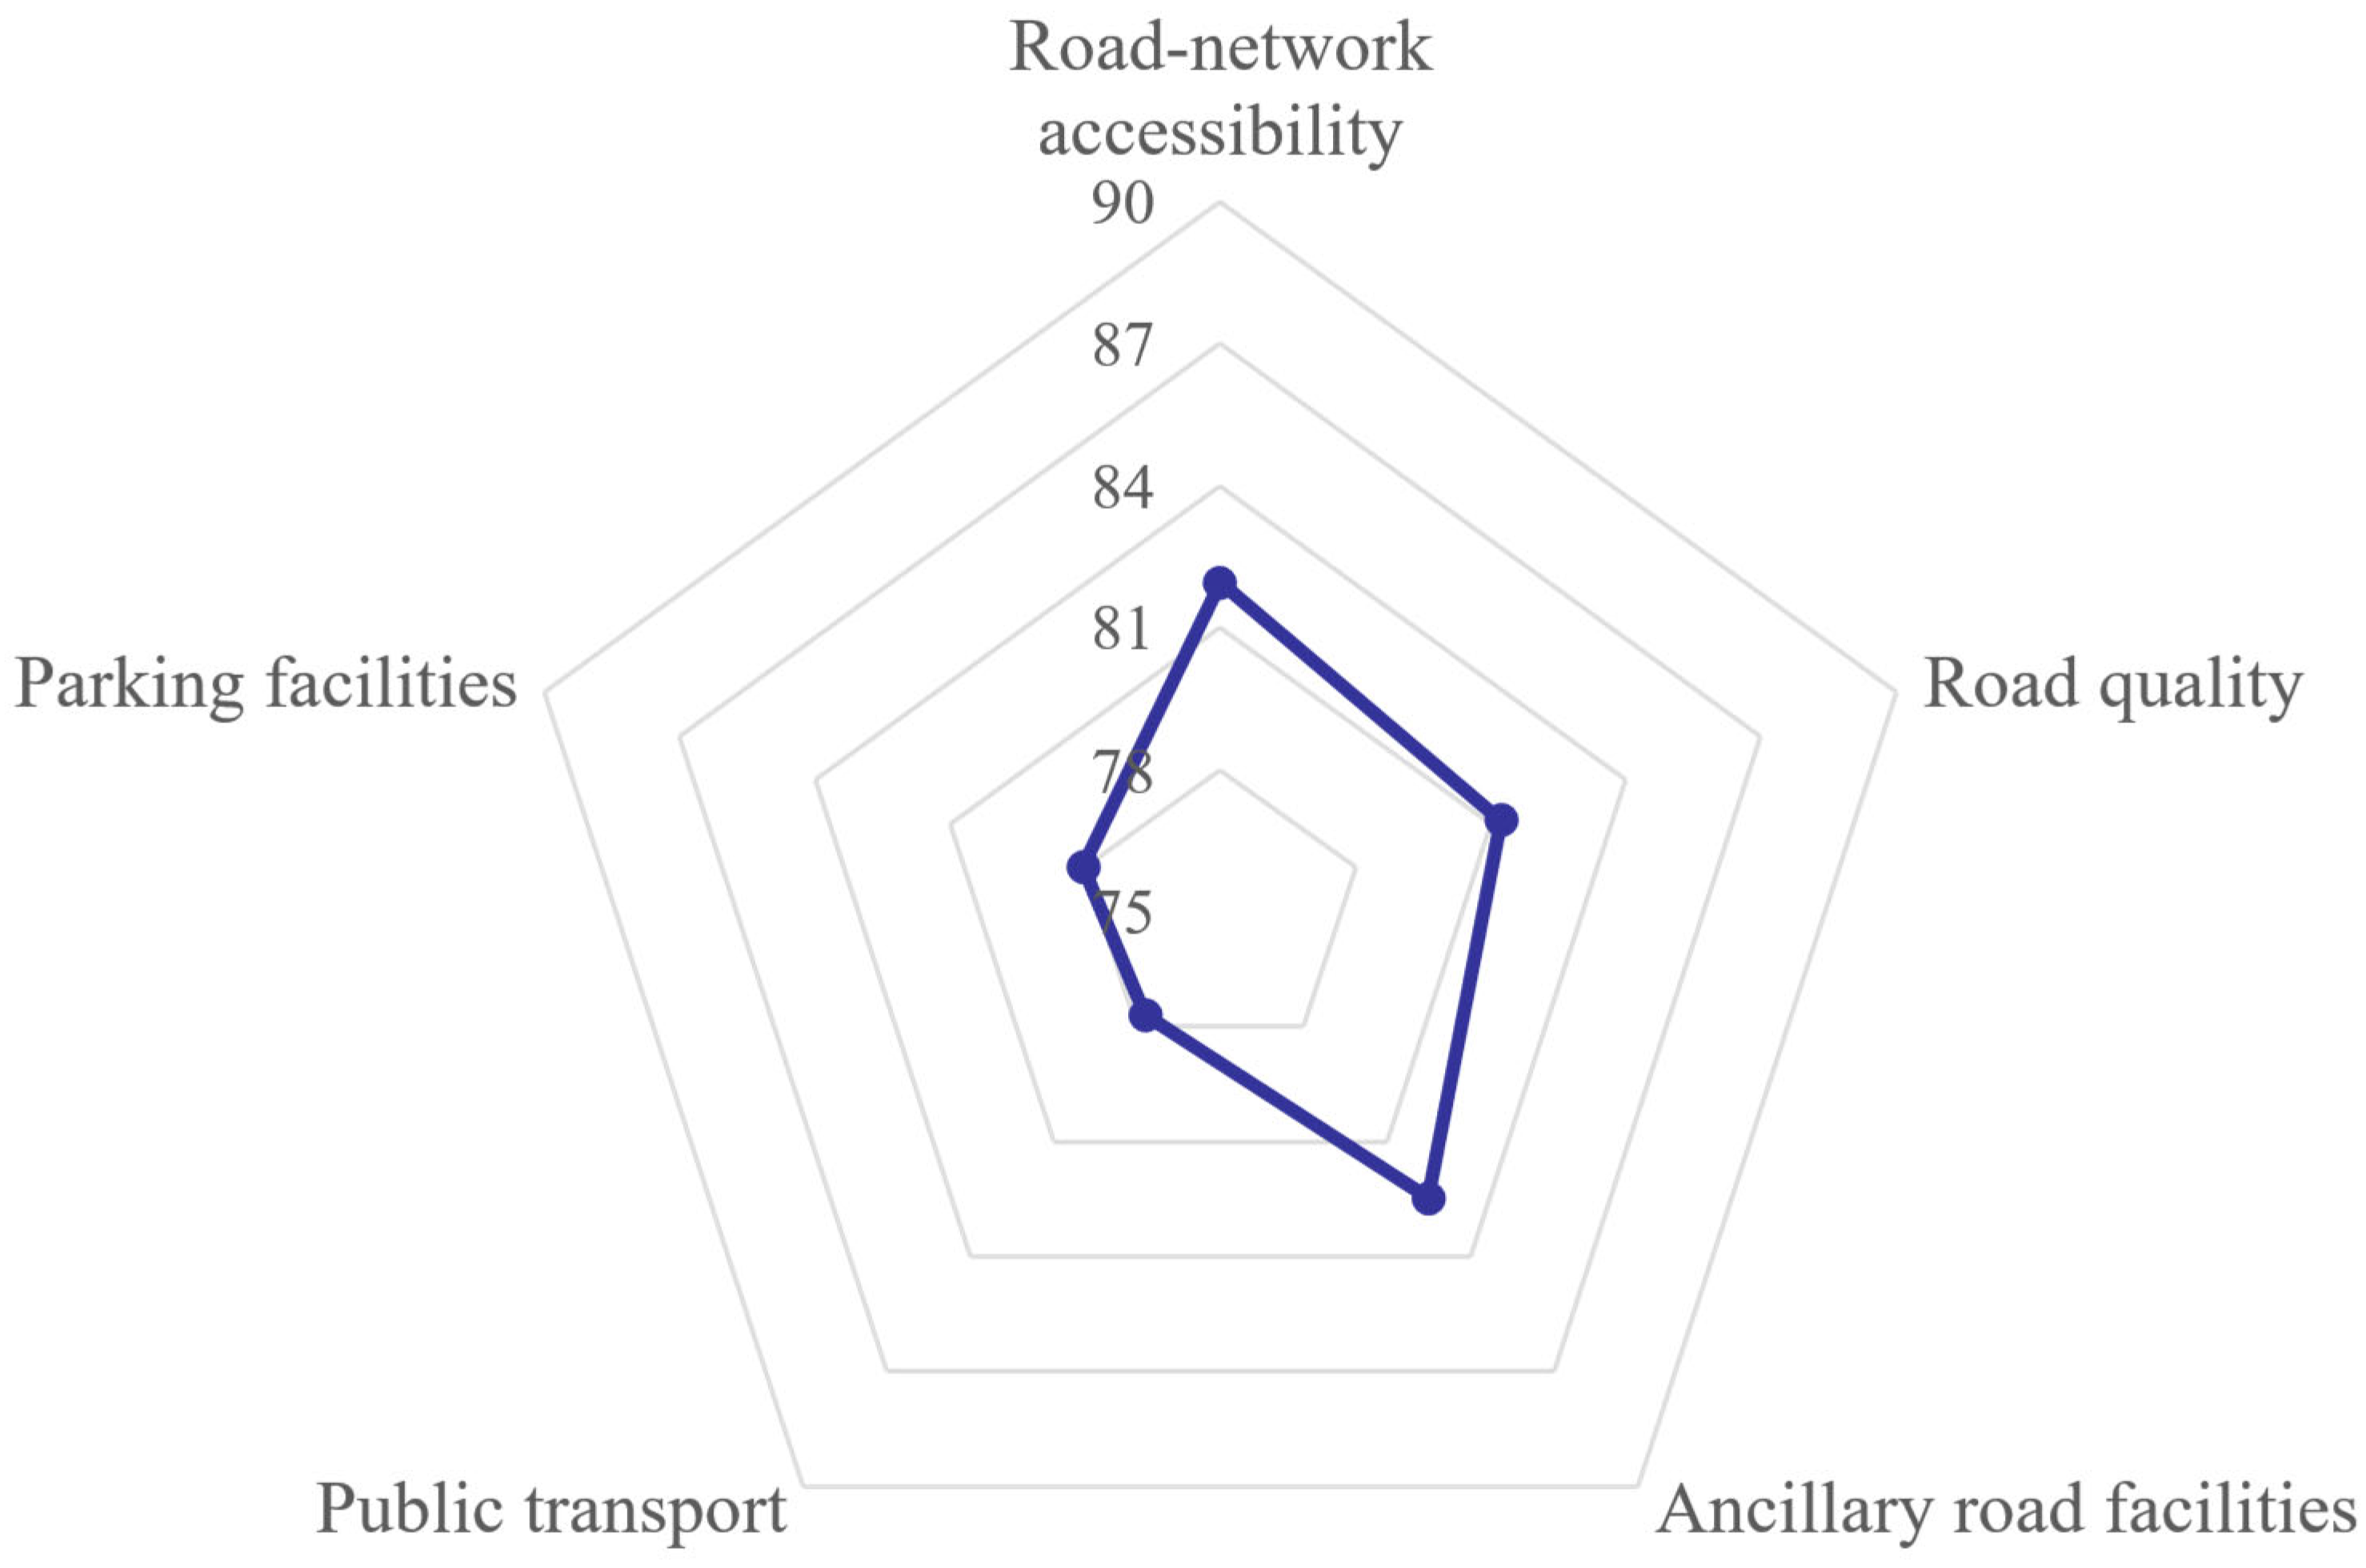
Scores for the road and transport dimension (Figure 3) show relatively high satisfaction with road-network accessibility (81.95), suggesting that external connectivity in small towns is generally adequate for residents’ daily travel. By contrast, public transport and parking facilities score lower (77.70 and 78.05), indicating a mismatch between the rapid growth of motor-vehicle ownership and the limited supply of public parking. The quality of public transport also requires further enhancement.
Figure 3. Radar chart of scores for the road and transport dimension.
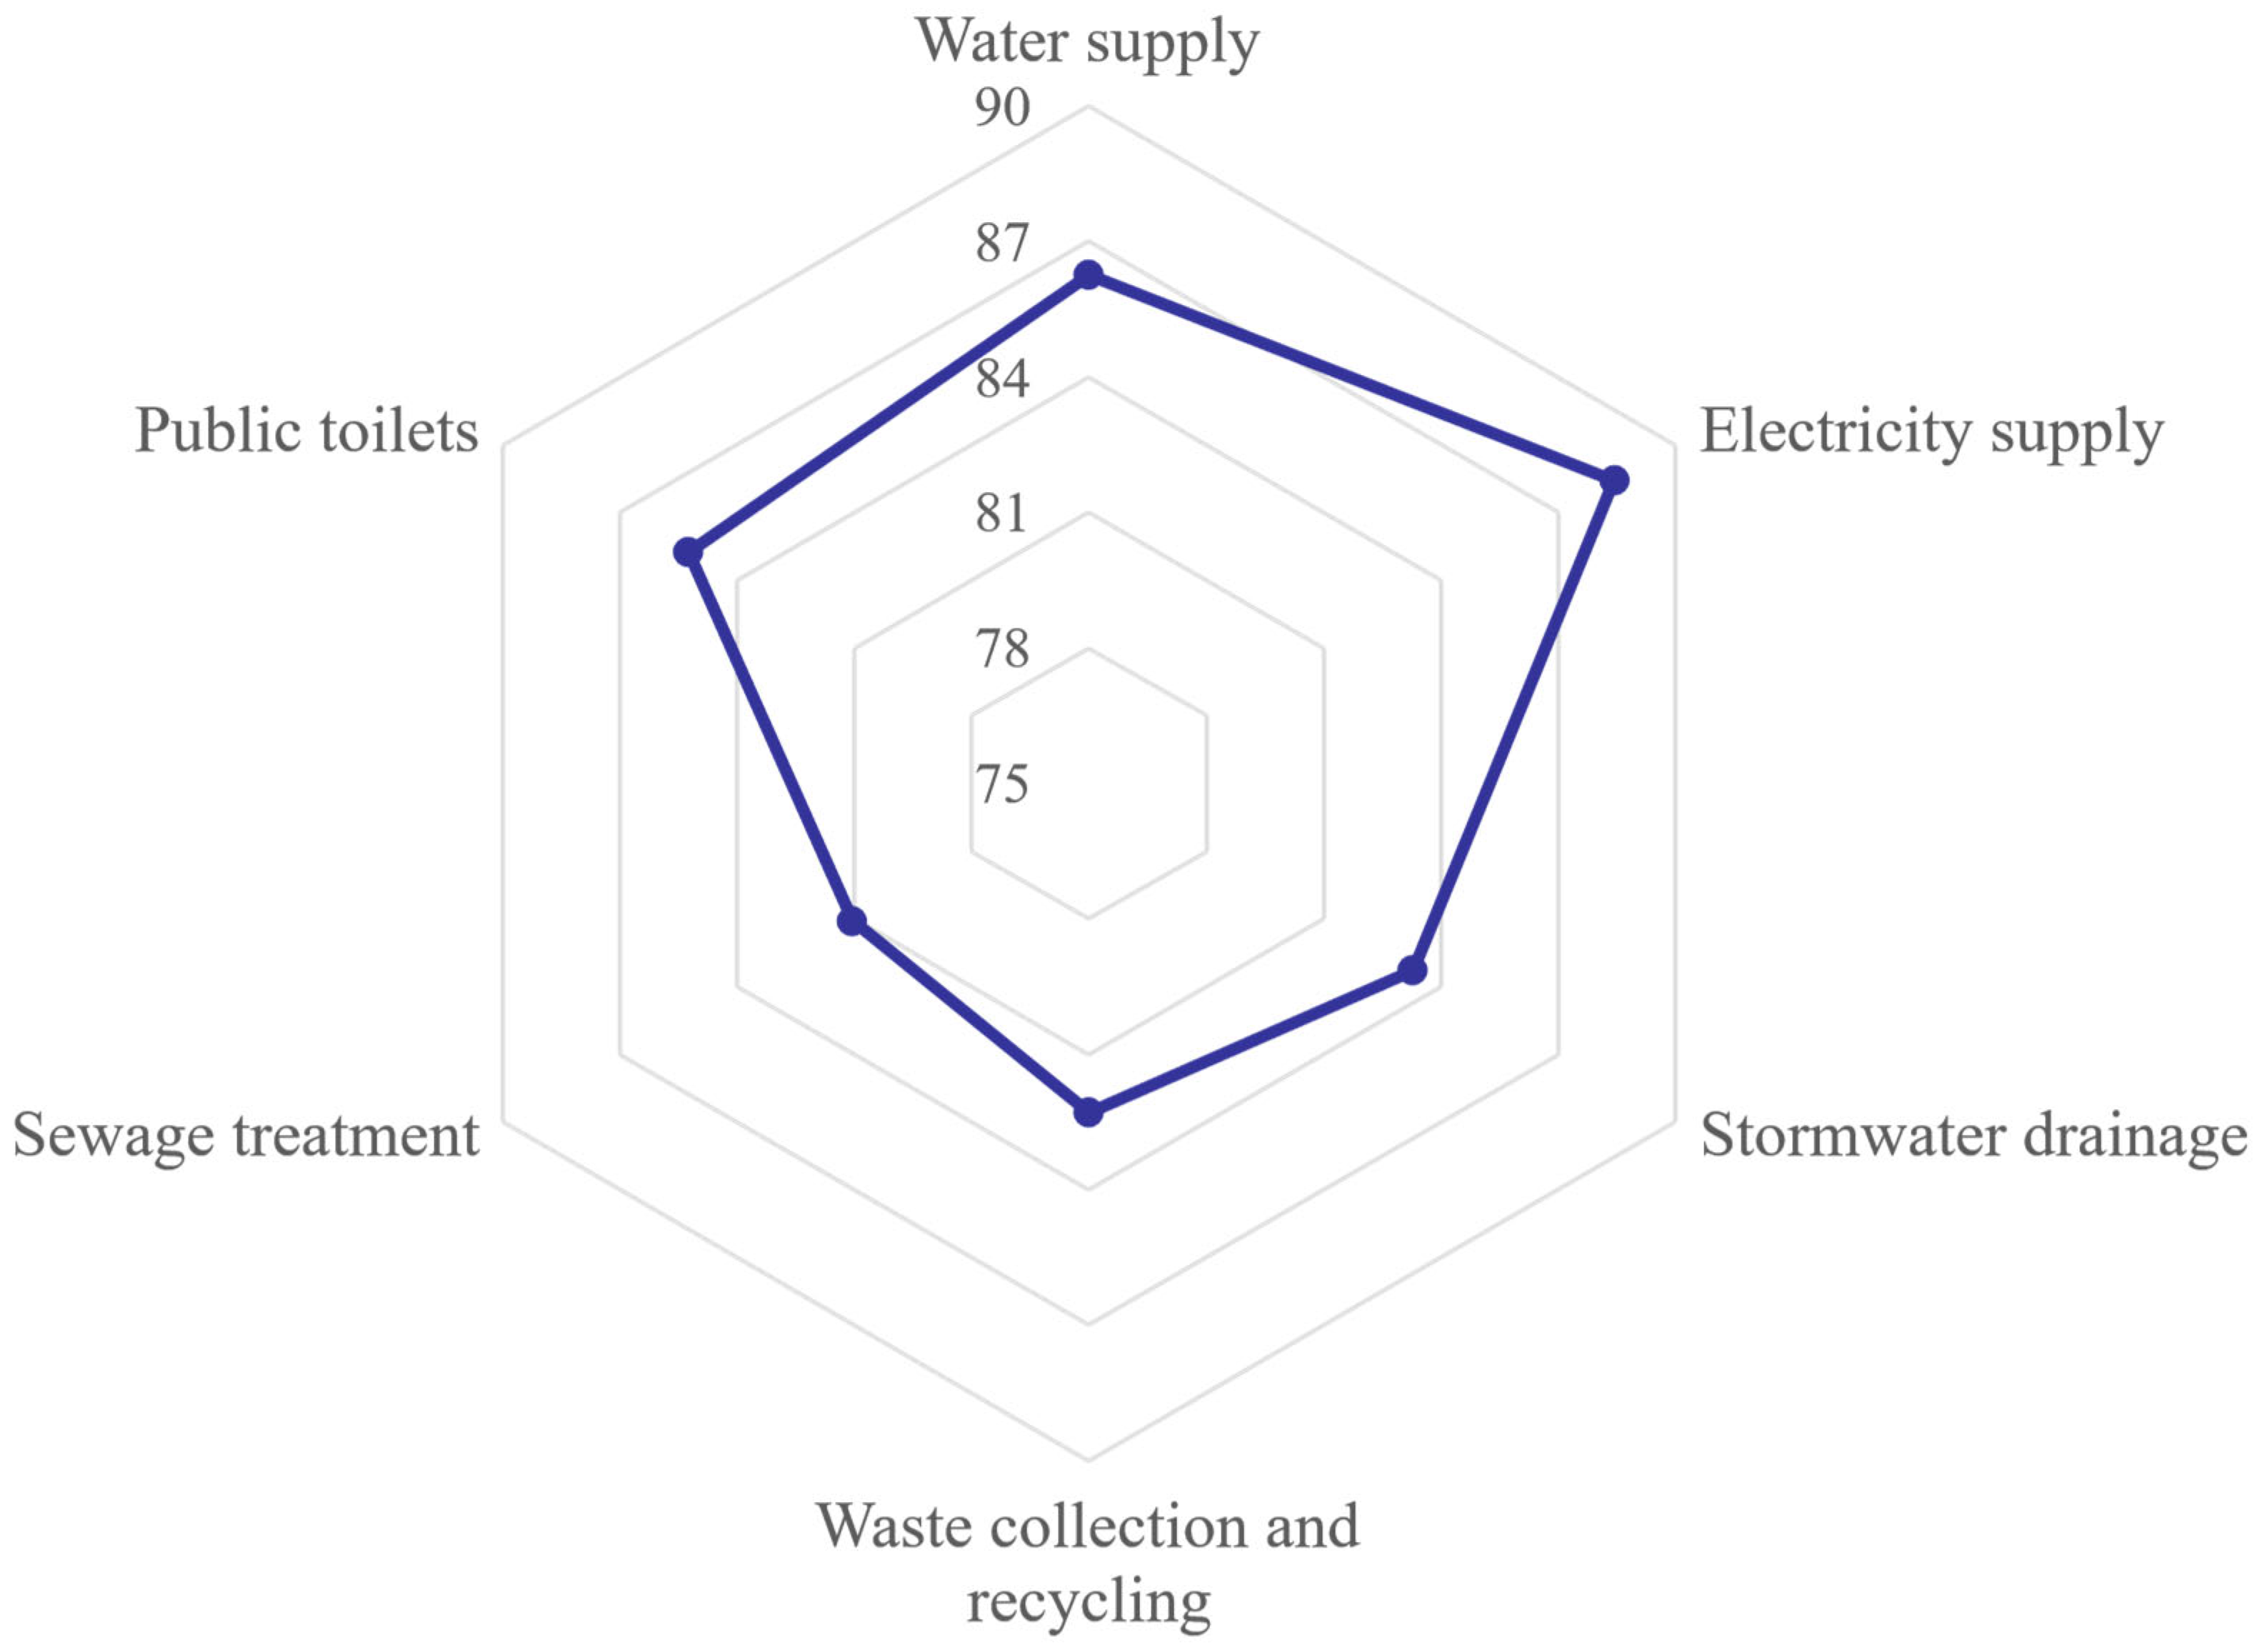
Within the basic living facilities dimension (Figure 4), all second-level indicators record scores above 80, indicating broad public approval of the provision of basic services in Wuhan’s small towns. The highest satisfaction is observed for electricity supply (88.42), whereas sewage treatment attains the lowest score (81.06), followed by waste collection and recycling (82.28). Field interviews further indicate that some towns have not yet completed stormwater–sewage separation; sewer-network coverage remains incomplete, and aging pipelines and leakage persist, underscoring the urgency of system upgrades.
Figure 4. Radar chart of scores for the basic living facilities dimension.
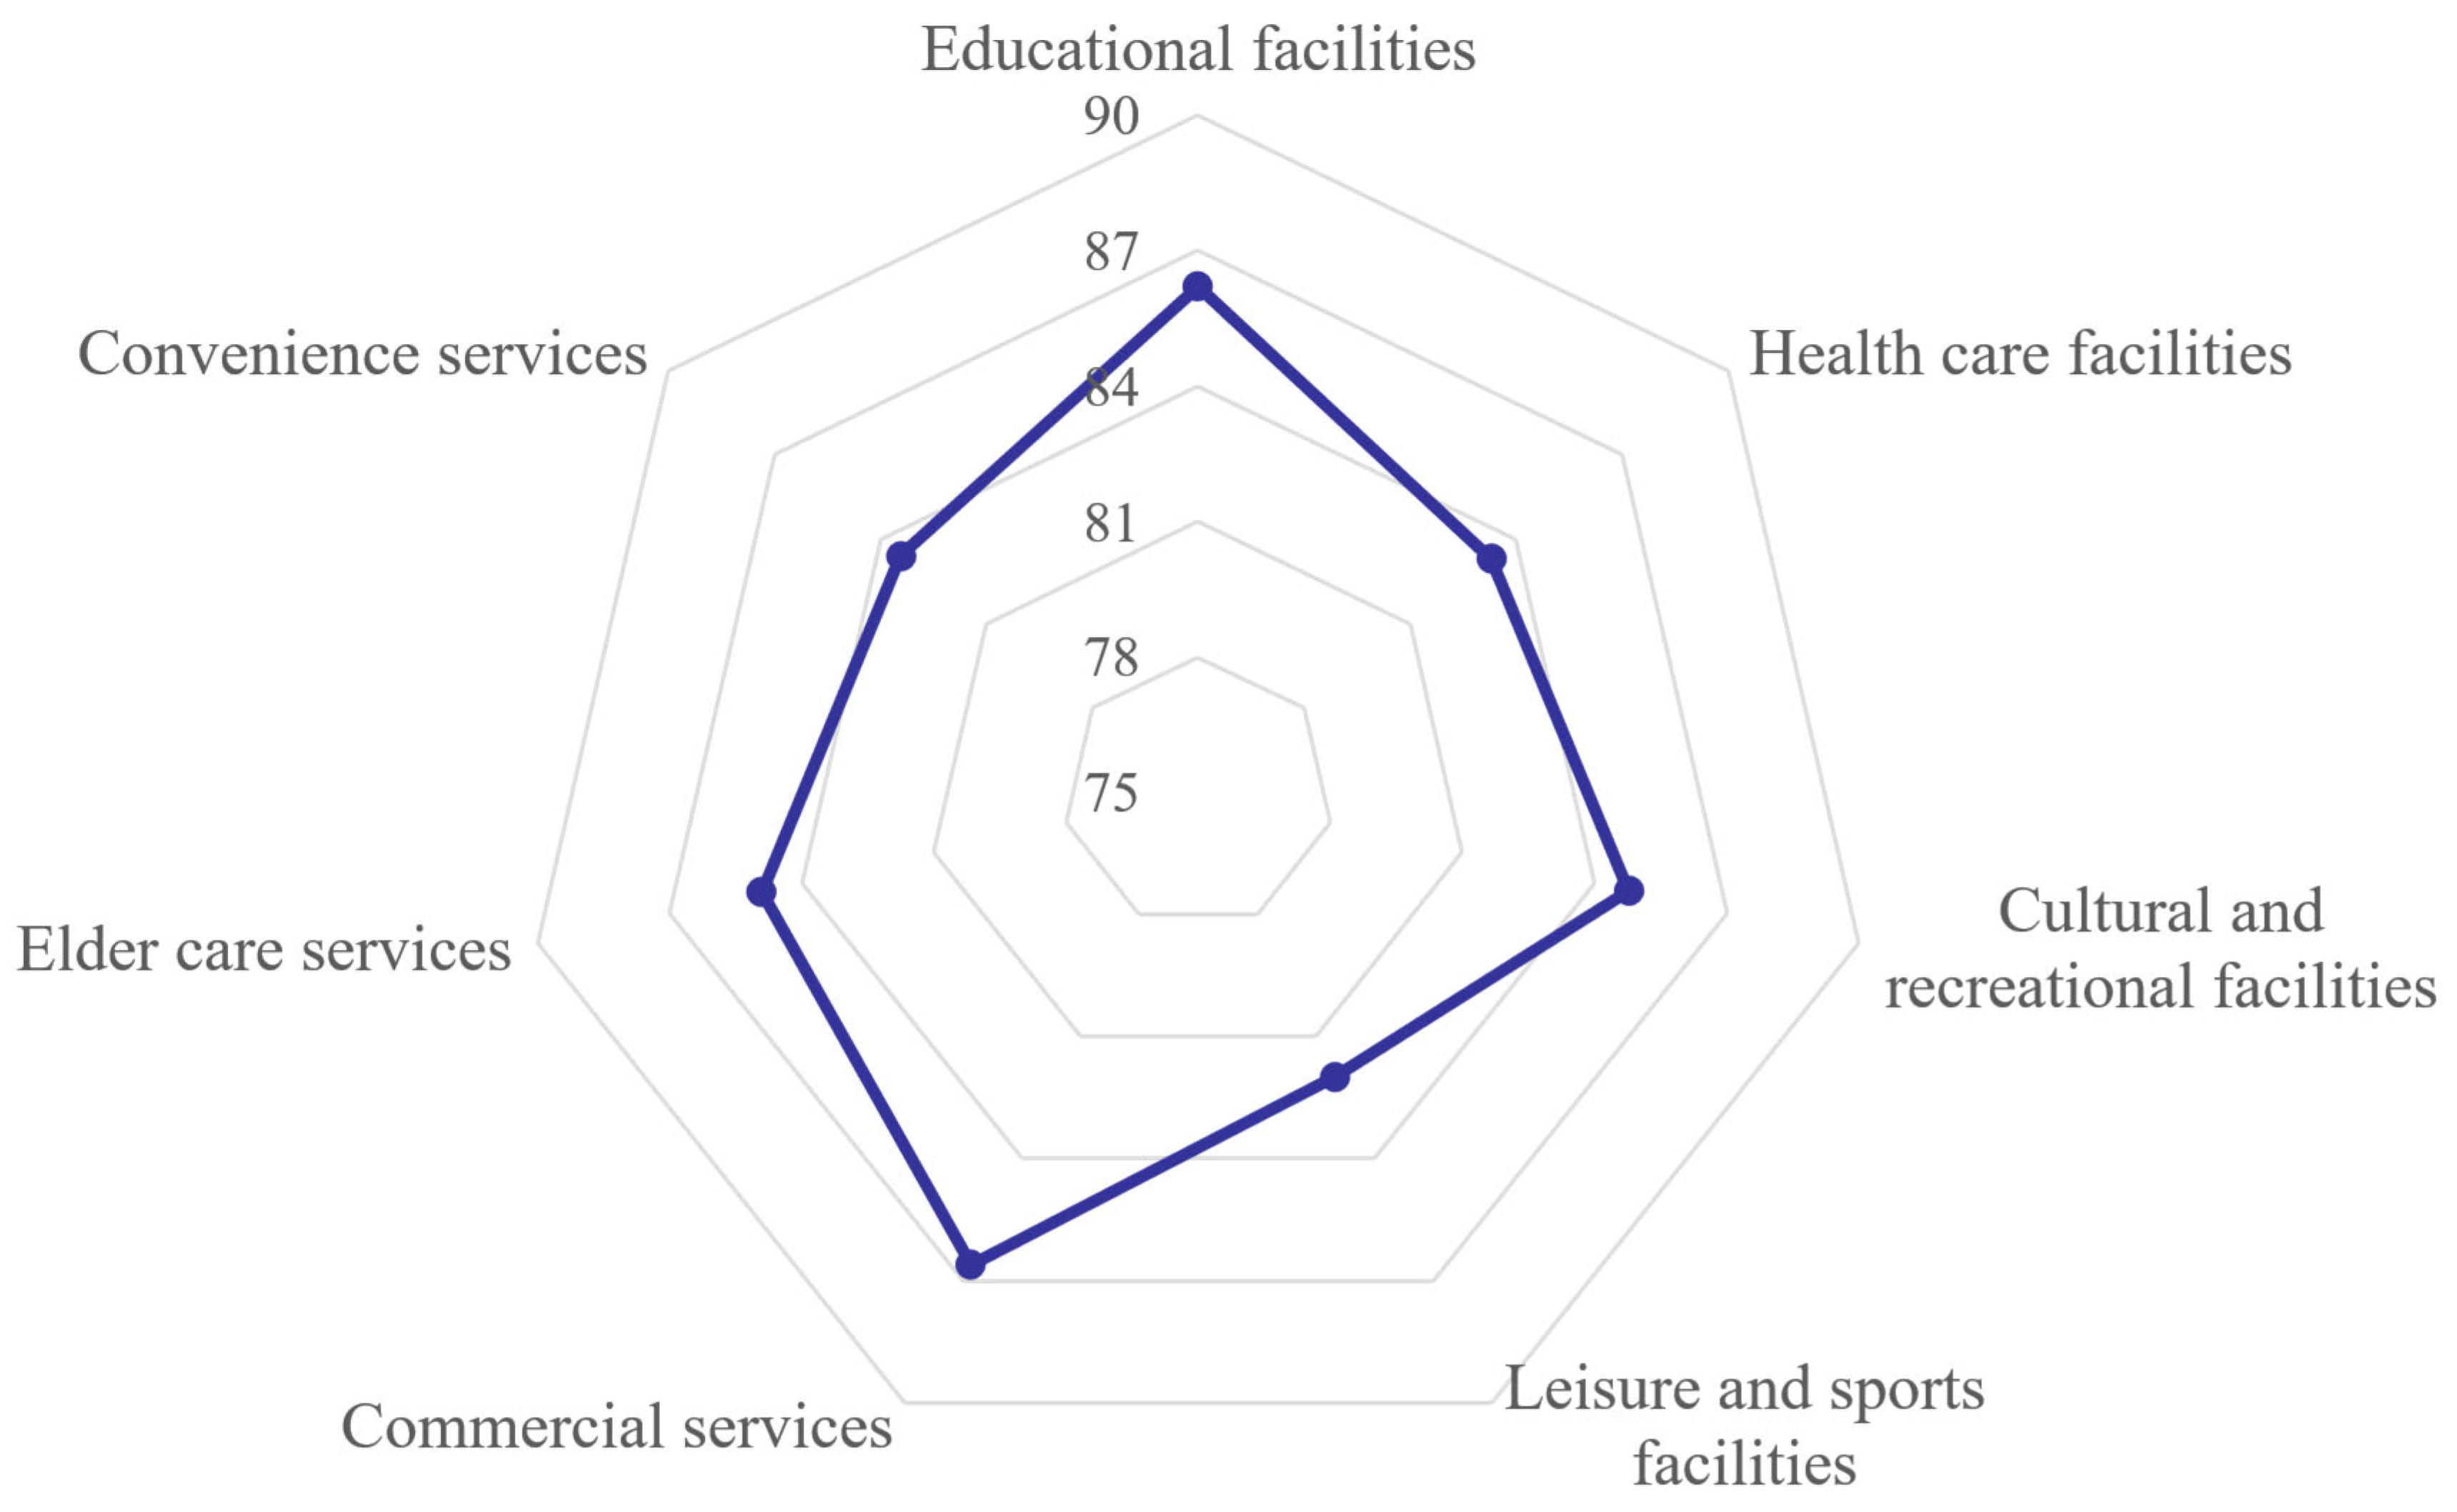
Within the public services dimension (Figure 5), all second-level indicators score above 80, indicating that current provision generally meets residents’ day-to-day needs in Wuhan’s small towns. Satisfaction is highest for commerce and services (86.60) and lowest for recreational sports (81.99). Field interviews further suggest that, although education and health care provision largely meet current demand, residents’ expectations in these two areas remain comparatively high.
Figure 5. Radar chart of scores for the public services dimension.
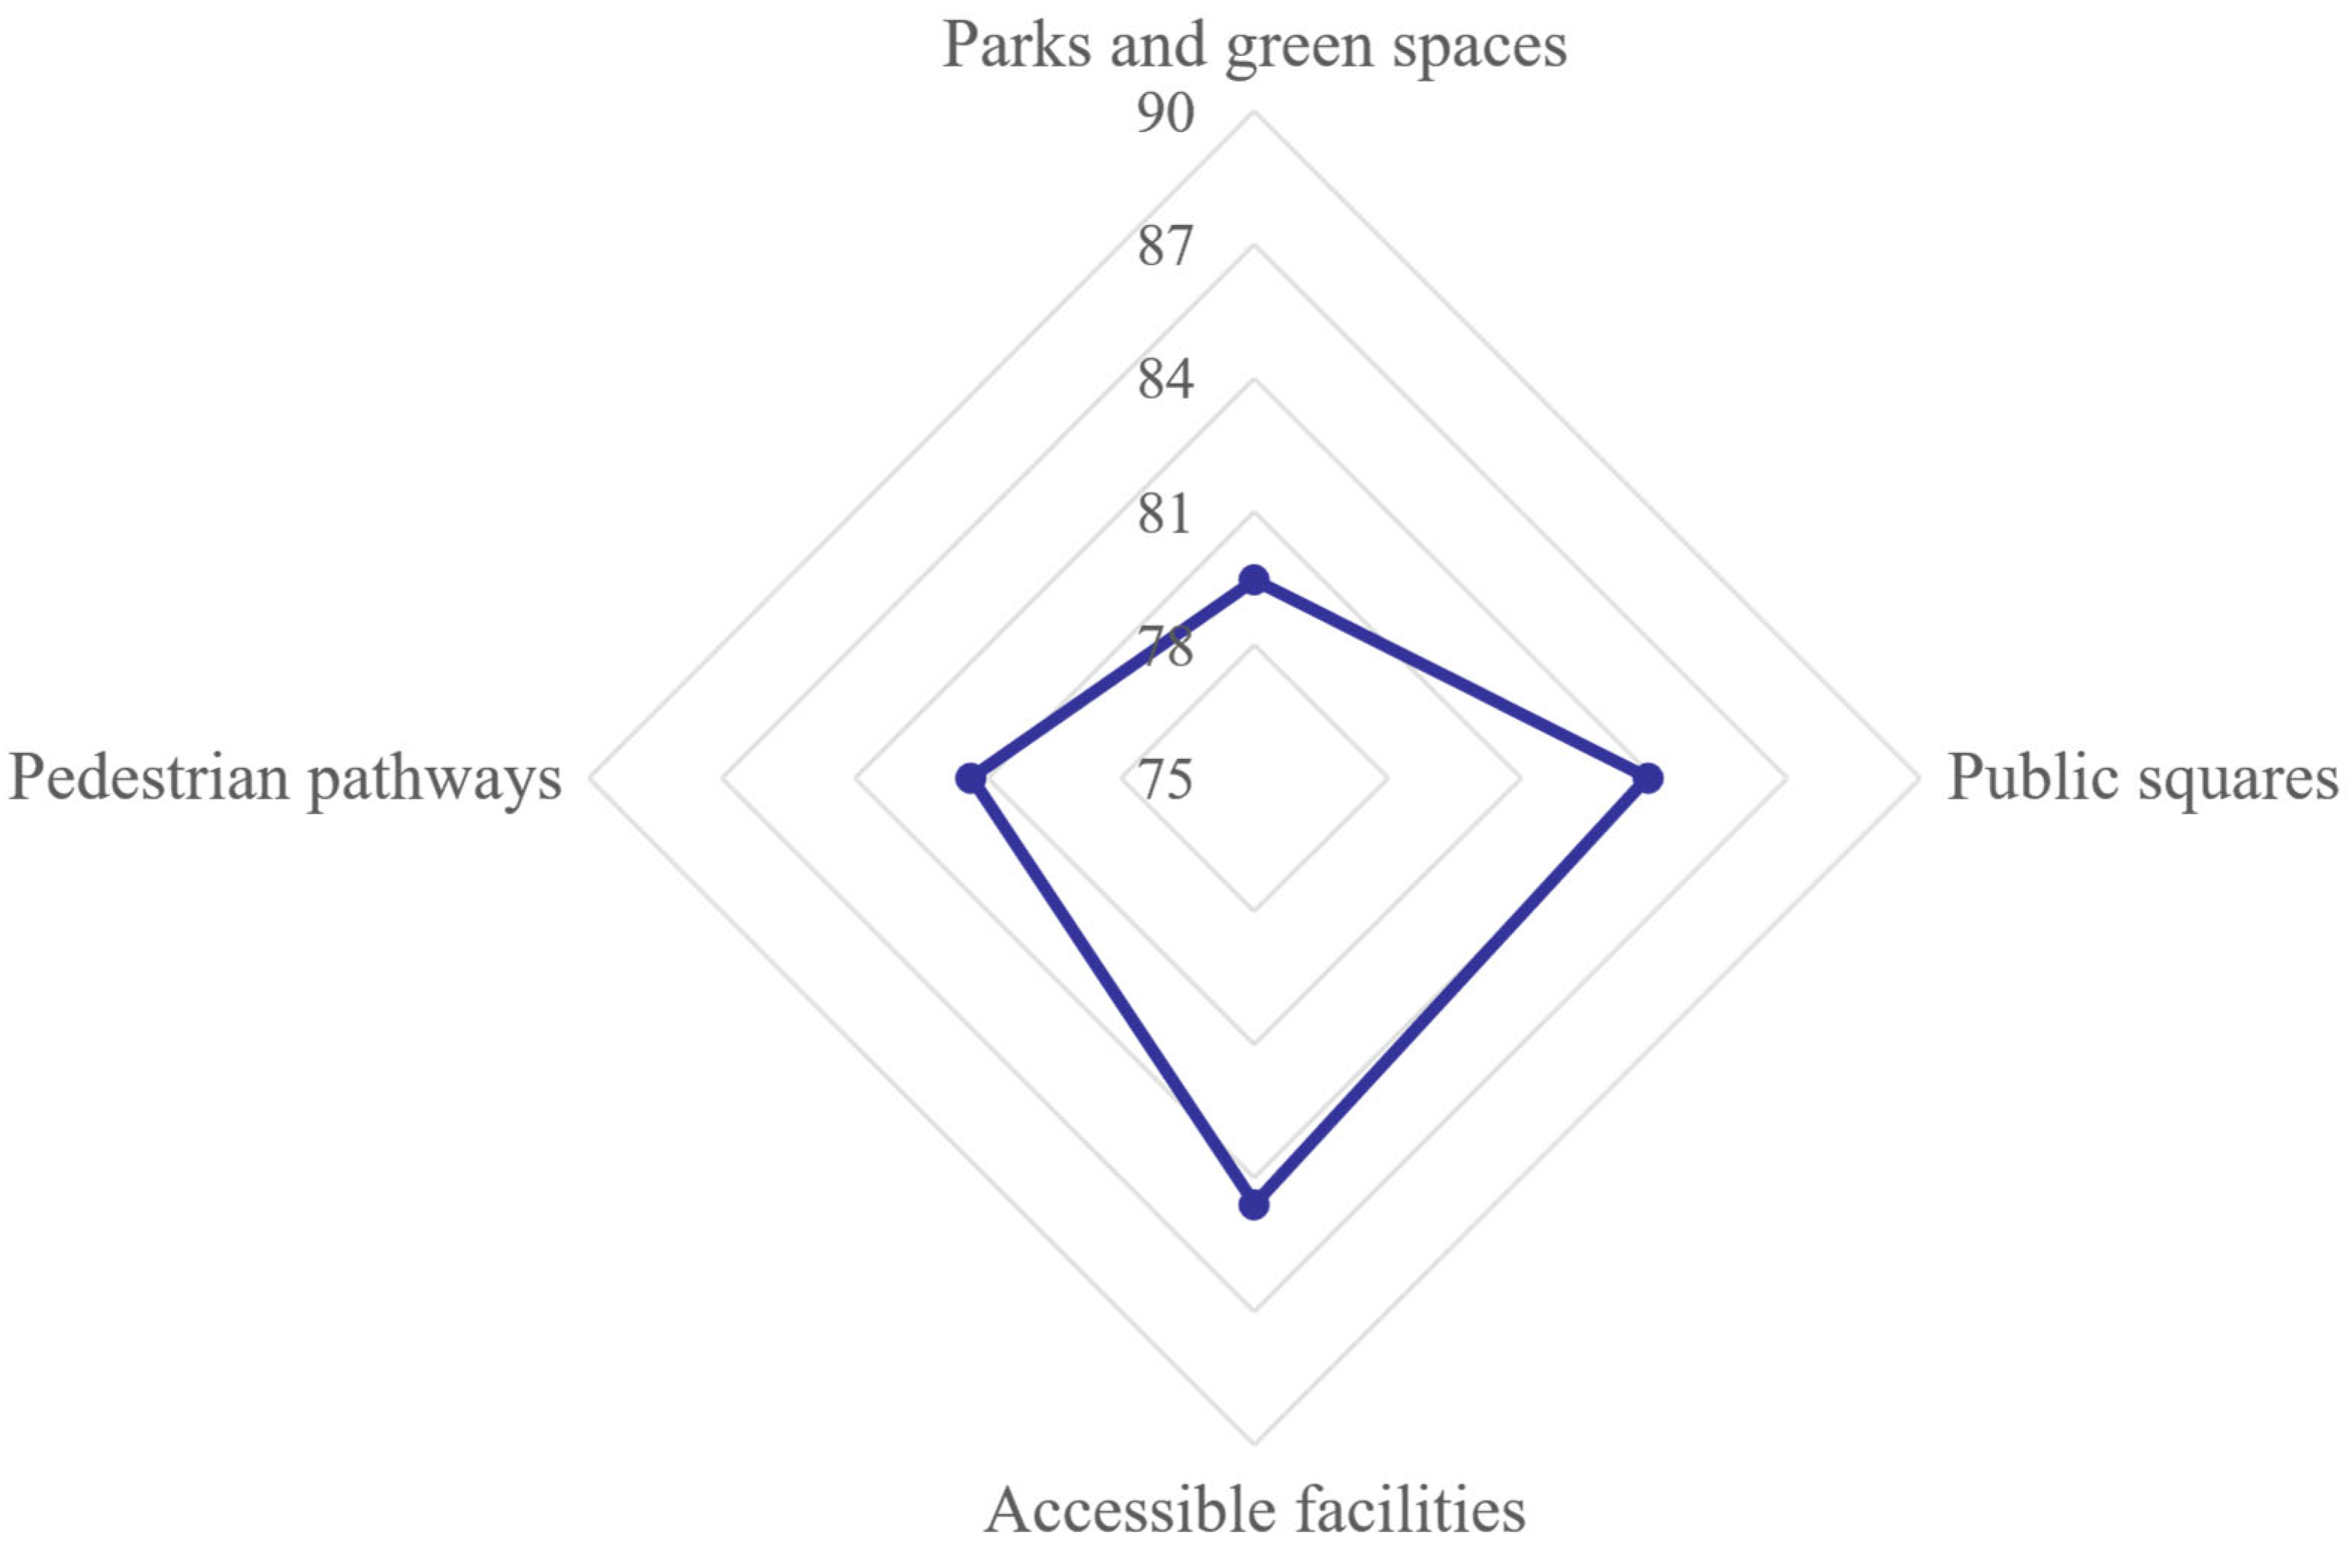
Within the public activity space dimension (Figure 6), second-level indicator scores cluster around 80. Satisfaction is highest for accessible facilities (84.59) and lowest for parks and green spaces (79.46).
Figure 6. Radar chart of scores for the public activity space dimension.
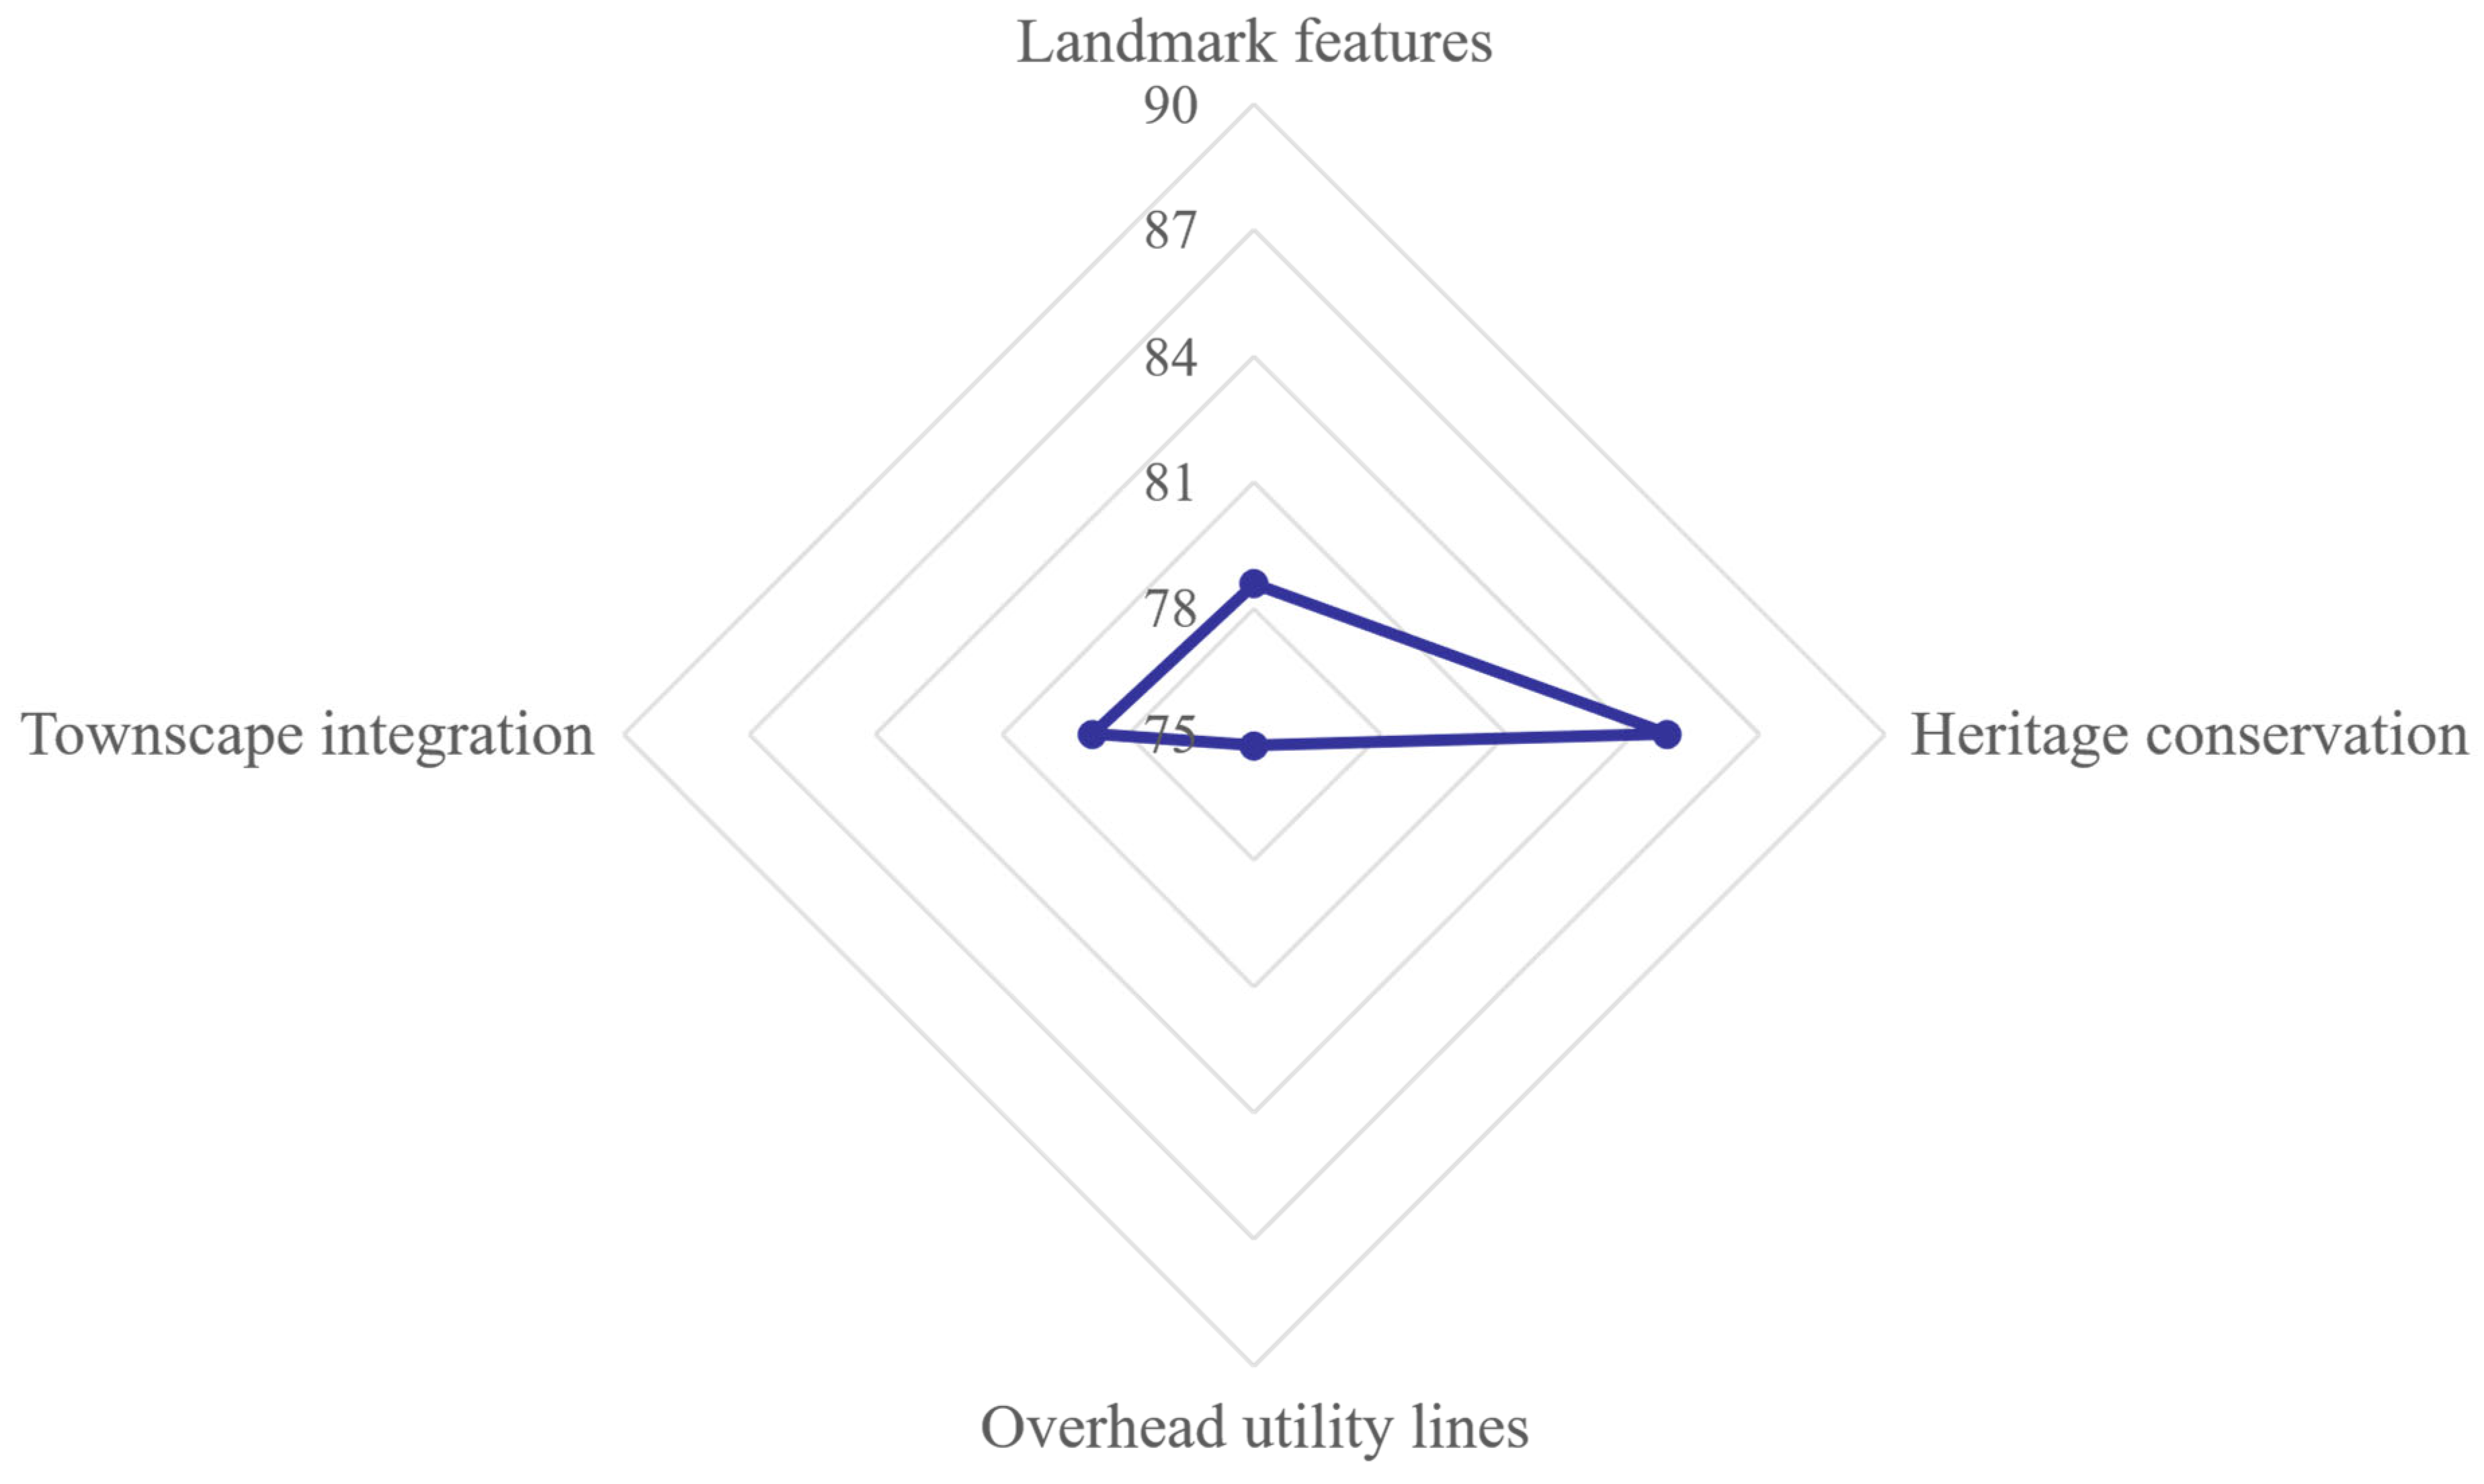
Within the townscape and character dimension (Figure 7), second-level indicators show substantial dispersion. Satisfaction is highest for heritage conservation (84.81), indicating broad recognition of preservation and transmission efforts, and lowest for overhead utility lines (75.27). Fieldwork indicates that many small towns suffer from visible aerial wiring and utility poles (limited undergrounding), weak architectural character, and cluttered street façades and frontages, which together depress satisfaction in this dimension.
Figure 7. Radar chart of scores for the townscape and character dimension.

3.1.3. Analysis of Town-Level Evaluation Results

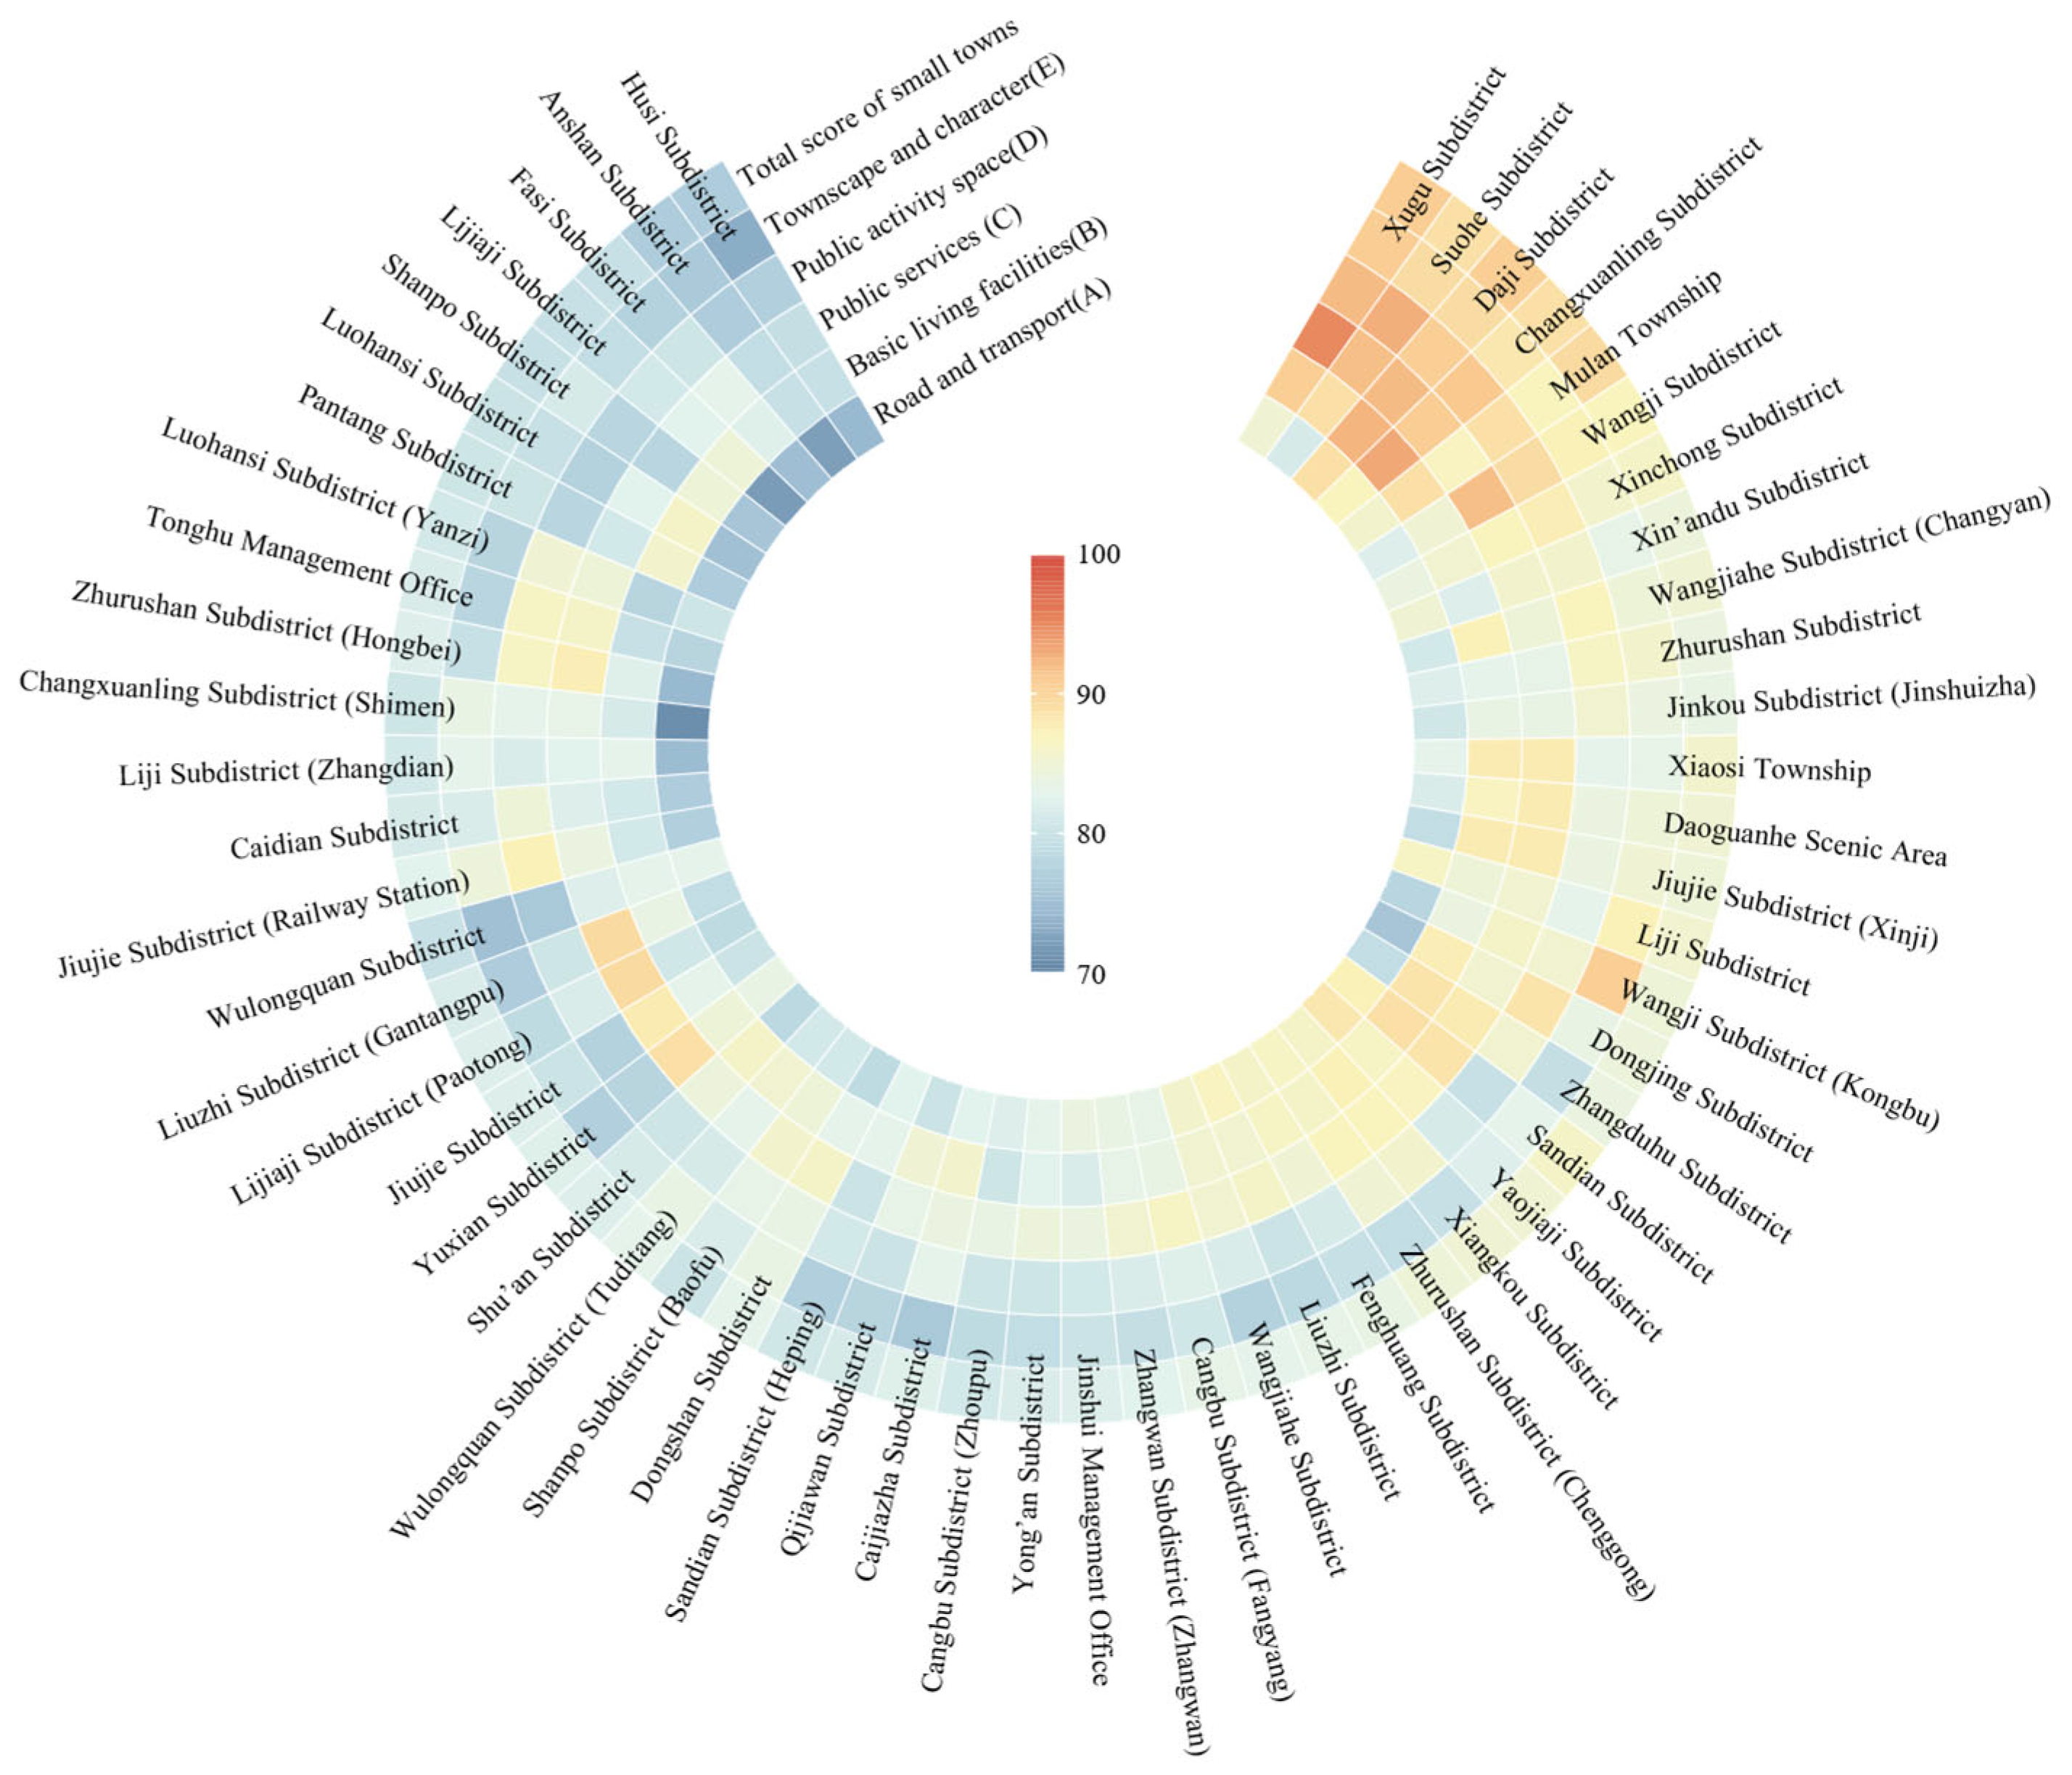
Using the indicator framework and scoring scheme described above, we computed satisfaction scores for each of the 56 small towns in the study area. The results are reported in Figure 8.
Figure 8. Heat map of satisfaction scores for small towns.
Across the 56 small towns, only 3.57% scored above 90, indicating exceptionally strong overall performance: infrastructure not only meets daily needs but is also associated with high reported well-being. The vast majority (85.71%) scored between 80 and 90; in these towns, infrastructure generally satisfies routine needs, though shortfalls in particular facilities remain, and targeted upgrades are warranted. The remaining 10.71% scored below 80, indicating that overall infrastructure falls short of a basic satisfaction threshold; multiple first-level dimensions require improvement, and these towns should be prioritized in future planning and investment.

3.2. Modified IPA Results

3.2.1. Dimension-Level Modified IPA Results

Using SPSS, we log-transformed the satisfaction score for each first-level dimension and computed its partial correlation with overall satisfaction; this partial correlation is taken as the dimension’s derived importance. Table 9 reports the results. All five first-level dimensions exceed the 4.0 threshold (overall mean = 4.1485). Satisfaction is highest for basic living facilities, followed by public services. For derived importance, the overall mean is 0.8176; the ranking indicates that residents prioritize townscape and character, followed by road and transport, implying higher expectations and stronger demand in these two domains.
Table 9. Satisfaction and derived importance by first-level dimension.
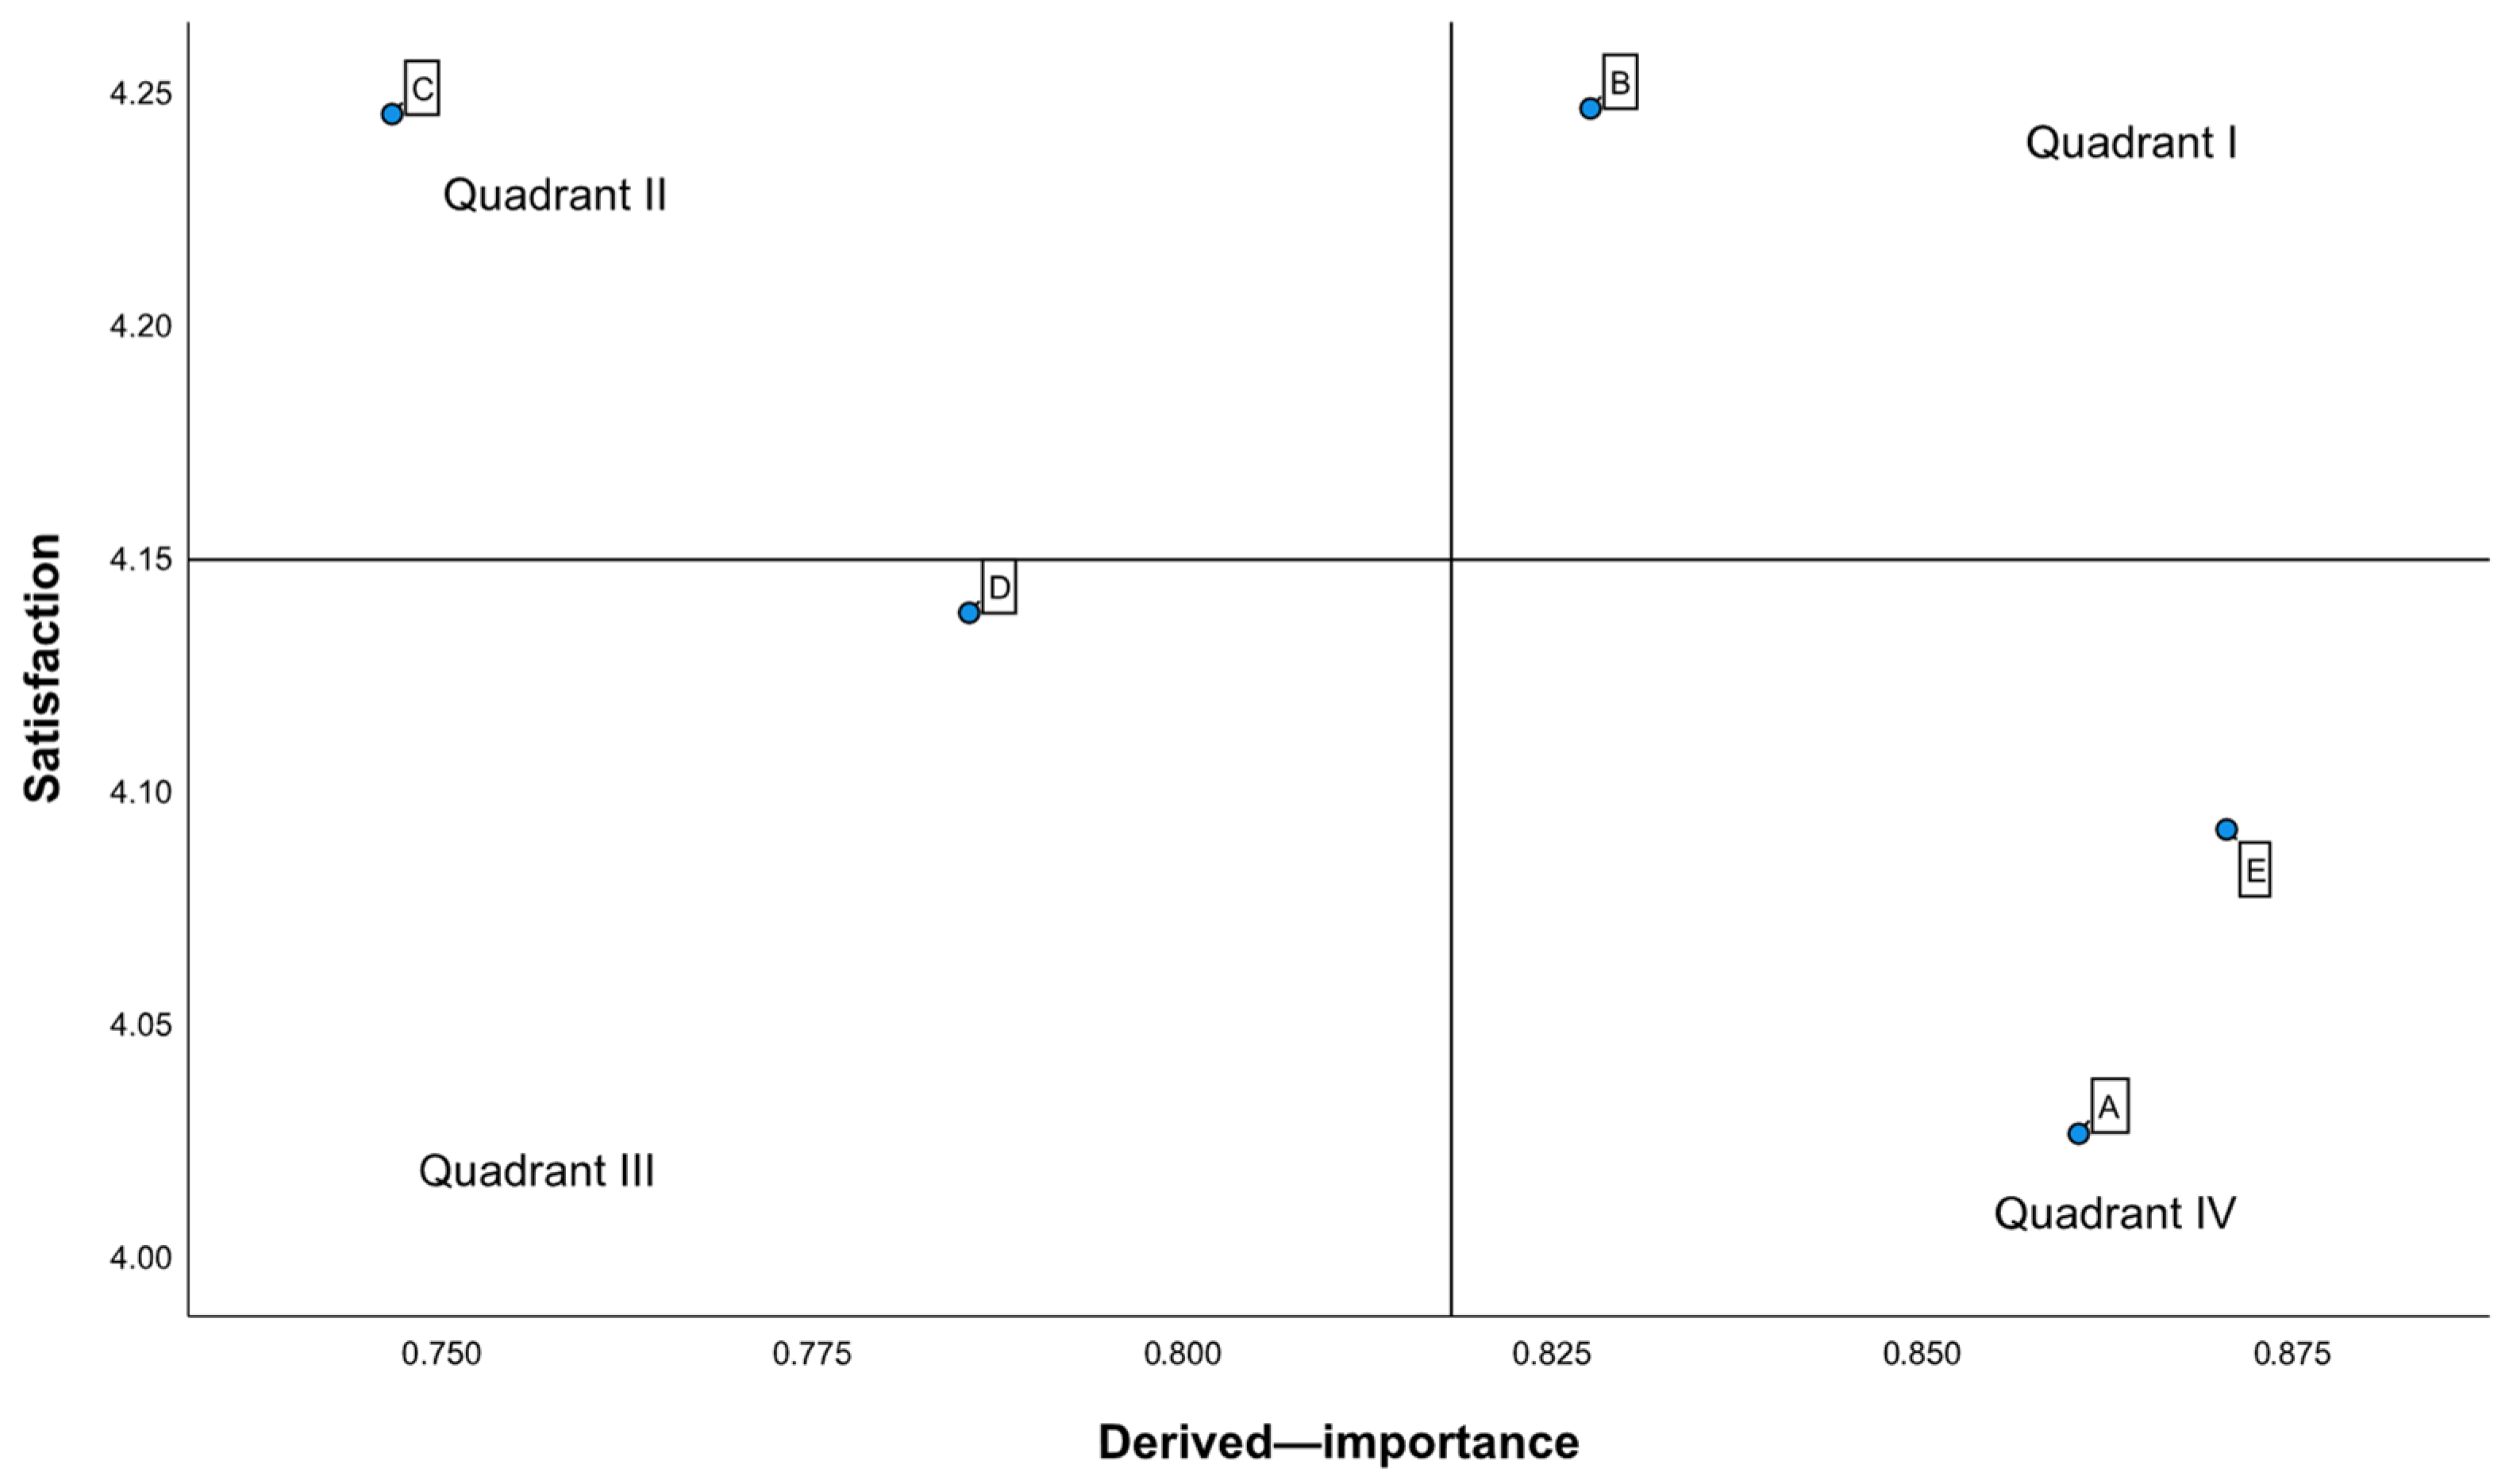
Using SPSS, we first computed the means of satisfaction (for the five first-level dimensions, A–E) and derived importance. The intersection of these means (0.8176, 4.1485) was set as the center of the modified IPA grid. The x-axis represents derived importance and the y-axis represents satisfaction; reference lines through the means partition the plane into four quadrants: Quadrant I—advantage enhancement zone (high importance, high satisfaction); Quadrant II—effort maintenance zone (low importance, high satisfaction); Quadrant III—secondary improvement zone (low importance, low satisfaction); and Quadrant IV—key improvement zone (high importance, low satisfaction). This grid is used to set improvement priorities (Figure 8).
As shown in Figure 9, the matrix shows a coherent pattern. B (basic living facilities) sits in Quadrant I (advantage enhancement zone): both importance and satisfaction are high. The policy implication is to safeguard current service levels while pursuing incremental, cost-effective upgrades and routine maintenance. C (public services) falls in Quadrant II (effort maintenance zone): importance is comparatively lower, but satisfaction is high, indicating residents are broadly content; resources should, therefore, be allocated to preserve performance, prevent slippage, and monitor service quality. D (public activity space) lies in Quadrant III (secondary improvement zone): both indicators are relatively low. Although not mission-critical, performance lags behind expectations; targeted upgrades that leverage local assets—selective projects, improved operation and management, and community activation—are advisable. A (road and transport) and E (townscape and character) are located in Quadrant IV (key improvement zone): high importance coupled with low satisfaction signals under-performance in domains central to daily life. These areas warrant urgent, well-resourced interventions guided by root-cause diagnosis, cross-departmental coordination, and staged investment.
Figure 9. Modified IPA matrix at the dimension level. Note: Axes cross at (0.8176, 4.1485); x = derived importance (partial r), and y = satisfaction (mean). A = Road and transport; B = Basic living facilities; C = Public services; D = Public activity space; E = Townscape and character.

3.2.2. Indicator-Level Modified IPA Results

Applying the modified IPA to the five first-level dimensions of the small-town infrastructure framework clarifies overarching improvement objectives and pinpoints priority domains for enhancement, with clear implications for macro-level policy steering. To translate these insights into actionable, fine-grained strategies, we disaggregate the analysis to the level of second-level indicators and implement the modified IPA for all 26 indicators in the evaluation system.
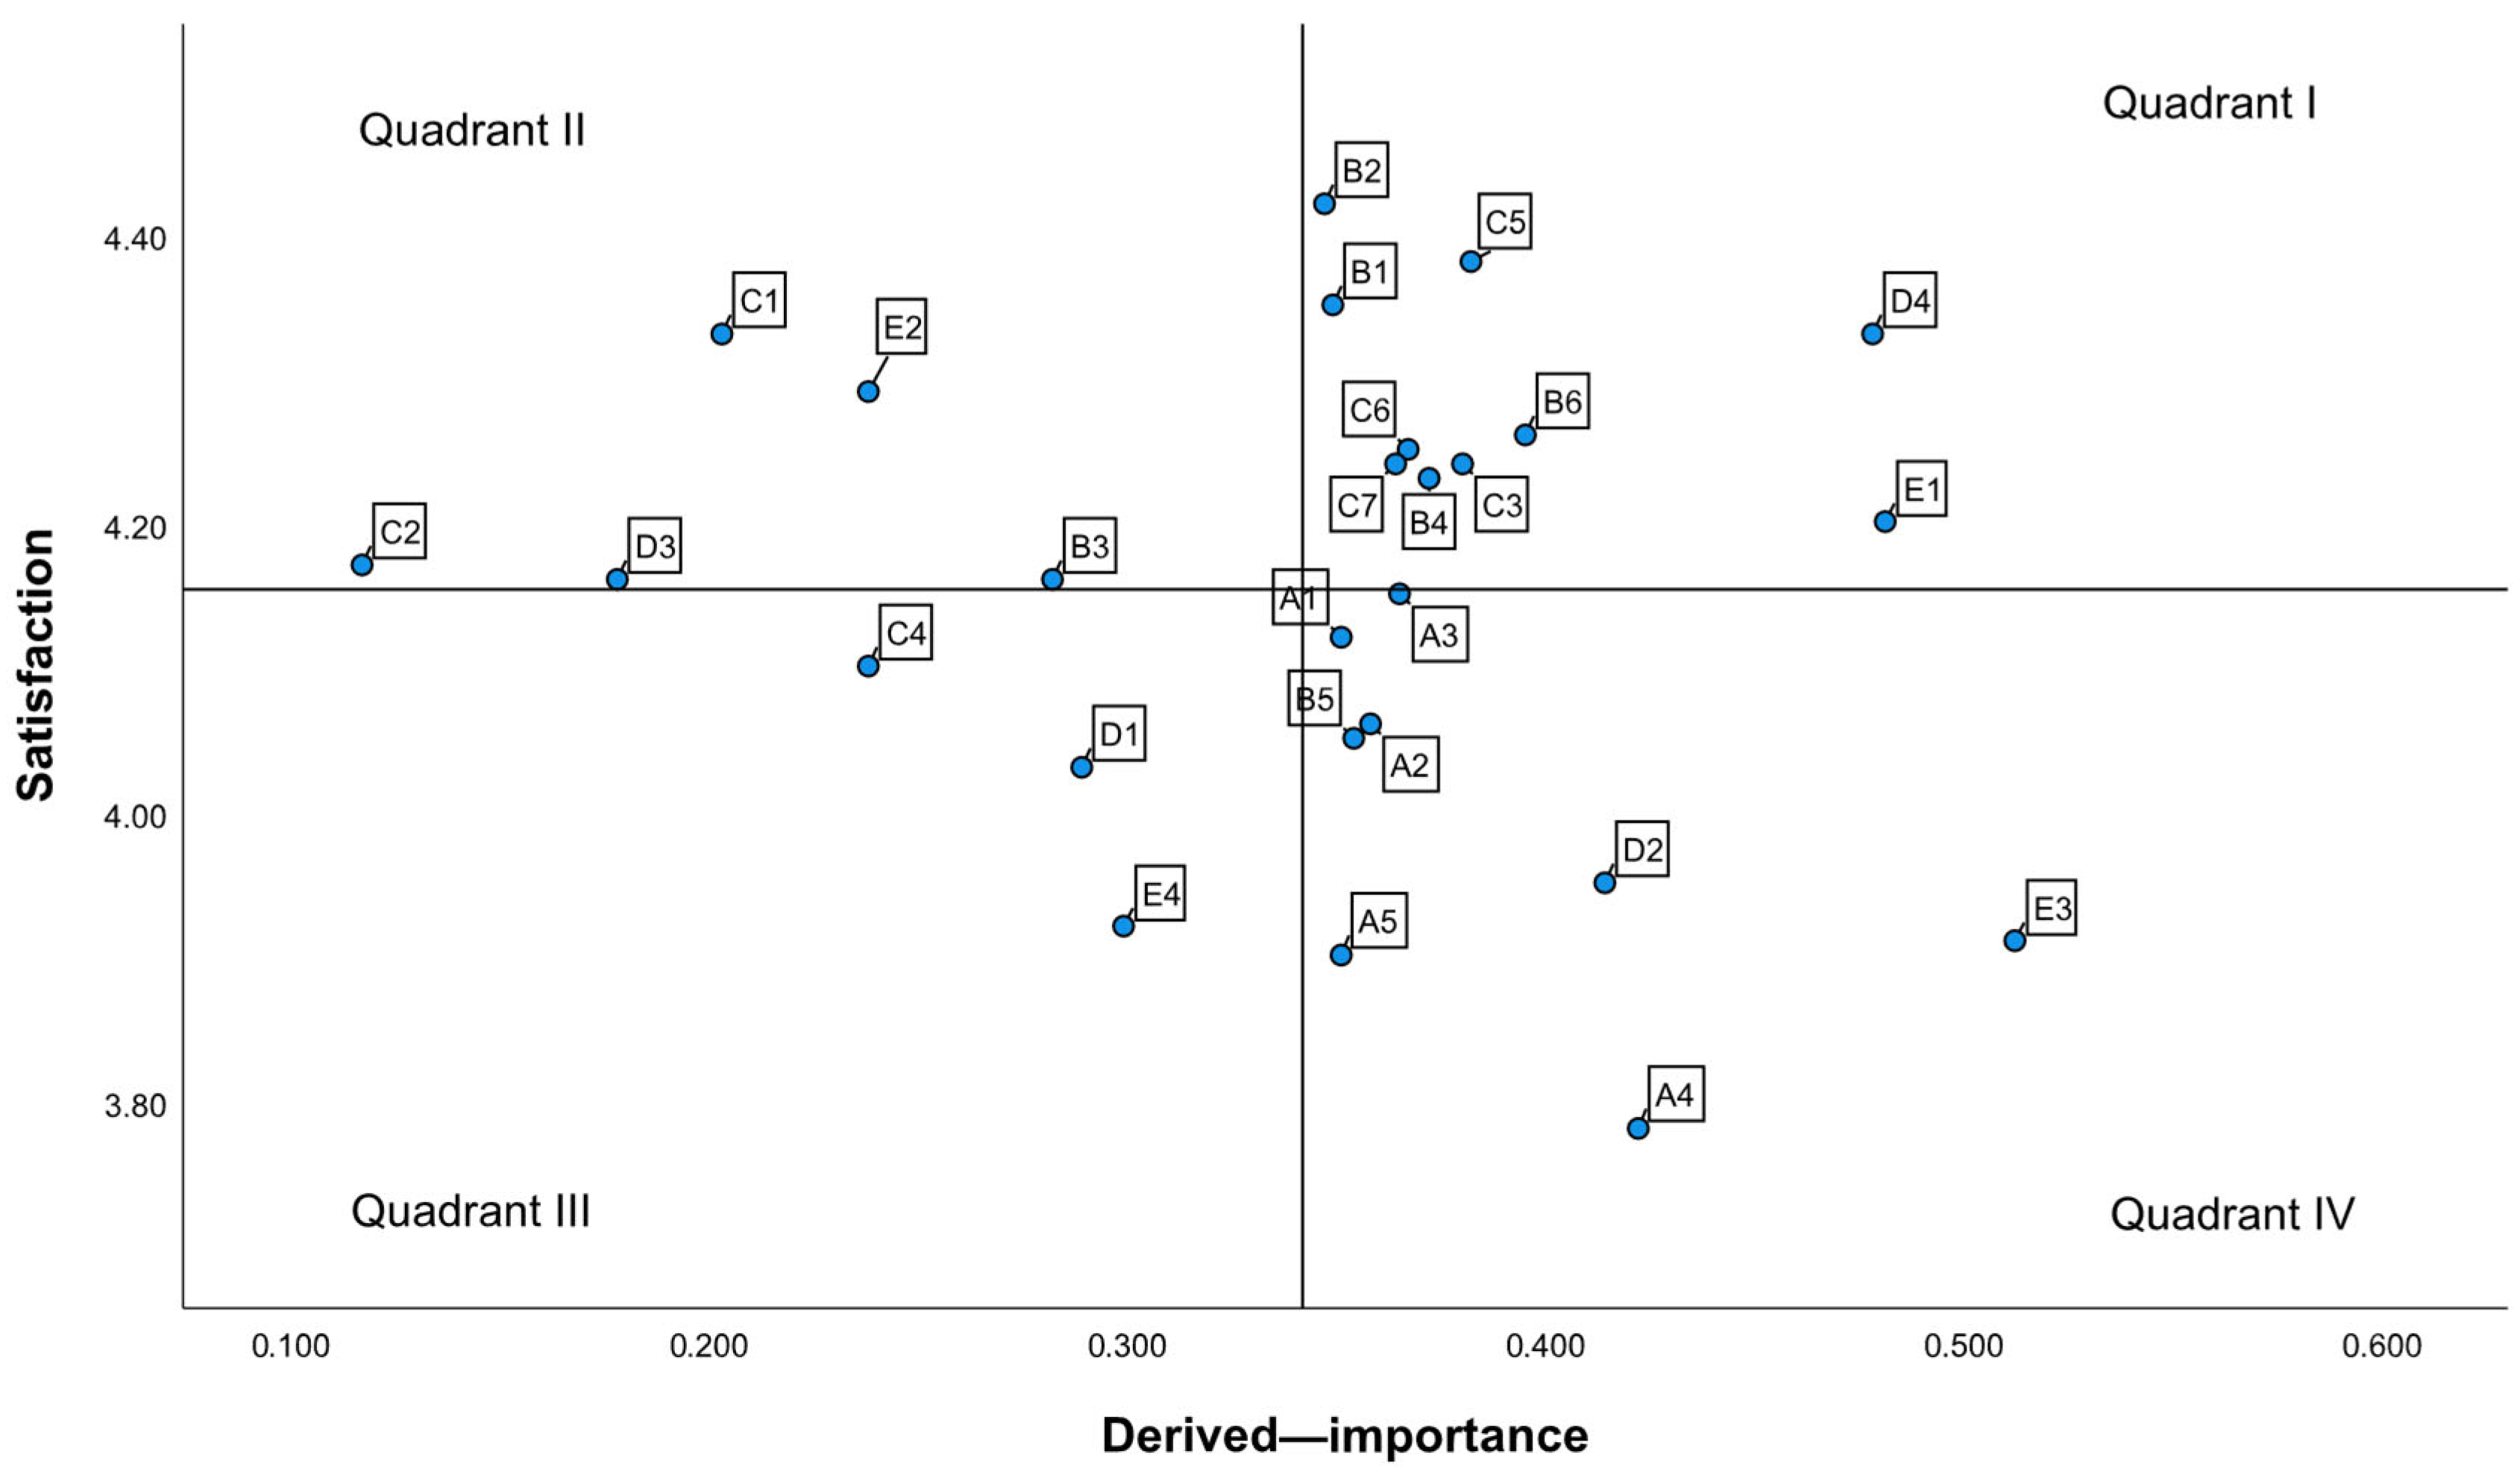
Following the dimension-level procedure described earlier, we examine respondents’ perceptions of each indicator (Table 10). Satisfaction scores for the 26 s-level indicators range from 3.78 to 4.42 (mean = 4.15); most exceed the 4.00 “basic satisfaction” threshold, indicating that infrastructure in the 56 small towns generally meets daily needs—consistent with the dimension-level findings. With respect to derived importance, E3 (overhead utility lines) ranks highest, whereas C2 (health care facilities) ranks lowest.
Table 10. Satisfaction and derived importance by second-level indicator.
Figure 10 plots derived importance on the x-axis and satisfaction on the y-axis; the crosshair at (0.34, 4.15) marks the mean values and partitions the space into four quadrants. The 26 s-level indicators are distributed across these quadrants as follows.
Figure 10. Modified IPA matrix at the indicator-level. Note: Axes cross at (0.34, 4.15); x = derived importance (partial r), and y = satisfaction (mean).
Quadrant I (advantage enhancement zone; 10 indicators, 38.46%): B: Water supply; B2: Electricity supply; B4: Waste collection and recycling; B6: Public toilets; C3: Cultural and recreational facilities; C5: Commercial services; C6: Elder care services; C7: Convenience services; D4: Pedestrian pathways; and E1: landmark features. Residents report high expectations and high satisfaction here. Most items belong to B (basic living facilities) and C (public services), which is consistent with the strong performance seen in those first-level dimensions. These areas should be maintained while pursuing incremental upgrades.
Quadrant II (effort maintenance zone; five indicators, 19.23%): B3: Stormwater drainage; C1: Educational facilities; C2: Health care facilities; D3: Accessible facilities; and E2: heritage conservation. This quadrant contains fewer items; importance is lower while satisfaction is high, suggesting that residents are generally content. Optimize resource allocation to sustain stable performance.
Quadrant III (secondary improvement zone; three indicators, 11.54%): C4: Leisure and sports facilities; D1: Parks and green spaces; and E4: Townscape integration. Both importance and satisfaction are relatively low. Although not critical, performance falls below expectations; targeted upgrades—leveraging local assets—are advisable to lift overall satisfaction.
Quadrant IV (key improvement zone; eight indicators, 30.77%): A1: Road-network; A2: Road quality; A3: Ancillary road facilities; A4: Public transport; A5: Parking facilities; B5: Sewage treatment; D2: Public squares; and E3: Overhead utility lines. These items cluster in A (road and transport) and E (townscape and character). They are high in importance but low in satisfaction, indicating vital domains that are underperforming. They warrant urgent, well-resourced interventions, informed by root-cause analysis and prioritized funding.

4. Discussion

4.1. Interpreting the Findings: From Evidence to Action

Our results indicate that overall resident satisfaction with small-town infrastructure is relatively high, yet the performance gap is not uniform across domains. The modified IPA, which derives implicit importance from overall satisfaction, consistently flags road and transport (A) and townscape and character (E) as priority areas for improvement, while basic living facilities (B) and public services (C) are closer to acceptable levels but still show pockets of under-performance.
At the indicator level, several attributes fall into the “Key Improvement Zone” quadrant. In transport, these include public-transport reliability and coverage, road quality and local accessibility, and parking management (e.g., curbside turnover and guidance). In townscapes, visual clutter from overhead utility lines, weak heritage integration/activation, and incoherent streetscape guidance emerge as prominent deficits. For public activity space, barrier-free continuity, shade/seating, and wayfinding are recurrent frictions that dampen everyday use. These patterns are heterogeneous across towns, suggesting that local legacy investment, maintenance capacity, and governance fragmentation shape outcomes.
Read through a sustainability lens, these priorities advance a triple-bottom-line agenda: social equity (safer access and inclusive public spaces), environmental co-benefits (stormwater control, greening, and reduced pollution), and resilience with fiscal realism (maintenance, network continuity, and O&M before amenity upgrades).
Taken together, the evidence supports three sequencing principles for small-town infrastructure: (i) fix the basics first—access, safety, and reliable core services—before amenity upgrades; (ii) pursue people-first, experience-based design, correcting supply–demand mismatches that engineering inputs alone do not reveal; and (iii) combine quick wins (maintenance, clutter removal, and micro-comforts) with systemic fixes (network continuity, operations and management, and digital monitoring) so improvements are durable rather than cosmetic. On this basis, we translate the findings into dimension-specific policy recommendations below.

4.2. Sustainability Implications

The recommended actions across all five domains advance SDG 11 [] under realistic budget constraints by improving the accessibility, quality, reliability, and safety of local infrastructure in small towns. In road and transport, restoring network continuity, barrier-free links, demand-responsive parking, and basic bus priority directly support SDG 11.2 [] on safe, affordable, and accessible mobility, and reduced cruising and cleaner corridors contribute to SDG 11.6 []. Enhancing public activity space through encroachment control, universal accessibility, and micro-greening strengthens inclusive access and place quality consistent with SDG 11.7 []. Townscape and character measures—visual-clutter reduction, risk-based undergrounding of priority corridors, and heritage activation—improve urban quality and disaster readiness in line with SDG 11.b []. Where basic living facility interventions target water, sanitation, and solid-waste operations (e.g., separated sewers, LID, and scheduled O&M), they also speak to SDG 6; distribution-grid upkeep and automation to manage emerging loads align with SDG 7 and, by strengthening system reliability and resilience, with SDG 9. Viewed through a triple-bottom-line lens, the portfolio promotes social equity (safer streets, universal access, and service reach), yields environmental co-benefits (stormwater control, greening, and reduced pollution), and builds resilience and fiscal realism by prioritizing maintenance, operations, and network fixes before amenity upgrades [].

5. Policy Recommendations

The quadrant-based priority ranking reflects the 56 small towns analyzed in this study and should not be read as a universal prescription. The framework—five first-level dimensions and 26 s-level indicators with a modified IPA—is generalizable, but priorities are context-specific and should be re-estimated with local data. Accordingly, the policy measures below are organized by the five dimensions to provide reference options that other regions can adapt to their own quadrant results.

5.1. Road and Transportation Policy Recommendations

Upgrading small-town road systems should begin with network repair and connectivity: resurface damaged links, remove bottlenecks and dead ends, and separate through-traffic from local circulation with coherent cross-sections. Street design and network form are consistently associated with lower car dependence and better multimodal performance [,]. Continuous, obstruction-free walking and cycling corridors, together with full public-transport coverage—routes and stops aligned to catchments, higher service frequency, and urban–rural integration—raise active-travel and transit uptake []. Real-time information and basic bus priority also improve perceived and actual reliability [,,]. Parking policy should be demand-responsive: add supply where under-served, price or time-limit curb space, and deploy guidance systems to cut cruising and improve turnover [].
At finer scales, strengthening external links and modestly increasing grid density in commercial and employment clusters enables more direct, shorter trips and supports reallocation of right-of-way across modes. Human-centered street treatments—shade, seating or leaning rails, clear wayfinding, and targeted safety measures at conflict points—enhance walkability and deliver health co-benefits, reinforcing the case for people-first design [].

5.2. Basic Living Facilities Policy Recommendations

Upgrading basic living facilities should start with the water-power backbone. Prioritize renewal of undersized or high-loss water mains, shift to looped (gridded) networks with interlinked sources, and deploy SCADA/IoT monitoring for pressure and flow to enable early leak detection and quality assurance; direct potable water pilots can be considered where source protection and treatment standards are met [,]. On the power side, reinforce distribution feeders, replace aging conductors, and phase in smart-grid functions—advanced metering, system automation, and EV-ready interfaces—to improve reliability and accommodate new loads from distributed energy and charging infrastructure [,].
Evidence from community-managed water projects shows that co-production—participatory planning, transparent cost-sharing, and community-based monitoring with ongoing technical backstopping—improves service performance and sustainability; scaling from rural to urban settings, however, requires stronger municipal/NGO support to cope with larger, more heterogeneous populations. Building on our IPA priorities, towns in the key improvement zone should pilot a “CM+” hybrid model: (i) town-level service compacts that specify roles and performance targets; (ii) user committees for routine O&M and grievance redress; (iii) micro-contracting with pay-for-performance; and (iv) municipal technical units providing continuous training, audits, and spare-parts logistics. This governance route complements capital investments by lowering failure risk and aligning operations with resident satisfaction signals [].
For wastewater and stormwater, complete the transition from combined to separated systems, connect near-urban towns to trunk sewers where feasible, and upgrade remote plants to higher effluent standards. Pair pipe rehabilitation with flood-risk management: restore conveyance, add detention, and implement low-impact development (LID) measures—consistent with China’s Sponge City concept—such as permeable pavements, bioretention, and green streets [,,]. Solid-waste service should add fixed sorting/collection points and transfer stations with compaction and basic pre-sorting, integrate residuals into city-wide disposal chains, and maintain public toilets to consistent hygiene standards through scheduled O&M and clear wayfinding, which together raise service quality and user satisfaction [,].

5.3. Public Services Policy Recommendations

To equalize access and raise service quality, school locations and sizes should be planned to match population distribution, with baseline teaching resources (furniture, projection, and multimedia) and teacher staffing secured; such inputs are associated with improved learning opportunities in under-resourced areas. Building a strong primary-care front end is equally critical: expand township/community clinics, clarify referral pathways, and pair on-site services with “online + offline” telehealth via certified internet-hospital platforms to extend reach to small towns while managing costs and continuity of care []. In parallel, upgrade medical capacity (beds/equipment), promote talent exchange, and use digital tools (triage, e-referral, and e-prescription) to stabilize day-to-day access and resilience of routine care [].
Aging services should prioritize home- and community-based care with age-friendly retrofits, reliable respite/day-care options, and linkage to long-term care insurance where available; evidence from China shows community-based models and LTCI pilots can improve coverage and reduce financial risk []. Create one-stop community service hubs that bundle education, health, social care, and convenience services, supported by smart scheduling and maintenance protocols; integrated and digitally enabled care networks are associated with better coordination and user value in Chinese settings.

5.4. Public Activity Space Policy Recommendations

Reclaiming encroached public space and supplying essential amenities can quickly lift everyday usability and equity. Clearing illegal structures and curbside encroachments, taming on-street parking near key public areas, and regulating itinerant vending free up the pedestrian realm and improve perceived safety and comfort [,]. Complementary micro-upgrades—continuous barrier-free paths, shade and seating, wayfinding, and basic exercise equipment—are consistently associated with more walking, social interaction, and use among older adults and other mobility-limited groups [,]. Where feasible, pair these “quick wins” with maintenance regimes (cleanliness, lighting, and landscaping) so that gains are durable rather than cosmetic [].
Beyond baseline provision, towns should shape a coherent public-space network anchored by “premium nodes” (e.g., gateways, landmarks, waterfronts, and temple/market forecourts) and linked by attractive walking corridors. Programming and design that reflect local heritage and everyday culture strengthen place attachment and pro-social behavior, while small green interventions around nodes (pocket parks, trees, and permeable surfaces) also deliver measurable health and thermal-comfort benefits. Priorities, therefore, are as follows: (i) enforce and manage to reclaim space for people; (ii) retrofit universal accessibility and comfort amenities; and (iii) curate a legible network of connected, identity-rich places rather than isolated projects [,].

5.5. Townscape and Character Policy Recommendations

For corridors flagged by E3 (overhead utilities) and E4 (townscape integration), computational urban design can scenario-test consolidation/undergrounding extents and streetscape options (materials, canopy, and façade rhythm) against simulated visual clutter [], shade, and thermal-comfort metrics; the AI-assisted, self-learning workflow refines layouts as monitoring and audit data accrue [].
Prioritize green, human-scaled public realm upgrades that strengthen identity and comfort. Add compact pocket parks and street-level greenery where centralized parks are lacking; use locally adapted, drought- and heat-tolerant species to ensure survivability and distinctiveness, which is linked to better health outcomes and thermal comfort [,]. Protect and activate heritage through everyday programming—markets, seasonal festivals, and intangible cultural practices—so historic assets become lived places rather than static artifacts, reinforcing place attachment and pro-social behavior. Streetscape works should follow coherent design guidance for color, materials, and façade rhythm along main corridors and gateways, balancing motorists’ and pedestrians’ sightlines and reducing visual clutter [].
Tackle visual blight and legibility at the network scale. Implement a clear plan for overhead utility lines: consolidate, standardize, and, where feasible, underground lines along priority corridors to improve visual quality and resilience; manage remaining spans by condition and safety class []. Encourage adaptive reuse of industrial and vernacular buildings to seed cultural–creative, small-tourism, and community-service functions; this typically yields lower embodied-carbon costs and stronger continuity of local character than demolition-and-rebuild. Stitch these “premium nodes” (landmarks, forecourts, waterfronts, and temple/market fronts) with barrier-free, shaded walking links, wayfinding, and small green interventions so the result is a connected network rather than isolated projects.

6. Conclusions

This study answers two questions. First (RQ1), what is the quality of small-town infrastructure services from the perspective of resident satisfaction? We constructed a resident satisfaction-based evaluation framework with five first-level dimensions and twenty-six second-level indicators and implemented a modified importance–performance analysis (IPA) that derived indicator importance statistically (via partial correlations with overall satisfaction) rather than collecting self-reported importance scores. This one-instrument design (only satisfaction ratings) reduces respondent burden, keeps scoring rules transparent and auditable, and yields a replicable pipeline from resident data to interpretable quality profiles. Second (RQ2), how can priority areas for improvement be identified under resource constraints? By mapping mean satisfaction against derived importance, the modified IPA partitions indicate four quadrants, showing where a marginal unit of budget is likely to yield the greatest resident-perceived gain. The procedure transforms a general “many gaps, limited funds” problem into an actionable, budget-aware sequence of investments and O&M tasks that can be updated as conditions change.
Applied to small towns in Wuhan’s new districts, the modified IPA shows a clear mismatch between indicator importance and resident satisfaction. Road and transport and townscape and character fall into Quadrant IV (key improvement zone) and should be prioritized for investment and management attention; basic living facilities are in Quadrant I (advantage enhancement zone), where advantages should be consolidated and incrementally enhanced; public services are in Quadrant II (effort maintenance zone), calling for sustained operations and maintenance (O&M) and targeted quality assurance; and public activity space sits predominantly in Quadrant III (secondary improvement zone), warranting targeted, incremental upgrades (e.g., barrier-free continuity, shade/seating, and wayfinding). Overall, small-town infrastructure governance is shifting from “whether it exists” to “how well it performs”, indicating a move from supply-driven provision to demand-responsive, performance-oriented management and evidence-informed prioritization.
The limitations of this study are that although the design reduces the subjectivity associated with self-reported importance, derived importance still reflects the correlational structure in the data rather than causal mechanisms; causal drivers should be probed with before and after evaluations once projects are implemented. Future work can couple the IPA with cost, lifecycle, risk, or carbon modules to build multi-objective priority lists and introduce equity weights to surface the needs of vulnerable populations, thereby enhancing both efficiency and fairness in small-town infrastructure governance.

Author Contributions

Conceptualization, Z.Z.; Methodology, Z Z. and X.D.; Software, Z.Z.; Investigation, Z.Z. and Y.T.; Resources, Z.Z. and Y.T.; Data curation, Y.T.; Writing—original draft, Z.Z.; Writing—review & editing, Z.Z., X.D. and Y.T.; Supervision, X.D. All authors have read and agreed to the published version of the manuscript.

Funding

This research received no external funding.

Institutional Review Board Statement

Ethical review and approval were waived for this study due to the institutional policy of Wuhan Polytechnic University, which exempts anonymous, minimal-risk questionnaire surveys of adult residents that do not collect identifiable personal data from full ethics review and approval codes. The study was conducted in accordance with the Declaration of Helsinki (2013 revision).

Data Availability Statement

The raw individual-level survey data are not publicly available due to privacy and institutional restrictions; the informed consent did not permit data sharing. Only aggregated statistics are reported in the article, and no additional data can be provided.

Conflicts of Interest

The authors declare no conflicts of interest.

References

  1. Pandey, B.; Brelsford, C.; Seto, K.C. Infrastructure Inequality Is a Characteristic of Urbanization. Proc. Natl. Acad. Sci. USA 2022, 119, e2119890119. [Google Scholar] [CrossRef]
  2. Van Vliet, J.; Birch-Thomsen, T.; Gallardo, M.; Hemerijckx, L.-M.; Hersperger, A.M.; Li, M.; Tumwesigye, S.; Twongyirwe, R.; Van Rompaey, A. Bridging the Rural-Urban Dichotomy in Land Use Science. J. Land Use Sci. 2020, 15, 585–591. [Google Scholar] [CrossRef]
  3. Lu, H.; Zhao, P.; Hu, H.; Zeng, L.; Wu, K.S.; Lv, D. Transport Infrastructure and Urban-Rural Income Disparity: A Municipal-Level Analysis in China. J. Transp. Geogr. 2022, 99, 103292. [Google Scholar] [CrossRef]
  4. Ochoa-Rico, M.S.; Río, J.A.J.; Romero-Subia, J.F.; Vergara-Romero, A. Study of Citizen Satisfaction in Rural Versus Urban Areas in Public Services: Perspective of a Multi-Group Analysis. Soc. Indic. Res. 2024, 171, 87–110. [Google Scholar] [CrossRef]
  5. Thacker, S.; Adshead, D.; Fay, M.; Hallegatte, S.; Harvey, M.; Meller, H.; O’Regan, N.; Rozenberg, J.; Watkins, G.; Hall, J.W. Infrastructure for Sustainable Development. Nat. Sustain. 2019, 2, 324–331. [Google Scholar] [CrossRef]
  6. Cirolia, L.R. Fractured Fiscal Authority and Fragmented Infrastructures: Financing Sustainable Urban Development in Sub-Saharan Africa. Habitat Int. 2020, 104, 102233. [Google Scholar] [CrossRef]
  7. Morán Uriel, J.; Camerin, F.; Córdoba Hernández, R. Urban Horizons in China: Challenges and Opportunities for Community Intervention in a Country Marked by the Heihe-Tengchong Line. In Diversity as Catalyst: Economic Growth and Urban Resilience in Global Cityscapes; Siew, G., Allam, Z., Cheshmehzangi, A., Eds.; Springer Nature: Singapore, 2024; pp. 105–125. ISBN 978-981-97-8776-0. [Google Scholar]
  8. Kim, J.; Ebdon, C. Asset Maintenance Practices and Challenges in U.S. Counties. Public Works Manag. Policy 2021, 26, 259–278. [Google Scholar] [CrossRef]
  9. Wang, M.; Yin, X. Construction and Maintenance of Urban Underground Infrastructure with Digital Technologies. Autom. Constr. 2022, 141, 104464. [Google Scholar] [CrossRef]
  10. Chen, M.; Chen, C.; Jin, C.; Li, B.; Zhang, Y.; Zhu, P. Evaluation and Obstacle Analysis of Sustainable Development in Small Towns Based on Multi-Source Big Data: A Case Study of 782 Top Small Towns in China. J. Environ. Manag. 2024, 366, 121847. [Google Scholar] [CrossRef]
  11. Tong, K.; Zhao, Z.; Feiock, R.; Ramaswami, A. Patterns of Urban Infrastructure Capital Investment in Chinese Cities and Explanation through a Political Market Lens. J. Urban Aff. 2019, 41, 248–263. [Google Scholar] [CrossRef]
  12. Bouckaert, G.; van de Walle, S. Comparing Measures of Citizen Trust and User Satisfaction as Indicators of ‘Good Governance’: Difficulties in Linking Trust and Satisfaction Indicators. Int. Rev. Adm. Sci. 2003, 69, 329–343. [Google Scholar] [CrossRef]
  13. Ryzin, G.G.V. Expectations, Performance, and Citizen Satisfaction with Urban Services. J. Policy Anal. Manag. 2004, 23, 433–448. [Google Scholar] [CrossRef]
  14. Martilla, J.A.; James, J.C. Importance-Performance Analysis. J. Mark. 1977, 41, 77–79. [Google Scholar] [CrossRef]
  15. Oh, H. Revisiting Importance–Performance Analysis. Tour. Manag. 2001, 22, 617–627. [Google Scholar] [CrossRef]
  16. Ding, W.; Chen, H. Urban-Rural Fringe Identification and Spatial Form Transformation during Rapid Urbanization: A Case Study in Wuhan, China. Build. Environ. 2022, 226, 109697. [Google Scholar] [CrossRef]
  17. Geurs, K.T.; Van Wee, B. Accessibility Evaluation of Land-Use and Transport Strategies: Review and Research Directions. J. Transp. Geogr. 2004, 12, 127–140. [Google Scholar] [CrossRef]
  18. Eboli, L.; Mazzulla, G. Service Quality Attributes Affecting Customer Satisfaction for Bus Transit. J. Public Transp. 2007, 10, 21–34. [Google Scholar] [CrossRef]
  19. Marsden, G. The Evidence Base for Parking Policies—A Review. Transp. Policy 2006, 13, 447–457. [Google Scholar] [CrossRef]
  20. UN-Habitat. Urban Basic Services. Available online: https://unhabitat.org/urban-basic-services (accessed on 12 September 2025).
  21. Bain, R.; Cronk, R.; Wright, J.; Yang, H.; Slaymaker, T.; Bartram, J. Fecal Contamination of Drinking-Water in Low-and Middle-Income Countries: A Systematic Review and Meta-Analysis. PLoS Med. 2014, 11, e1001644. [Google Scholar] [CrossRef]
  22. Rathi, S.S.; Vermaak, C. Rural Electrification, Gender and the Labor Market: A Cross-Country Study of India and South Africa. World Dev. 2018, 109, 346–359. [Google Scholar] [CrossRef]
  23. Sharma, R.; Malaviya, P. Management of Stormwater Pollution Using Green Infrastructure: The Role of Rain Gardens. WIREs Water 2021, 8, e1507. [Google Scholar] [CrossRef]
  24. Ferronato, N.; Torretta, V. Waste Mismanagement in Developing Countries: A Review of Global Issues. Int. J. Environ. Res. Public. Health 2019, 16, 1060. [Google Scholar] [CrossRef] [PubMed]
  25. Prüss-Ustün, A.; Wolf, J.; Bartram, J.; Clasen, T.; Cumming, O.; Freeman, M.C.; Gordon, B.; Hunter, P.R.; Medlicott, K.; Johnston, R. Burden of Disease from Inadequate Water, Sanitation and Hygiene for Selected Adverse Health Outcomes: An Updated Analysis with a Focus on Low-and Middle-Income Countries. Int. J. Hyg. Environ. Health 2019, 222, 765–777. [Google Scholar] [CrossRef]
  26. OECD. How’s Life? 2020: Measuring Well-Being; OECD: Paris, France, 2020; ISBN 978-92-64-65467-9. [Google Scholar]
  27. Carmona, M. Public Places Urban Spaces: The Dimensions of Urban Design, 3rd ed.; Routledge: New York, NY, USA, 2021; ISBN 978-1-315-15845-7. [Google Scholar]
  28. Sedai, A.K.; Jamasb, T.; Nepal, R.; Miller, R. Electrification and Welfare for the Marginalized: Evidence from India. Energy Econ. 2021, 102, 105473. [Google Scholar] [CrossRef]
  29. Williams, A.R.; Bain, R.E.; Fisher, M.B.; Cronk, R.; Kelly, E.R.; Bartram, J. A Systematic Review and Meta-Analysis of Fecal Contamination and Inadequate Treatment of Packaged Water. PLoS ONE 2015, 10, e0140899. [Google Scholar] [CrossRef]
  30. Miles, B.; Band, L.E. Green Infrastructure Stormwater Management at the Watershed Scale: Urban Variable Source Area and Watershed Capacitance. Hydrol. Process. 2015, 29, 2268. [Google Scholar] [CrossRef]
  31. Sumper, A.; Boix-Aragones, O.; Rull-Duran, J.; Amat-Algaba, J.; Wagner, J. Assessment of the Visual Impact of Existing High-Voltage Lines in Urban Areas. Electricity 2021, 2, 285–299. [Google Scholar] [CrossRef]
  32. Chen, Y.; Zhang, F.; Qian, Y.; Zeng, J.; Li, X. A New Car-Following Model Considering the Driver’s Dynamic Reaction Time and Driving Visual Angle on the Slope. Phys. Stat. Mech. Its Appl. 2025, 663, 130408. [Google Scholar] [CrossRef]
  33. Maksoud, A.; Al-Beer, H.B.; Mushtaha, E.; Yahia, M.W. Self-learning Buildings: Integrating Artificial Intelligence to Create a Building that Can Adapt to Future Challenges. IOP Conf. Ser. Earth Environ. Sci. 2022, 1019, 012047. [Google Scholar] [CrossRef]
  34. Aref, M.; Basel, A.B.H.; Ali, H.A.; Samir, D.; Emad, M.; Wasim, Y.M. Computational Design for Futuristic Environmentally Adaptive Building Forms and Structures. Archit. Eng. 2023, 8, 13–24. [Google Scholar] [CrossRef]
  35. Dunn, T.J.; Baguley, T.; Brunsden, V. From Alpha to Omega: A Practical Solution to the Pervasive Problem of Internal Consistency Estimation. Br. J. Psychol. 2014, 105, 399–412. [Google Scholar] [CrossRef]
  36. Tavakol, M.; Dennick, R. Making Sense of Cronbach’s Alpha. Int. J. Med. Educ. 2011, 2, 53. [Google Scholar] [CrossRef]
  37. Sever, I. Importance-Performance Analysis: A Valid Management Tool? Tour. Manag. 2015, 48, 43–53. [Google Scholar] [CrossRef]
  38. Feng, M.; Mangan, J.; Wong, C.; Xu, M.; Lalwani, C. Investigating the Different Approaches to Importance–Performance Analysis. Serv. Ind. J. 2014, 34, 1021–1041. [Google Scholar] [CrossRef]
  39. United Nations General Assembly. Transforming Our World: The 2030 Agenda for Sustainable Development; United Nations: New York, NY, USA, 2015. [Google Scholar]
  40. United Nations Department of Economic and Social Affairs (UN DESA) Goal 11: Make Cities and Human Settlements Inclusive, Safe, Resilient and Sustainable. Available online: https://sdgs.un.org/goals/goal11 (accessed on 19 September 2025).
  41. United Nations Human Settlements Programme (UN-Habitat). SDG Indicator 11.7.1 Training Module: Public Space; UN-Habitat: Nairobi, Kenya, 2019. [Google Scholar]
  42. Hallegatte, S.; Rentschler, J.; Rozenberg, J. Lifelines: The Resilient Infrastructure Opportunity; Sustainable Infrastructure Series; World Bank: Washington, DC, USA, 2019. [Google Scholar]
  43. Cervero, R.; Kockelman, K. Travel Demand and the 3Ds: Density, Diversity, and Design. Transp. Res. Part Transp. Environ. 1997, 2, 199–219. [Google Scholar] [CrossRef]
  44. Ewing, R.; Cervero, R. Travel and the Built Environment: A Meta-Analysis. J. Am. Plann. Assoc. 2010, 76, 265–294. [Google Scholar] [CrossRef]
  45. Pandyaswargo, A.H.; Kharisma, V.; Maghfiroh, M.F.N.; Siregar, T.H.; Onoda, H. Assessing Commuters’ Satisfaction with Public Transportation in Jakarta Smart City. Transp. Res. Procedia 2025, 84, 227–234. [Google Scholar] [CrossRef]
  46. Pucher, J.; Dill, J.; Handy, S. Infrastructure, Programs, and Policies to Increase Bicycling: An International Review. Prev. Med. 2010, 50, S106–S125. [Google Scholar] [CrossRef]
  47. Watkins, K.E.; Ferris, B.; Borning, A.; Rutherford, G.S.; Layton, D. Where Is My Bus? Impact of Mobile Real-Time Information on the Perceived and Actual Wait Time of Transit Riders. Transp. Res. Part Policy Pract. 2011, 45, 839–848. [Google Scholar] [CrossRef]
  48. Shoup, D.C. Cruising for Parking. Transp. Policy 2006, 13, 479–486. [Google Scholar] [CrossRef]
  49. Giles-Corti, B.; Vernez-Moudon, A.; Reis, R.; Turrell, G.; Dannenberg, A.L.; Badland, H.; Foster, S.; Lowe, M.; Sallis, J.F.; Stevenson, M. City Planning and Population Health: A Global Challenge. Lancet 2016, 388, 2912–2924. [Google Scholar] [CrossRef]
  50. Puust, R.; Kapelan, Z.; Savic, D.A.; Koppel, T. A Review of Methods for Leakage Management in Pipe Networks. Urban Water J. 2010, 7, 25–45. [Google Scholar] [CrossRef]
  51. Stoianov, I.; Nachman, L.; Madden, S.; Tokmouline, T.; Csail, M. PIPENET: A Wireless Sensor Network for Pipeline Monitoring. In Proceedings of the 2007 6th International Symposium on Information Processing in Sensor Networks, Cambridge, MA, USA, 25–27 April 2007; pp. 264–273. [Google Scholar]
  52. Fang, X.; Misra, S.; Xue, G.; Yang, D. Smart Grid—The New and Improved Power Grid: A Survey. IEEE Commun. Surv. Tutor. 2012, 14, 944–980. [Google Scholar] [CrossRef]
  53. Gungor, V.C.; Sahin, D.; Kocak, T.; Ergut, S.; Buccella, C.; Cecati, C.; Hancke, G.P. Smart Grid Technologies: Communication Technologies and Standards. IEEE Trans. Ind. Inform. 2011, 7, 529–539. [Google Scholar] [CrossRef]
  54. Birkinshaw, M.; Grieser, A.; Tan, J. How Does Community-Managed Infrastructure Scale up from Rural to Urban? An Example of Co-Production in Community Water Projects in Northern Pakistan. Environ. Urban. 2021, 33, 496–518. [Google Scholar] [CrossRef]
  55. Eckart, K.; McPhee, Z.; Bolisetti, T. Performance and Implementation of Low Impact Development–A Review. Sci. Total Environ. 2017, 607, 413–432. [Google Scholar] [CrossRef]
  56. Fletcher, T.D.; Shuster, W.; Hunt, W.F.; Ashley, R.; Butler, D.; Arthur, S.; Trowsdale, S.; Barraud, S.; Semadeni-Davies, A.; Bertrand-Krajewski, J.-L.; et al. SUDS, LID, BMPs, WSUD and More—The Evolution and Application of Terminology Surrounding Urban Drainage. Urban Water J. 2015, 12, 525–542. [Google Scholar] [CrossRef]
  57. Xia, J.; Zhang, Y.; Xiong, L.; He, S.; Wang, L.; Yu, Z. Opportunities and Challenges of the Sponge City Construction Related to Urban Water Issues in China. Sci. China Earth Sci. 2017, 60, 652–658. [Google Scholar] [CrossRef]
  58. Wilson, D.C.; Velis, C.; Cheeseman, C. Role of Informal Sector Recycling in Waste Management in Developing Countries. Habitat Int. 2006, 30, 797–808. [Google Scholar] [CrossRef]
  59. Zhang, D.Q.; Tan, S.K.; Gersberg, R.M. Municipal Solid Waste Management in China: Status, Problems and Challenges. J. Environ. Manag. 2010, 91, 1623–1633. [Google Scholar] [CrossRef] [PubMed]
  60. Tu, J.; Wang, C.; Wu, S. The Internet Hospital: An Emerging Innovation in China. Lancet Glob. Health 2015, 3, e445–e446. [Google Scholar] [CrossRef]
  61. Guo, L.; Kong, F.; Zhou, L.; Xiang, R.; Zhang, K.; Su, Y.; Zheng, Q.; Li, R. Three-Medical Linkage in China: Trend Evolution and Obstacle Identification. BMC Health Serv. Res. 2025, 25, 488. [Google Scholar] [CrossRef]
  62. Feng, C.; Weng, F.; Zhenyuan, L. Evaluation Index System for Value Co-Creation in Integrated Care within the Context of Digital Transformation. Sci. Rep. 2025, 15, 18118. [Google Scholar] [CrossRef]
  63. Carmona, M. Principles for Public Space Design, Planning to Do Better. Urban Des. Int. 2019, 24, 47–59. [Google Scholar] [CrossRef]
  64. Roever, S. Informal Economy Monitoring Study Sector Report: Street Vendors; WIEGO: Cambridge, MA, USA, 2014; Volume 1, pp. 1–65. [Google Scholar]
  65. Sallis, J.F.; Cerin, E.; Conway, T.L.; Adams, M.A.; Frank, L.D.; Pratt, M.; Salvo, D.; Schipperijn, J.; Smith, G.; Cain, K.L. Physical Activity in Relation to Urban Environments in 14 Cities Worldwide: A Cross-Sectional Study. Lancet 2016, 387, 2207–2217. [Google Scholar] [CrossRef]
  66. Anguluri, R.; Narayanan, P. Role of Green Space in Urban Planning: Outlook towards Smart Cities. Urban For. Urban Green. 2017, 25, 58–65. [Google Scholar] [CrossRef]
  67. Twohig-Bennett, C.; Jones, A. The Health Benefits of the Great Outdoors: A Systematic Review and Meta-Analysis of Greenspace Exposure and Health Outcomes. Environ. Res. 2018, 166, 628–637. [Google Scholar] [CrossRef] [PubMed]
Disclaimer/Publisher’s Note: The statements, opinions and data contained in all publications are solely those of the individual author(s) and contributor(s) and not of MDPI and/or the editor(s). MDPI and/or the editor(s) disclaim responsibility for any injury to people or property resulting from any ideas, methods, instructions or products referred to in the content.

Article Metrics

Citations

Article Access Statistics

Multiple requests from the same IP address are counted as one view.