Abstract
In many newly industrialized countries, the booming industrial parks have played a crucial role in propelling urban growth, promoting socioeconomic growth, and causing environmental deterioration. This study investigated land use/land cover (LULC) transformation and thermal effects of the “104 Industrial Blocks” in Shanghai, which have been the key industrial development zones since 1995. A total of 64 industrial clusters were identified by merging industrial parks with close spatial linkages. Subsequently, using a data-driven framework that contains data generated from Landsat series C2L2 images and auxiliary datasets, we analyzed land development patterns and associated anomalous thermal response across three scales: macro-level pattern, meso-level ring, and local scale. The results indicate that industrial growth in the downtown shifted from incremental expansion to stock renewal. Suburban areas became the main destinations for industrial relocation. Consequently, the thermal environment underwent a remarkable reconfiguration. Urban heat island (UHI) intensity declined in the downtown, while industrial clusters on the urban periphery emerged as newly emerging heat sources. Around 75% of suburban industrial parks have shifted from low- to medium/high-density patterns, creating new industrial heat islands. In contrast, only 20.31% of suburban industrial parks have shifted from low- to medium-density development without resulting in new urban heat islands.
1. Introduction
Since the industrial revolution, global urbanization has attracted large-scale population migration from rural to urban areas. The proportion of the world’s urban population rose rapidly from 25% in 1950 to 56% in 2020 and is projected to exceed 70% by 2070 [1]. Urbanization has triggered a series of ecological and environmental crises. On the one hand, urbanization has profoundly altered land use structures. This is characterised by the dominance of impervious surfaces associated with industrial production, transportation, commercial, and residential uses. As a result, natural and semi-natural surfaces (e.g., green spaces and water bodies) have declined. Impervious surfaces such as buildings and hardtop pavements are characterized by low heat capacity, low albedo, and high thermal conductivity [2]. In addition, the dense concentration of high-rise buildings increases surface roughness, while irregular building configurations obstruct urban ventilation corridors. These factors substantially alter surface thermal inertia, energy flux distribution, energy exchange mechanisms, atmospheric circulation, and precipitation patterns [3,4]. Consequently, cities experience higher temperatures than surrounding suburban areas, a thermal anomaly known as the urban heat island (UHI) effect [5,6]. On the other hand, greenhouse gas emissions associated with urbanization exacerbate global climate change. Heatwaves occurring worldwide exert negative impacts on public health, economic development, and ecosystems [7,8,9]. As a result, the combined impact of UHI and climate change is becoming increasingly apparent [10,11,12]. This dynamic severely undermines urban adaptive capacity to climate change, particularly in megacities such as Shanghai. Therefore, enhancing urban climate resilience has become an urgent task [13,14,15].
As spatial carriers of urban growth, industrial parks reshape urban land use patterns through their expansion and transformation. With the acceleration of industrialization, increasing attention has been paid to the thermal anomalies induced by industrial parks [16,17]. Highly impervious surface structures alter regional thermal radiation balance and energy distribution, thereby exacerbating the vulnerability of urban ecosystems [18,19,20,21,22,23]. Existing studies have primarily focused on the thermal environmental effects of specific industry types or industrial cities. For example, Meng [20] found that land surface temperature (LST) in large steel parks was significantly higher than in surrounding areas. A pronounced centre-to-periphery decreasing pattern was identified, with the spring and summer seasons and anthropogenic heat emissions emerging as the primary influencing factors. Liu [24], using machine learning methods, proposed that optimizing plant morphology and production processes could mitigate extreme heat islands. This provided evidence for improving the thermal environment of industrial cities. Mao [25] emphasized that the scale and spatial configuration of different types of industrial and mining land exert differentiated impacts on LST. Industrial activities have been confirmed as important drivers of local urban heat islands. Research indicates that the anthropogenic heat emissions account for more than 30% of the total urban heat flux [26].
In this study, we selected Greater Shanghai, one of leading mega cities in China, as a typical case to exemplify the relationship between industrial restructuring and the associated industrial heat island effect. Shanghai had been the biggest industrial city in China over the past four decades. The industrial heat island effect had been a tangled environmental issue. It contributed to the expansion of the urban land influenced by the UHI effect, particularly during the rural–urban transformation accelerated by suburban industrialization [27,28,29]. Since the 1990s, with economic restructuring and the implementation of land renewal policies, a large proportion of traditional industrial land in Shanghai’s central districts has been gradually transformed into commercial, residential, and public service functions. Meanwhile, suburban areas absorbed relocated industries, giving rise to large-scale industrial parks and bases such as Lingang, Jiading, and Songjiang. The strategies of “retreating from secondary to tertiary industries” and “industrial agglomeration within designated parks” not only promoted more intensive economic development but also significantly altered the characteristics of the urban underlying surface. These changes collectively influenced surface radiation balance and local thermal circulation, leading to pronounced spatial differentiation of the UHI effect [29,30]. Several studies have been conducted on the industrial UHI effect in Shanghai, utilizing satellite thermal remote sensing data. These studies focus on cause-and-effect relationships between socioeconomic factors (e.g., population density), land development metrics (e.g., impervious surface), and biophysical indices (e.g., the Normalized Difference Vegetation Index) [31,32,33,34]. However, there is a lack of comprehensive research focused on how intensive industrial park development impacts the thermal environment of these industrial parks and their surrounding areas—such as cropland, villages, and infrastructure—with a specific emphasis on quantitative analysis. In particular, empirical research based on long-term, multi-source remote sensing data and spatial statistical methods at the scale of industrial parcels is still lacking in addressing the land use–thermal effect nexus. A critical gap remains unanswered: how does the thermal response evolve as low-density, peri-urban industrial parks morph into medium- or high-density clusters under polycentric planning policies? The question of how industrial development patterns influence LST has thus become a prominent issue in the field of urban climatology, with implications for urban adaptation to climate change.
This study aims to construct a data-driven analytical framework to systematically compare the relationships between industrial development patterns and thermal environmental responses in Shanghai between 1995 and 2022. The research focuses on three main aspects: (1) analyzing the characteristics of multi-scale land use structure changes; (2) revealing the intrinsic relationship between land use patterns and thermal environmental responses in Shanghai; and (3) investigating how industrial development modes of parks and clusters contribute to variations in LST. Through spatial and statistical analyses, this study quantitatively uncovers the mechanisms by which the thermal environment of industrial parks responds to built environment indicators. This provides scientific evidence in support of the sustainable development and management of industrial parks, the mitigation of the UHI effect, and the enhancement of urban climate resilience in Shanghai.
2. Materials and Methods
2.1. Study Area
2.1.1. Basic Information
Shanghai (120°51′–122°12′ E, 30°40′–31°53′ N), located on the eastern edge of the Yangtze River Delta, is a world-class metropolis characterized by economic prosperity and vigorous industrial development. The city has a north subtropical monsoon climate, with four distinct seasons, abundant sunshine, and generally mild and humid conditions [35]. Benefiting from its well-developed industrial system and extensive employment opportunities, Shanghai has attracted a large influx of population. Between 1995 and 2022, the permanent resident population increased from 14.14 million to 24.76 million. Meanwhile, as one of China’s major industrial hubs, Shanghai reported an industrial output above the designated scale of 3939.96 billion RMB in 2023, ranking among the highest nationwide [36].
This study focuses on the “104 Industrial Blocks”, which are the key industrial development zones fostered by local governments to promote intensive land use since the latest industrial restructuring initiated in 1995. These industrial blocks concentrate on six strategic sectors: electronic information, life and health, automotive, advanced equipment, new materials, and fashion consumer goods. It is estimated that almost 80% of industrial parks fall within these categories [37].
2.1.2. Spatial Aggregation Rules and Buffers
For the purpose of systematic and concise analysis, several industrial parks with strong spatial agglomeration and industrial linkages were consolidated into industrial clusters (ICs). The criteria for generating ICs encompass the geographical characteristics of the industrial plot’s location, shared transport resources, industrial sector classification, and upstream and downstream industrial chain connections. Furthermore, buffer zones were delineated around each park boundary to capture the spatial extent of their developmental influence. The determination principle is based on the park’s area and the LULC of surrounding areas. Generally, large IPs/ICs located in a sparsely populated area may have more far-reaching impacts, while an industrial park situated in a densely built-up area is constrained by existing development. Ultimately, 104 industrial parks (including both core areas and buffer zones) were aggregated into 43 industrial parks (IPs) and 21 industrial clusters (ICs). The spatial distribution and customized coding of these parks are shown in Figure 1, with detailed information provided in Table A1.
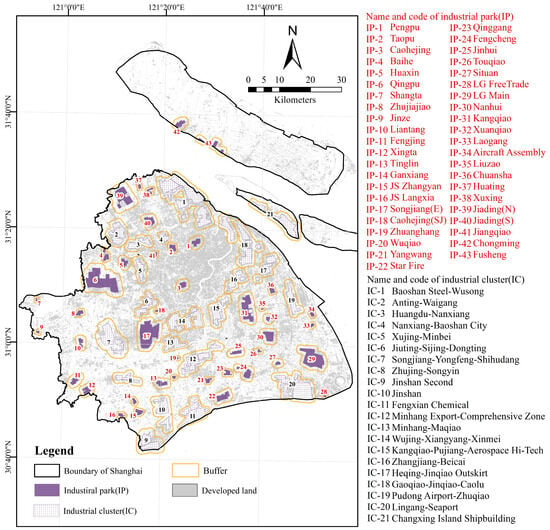
Figure 1.
Location of the study area showing the industrial parks (IPs) and industrial clusters (ICs), and their buffer zones. Note: In this figure, buffer zones vary with the distance from 500 m, 1000 m, to 1500 m, depending on the scale of the IP/IC core area and their influencing range on adjacent land development.
2.2. Data Sources
The primary dataset used in this study consists of Landsat Collection 2 Level 2 (C2L2) imagery from 1995 to 2022, which has undergone atmospheric correction. Images were preferentially selected based on temporal uniformity, low cloud coverage, high radiometric quality, and acquisition dates within June-September to capture the summer season.
In addition, several auxiliary datasets were employed, including commercial urban GIS thematic layers, open-source land use classification products, GF-1 WFV imagery, OpenStreetMap urban geographic layers, historical imagery from Tianditu and Google Earth, and Sentinel-2 imagery. Detailed descriptions of all datasets are provided in Table 1.

Table 1.
Description of data sets used for this study.
2.3. Methods
2.3.1. Data Processing
The general preprocessing workflow for remote sensing data typically includes radiometric calibration, atmospheric correction, projection transformation, image mosaicking, and clipping. They ensure the consistency and comparability of multi-source datasets [42]. The specific procedures can be selected based on the dataset specifications and the application context. In this study, all datasets were converted to the WGS 1984 geodetic coordinate system and projected using the UTM Zone 50N Universal Transverse Mercator projection [38].
2.3.2. Land Use/Land Cover Classification
Accurate acquisition of LULC data is essential for assessing urban growth and identifying the intrinsic relationships between LULC and UHI effects. Considering the characteristics of the study area, LULC in Shanghai was classified into four categories: developed land, vegetated land, water, and tidal land (Table 2). The maximum likelihood supervised classification (MLC) method determines the category of each pixel by extracting the spectral characteristics of known sample pixels [42]. MLC offers efficient information utilization, high classification accuracy, and good scalability. It is a mature classification approach available in most remote sensing software.

Table 2.
Description of the classification scheme used in this study.
The classification procedure is as follows. First, based on preprocessed remote sensing images, standard false-color composite images were generated using bands suitable for interpretation to fully represent surface features. Second, 100–120 random points per LULC category were selected through visual interpretation to construct representative training samples. Third, MLC was applied to generate LULC maps for five selected years, with an overall classification accuracy ranging between 79.71 and 81.92%. The error matrices, overall accuracy, user’s accuracy, and producer’s accuracy for the five-year LULC maps are provided in Table A2 and Table A3. It should be emphasized that, although the Kappa index is commonly used to evaluate classification accuracy, Pontius and Millones argued that this metric has significant limitations [43]. Therefore, this study did not employ the Kappa index. Moreover, we tried many times but were unable to achieve satisfactory accuracy with the MLC algorithm alone. Thus, the post-classification products were converted into editable polygons and then manually refined using auxiliary datasets. These datasets have two primary data sources, as outlined in Table 1: (1) high-resolution satellite imagery, including Sentinel-2 with a spatial resolution of 10 m and GF-1 WFV with a spatial resolution of 16 m, and (2) the commercial urban thematic layer of Shanghai (Table 1). In particular, we corrected numerous polygons that had been misclassified as tidal land by validating them against the reference datasets. Subsequently, the second accuracy assessment of these manually corrected products utilized a stratified random sampling method to ensure the spatial representativeness of the validation dataset. Sample points were strategically distributed to encompass all concentric urban zones within the study area, ranging from the urban core to suburban and exurban areas, as well as the surrounding regions of major IP/ICs. Specifically, 120–150 validation sample points were designated for each LULC category. This approach resulted in a total sample size of 520 to 600 points for each year. To ensure reliable validation, each sample point’s actual LULC category was verified using the above-mentioned auxiliary datasets. Each sample point’s true LULC category was confirmed through field verification or visual interpretation using the aforementioned high-resolution datasets. Finally, this process significantly improved the classification accuracy of the post-classification products. Overall, the five-year post-classification products achieved classification accuracies ranging from 92.3% to 95.6% (see Table A4 and Table A5).
2.3.3. Generation of Quality-Enhanced LST
As a key parameter for LST retrieval, the accurate estimation of land surface emissivity (LSE) is critical [44]. Common methods for estimating LSE can be categorized into two types: the Classification-Based Emissivity Method (CBEM) [45,46] and Pv-Based Emissivity Method (PBEM) [47,48]. CBEM assigns emissivity values according to predetermined land cover classes. However, it is impossible to effectively reflect the impact of seasonal variations, vegetation growth cycles, and transitional surface conditions (e.g., similarity between fallow land and bare soil). In contrast, PBEM can more accurately represent the dynamic variations in surface radiation, effectively addressing mixed-pixel issues [49,50].
Considering these factors, this study employed the NDVI-threshold-based improved method proposed by Qin [51] to estimate LSE. The specific formula is as follows:
where NDVI denotes the normalized difference vegetation index, while BandNIR and BandRed represent the atmospherically corrected surface reflectance values of the near-infrared and red bands, respectively. Pv refers to the fractional vegetation cover, and NDVImin and NDVImax correspond to the minimum and maximum NDVI values.
Based on the Pv range, the corresponding LSE (ε) was calculated for three surface categories: water bodies, natural surfaces, and urban areas (Table 3).

Table 3.
Vegetation cover (PV)-based LSE (ε) estimation results.
Based on the radiative transfer equation, given the land surface emissivity, atmospheric transmittance, downwelling atmospheric radiation, and upwelling atmospheric radiation, the blackbody radiance in the thermal infrared band, Bλ (Ts) can be derived.
Since real-time atmospheric profile data for the study area are unavailable, the atmospheric parameters in Equation (3) were obtained from the Landsat-5/7/8/9 C2 L2 parameter images. These were then divided by the scaling factor prior to application.
where Ts is the land surface radiometric temperature in Kelvin (K); Bλ(Ts) is the Planck blackbody radiance at temperature Ts (units: W·m−2·sr−1·µm−1); Lsensor,λ is the radiance measured by the thermal infrared band of each sensor, also in W·m−2·sr−1·µm−1; ελ is the land surface emissivity; τλ is the total atmospheric transmittance along the sensor path (dimensionless); L↑atm,λ denotes the upwelling atmospheric radiance (units: W·m−2·sr−1·µm−1); and L↓atm,λ is the downwelling atmospheric radiance (units: W·m−2·sr−1·µm−1).
After obtaining the Bλ(Ts) in the thermal infrared band, the land surface temperature based on Pv-Based Emissivity Method (LSTPBEM) was derived using the inverse function of Planck’s law, as shown in Equation (4). Finally, the LST was corrected according to actual conditions and location information, and outliers were removed to obtain the calibrated land surface temperature. All data processing was implemented in R (v4.5.0) (the corresponding code was available in the Supplementary Materials).
where K1 and K2 are the thermal conversion constants of the Landsat 5/7/8/9 thermal infrared bands, as provided in the image metadata files [38,39].
Additionally, the study also compared LSTPBEM with LSTC2, the latter being the Landsat-embedded surface temperature product. Interestingly, random point sampling indicated that LSTC2 values were generally higher than LSTPBEM. This is attributed to a global-scale LSE being employed by LSTC2. The complexity of urban areas can significantly affect the accuracy of fine-scale LST data. Therefore, LSTC2 was not suitable for studies in highly urbanized regions. Considering the limitations of LSTC2 and LSTCBEM, the subsequent analysis employed LSTPBEM. Correlation analysis between LSTPBEM, LSTCBEM, and LSTC2 was presented in Figure A1.
2.3.4. Construction of an Indicator System for Thermal Environment Drivers
The spatial heterogeneity of UHI effects in industrial parks arises from the synergistic interactions between land use changes and human activities [52,53]. To systematically assess land development of the IP/ICs on the thermal environment, an evaluation model was established based on land use indicators, socio-environmental metrics, spatial location attributes, and economic activity indicators (Table 4).

Table 4.
Summary of Thermal Environment Driver Indicators in the Study Area.
2.3.5. Statistical Analysis
Prior to examining the relationship between built environment predictor variables and LST response variables, exploratory data analysis (EDA) was conducted. First, excluding two categorical variables—Distance and Industrial Type, five built environment indicators (independent variables) and LST were tested for normality. The results indicated that the continuous variables generally exhibited skewed distributions. For this reason, Spearman’s rank correlation is used to analyze the correlation between seven dependent variables and LST.
Second, hierarchical cluster analysis (HCA) was employed to perform Q-type clustering of the IPs/ICs as whole units. Complete linkage, average linkage, and centroid linkage methods were applied, with Euclidean distance used as the metric for comparison [54]. To validate the robustness of our HCA results and reduce subjectivity in cluster number selection, we added Silhouette Coefficients (assessing cohesion/separation) and Gap Statistics (compared to null distributions) using the library (cluster) and library (factoextra) in R (v4.5.0) across all five study years. As shown in Table 5, for all years, Silhouette coefficients exceeded 0.6 (peaked 0.72 in 2015), indicating strong within-cluster similarity and clear between-cluster differentiation for 6 IP/ICs categories. The Gap Statistic peaked at k = 6 clusters for all study years (e.g., Gap = 0.89 in 2022), providing statistical justification for our choice of six IP/IC types—rejecting alternative cluster numbers (k = 4 or k = 8) where gaps declined by ≥20%.

Table 5.
Objective Cluster Validity Metrics for IP/IC Typology (1995–2022).
Moreover, to address transparency in cluster formation, we have included complete dendrograms for all three HCA linkage methods (complete, average, centroid) and explicitly documented our cutting criteria (Table 6). The Cutting criteria (triangulated for objectivity) briefly include: 1) Elbow method: sharp slowdown in dissimilarity increase (e.g., 2015: distance = 9.76, k = 6); 2) Gap Statistic: peaks at k = 6 for all years, rejecting over-clustering (k = 8, Gap decline >20%) or under-clustering (k = 4, Gap decline >15%); and 3) Domain relevance: aligns with Shanghai’s 6 strategic industrial sectors and observed LULC transitions from low- to high-density development. These additions are presented in Appendix A Figure A2, Figure A3, Figure A4, Figure A5, Figure A6, Figure A7, Figure A8, Figure A9, Figure A10, Figure A11, Figure A12, Figure A13, Figure A14, Figure A15 and Figure A16. For example, the 2015 complete-linkage dendrogram (Figure A11) shows a clear “elbow” at a distance of 9.76, where merging clusters further would abruptly reduce separation between high-density (Type I) and medium-high-density (Type II) IPs/ICs. This elbow aligns with the Gap Statistic’s peak at k = 6, confirming our cut-off choice. However, given the differences in clustering principles among these methods, some variations in the dendrograms were inevitable. Therefore, manual override for the HCA categories is necessary. Summary of manual overrides and their rationale were listed in Table 6. For inconsistency identification, we cross-compared cluster assignments from the three HCA linkage methods. An IP/IC was flagged if it was assigned to different clusters by ≥2 methods (e.g., IC-12-3: average linkage = Type III, centroid linkage = Type IV in 2007). Subsequently, for ground-truthing, the flagged IP/ICs were validated using high-resolution LULC data and satellite images (Table 2) to check for mismatches between statistical clustering and actual land use (e.g., a “low-density” cluster assignment for an IP with 60% built-up area). Additionally, local industrial sector data [37] (Shanghai Statistical Bureau, 2022) was used to ensure alignment with functional type (e.g., a “fashion goods” IP incorrectly clustered with “heavy equipment” IPs).

Table 6.
Summary of manual override for the HCA categories (1995–2022).
Third, the Kruskal–Wallis (K-W) test was adopted to compare the variations in LSTs between the HCA categories in response to changes in land development patterns of the IPs/ICs. Specifically, the K-W test, as a non-parametric statistical method, evaluates whether the medians of multiple independent sample groups differ significantly. This method ranks the observations and computes the sum of ranks to assess differences among groups, using the H statistic for significance testing (Equations (5) and (6)).
where rij represents the rank of the j-th observation in the group, N denotes the total number of observations across all groups, k is the number of groups, Ri is the sum of ranks for the i group, and ni is the sample size of the i-th group.
Finally, for groups exhibiting significant differences, Dunn’s post hoc test was performed for pairwise comparisons (Equation (7)).
where Ri and Rj denote the sums of ranks for the i-th and j-th groups, respectively; N represents the total sample size across all groups, and ni and nj are the sample sizes of the i-th and j-th groups, respectively.
The Kruskal–Wallis test and Dunn multiple comparisons were conducted using library (agricolae) and library (dunn.test) in the R statistical software (version 4.5.0) [55].
3. Results
3.1. Analysis of Land Use Pattern Changes
The land use transition matrix method was employed to examine land inflows and outflows, revealing the dynamics of land use type changes in Shanghai (Figure 2). At the macro-urban scale, Shanghai’s urbanization since 1995 can be divided into four distinct stages (Table 7): Stage-1/S1, a period of slow urbanization (1995–2001); Stage-2/S2, a phase of rapid urbanization (2001–2007); Stage-3/S3, a stage of explosive growth (2007–2015); and Stage-4/S4, a period of decelerated growth (2015–2022).
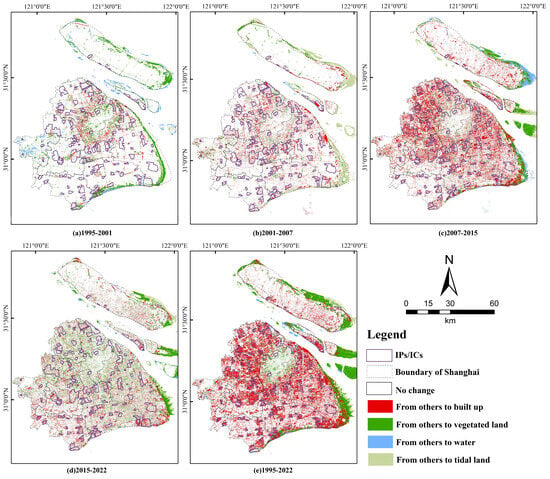
Figure 2.
Land use dynamics in Shanghai across the study period.

Table 7.
Characteristics of the Four Urbanization Development Stages in Shanghai.
Table 8 and Figure 3 present the changes in the area and proportion of developed land at the concentric zone scale from 1995 to 2022. Within IPs/ICs, the middle-ring area consistently serves as the core zone for industrial land concentration, with its proportion rising from 40.07% in 1995 to 60.06% in 2022. It has transitioned from a traditional industrial agglomeration area to high-tech-oriented industrial parks. These parks are dominated by industries such as electronics, information technology, and life sciences, including IP-18, IC-16-1, IC-16-2, IC-18-1, and IC-18-4. The outer-ring area has experienced the most significant expansion of industrial land, with the area increasing from 5032.35 ha to 23,041.26 ha and the proportion rising sharply from 11.47% to 52.51%. The data reflects the trend of industrial suburbanization. Key industries developed in this zone include life sciences, electronics and information, and high-end equipment manufacturing, exemplified by IC-5, IC-17, and IC-1. Industrial land growth in suburban and exurban areas has been relatively slower, reaching proportions of 36.15% and 29.85% in 2022. It indicates a gradual diffusion of industrial activity toward the urban periphery. Specifically, although suburban industrialization began later than in the outer ring, favorable policies and transportation advantages have allowed it to emerge as a new industrial growth zone. It contains the maximum industrial parks listed in the “104 Blocks,” which focus on equipment manufacturing and advanced materials industries, such as IC-2, IC-21, and IC-19. Industrial development in exurban areas has been relatively slow due to limitations in infrastructure and location. Nevertheless, abundant land resources and low costs have positioned these areas as strategic sites for heavy industries such as advanced equipment manufacturing and materials, including IC-9-1, IC-9-2, IC-9-3, IC-10-1, IC-10-2, IC-11-2, IC-11-3, and IC-20.

Table 8.
Dynamics of developed land within the middle ring, outer ring, suburb, and exurban areas in 1995–2022.
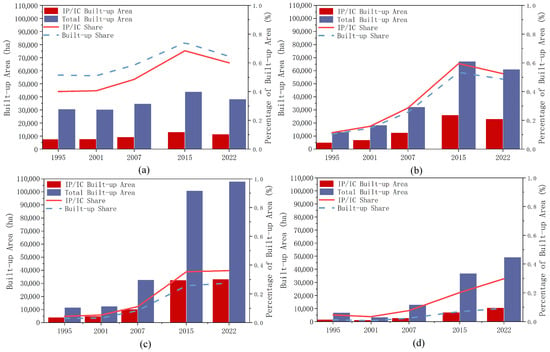
Figure 3.
Changes in Developed Land areas across different urban rings during 1995–2022. (a) Middle Ring; (b) Outer Ring; (c) Suburban Area; (d) Exurban area. (n = 64).
Overall, urbanization in Shanghai is primarily driven by the expansion of developed land, particularly the development of the IPs/ICs located in different urban rings. Figure 3 shows that industrial land closely aligns with urban developed areas, indicating a model of integrated industry and city development. As indicated, each urban ring has a specific role in this process. The urban core only keeps two key IPs/ICs. The Middle Ring area features intensive development of the IPs/ICs, while the Outer Ring acts as a hub for industries that are relocating from the Inner Ring. Meanwhile, suburban and exurban zones have become key areas for industrial growth.
3.2. Overall Patterns of Land Use/Land Cover Change and LST
Figure 4 shows that over the past three decades, the distribution pattern of the Urban Heat Island (UHI) effect in Shanghai has exhibited significant changes, corresponding to the land use and land cover (LULC) changes presented in Figure 3. During the S1 period, the UHI effect was predominantly concentrated in the urban core, while the suburbs and exurban areas experienced relatively lower levels of UHI. In the S2 period, the UHI influence remained primarily in the urban core but began to expand to areas about 6 to 15 km from the city center. By the S3 period, the UHI effect had intensified, reaching a much wider area that included not only the urban core but also former peri-urban and rural regions 15 to 45 km from the city center, which included dense industrial zones. In the S4 period, the overall spread of areas impacted by the UHI effect significantly increased compared to the S3 period. However, areas located 25 to 45 km from the urban center, which contain numerous industrial clusters, saw a substantial increase in the UHI effect compared to previous years, emerging as the most pronounced newly UHI hotspots.
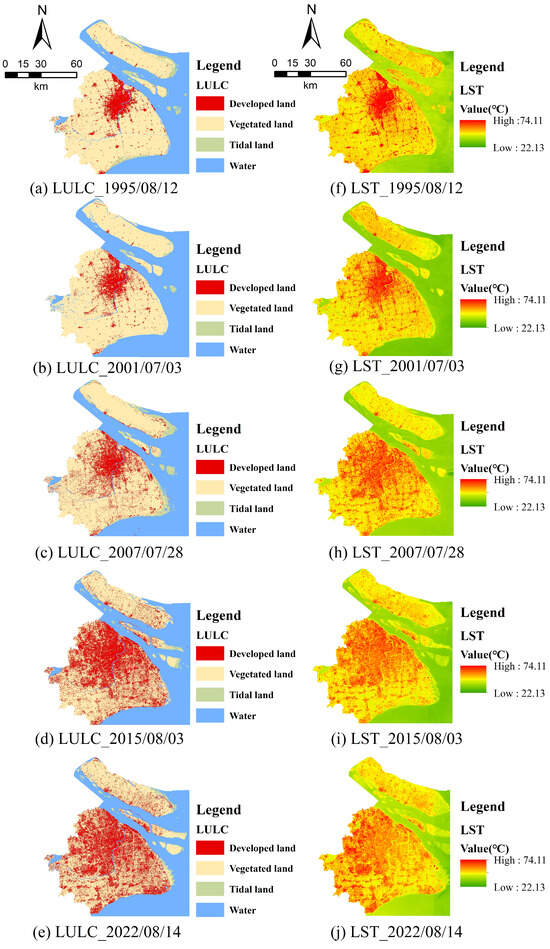
Figure 4.
Overall patterns of annual LULC and LSTs in the study area. Note: (a–e) showing LULC maps from 1995 to 2022; (f–j) showing annual daytime LST maps of from 1995 to 2022.
3.3. Analysis of the Relationship Between IPs/ICs Development Patterns and LST
Descriptive statistics of the IPs/ICs industrial pattern categories are provided in Table 9. From highest to lowest, they are classified as: high-density unbalanced development industrial areas (I), medium-high-density balanced development industrial areas (II), medium-density development industrial areas (III), moderately developed industrial areas (IV), medium-low-density development industrial areas (V), and low-density development industrial areas (VI).

Table 9.
Categorization and characteristics of IP/IC development patterns.
Table 10 illustrates the correlation between five built environment factors and mean LSTs across the study period. As seen, there generally exist positively significant correlations among IC, PD, and RD as well as these three factors between the LST. These findings indicate that the expansion of intensive IP/ICs), along with their coupled population growth and road networks, acts as a dominant positive feedback mechanism at the fine scale, substantially elevating LST and exacerbating industrial heat island effects. In contrast, there exists a negatively significant correlation between VC, IC, PD, and RD as well as the LST. This result highlights that VC plays a key role in negatively feedbacking on the fine-scale these three factors. There also exists the overall negatively significant correlation between VC and WC though at the earlier stage they were positively correlated. Moreover, Regarding WC, its correlation with LST is statistically insignificant, which can be attributed to its limited areal proportion within the industrial landscape. Such a negligible share renders water bodies ineffective in modulating the fine-scale thermal regime, thereby having minimal influence on industrial heat island dynamics.

Table 10.
Spearman’s rank correlation coefficients between five built environment factors and mean LSTs across the study period.
Table 11 presents the results of the Kruskal–Wallis (K-W) and Dunn tests for LSTs, confirming a statistically significant difference among IP/IC categories across different land development patterns. Together with Table 9, Figure 5 illustrates the temporal evolution of six categories of IPs/ICs from 1995 to 2022 in terms of their distribution and associated LSTs. The results reveal a clear upward trend in LST across all categories. Among them, Type I consistently exhibited the highest LST values, with an increase of nearly 9 °C, rising from 42.49 ± 1.47 °C in 1995 to 50.26 ± 2.33 °C in 2022. In contrast, during the early stage, the majority of IPs/ICs were characterized by low-density developments in suburban and exurban areas (Types V and VI), where LST levels were significantly lower than those of Type I. However, with the advancement of urbanization and industrialization, these parks gradually transformed into medium- and high-intensity developments. By around 2015, they had completely disappeared.

Table 11.
Results of Kruskal–Wallis (K-W) test and Dunn test for LSTs (℃) among IP/IC categories.
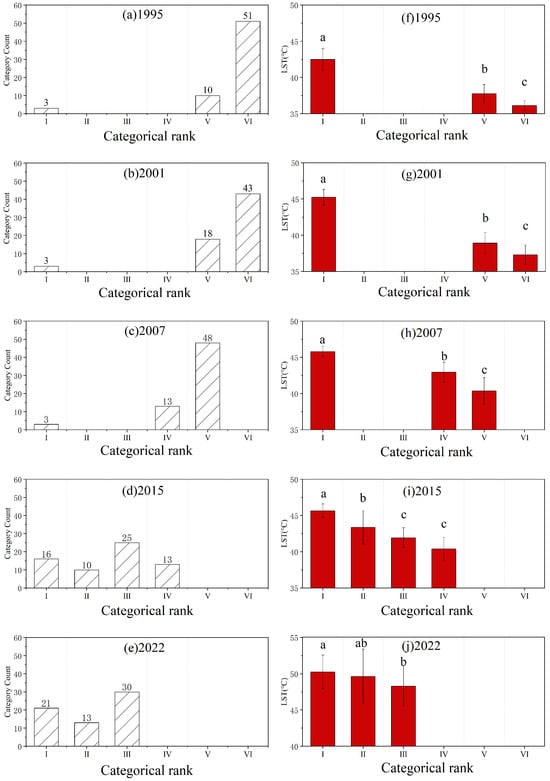
Figure 5.
Temporal Coupling of development patterns of IPs/ICs and LST in Shanghai (1995–2022). (a–e) Spatiotemporal evolution of development types; (f–j) Corresponding mean summer LST patterns.
Specifically, IPs/ICs were still dominated by Types V and VI from 1995 to 2001. The mean LSTs of these types were significantly lower than those of Type I (p < 0.05), reflecting pronounced thermal disparities. By 2007, Type VI had almost vanished, and Type IV emerged. Type IV LST values fell between those of Types I and V, forming a clear gradient of thermal effects with increasing development intensity. In 2015, the number of Type II and III increased remarkedly, while Type V disappeared. The mean LSTs followed the order I > II > III > IV, with statistically significant differences. It suggested that medium- and high-intensity IPs/ICs had become major new sources of UHI. By 2022, IPs/ICs typology had further consolidated, comprising only Types I–III. Among these, Type III are the most prevalent, indicating continued development in near- and mid-suburban areas. Notably, the difference in LST between Type I (50.26 °C) and Type II (49.63 °C) was no longer statistically significant (p > 0.05). This result indicated that, under high-intensity development conditions, thermal effects tend to saturate. Nevertheless, Type III still maintained relatively lower LST levels (48.29 °C).
Overall, the findings demonstrate a significant positive association between the development intensity of IPs/ICs and LST. Over time, the thermal disparities between high-density and medium–high-density parks have become less pronounced.
4. Discussion
4.1. Impact of Industrial Suburbanization on LULC and UHI
Based on the sequence analysis of changes in LULC and LSTs addressed in Section 3.1 and Section 3.2, Shanghai’s urbanization exhibits four distinct developmental stages. This phased evolution aligns with the trajectories of many global megacities [55]. Yet Shanghai is distinguished by the high synchronicity of its industrialization and urbanization. Unlike early-developed cities such as Tokyo and New York, Shanghai experienced more rapid urban expansion. It completed the transition from a monocentric to a polycentric urban structure within just three decades [56,57].
From a spatial differentiation perspective, Shanghai displays a unique concentric development pattern characterized by central densification, outer-ring absorption, suburban extension, and peri-urban constraint. Industrial suburbanization has gradually shifted land development from the urban core to peri-urban areas. Specifically, the scarcity of urban land has prompted industrial upgrading and functional replacement in the core. Meanwhile, government-led industrial park planning has guided the outward relocation of manufacturing. Notably, the nearly tenfold increase in suburban built-up area highlights the pivotal role of industrial land expansion in Shanghai’s urban spatial restructuring.
Changes in LULC have directly shaped the spatial patterns of industrial UHIs. During the early stages (S1 and S2), the UHI effect was concentrated in the urban core, forming a monocentric pattern. This phenomenon resembles the initial thermal environment observed in other Chinese megacities, such as Beijing [58]. By S3 and S4, the emergence of new thermal cores around IPs/ICs led to a polycentric, dispersed industrial UHI pattern. This finding is consistent with previous studies, which demonstrated that industrial parks act as significant heat sources due to their high impervious surface coverage and high energy consumption [59,60].
4.2. IPs/ICs Development Patterns and Industrial UHIs
In this study, a multidimensional evaluation framework was used to classify IPs/ICs into six types, offering a novel perspective on the mechanisms underlying thermal response. The results indicate that the thermal effects of industrial parks vary significantly across types. For instance, Type I parks consistently exhibit the highest LST, averaging 6.36–7.94 °C higher than low-density Type VI parks. This disparity is primarily attributable to three factors: first, high-density development substantially reduces vegetation cover; second, increased industrial building density decreases the sky view factor, impeding longwave radiation cooling; and third, the large amount of anthropogenic heat emitted during industrial operations directly intensifies local warming.
It is noteworthy that LST has increased across all industrial development patterns in line with the global warming trend. However, the temperature differences among different park types have gradually narrowed. Notably, after 2015, the LST gap between the Categories I, II, and III IP/ICs decreased significantly. By 2022, the LST difference between I and II parks had reduced compared with earlier periods and was no longer statistically significant (p > 0.05). This trend is likely driven by several factors. On the one hand, industrial policies have required certain high-density industrial parks to reduce thermal emissions through technological upgrades. On the other hand, eco-industrial parks have improved local thermal environments by increasing the share of green spaces within them. Our findings are consistent with studies conducted in Shenzhen and Suzhou, which indicated that rational park planning and management can effectively mitigate industrial UHI effects [61].
At the temporal scale, the evolutionary trajectory of IPs/ICs types clearly reflects the process of industrial structural transformation. Shanghai has gradually shifted from labor-intensive manufacturing toward high-tech industries. However, this transformation has also introduced new environmental challenges: although the environmental pressure per unit area of output has declined, the thermal stress associated with land-intensive development continues to accumulate. The transition from predominantly low-density parks (VI) in the 1990s to a mixed composition dominated by medium- to high-density types (I-III) by 2022. Nevertheless, this trend highlights the trade-off between economic growth and environmental quality, as intensified land use exacerbates localized warming.
Here we tackle these questions for Shanghai, which is arguably one of the world’s fastest and largest laboratories of synchronized industrial and urban transition. By integrating 27 years of Landsat thermal imagery with a self-constructed, industrial-parcel database (104 blocks, 64 clusters), we provide a data-driven, multi-scalar dissection of how successive “retreat-from-core” policies and targeted park-upgrading programs have shifted the locus and intensity of industrial heat islands. The study’s central contribution is therefore not another UHI inventory, but a mechanistic account of how industrial restructuring—via land-use intensification, morphological change, and sectoral recomposition—re-wires the thermal circuitry of a mega-city.
4.3. Implications for Mitigating Industrial UHI Effects
The pronounced UHI patterns shifting from the urban core to the peri-urban area indicate that green renewal and infrastructure upgrades are beneficial for UHI mitigation in the urban core. Our findings revealed that the unbalanced land use structure, particularly the competitive land use patterns driven by physical and socioeconomic factors. Such competitive land use patterns result in dominant built environment factors, e.g., the considerably higher BAF, RD, and PD, for intensive growth of the IP/ICs, but the absence of green spaces and green-blue spaces (“green spaces plus blue corridors”). Besides, the overwhelming share of impervious surfaces—ranging from warehouses, workshops, and parking lots to hardtop pavements—stores solar heating, re-emits it, raises LSTs, and therefore causes surface warming. In the sense of thermal physical processes and consequences, several countermeasures should be considered as follows:
(1) Rationally improving the share of green spaces and green-blue spaces in the industrial landscape. Currently, in most IP/ICs, impervious surfaces occupy approximately 80% or more of the land use structure. It is impossible to change these unfavorable land-use patterns to increase the share of green and blue spaces. Thus, planar and vertical greening, such as green walls/curtains, vertical facades, and green roofs, should be practical options for shielding buildings from direct sunlight and increasing surface evapotranspiration rates [62]. Additionally, creating the water scape (e.g., ponds and creeks) and green spaces via sound ecological design. For instance, strengthening the vertical green volume, featuring a dense tree canopy, should provide better cooling potential than shrubs and turf. Furthermore, industrial parks are encouraged to install rooftop photovoltaic systems to provide electricity for the irrigation of vertical and rooftop greening during hot seasons [63].
(2) Optimizing land use structure and fine-scale building morphology. Notably, the preferred 1–2 storied light-steel roofs result in a dense building layout within intensive IP/ICs. We suggest that, except for the IP/ICs of heavy equipment manufacturers, other IP/ICs consider building 3–5-storey or higher buildings for factories, warehousing, and transportation facilities, expanding the building spacing. On the one hand, increasing the spacing between buildings can improve ventilation corridors, enhancing the microclimate and thermal comfort for occupants [64]. On the other hand, such an optimized building layout can free up more ecological land for green spaces and blue-green areas.
4.4. Limitations and Remarks
This study has several limitations. First, Landsat satellite imagery is subject to cloud cover and atmospheric pollution, limiting the number of high-quality images. Although five high-quality summer images were selected, it remains challenging to comprehensively capture the long-term dynamic impacts of industrial land use changes on the thermal environment. Second, due to the imagery’s 30-m spatial resolution and daytime imaging mode, fine-scale functional zoning within industrial parks could not be fully identified. Additionally, the industrial UHIs can only be detected via the upwelling thermal band signals within the instantaneous field of view (IFOV). Consequently, there are limitations in attributing thermal environmental variability at the local scale solely during daytime. Third, the role of socio-economic factors in shaping the land development patterns of the IP/ICs and their associated industrial UHIs was not adequately considered. For example, in peri-urban and exurban areas where land prices are lower, IP/ICs tend to expand horizontally, replacing large swaths of vegetated land and creating extensive, low-intensity industrial UHIs. In contrast, in high-land-value urban fringes, socioeconomic pressures drive vertical industrial development (e.g., multi-story factory buildings), which concentrates anthropogenic heat in smaller spatial footprints but leads to more intense localized warming. The lack of quantitative anthropogenic heat flux (Qf) measurements—critical for closing the surface energy balance (SEB) in industrial zones—represents a key limitation. This gap hinders the precise quantification of how industrial activities (e.g., manufacturing processes, equipment operation) drive local thermal anomalies, thereby limiting the robustness of our conclusions regarding industrial UHI mitigation strategies.
Future research should address these gaps in several ways. Comparative studies across cities in different climatic zones could reveal regional variations in industrial heat island effects. Long-term monitoring using multi-source datasets would allow street-level, fine-scale analysis of the evolution of industrial UHIs, providing more targeted guidance for park planning. In practice, an integrated three-dimensional measurement, including the in situ/ground measurement of the LST, on-screen indicators (e.g., air temperature, relative humidity, and wind velocity), the unmanned vehicle-based platform, and the Internet-of-things-based sensors, should be established to collect the datasets and comprehensively assess the heterogeneity of the industrial UHI patterns [65]. For instance, with site-specific Qf data (e.g., from eddy covariance systems, sensor networks, or industrial process-based emissions inventories), we can disentangle the relative contributions of Qf versus natural SEB components (net radiation, sensible/latent heat fluxes) to industrial UHI intensification. Moreover, alongside these integrated platform-derived datasets, proxy estimates from energy/industry sampling data, nighttime satellite lights, and satellite vegetation indices should be used to enhance the quality of research in this domain [66].
5. Conclusions
This study examined the dynamics of land use in Shanghai over the past three decades, focusing on the evolution of industrial land parcels. A high-dimensional dataset representing built environment elements of IPs/ICs was constructed. Using retrospective and clustering analyses, industrial development patterns were classified into six categories. Combined with GIS-based spatial statistics and classical quantitative methods, the study quantified thermal environment responses under varying industrial intensities. This revealed the mechanisms linking industrial development and urban heat dynamics. The key findings are summarized as follows:
- Socioeconomic development and land development patterns are highly interrelated across three spatial scales. At the macro scale, Shanghai’s urbanization is divided into four distinct stages. At the zonal scale, urban expansion shifts from a single-center pattern (central city outward) to a multi-center pattern (IPs/ICs toward the periphery). At the local scale, IPs/ICs were initially limited in scale but gradually became significant contributors to newly developed urban land with the progression of urbanization and industrialization. The central city, constrained by land scarcity and environmental pressures, shifted from incremental expansion to stock renewal. However, suburban areas with abundant land absorbed industrial outward migration, significantly altering LULC patterns. The findings reveal the process by which IPs/ICs reshape metropolitan land use structures.
- The mechanism between industrial development patterns and thermal environment responses was emphasized, revealing a strong spatial correspondence between the urban thermal anomaly range and LULC distribution. During S1 and S2, the thermal environment exhibited a single-core aggregation pattern, primarily affecting the central city, gradually spreading outward. In the S3, under industrial suburbanization, the proportion of industrial land in the outer ring and suburbs surged. This has resulted in industrial parks becoming new urban heat sources and significantly aggravating the thermal environment. In the S4, the thermal environment exhibited a “central mitigation–peripheral deterioration” pattern. This was characterized by the central areas mitigating urban heat islands through green infrastructure, while the expansion of industrial land at the urban periphery imposed sustained thermal stress. Sequential analysis highlighted the high correspondence between Shanghai’s UHI extent and LULC distribution. It reflected a shift from single-core zonal expansion to multi-core peripheral spread. This research moves beyond merely documenting UHI to explicitly linking its spatial-temporal trajectory to the migration and intensification of industrial land, thereby providing a mechanistic explanation for the observed thermal stress patterns.
- At the local scale, the majority (approximately 75%) of industrial parks rapidly transformed from low-intensity development to medium- and high-intensity patterns. A rapid expansion of new urban heat island effect zones has been seen, with a contribution to the deterioration of the city’s overall thermal environment being made as a result. In contrast, only a few peripheral industrial parks (approximately 20.31%) transitioned from low to medium intensity, without forming new urban heat island areas. This highlights the urgent need to incorporate UHI considerations into industrial land use policies. This can be achieved by controlling development intensity in surrounding industrial zones and implementing green infrastructure-based industrial estate design.
- The open-source data and methodological framework employed in this study provide valuable references for the adjustment of industrial land, functional optimization, and mitigation of adverse thermal environment impacts in similar urban regions, offering practical guidance for enhancing climate change resilience.
Supplementary Materials
The following supporting information can be downloaded at: https://www.mdpi.com/article/10.3390/su172210199/s1, R code for Land Surface Temperature (LST) retrieval.
Author Contributions
Conceptualization, W.-J.W. and H.Z.; methodology, W.-J.W. and H.Z.; software, W.-J.W.; validation, W.-J.W., H.Z., H.-R.Y. and Y.-H.L.; formal analysis, W.-J.W.; investigation, W.-J.W.; resources, W.-J.W. and H.Z.; data curation, W.-J.W.; writing—original draft preparation, W.-J.W.; writing—review and editing, W.-J.W.,H.Z., and A.-L.Z.; visualization, W.-J.W. All authors have read and agreed to the published version of the manuscript.
Funding
This research received no external funding.
Institutional Review Board Statement
Not applicable.
Informed Consent Statement
Not applicable.
Data Availability Statement
The commercial data is unavailable due to data protection. The other data can be provided on request.
Acknowledgments
During the preparation of this manuscript, the authors used Grammarly PREMIUM for the purposes of grammar revision and polishing. The authors have reviewed and edited the output and take full responsibility for the content of this publication.
Conflicts of Interest
Author Ms. Ai-lian Zhao was employed by the company East China Electric Power Design Institute. The remaining authors declare that the research was conducted in the absence of any commercial or financial relationships that could be construed as a potential conflict of interest.
Abbreviations
The following abbreviations are used in this manuscript:
| LULC | Land Use/Land Cover |
| UHI | Urban Heat Island |
| IPs | Industrial Parks |
| ICs | Industrial Clusters |
| C2L2 | Collection 2 Level 2 |
| MLC | Maximum Likelihood Supervised Classification |
| LSE | Land Surface Emissivity |
| CBEM | Classification-Based Emissivity Method |
| PBEM | Pv-Based Emissivity Method |
| BAF | Built-up Area Fraction |
| VC | Vegetation Cover |
| WAF | Water Area Fraction |
| PD | Population Density |
| RD | Road Density |
| CA | Core Area |
| EDA | Exploratory Data Analysis |
| HCA | Hierarchical Cluster Analysis |
Appendix A

Table A1.
Basic information of Industrial parks/industrial clusters.
Table A1.
Basic information of Industrial parks/industrial clusters.
| ID | Name (Abbreviation) | Ring | Industry Type | Area (ha) | Buffer (m) | |
|---|---|---|---|---|---|---|
| IP1 | Pengpu Industrial Park (Pengpu) | Middle Ring | Non-Six Major Industries | 435.33 | 500 | |
| IP2 | Taopu Industrial Park (Taopu) | Middle Ring | Life Health | 402.03 | 1000 | |
| IP3 | Caohejing Hi-Tech Industrial Park (Caohejing) | Middle Ring | Electronic Information | 367.02 | 500 | |
| IP4 | Baihe Industrial Park (Baihe) | Suburb | Fashion Consumer Goods | 377.01 | 500 | |
| IP5 | Huaxin Industrial Park (Huaxin) | Suburb | Automobile | 360.99 | 1000 | |
| IP6 | Qingpu Industrial Park (Qingpu) | Suburb | Electronic Information | 4508.01 | 1500 | |
| IP7 | Shangta Industrial Park (Shangta) | Urban Fringe | Electronic Information | 76.77 | 500 | |
| IP8 | Zhujiajiao Industrial Park (Zhujiajiao) | Suburb | Non-Six Major Industries | 279.63 | 1000 | |
| IP9 | Jinze Industrial Park (Jinze) | Urban Fringe | Non-Six Major Industries | 76.23 | 1000 | |
| IP10 | Liantang Industrial Park (Liantang) | Urban Fringe | Non-Six Major Industries | 292.32 | 500 | |
| IP11 | Fengjing Industrial Park (Fengjing) | Urban Fringe | Automobile | 473.22 | 500 | |
| IP12 | Xingta Industrial Park (Xingta) | rban Fringe | Fashion Consumer Goods | 486.18 | 1000 | |
| IP13 | Tinglin Industrial Park (Tinglin) | Suburb | Electronic Information | 440.1 | 1000 | |
| IP14 | Ganxiang Industrial Park (Ganxiang) | Urban Fringe | Non-Six Major Industries | 179.01 | 500 | |
| IP15 | Jinshan Zhangyan Industrial Park (JS Zhangyan) | Urban Fringe | Advanced Materials | 377.55 | 1000 | |
| IP16 | Jinshan Langxia Industrial Park (JS Langxia) | Urban Fringe | Fashion Consumer Goods | 170.46 | 1000 | |
| IP17 | Songjiang Industrial Cluster (East) (Songjiang (E)) | Suburb | Electronic Information | 3890.16 | 500 | |
| IP18 | Caohejing Development Zone-Songjiang Park (Caohejing (SJ)) | Outer Ring | Electronic Information | 66.42 | 500 | |
| IP19 | Zhuanghang Industrial Park (Zhuanghang) | Suburb | Non-Six Major Industries | 37.08 | 1000 | |
| IP20 | Wuqiao Industrial Park (Wuqiao) | Suburb | Non-Six Major Industries | 99 | 1000 | |
| IP21 | Yangwang Industrial Park (Yangwang) | Suburb | High-end Equipment | 215.19 | 1000 | |
| IP22 | Star Fire Development Zone (Star Fire) | Suburb | Life Health | 746.19 | 500 | |
| IP23 | Qinggang Industrial Park (Qinggang) | Suburb | Advanced Materials | 303.75 | 500 | |
| IP24 | Fengcheng Industrial Park (Fengcheng) | Suburb | Electronic Information | 622.89 | 500 | |
| IP25 | Jinhui Industrial Park (Jinhui) | Suburb | Life Health | 323.19 | 1000 | |
| IP26 | Touqiao Industrial Park (Touqiao) | Suburb | Electronic Information | 188.37 | 1000 | |
| IP27 | Situan Industrial Park (Situan) | Suburb | Fashion Consumer Goods | 142.11 | 500 | |
| IP28 | Lingang Free Trade Industrial Park (LG FreeTrade) | Urban Fringe | Non-Six Major Industries | 113.58 | 500 | |
| IP29 | Lingang Main Industrial Base (LG Main) | Urban Fringe | High-end Equipment | 3120.84 | 500 | |
| IP30 | Nanhui Industrial Park (Nanhui) | Suburb | High-end Equipment | 819.09 | 500 | |
| IP31 | Kangqiao Industrial Park (East) (Kangqiao) | Outer Ring | Electronic Information | 1962.72 | 1000 | |
| IP32 | Xuanqiao Industrial Park (Xuanqiao) | Suburb | Non-Six Major Industries | 161.19 | 1000 | |
| IP33 | Laogang Chemical Industrial Park (Laogang) | Suburb | Electronic Information | 124.38 | 500 | |
| IP34 | Aircraft Assembly Base (Aircraft Assembly) | Suburb | High-end Equipment | 221.67 | 500 | |
| IP35 | Liuzao Industrial Park (Liuzao) | Outer Ring | Non-Six Major Industries | 45.9 | 500 | |
| IP36 | Chuansha Economic Zone (Chuansha) | Outer Ring | Non-Six Major Industries | 294.03 | 500 | |
| IP37 | Huating Industrial Park (Huating) | Suburb | Non-Six Major Industries | 116.55 | 500 | |
| IP38 | Xuxing Industrial Park (Xuxing) | Suburb | High-end Equipment | 248.67 | 1000 | |
| IP39 | Jiading Industrial Park (North) (Jiading (N)) | Suburb | Automobile | 1928.7 | 1500 | |
| IP40 | Jiading Industrial Park (South) (Jiading (S)) | Outer Ring | Automobile | 716.13 | 1000 | |
| IP41 | Jiangqiao Industrial Park (Jiangqiao) | Outer Ring | Non-Six Major Industries | 206.73 | 1000 | |
| IP42 | Chongming Industrial Park (Chongming) | Urban Fringe | Electronic Information | 421.56 | 500 | |
| IP43 | Fusheng Economic Development Zone (Fusheng) | Suburb | Electronic Information | 418.68 | 500 | |
| IC1 | Baoshan Steel-Wusong Industrial Cluster (Baoshan Steel-Wusong) | IC-1-1 Baoshan City Industrial Park (North) (Baoshan (N)) | Suburb | Advanced Materials | 1682.46 | 1000 |
| IC-1-2 Baoshan Steel Base (Baoshan Steel) | Outer Ring | Advanced Materials | 2944.53 | |||
| IC-1-3 Luodian Industrial Park (Luodian) | Suburb | Advanced Materials | 473.04 | |||
| IC-1-4 Yueyang Industrial Park (Yueyang) | Outer Ring | Advanced Materials | 822.69 | |||
| IC-1-5 Gucun Industrial Park (Gucun) | Outer Ring | High-end Equipment | 187.2 | |||
| IC-1-6 Wusong Industrial Base (Wusong) | Outer Ring | Advanced Materials | 1694.07 | |||
| IC2 | Anting-Waigang Industrial Cluster (Anting-Waigang) | IC-2-1 Waigang Industrial Park (Waigang) | Suburb | Automobile | 316.71 | 1000 |
| IC-2-2 Auto Parts Industrial Park (Car Configuration) | Suburb | Automobile | 1114.74 | |||
| IC-2-3 Anting Auto Industry Base (Anting) | Suburb | Automobile | 573.57 | |||
| IC3 | Huangdu-Nanxiang Industrial Cluster (Huangdu-Nanxiang) | IC-3-1 Huangdu Industrial Park (Huangdu) | Outer Ring | Automobile | 456.39 | 1000 |
| IC-3-2 Nanxiang Industrial Park (Nanxiang) | Outer Ring | Non-Six Major Industries | 441.27 | |||
| IC4 | Nanxiang-Baoshan City Industrial Cluster (Nanxiang-Baoshan City) | IC-4-1 Baoshan City Industrial Park (South) (Baoshan (S)) | Outer Ring | Electronic Information | 341.55 | 500 |
| IC-4-2 Nanxiang Industrial Park (Nanxiang Town) | Outer Ring | High-end Equipment | 216.72 | |||
| IC5 | Xujing-Minbei Industrial Cluster (Xujing-Minbei) | IC-5-1 Xujing Industrial Park (Xujing) | Outer Ring | Life Health | 217.26 | 1000 |
| IC-5-2 Minbei Industrial Park (Mingbei) | Outer Ring | Life Health | 616.77 | |||
| IC6 | Jiuting-Sijing-Dongting Industrial Cluster (Jiuting-Sijing-Dongting) | IC-6-1 Jiuting High-Tech Industrial Park (Jiuting Hi-Tech) | Outer Ring | Electronic Information | 246.6 | 500 |
| IC-6-2 Sijing Industrial Park (Sijing) | Outer Ring | Electronic Information | 612.09 | |||
| IC-6-3 Jiuting Industrial Park (Jiuting Town) | Outer Ring | Fashion Consumer Goods | 218.07 | |||
| IC-6-4 Dongjing Industrial Park (Dongting) | Suburb | High-end Equipment | 542.88 | |||
| IC7 | Songjiang-Yongfeng-Shihudang Industrial Cluster (Songjiang-Yongfeng-Shihudang) | IC-7-1 Songjiang Industrial Zone (West) (Songjiang) | Suburb | Electronic Information | 2123.73 | 1500 |
| IC-7-2 Yongfeng Industrial Park (Yongfeng) | Suburb | Non-Six Major Industries | 427.86 | |||
| IC-7-3 Shihudang Industrial Park (Shihudang) | Suburb | Fashion Consumer Goods | 273.06 | |||
| IC8 | Zhujing-Songyin Industrial Cluster (Zhujing-Songyin) | IC-8-1 Zhujing Industrial Park (Zhujing) | Urban Fringe | Advanced Materials | 582.12 | 1000 |
| IC-8-2 Songyin Industrial Park (Songyin) | Suburb | Fashion Consumer Goods | 142.65 | |||
| IC9 | Jinshan Second Industrial Cluster (Jinshan Second) | IC-9-1 Jinshan Second Industrial Park (Jinshan NO.2) | Urban Fringe | Advanced Materials | 893.34 | 1500 |
| IC-9-2 Jinshan Petrochemical-Petrochemical Base (Jinshan Base) | Urban Fringe | Advanced Materials | 971.64 | |||
| IC10 | Jinshan Industrial Cluster (Jinshan) | IC-10-1 Jinshan Industrial Park (Jinshan) | Urban Fringe | Advanced Materials | 1423.89 | 1000 |
| IC-10-2 Jinshan Industrial Park South District (Jinshan (S)) | Urban Fringe | Life Health | 595.71 | |||
| IC11 | Fengxian Chemical Industrial Cluster (Fengxian Chemical) | IC-11-1 Lingang Industrial Park (Lingang) | Suburb | Advanced Materials | 252.63 | 500 |
| IC-11-2 Chemical Industry Zone Fengxian Sub-district (Fengxian) | Urban Fringe | Advanced Materials | 1698.75 | |||
| IC-11-3 Chemical Industry—Petrochemical Base (Chemical) | Urban Fringe | Advanced Materials | 1127.34 | |||
| IC12 | Minhang Export-Comprehensive Zone (Minhang Export-Comprehensive Zone) | IC-12-1 Taishun Industrial Park (Taishun) | Suburb | Non-Six Major Industries | 306.45 | 1000 |
| IC-12-2 Fengxian Modern Agricultural Park (Fengxian Agriculture) | Suburb | Fashion Consumer Goods | 607.14 | |||
| IC-12-3 Minhang Export Processing Zone (Minhang Export) | Suburb | Electronic Information | 1119.69 | |||
| IC-12-4 Comprehensive Industrial Development Zone (Comprehensive Zone) | Suburb | Electronic Information | 650.7 | |||
| IC13 | Minhang-Maqiao Industrial Cluster (Minhang-Maqiao) | IC-13-1 Maqiao Industrial Park (Maqiao) | Suburb | Non-Six Major Industries | 175.32 | 500 |
| IC-13-2 Minhang Economic and Technological Development Zone (Minhang) | Suburb | High-end Equipment | 1376.01 | |||
| IC14 | Wujing-Xiangyang- Xinmei Industrial Cluster (Wujing-Xiangyang- Xinmei) | IC-14-1 Xinzhuang Industrial Park (Xinzhuang) | Outer Ring | Electronic Information | 1398.78 | 500 |
| IC-14-2 Xiangyang Industrial Park (Xiangyang) | Outer Ring | Electronic Information | 601.74 | |||
| IC-14-3 Wujing Industrial Base (Wujing) | Outer Ring | Electronic Information | 1142.46 | |||
| IC-14-4 Xinmei Industrial Park (Xinmei) | Outer Ring | Fashion Consumer Goods | 176.31 | |||
| IC15 | Kangqiao-Pujiang-Aerospace Hi-Tech Industrial Cluster (Kangqiao-Pujiang-Aerospace Hi-Tech) | IC-15-1 Kangqiao Industrial Park (Kangqiao) | Middle Ring | Electronic Information | 380.07 | 1000 |
| IC-15-2 Caohejing Development Zone Pujiang Park (Pujiang) | Outer Ring | Electronic Information | 970.11 | |||
| IC-15-3 Pujiang Industrial Park (Pujiang Town) | Outer Ring | Non-Six Major Industries | 223.38 | |||
| IC-15-4 Aerospace Technology Industrial Park (Aerospace Hi-Tech) | Outer Ring | High-end Equipment | 282.51 | |||
| IC16 | Zhangjiang-Beicai Industrial Cluster (Zhangjiang-Beicai) | IC-16-1 Zhangjiang Hi-Tech Park (Microelectronics Base) (Zhangjiang) | Outer Ring | Electronic Information | 494.91 | 1000 |
| IC-16-2 Beicai Industrial Park (Beicai) | Middle Ring | Non-Six Major Industries | 368.82 | |||
| IC17 | Heqing-Jinqiao Outskirt Industrial Cluster (Heqing-Jinqiao Outskirt) | IC-17-1 Heqing Economic Development Zone (Heqing) | Outer Ring | Electronic Information | 579.78 | 1000 |
| IC-17-2 Jinqiao Export Processing Zone (Outer Ring) (Jinqiao Outskirt) | Outer Ring | Electronic Information | 660.15 | |||
| IC18 | Gaoqiao-Jinqiao-Caolu Industrial Cluster (Gaoqiao-Jinqiao-Caolu) | IC-18-1 Gaoqiao Industrial Park (Gaoqiao) | Middle Ring | Advanced Materials | 1084.41 | 1000 |
| IC-18-2 Waigaoqiao Free Trade Zone (Gaoqiao FreeTrade) | Outer Ring | Non-Six Major Industries | 1033.38 | |||
| IC-18-3 Caolu Industrial Park (Caolu) | Outer Ring | Electronic Information | 178.65 | |||
| IC-18-4 Jinqiao Export Processing Zone (Inner Ring) (Jinqiao) | Middle Ring | Electronic Information | 1465.92 | |||
| IC19 | Pudong Airport-Zhuqiao Industrial Cluster (Pudong Airport-Zhuqiao) | IC-19-1 Pudong Airport Industrial Park (Pudong Airport) | Suburb | High-end Equipment | 625.68 | 1000 |
| IC-19-2 Zhuqiao Airport Industrial Park (Zhuqiao) | Suburb | High-end Equipment | 748.71 | |||
| IC20 | Lingang-Seaport Industrial Cluster (Lingang-Seaport) | IC-20-1 Lingang Heavy Equipment Industrial Base (Lingang) | Urban Fringe | High-end Equipment | 3249.18 | 1000 |
| IC-20-2 Lingang Logistics Park Fengxian Sub-district (Lingang Fenxian) | Urban Fringe | High-end Equipment | 515.25 | |||
| IC-20-3 Seaport Comprehensive Development Zone Industrial Park (Seaport) | Urban Fringe | Non-Six Major Industries | 657.45 | |||
| IC21 | Changxing Island Shipbuilding Industrial Cluster (Changxing Island Shipbuilding) | IC-21-1 Changxing Island Shipbuilding Supporting Base (Changxing Island) | Suburb | High-end Equipment | 471.69 | 1000 |
| IC-21-2 Changxing Island Shipbuilding Base East Block (Changxing Island (E)) | Suburb | High-end Equipment | 2247.03 | |||
| IC-21-3 Changxing Island Shipbuilding Base West Block (Changxing Island (W)) | Suburb | High-end Equipment | 300.15 | |||

Table A2.
Error matrix of land use classification from 1995 to 2022.
Table A2.
Error matrix of land use classification from 1995 to 2022.
| Year | Item | Built Up | Vegetated Land | Water | Tidal Land |
|---|---|---|---|---|---|
| 1995 | Built up | 190 | 20 | 5 | 11 |
| Vegetated land | 13 | 181 | 10 | 12 | |
| Water | 6 | 13 | 132 | 15 | |
| Tidal land | 7 | 20 | 7 | 43 | |
| 2001 | Built up | 177 | 15 | 10 | 7 |
| Vegetated land | 6 | 178 | 7 | 11 | |
| Water | 5 | 13 | 127 | 13 | |
| Tidal land | 6 | 17 | 11 | 68 | |
| 2007 | Built up | 193 | 11 | 6 | 11 |
| Vegetated land | 11 | 177 | 6 | 13 | |
| Water | 12 | 5 | 137 | 14 | |
| Tidal land | 6 | 17 | 11 | 50 | |
| 2015 | Built up | 169 | 8 | 7 | 12 |
| Vegetated land | 10 | 178 | 5 | 13 | |
| Water | 5 | 9 | 129 | 17 | |
| Tidal land | 11 | 21 | 5 | 50 | |
| 2022 | Built up | 180 | 7 | 6 | |
| Vegetated land | 11 | 193 | 5 | ||
| Water | 4 | 6 | 137 | ||
| Tidal land | 11 | 23 | 12 |

Table A3.
Accuracy indices of land use classification from 1995 to 2022.
Table A3.
Accuracy indices of land use classification from 1995 to 2022.
| Year | Item | Mapping Accuracy | Omission | User Accuracy | Commission |
|---|---|---|---|---|---|
| 1995 | Built up | 84.07% | 15.93% | 87.96% | 12.04% |
| Vegetated land | 83.80% | 16.20% | 77.35% | 22.65% | |
| Water | 79.52% | 20.48% | 85.71% | 14.29% | |
| Tidal land | 55.84% | 44.16% | 53.09% | 46.91% | |
| Overall Accuracy | 79.71% | ||||
| 2001 | Built up | 84.69% | 15.31% | 91.24% | 8.76% |
| Vegetated land | 88.12% | 11.88% | 79.82% | 20.18% | |
| Water | 80.38% | 19.62% | 81.94% | 18.06% | |
| Tidal land | 66.67% | 33.33% | 68.69% | 31.31% | |
| Overall Accuracy | 81.97% | ||||
| 2007 | Built up | 87.33% | 12.67% | 86.94% | 13.06% |
| Vegetated land | 85.51% | 14.49% | 84.29% | 15.71% | |
| Water | 81.55% | 18.45% | 85.63% | 14.38% | |
| Tidal land | 59.52% | 40.48% | 56.82% | 43.18% | |
| Overall Accuracy | 81.91% | ||||
| 2015 | Built up | 86.22% | 13.78% | 86.67% | 13.33% |
| Vegetated land | 86.41% | 13.59% | 82.41% | 17.59% | |
| Water | 80.63% | 19.38% | 88.36% | 11.64% | |
| Tidal land | 57.47% | 42.53% | 54.35% | 45.65% | |
| Overall Accuracy | 81.05% | ||||
| 2022 | Built up | 89.11% | 10.89% | 87.38% | 12.62% |
| Vegetated land | 86.16% | 13.84% | 84.28% | 15.72% | |
| Water | 83.54% | 16.46% | 85.63% | 14.38% | |
| Tidal land | 57.01% | 42.99% | 59.80% | 40.20% | |
| Overall Accuracy | 81.92% |

Table A4.
Error matrix of manually corrected post-classification products from 1995 to 2022.
Table A4.
Error matrix of manually corrected post-classification products from 1995 to 2022.
| Year | Item | Built Up | Vegetated Land | Water | Tidal Land |
|---|---|---|---|---|---|
| 1995 | Built up | 193 | 9 | 3 | 11 |
| Vegetated land | 5 | 181 | 5 | 12 | |
| Water | 2 | 5 | 137 | 15 | |
| Tidal land | 2 | 5 | 2 | 43 | |
| 2001 | Built up | 173 | 5 | 3 | 7 |
| Vegetated land | 2 | 138 | 2 | 11 | |
| Water | 2 | 5 | 127 | 13 | |
| Tidal land | 2 | 5 | 2 | 68 | |
| 2007 | Built up | 239 | 3 | 2 | 11 |
| Vegetated land | 5 | 243 | 2 | 13 | |
| Water | 2 | 5 | 186 | 14 | |
| Tidal land | 2 | 3 | 3 | 50 | |
| 2015 | Built up | 181 | 2 | 3 | 12 |
| Vegetated land | 3 | 167 | 3 | 13 | |
| Water | 4 | 5 | 135 | 17 | |
| Tidal land | 2 | 5 | 6 | 50 | |
| 2022 | Built up | 172 | 6 | 2 | |
| Vegetated land | 3 | 158 | 2 | ||
| Water | 3 | 8 | 137 | ||
| Tidal land | 2 | 2 | 3 |

Table A5.
Accuracy indices of manually corrected post-classification products from 1995 to 2022.
Table A5.
Accuracy indices of manually corrected post-classification products from 1995 to 2022.
| Year | Item | Mapping Accuracy | Omission | User Accuracy | Commission |
|---|---|---|---|---|---|
| 1995 | Built up | 93.69% | 6.31% | 95.54% | 4.46% |
| Vegetated land | 90.95% | 9.05% | 90.50% | 9.50% | |
| Water | 93.20% | 6.80% | 93.20% | 6.80% | |
| Tidal land | 88.31% | 11.69% | 91.89% | 8.11% | |
| Overall Accuracy | 92.05% | ||||
| 2001 | Built up | 94.54% | 5.46% | 96.65% | 3.35% |
| Vegetated land | 93.88% | 6.12% | 90.20% | 9.80% | |
| Water | 91.37% | 8.63% | 94.78% | 5.22% | |
| Tidal land | 86.96% | 13.04% | 83.33% | 16.67% | |
| Overall Accuracy | 92.57% | ||||
| 2007 | Built up | 97.55% | 2.45% | 96.37% | 3.63% |
| Vegetated land | 96.05% | 3.95% | 95.67% | 4.33% | |
| Water | 94.90% | 5.10% | 96.37% | 3.63% | |
| Tidal land | 89.19% | 10.81% | 90.41% | 9.59% | |
| Overall Accuracy | 95.57% | ||||
| 2015 | Built up | 95.26% | 4.74% | 95.26% | 4.74% |
| Vegetated land | 95.43% | 4.57% | 93.30% | 6.70% | |
| Water | 90.60% | 9.40% | 91.84% | 8.16% | |
| Tidal land | 77.59% | 22.41% | 80.36% | 19.64% | |
| Overall Accuracy | 92.31% | ||||
| 2022 | Built up | 94.51% | 5.49% | 95.56% | 4.44% |
| Vegetated land | 94.61% | 5.39% | 90.80% | 9.20% | |
| Water | 88.96% | 11.04% | 95.14% | 4.86% | |
| Tidal land | 88.71% | 11.29% | 82.09% | 17.91% | |
| Overall Accuracy | 92.39% |
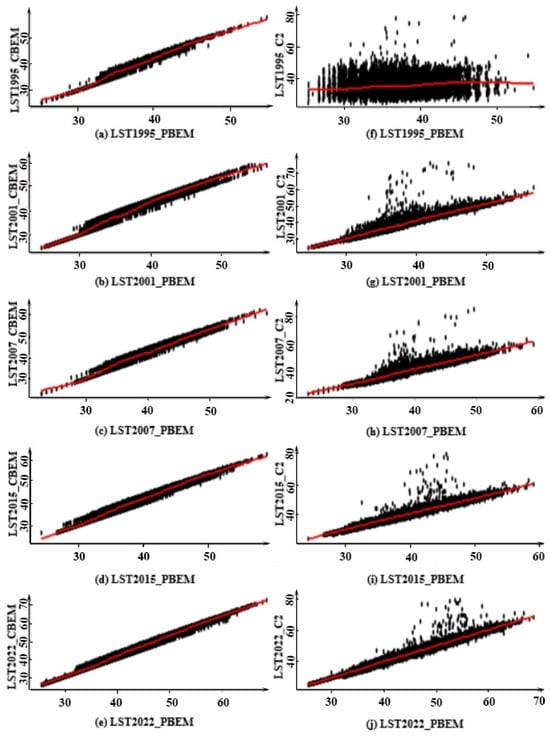
Figure A1.
Correlation of LSTPBEM with LSTCBEM and LSTPBEM with LSTC2 in Shanghai for five years.
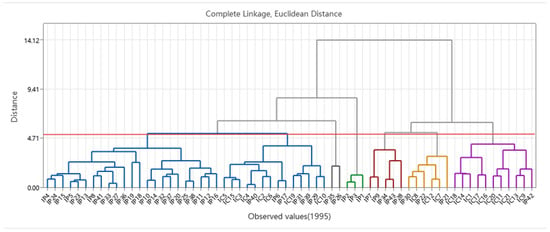
Figure A2.
Dendrogram of the complete linkage clustering methods for IPs/ICs in 1995. Note: The red line represents the classification threshold.
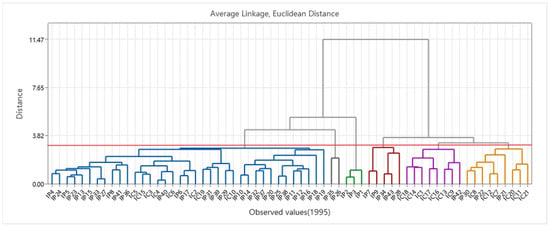
Figure A3.
Dendrogram of the average linkage clustering methods for IPs/ICs in 1995. Note: The red line represents the classification threshold.
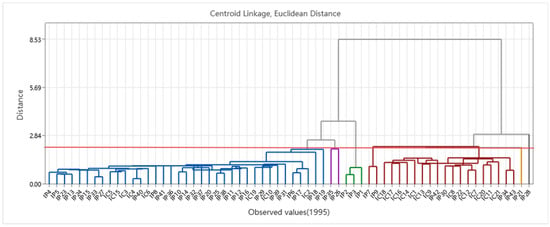
Figure A4.
Dendrogram of the centroid linkage clustering methods for IPs/ICs in 1995. Note: The red line represents the classification threshold.
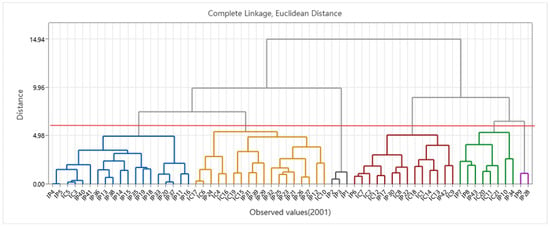
Figure A5.
Dendrogram of the complete linkage clustering methods for IPs/ICs in 2001. Note: The red line represents the classification threshold.
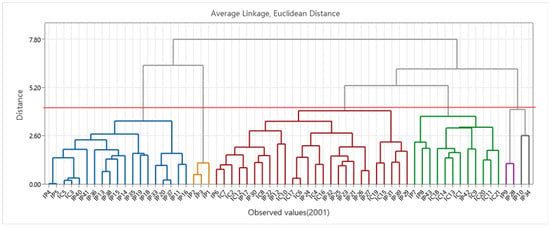
Figure A6.
Dendrogram of the average linkage clustering methods for IPs/ICs in 2001. Note: The red line represents the classification threshold.
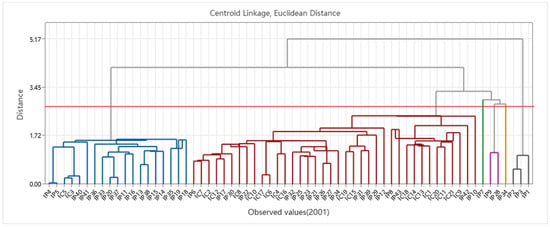
Figure A7.
Dendrogram of the centroid linkage clustering methods for IPs/ICs in 2001. Note: The red line represents the classification threshold.
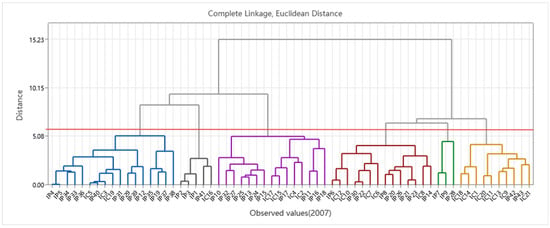
Figure A8.
Dendrogram of the complete linkage clustering methods for IPs/ICs in 2007. Note: The red line represents the classification threshold.
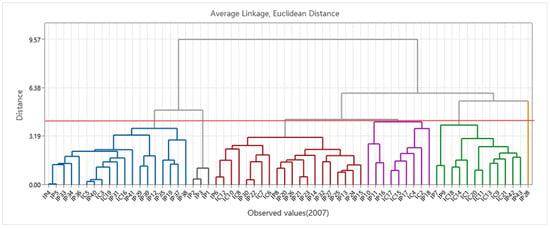
Figure A9.
Dendrogram of the average linkage clustering methods for IPs/ICs in 2007. Note: The red line represents the classification threshold.
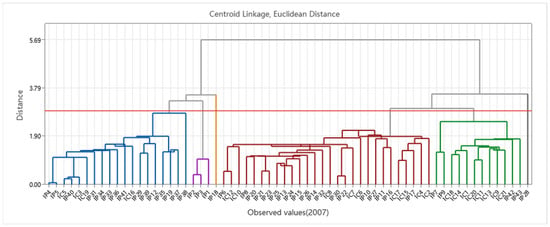
Figure A10.
Dendrogram of the centroid linkage clustering methods for IPs/ICs in 2007. Note: The red line represents the classification threshold.
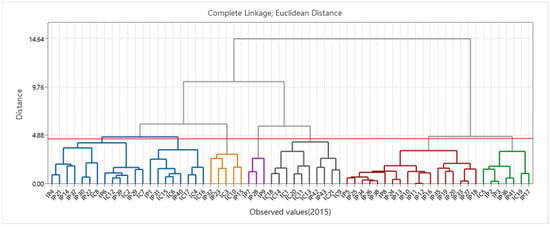
Figure A11.
Dendrogram of the complete linkage clustering methods for IPs/ICs in 2015. Note: The red line represents the classification threshold.
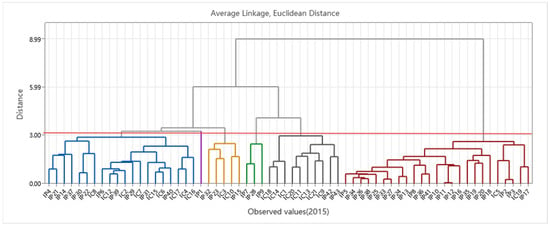
Figure A12.
Dendrogram of the average linkage clustering methods for IPs/ICs in 2015. Note: The red line represents the classification threshold.
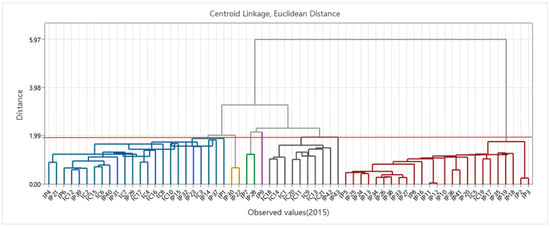
Figure A13.
Dendrogram of the centroid linkage clustering methods for IPs/ICs in 2015. Note: The red line represents the classification threshold.
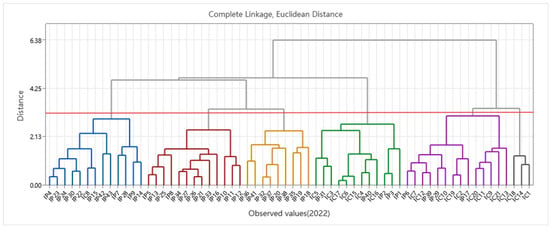
Figure A14.
Dendrogram of the complete linkage clustering methods for IPs/ICs in 2022. Note: The red line represents the classification threshold.
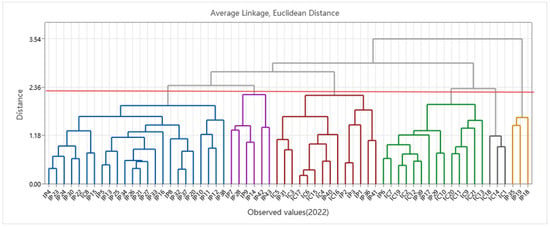
Figure A15.
Dendrogram of the average linkage clustering methods for IPs/ICs in 2022. Note: The red line represents the classification threshold.
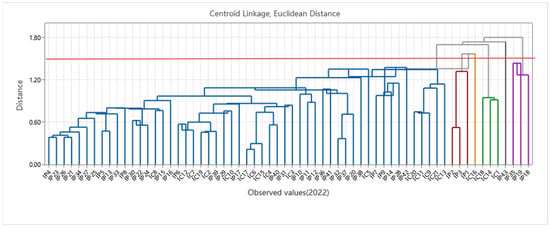
Figure A16.
Dendrogram of the centroid linkage clustering methods for IPs/ICs in 2022. Note: The red line represents the classification threshold.
References
- UN-Habitat. World Cities Report 2022: Envisaging the Future of Cities 2022; UN-Habitat: Nairobi, Kenya, 2022; p. 2022, 19. [Google Scholar]
- Oke, T.R. Canyon geometry and the nocturnal urban heat-island-comparison of scale model and field observations. J. Climatol. 1981, 1, 237–254. [Google Scholar] [CrossRef]
- Wu, X.; Wang, L.; Yao, R.; Luo, M.; Wang, S.; Wang, L. Quantitatively evaluating the effect of urbanization on heat waves in China. Sci. Total Environ. 2020, 731, 138857. [Google Scholar] [CrossRef]
- Zhou, D.; Xiao, J.; Bonafoni, S.; Berger, C.; Deilami, K.; Zhou, Y.; Frolking, S.; Yao, R.; Qiao, Z.; Sobrino, J.A. Satellite remote sensing of surface urban heat islands: Progress, challenges, and perspectives. Remote Sens. 2019, 11, 48. [Google Scholar] [CrossRef]
- Mohajerani, A.; Bakaric, J.; Jeffrey-Bailey, T. The urban heat island effect, its causes, and mitigation, with reference to the thermal properties of asphalt concrete. J. Environ. Manag. 2017, 197, 522–538. [Google Scholar] [CrossRef]
- Oke, T.R. City size and the urban heat island. Atmos. Environ. 1973, 7, 769–779. [Google Scholar] [CrossRef]
- Burke, M.; Gonzalez, F.; Bayliss, P.; Heft-Neal, S.; Baysan, C.; Basu, S.; Hsiang, S. Higher temperatures increase suicide rates in the United States and Mexico. Nat. Clim. Chang. 2018, 8, 723–729. [Google Scholar] [CrossRef]
- Lin, L.; Gao, T.; Luo, M.; Ge, E.; Yang, Y.; Liu, Z.; Zhao, Y.; Ning, G. Contribution of urbanization to the changes in extreme climate events in urban agglomerations across China. Sci. Total Environ. 2020, 744, 140264. [Google Scholar] [CrossRef]
- Wang, Y.; Wang, A.; Zhai, J.; Tao, H.; Jiang, T.; Su, B.; Yang, J.; Wang, G.; Liu, Q.; Gao, C.; et al. Tens of thousands additional deaths annually in cities of China between 1.5 °C and 2.0 °C warming. Nat. Commun. 2019, 10, 3376. [Google Scholar] [CrossRef]
- Balling, R.C.; Vose, R.S.; Weber, G.R. Analysis of long-term European temperature records: 1751–1995. Clim. Res. 1998, 10, 193–200. [Google Scholar] [CrossRef]
- McCarthy, M.P.; Best, M.J.; Betts, R.A. Climate change in cities due to global warming and urban effects. Geophys. Res. Lett. 2010, 37, L09705. [Google Scholar] [CrossRef]
- Pyrgou, A.; Hadjinicolaou, P.; Santamouris, M. Urban-rural moisture contrast: Regulator of the urban heat island and heatwaves’ synergy over a mediterranean city. Environ. Res. 2020, 182, 109102. [Google Scholar] [CrossRef]
- Santamouris, M. Cooling the cities—A review of reflective and green roof mitigation technologies to fight heat island and improve comfort in urban environments. Sol. Energy 2014, 103, 682–703. [Google Scholar] [CrossRef]
- Wang, Y.; Berardi, U.; Akbari, H. Comparing the effects of urban heat island mitigation strategies for Toronto, Canada. Energ. Build. 2016, 114, 2–19. [Google Scholar] [CrossRef]
- Zhao, R.; Fang, C.; Liu, H.; Liu, X. Evaluating urban ecosystem resilience using the DPSIR framework and the ENA model: A case study of 35 cities in China. Sustain. Cities Soc. 2021, 72, 102997. [Google Scholar] [CrossRef]
- Gao, J.; Meng, Q.; Zhang, L.; Hu, D. How does the ambient environment respond to the industrial heat island effects? An innovative and comprehensive methodological paradigm for quantifying the varied cooling effects of different landscapes. Gisci. Remote Sens. 2022, 59, 1643–1659. [Google Scholar] [CrossRef]
- Xie, M.; Wang, Y.; Chang, Q.; Fu, M.; Ye, M. Assessment of landscape patterns affecting land surface temperature in different biophysical gradients in Shenzhen, China. Urban Ecosyst. 2013, 16, 871–886. [Google Scholar] [CrossRef]
- Liu, X.; Yue, W.; Yang, X.; Hu, K.; Zhang, W.; Huang, M. Mapping Urban Heat Vulnerability of Extreme Heat in Hangzhou via Comparing Two Approaches. Complexity 2020, 2020, 9717658. [Google Scholar] [CrossRef]
- Sabrin, S.; Karimi, M.; Nazari, R. Developing Vulnerability Index to Quantify Urban Heat Islands Effects Coupled with Air Pollution: A Case Study of Camden, NJ. ISPRS Int. J. Geo-Inf. 2020, 9, 349. [Google Scholar] [CrossRef]
- Meng, Q.; Hu, D.; Zhang, Y.; Chen, X.; Zhang, L.; Wang, Z. Do industrial parks generate intra-heat island effects in cities? New evidence, quantitative methods, and contributing factors from a spatiotemporal analysis of top steel plants in China. Environ. Pollut. 2022, 292, 118383. [Google Scholar] [CrossRef]
- Jiang, W.; Wang, Y.; Zhang, M. Exploring the Industrial Heat Island Effects and Key Influencing Factors in the Guangzhou–Foshan Metropolitan Area. Sustainability 2025, 17, 3363. [Google Scholar] [CrossRef]
- Chakrabortty, R.; Pramanik, M.; Hasan, M.M.; Halder, B.; Pande, C.B.; Moharir, K.N.; Zhran, M. Mitigating Urban Heat Islands in the Global South: Data-driven Approach for Effective Cooling Strategies. Earth Syst. Environ. 2025, 9, 447–474. [Google Scholar] [CrossRef]
- Al Shawabkeh, R.; Al-Hawwari, L.; Al-Fugara, A.; Saleem, K.; Smerat, A.; Abualigah, L. Analyzing urban landscapes and land surface temperature for sustainable development in industrial zones. Int. J. Environ. Sci. Technol. 2025, 22, 12245–12268. [Google Scholar] [CrossRef]
- Liu, S.; Zhang, J.; Li, J.; Li, Y.; Zhang, J.; Wu, X. Simulating and mitigating extreme urban heat island effects in a factory area based on machine learning. Build. Environ. 2021, 202, 108051. [Google Scholar] [CrossRef]
- Mao, C.; Xie, M.; Fu, M. Thermal response to patch characteristics and configurations of industrial and mining land in a Chinese mining city. Ecol. Indic. 2020, 112, 106075. [Google Scholar] [CrossRef]
- Sailor, D.J. A review of methods for estimating anthropogenic heat and moisture emissions in the urban environment. Int. J. Climatol. 2011, 31, 189–199. [Google Scholar] [CrossRef]
- Zhang, H.; Qi, Z.; Ye, X.; Cai, Y.; Ma, W.; Chen, M. Analysis of land use/land cover change, population shift, and their effects on spatiotemporal patterns of urban heat islands in metropolitan Shanghai, China. Appl. Geogr. 2013, 44, 121–133. [Google Scholar] [CrossRef]
- Chen, L.; Jiang, R.; Xiang, W. Surface Heat Island in Shanghai and Its Relationship with Urban Development from 1989 to 2013. Adv. Meteorol. 2016, 2016, 9782686. [Google Scholar] [CrossRef]
- Li, Y.; Zhang, H.; Kainz, W. Monitoring patterns of urban heat islands of the fast-growing Shanghai metropolis, China: Using time-series of Landsat TM/ETM+ data. Int. J. Appl. Earth Obs. 2012, 19, 127–138. [Google Scholar] [CrossRef]
- Li, J.; Wang, X.; Wang, X.; Ma, W.; Zhang, H. Remote sensing evaluation of urban heat island and its spatial pattern of the shanghai metropolitan area, china. Ecol. Complex. 2009, 6, 413–420. [Google Scholar] [CrossRef]
- Li, C.; Shen, D.; Dong, J.; Yin, J.; Zhao, J.; Xue, D. Monitoring of urban heat island in Shanghai, China, from 1981 to 2010 with satellite data. Arab. J. Geosci. 2014, 7, 3961–3971. [Google Scholar] [CrossRef]
- Wang, W.; Shu, J. Urban Renewal Can Mitigate Urban Heat Islands. Geophys. Res. Lett. 2020, 47, e2019GL085948. [Google Scholar] [CrossRef]
- You, M.; Guan, C. Does self-containment of spatial scale and land use function contribute to mitigate urban heat island effects? Lessons from new towns in Shanghai. Land Use Policy 2024, 146, 107323. [Google Scholar] [CrossRef]
- Zhang, K.; Wang, R.; Shen, C.; Da, L. Temporal and spatial characteristics of the urban heat island during rapid urbanization in Shanghai, China. Environ. Monit. Assess. 2010, 169, 101–112. [Google Scholar] [CrossRef]
- Bureau, S.S. Shanghai Overview_Shanghai Statistics Bureau. Available online: https://tjj.sh.gov.cn/shgl/index.html (accessed on 30 November 2024).
- Bureau, S.S. 2024 Shanghai Overview. Available online: https://www.shanghai.gov.cn/shanghai/newshanghai/shgl2024.pdf (accessed on 30 November 2024).
- Bureau, S.S. Shanghai Statistical Classification of Six Key Industries (Version 2022)_Local Statistical Classification_Shanghai Statistics Bureau. Available online: https://tjj.sh.gov.cn/dfbz/20230201/ff1234799ae2438aab2f2925e968dd1e.html (accessed on 30 November 2024).
- Sayler, K.; Zanter, K. Landsat 8-9 Level 2 Science Product (L2SP) Guide. Available online: https://www.usgs.gov/media/files/landsat-8-9-collection-2-level-2-science-product-guide (accessed on 30 November 2024).
- Sayler, K.; Zanter, K. Landsat 4-7 Level 2 Science Product (L2SP) Guide September 2021. Available online: https://www.usgs.gov/media/files/landsat-4-7-collection-2-level-2-science-product-guide (accessed on 30 November 2024).
- Earth Resources Data Cloud. Available online: http://gis5g.com (accessed on 6 March 2025).
- Pengcheng Laboratory for Remote Sensing and Astronomy. Available online: https://data-starcloud.pcl.ac.cn/ (accessed on 30 November 2024).
- Wang, Q.; Yang, Y.; Huang, J. Remote Sensing of the Environment; Science Publishing House: Beijing, China, 2020. [Google Scholar]
- Pontius, R.G.; Millones, M. Death to Kappa: Birth of quantity disagreement and allocation disagreement for accuracy assessment. Int. J. Remote Sens. 2011, 32, 4407–4429. [Google Scholar] [CrossRef]
- Becker, F. The impact of spectral emissivity on the measurement of land surface temperature from a satellite. Int. J. Remote Sens. 1987, 8, 1509–1522. [Google Scholar] [CrossRef]
- Snyder, W.C.; Wan, Z.; Zhang, Y.; Feng, Y.Z. Classification-based emissivity for land surface temperature measurement from space. Int. J. Remote Sens. 1998, 19, 2753–2774. [Google Scholar] [CrossRef]
- Sun, D.L.; Pinker, R.T. Estimation of land surface temperature from a Geostationary Operational Environmental Satellite (GOES-8). J. Geophys. Res.-Atmos. 2003, 108, 4326. [Google Scholar] [CrossRef]
- Valor, E.; Caselles, V. Mapping land surface emissivity from NDVI: Application to European, African, and South American areas. Remote Sens. Environ. 1996, 57, 167–184. [Google Scholar] [CrossRef]
- Van De Griend, A.A.; Owe, M. On the relationship between thermal emissivity and the normalized difference vegetation index for natural surfaces. Int. J. Remote Sens. 1993, 14, 1119–1131. [Google Scholar] [CrossRef]
- Gao, F.; Morisette, J.T.; Wolfe, R.E.; Ederer, G.; Pedelty, J.; Masuoka, E.; Myneni, R.; Tan, B.; Nightingale, J. An algorithm to produce temporally and spatially continuous modis-lai time series. IEEE Geosci. Remote Sens. Lett. 2008, 5, 60–64. [Google Scholar] [CrossRef]
- Jiang, Z.; Huete, A.R.; Didan, K.; Miura, T. Development of a two-band enhanced vegetation index without a blue band. Remote Sens. Environ. 2008, 112, 3833–3845. [Google Scholar] [CrossRef]
- Qin, Z.; Liu, W.; Xu, B.; Chen, Z.; Liu, J. Estimation of surface specific emissivity in the Landsat TM6 band range. Remote Sens. Land Resour. 2004, 28–32. [Google Scholar]
- Zhang, R.; Yan, W. The 50-year spatial transition of suburban industrial parks and impacts on sustainable urbanization in the Tokyo metropolitan area. Sustain. Cities Soc. 2024, 113, 105679. [Google Scholar] [CrossRef]
- Modak, S. Finding groups in data: An introduction to cluster analysis. J. Appl. Stat. 2024, 51, 1618–1620. [Google Scholar] [CrossRef]
- R Core Team. R: A Language and Environment for Statistical Computing; R Foundation for Statistical Computing: Vienna, Austria, 2025. [Google Scholar]
- Seto, K.C.; Fragkias, M.; Gueneralp, B.; Reilly, M.K. A Meta-Analysis of Global Urban Land Expansion. PLoS ONE 2011, 6, e23777. [Google Scholar] [CrossRef] [PubMed]
- Li, Y.; Li, Y.; Zhou, Y.; Shi, Y.; Zhu, X. Investigation of a coupling model of coordination between urbanization and the environment. J. Environ. Manag. 2012, 98, 127–133. [Google Scholar] [CrossRef]
- Jiao, L.; Gong, C.; Xu, G.; Dong, T.; Zhang, B.; Li, Z. Urban expansion dynamics and urban forms in three metropolitan areas—Tokyo, New York, and Shanghai. Prog. Geogr. 2019, 38, 675–685. [Google Scholar]
- Kang, L.; Ma, L. Expansion of Industrial Parks in the Beijing–Tianjin–Hebei Urban Agglomeration: A Spatial Analysis. Land 2021, 10, 1118. [Google Scholar] [CrossRef]
- An, X.; Jin, W.; Zhang, H.; Liu, Y.; Zhang, M. Analysis of long-term wetland variations in China using land use/land cover dataset derived from Landsat images. Ecol. Indic. 2022, 145, 109689. [Google Scholar] [CrossRef]
- Lin, B.; Li, Z. Spatial analysis of mainland cities’ carbon emissions of and around Guangdong-Hong Kong-Macao Greater Bay area. Sustain. Cities Soc. 2020, 61, 102299. [Google Scholar] [CrossRef]
- Wang, W.; Liu, K.; Tang, R.; Wang, S. Remote sensing image-based analysis of the urban heat island effect in Shenzhen, China. Phys. Chem. Earth Parts A/B/C 2019, 110, 168–175. [Google Scholar] [CrossRef]
- Ivanova Boncheva, A. Innovative Adaptation to Climate Change: Chinese Sponge Cities Program (SCP). Curr. Urban Stud. 2022, 10, 188–211. [Google Scholar] [CrossRef]
- Dong, X.; Ye, Y.; Yang, R.; Li, X. Planning for green infrastructure based on integration of multi-driving factors: A case study in pilot site of sponge city. Sustain. Cities Soc. 2023, 93, 104549. [Google Scholar] [CrossRef]
- Wei, L.; Sobrino, J.A. Surface urban heat island analysis based on local climate zones using ECOSTRESS and Landsat data: A case study of Valencia city (Spain). Int. J. Appl. Earth Obs. 2024, 130, 103875. [Google Scholar] [CrossRef]
- Yu, Z.; Yu, R.; Ge, X.; Fu, J.; Hu, Y.; Chen, S. Tabular prior-data fitted network for urban air temperature inference and high temperature risk assessment. Sustain. Cities Soc. 2025, 128, 106484. [Google Scholar] [CrossRef]
- Qian, W.; Rao, F.; Li, X.; Lai, D. Mapping priority zones for urban heat mitigation in Shanghai: Heat risk vs. shelter provision. Comput. Environ. Urban Syst. 2025, 121, 102330. [Google Scholar] [CrossRef]
Disclaimer/Publisher’s Note: The statements, opinions and data contained in all publications are solely those of the individual author(s) and contributor(s) and not of MDPI and/or the editor(s). MDPI and/or the editor(s) disclaim responsibility for any injury to people or property resulting from any ideas, methods, instructions or products referred to in the content. |
© 2025 by the authors. Licensee MDPI, Basel, Switzerland. This article is an open access article distributed under the terms and conditions of the Creative Commons Attribution (CC BY) license (https://creativecommons.org/licenses/by/4.0/).