Abstract
Within the LIFE PREPAIR project, the BAT-Tool Plus (released in February 2022) was developed to estimate ammonia (NH3) and greenhouse gas emissions from intensive livestock farming in the Po-basin, a hotspot for agricultural air pollution. The tool applies a nitrogen mass balance approach, considering housing, storage, treatment, and land application phases, integrating EU Best Available Techniques (BAT) standards. The BAT-Tool includes high-resolution and tailored methodologies, allowing single farms and regional-scale simulations. In this study, the BAT-Tool was applied to the Po-basin using 2023 data from the National Livestock Database and regional statistics on manure management. The results show that around one-third of nitrogen excreted by livestock is lost as NH3, confirming livestock as the dominant source of emissions compared to fertilizers. In this paper, ammonia emissions and nitrogen load to fields were estimated, analyzing potential reductions achievable with wider adoption of BAT. The BAT-Tool provides standardized, transparent estimates, supporting regulatory compliance, emission inventories, and policy planning. Its scalability from farms to district scale makes it a reference model for improving nitrogen management and reducing PM2.5 precursors in northern Italy and potentially across the EU.
1. Introduction
Within the framework of the LIFE PREPAIR project (2017–2025), which aims to improve air quality in the Po Valley, the BAT-Tool (Best Available Techniques Tool) was developed as an advanced and common modeling software to estimate ammonia (NH3) and greenhouse gas (CH4, N2O, CO2) emissions from intensive livestock farming. The BAT-Tool is grounded in a nitrogen mass flow balance approach, analyzing key operational phases—housing, treatment, storage, and land application—while incorporating mitigation measures consistent with EU Best Available Techniques (BAT) standards. The tool is now freely accessible upon registration (https://bat-tools.datamb.eu, accessed on 1 September 2025). In detail, the BAT-Tool supports several functions, such as the following:
- The quantification of current livestock emissions;
- Simulation of different scenarios with the application of different combinations of techniques and emissions estimations;
- Comparison of ammonia emissions of simulated scenarios, also with the “baseline” case in which no BAT are applied;
- Export of emissions data for Integrated Environmental Authorization (AIA) procedures;
- An estimation of emissions for the European pollution release and transfer Register (E-PRTR) regulations, with an alert when the emissions estimation exceeds the thresholds for declaration [];
- Integration of nitrogen and phosphorus excretion calculations based on animal feed composition.
The initial version (2019) focused on swine and poultry farms according to the issuance of the BREF and BAT conclusions and included simplified GHG emissions calculations. The “BAT-Tool Plus” version, released in February 2022, introduced several enhancements, including detailed emissions estimation from bovine livestock using IPCC Tier 2 methodology and a regional-scale simulation module. It also included an estimation of nitrogen potentially leaching into water bodies, enhancing precision and usability for both farmers and policymakers. Today, the BAT-Tool stands as a standardized modeling system recognized by regional authorities (e.g., Regional governments and Environmental Agencies of Northern Italy) for emission quantification and policy development across the Po-basin [,,]. It serves as a key instrument for supporting regulatory compliance, environmental planning, and the implementation of air quality strategies in the agricultural sector.
The National and European Context
According to the Gothenburg Protocol, States must reduce and maintain reduced SO2, NOx, VOCs, NH3, and PM2.5 emissions with priority for PM sources that are also relevant sources of BC (Black Carbon). In achieving these goals, they adopt emission limits and BAT (Best Available Techniques) on possible sources, as well as limits on fuels and VOC content in products. As part of the monitoring of the achievement of these objectives, the States draw up and update their emission inventories. The latest Italian emission inventory for 2023 was published in 2025 [], and several reference documents decline the international guidelines for emission estimates at the national and subnational level [,,]. European and Italian legislation on Integrated Pollution Prevention and Control (IPPC) and Industrial Emissions Directive (IED) are applied to intensive poultry and pig farms, establishing permit conditions according to BAT and relative emission levels BAT-AELs.
Several tools for emission estimates that are similar to BAT-tool Plus can be mentioned, such as the AgrEE tool, ALFAMI, Farm AC, and the Manure Management N-flow tool.
The AgrEE tool (Agricultural Emission Estimation tool) [] was created as a tool for calculating emissions into the atmosphere of pollutants—NH3, PM2.5, PM10, heavy metals, NOx, methane, etc.—that derive from agricultural activities. The tool is based on the EEA/EMEP [] and IPCC Guidelines [], using a Tier 2 method for emissions from livestock (enteric fermentation and manure management), agricultural soils, and stubble burning.
ALFAMI (Ammonia Loss from Field-Applied Manure for emission Inventories) [] was created to understand and predict ammonia emissions from manure spreading []. ALFAMI estimates emissions based on dataset measurements from different countries as a function of manure characteristics and weather conditions.
Developed as part of the European project Animal-Change, Farm AC (Farm Animal Change) [] is a flexible and adaptable model that simulates nitrogen and carbon fluxes using Tier 2 methodologies for manure management.
The tool, based on the N flow model that occurs on farms, combines input data and specific variables that describe a farm linked to the baseline scenario. Then, it quantifies the nitrogen losses referred to the scenario obtained by applying that flow model to the baseline scenario.
The Manure Management N-flow tool, developed by Aether UK [], is based on the Tier 2 approach of EEA/EMEP Guidelines.
DATAMAN [] is a large database of measured data on emissions from livestock with the aim of redefining emission factors for national inventories [,,,,]. It is divided according to manure management phases: housing, storage, and spreading. Measurements are linked to a wide range of variables, such as country, climatic zone, chemical species, categories of animals and their descriptions, emission factors, conversion factors, and technologies of housing, storage, and spreading.
According to Hassouna et al. (2022) [], pig rearing and housing are the animal category and phase most characterized by the database.
At the Italian level, the development of the BAT tool is part of a context in which different software programs with partial functionality were available in the past for estimating emissions in different regions, particularly those with the greatest impacts on groundwater, such as Erica software in Lombardy and Net IPPC software in Emilia-Romagna.
The BAT tool introduces an update with the most recent regulatory references and an integrated approach between the various environmental components, which includes all phases of livestock farming in concatenation. ENEA recently developed SCENA software, which provides functions dedicated to a territorial (regional or provincial) level of action, rather than to a single company, and a more aggregated level of BAT detail [].
The BAT tool offers an approach more suited to company size and specific references to individual BAT, allowing for a high level of detail in representing the specific company configuration. A similar concept also applies to the GAINS tool, a system for developing atmospheric emissions and air quality scenarios. It also includes modules for estimating ammonia from agricultural activities. It similarly considers the application of BAT by area and uses calculation methods that consider the application of BAT based on effectiveness intervals.
2. Materials and Methods
2.1. Geographic Domain and Scope
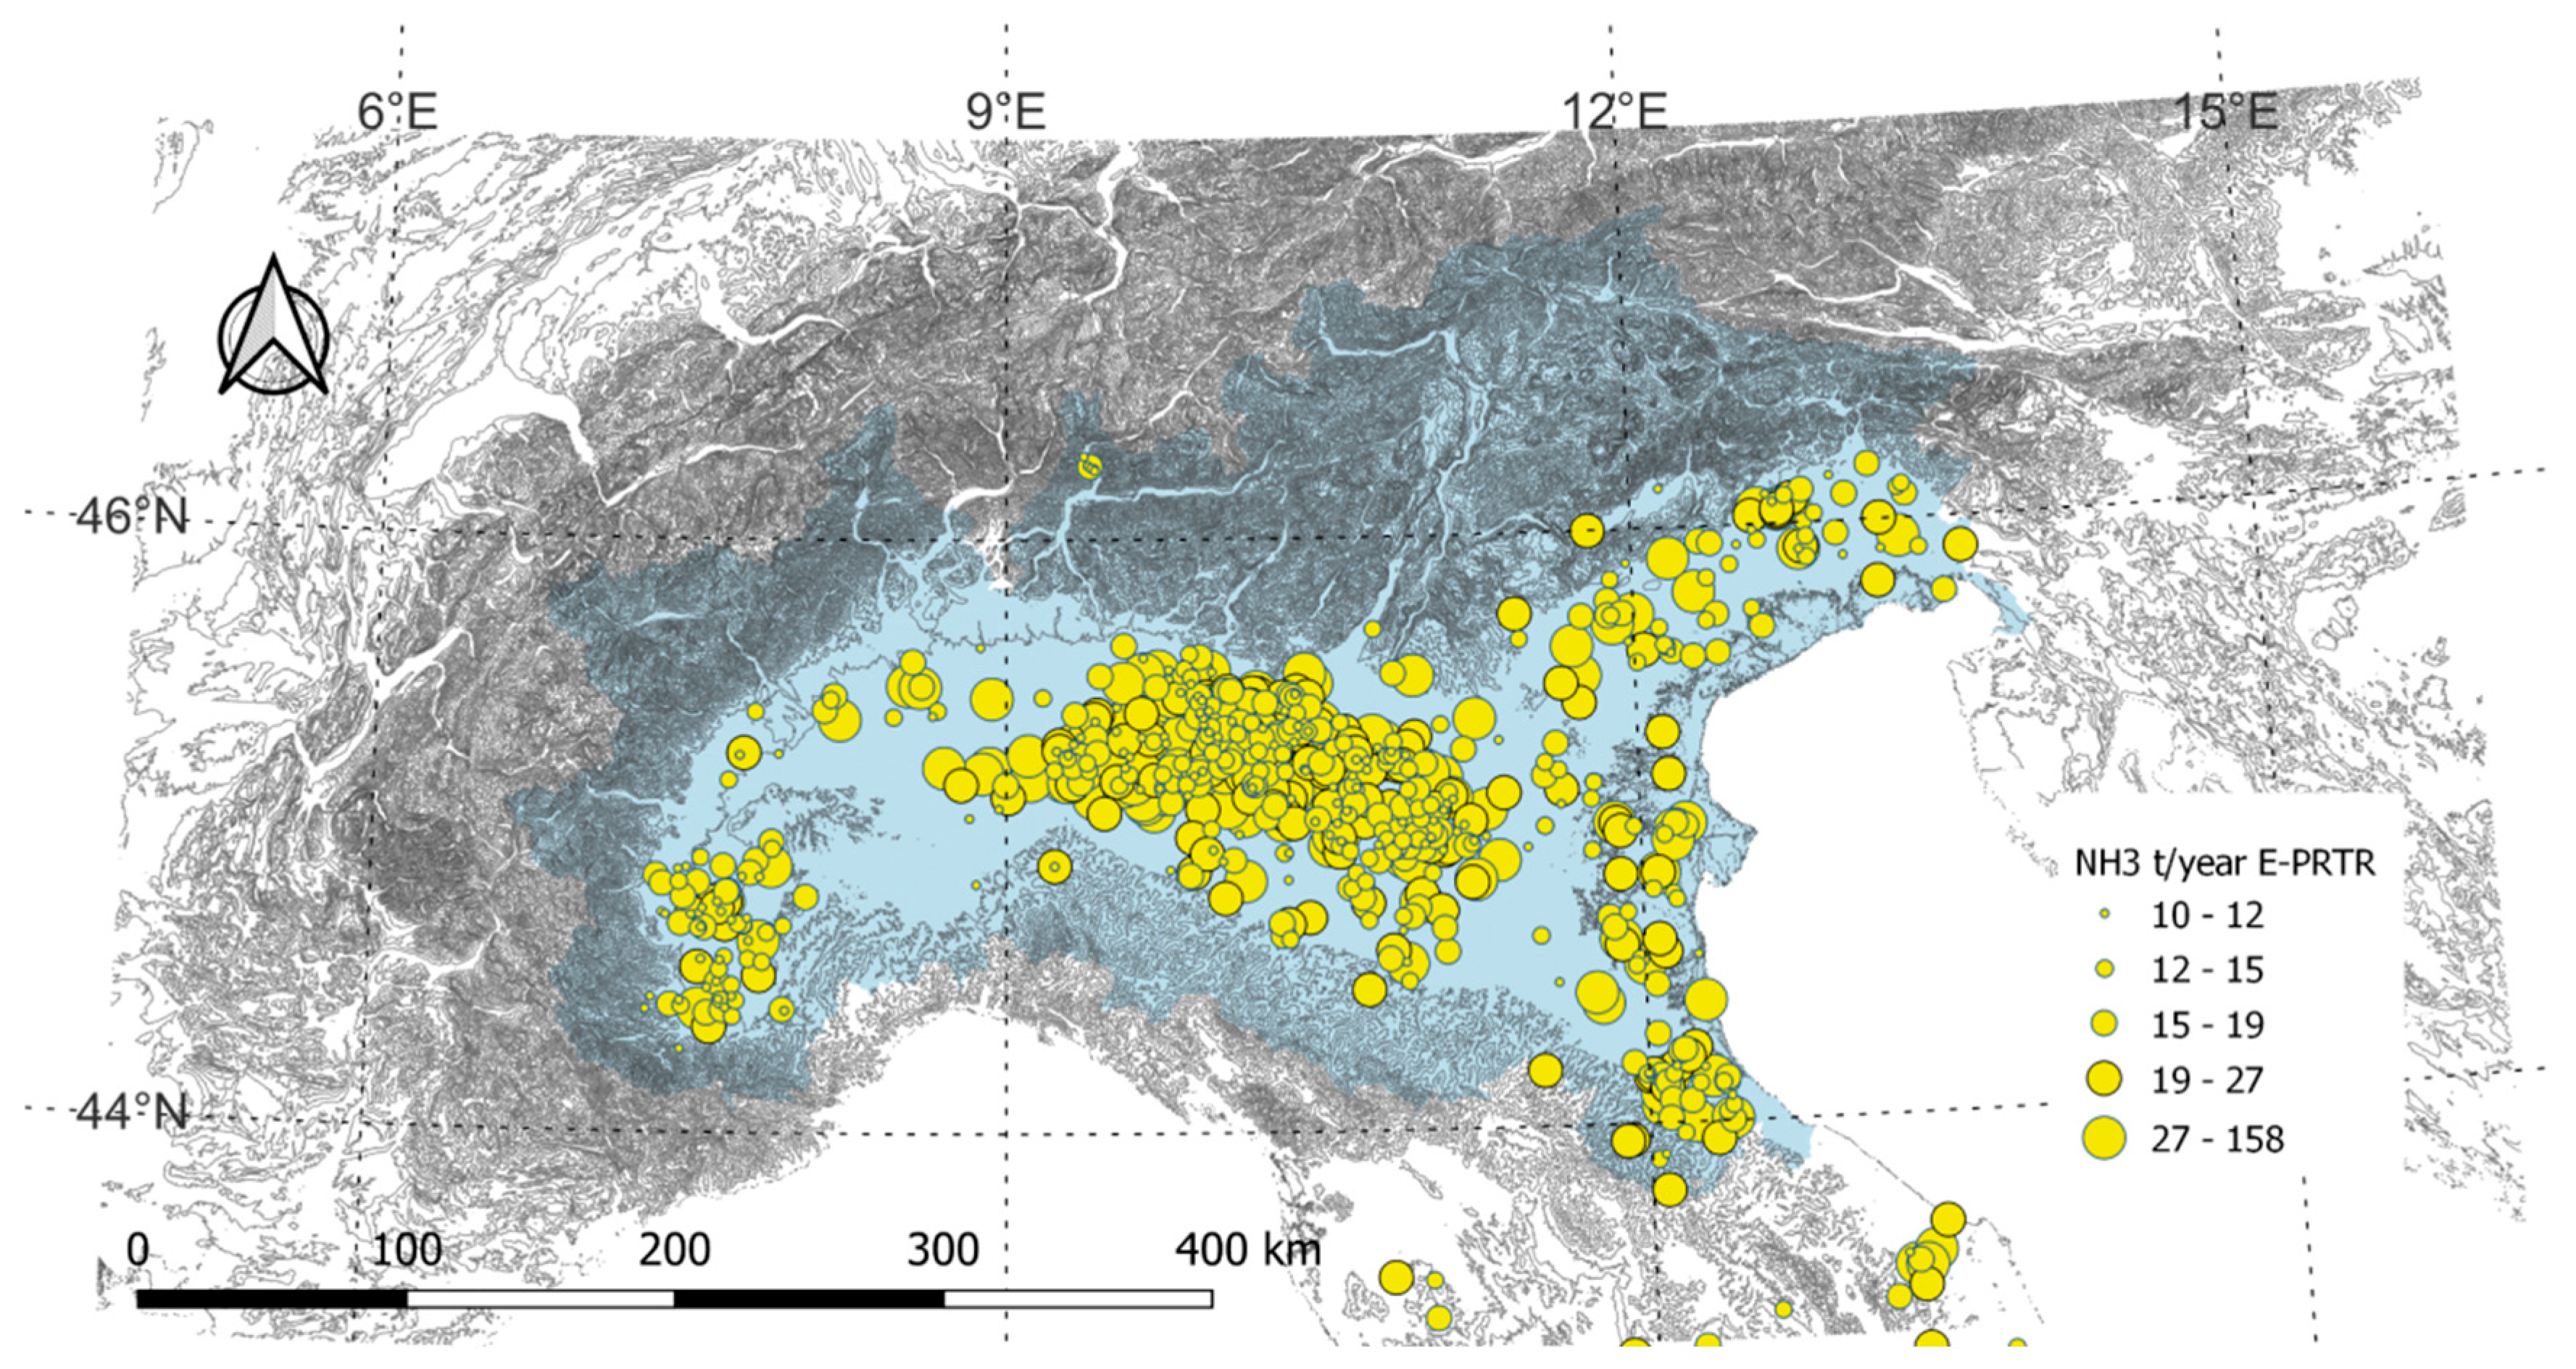
The Italian Regions participating in the LIFE PREPAIR project are highlighted on the map in Figure 1. The central part of the domain is characterized by cultivated plain areas with a high density of livestock. The available data on NH3 emissions for farms subjected to the E-PRTR (European Pollutant Release and Transfer Register) communication confirms this picture.
Figure 1.
Domain of the LIFE PREPAIR project and NH3 annual emissions reported in the E-PRTR for installations rearing poultry or pigs.
The lower limit for ammonia emissions is 10 t/year, according to the threshold values foreseen in the legislation, and the main emission points for installations for the intensive rearing of poultry or pigs are mainly concentrated in the areas between the Lombardy, Veneto, and Emilia-Romagna Regions.
The high presence of farms in the domains and the possible relevance of NH3 emissions in the formation of PM call for the development of a common methodology for estimating emissions from the installations. A common tool, like the BAT-Tool, can allow the achievement of releasing estimates according to TCCCA criteria (Transparency, Consistency, Completeness, Comparability, and Accuracy).
2.2. Methodology for Livestock Emissions
The EEA/EMEP manual is the reference document for estimating emissions into the atmosphere in national and local inventories. The EEA/EMEP manual specifies how emissions in the atmosphere can be estimated by algorithms at different levels of complexity, the latter defined by Tier. Tier 1 is the simplest methodology, using easily available statistical data to describe process intensity and average default emission factors. Tier 2, on the other hand, involves the use of more specific emission factors, defined based on the type and conditions of the processes for the area in which the emissions inventory is developed. In Tier 3, the most complex level, the most up-to-date scientific knowledge is implemented in dedicated procedures and models, and this translates into a higher level of detail that involves greater disaggregation of activities and the development of more sophisticated models.
Developed as part of the LIFE PREPAIR project, the BAT-Tool allows for calculating NH3 and GHG emissions on a farm or district scale []. The tool, based on Tier 2 calculation methodologies, makes it possible to estimate emissions from intensive cattle, pig, and poultry farms. It breaks down the value of total emissions (kg year−1) into the contributions deriving from the different emission stages.
The BAT-Tool is useful at an operational level to distinguish, within the activities of the livestock sector, different phases, or emission stages, as specified below:
- Housing or shelter for animals;
- Storage of effluents;
- Application of effluents in the field.
The BAT-Tool works by considering the mass balance of nitrogen, for the main technical references EEA-EMEP, as shown in Figure 2. N is fed to the animals with a certain level of efficiency in producing milk or meat, with a residual amount in the excreta, N_ex. During the housing phase, N_ex is exposed to the atmosphere, and a part of the nitrogen is released into the air, producing NH3 emissions and a reduction in residual nitrogen in manure, N_ex_h. Manure is generally stored with different possible levels of efficiency in containing NH3 emissions. After this phase, N_ex_st is then reduced by the quantity of ammonia emitted, NH3_s. The BAT-Tool also considers the effects of the main treatments that are carried out on the effluents.
Figure 2.
Emissions of ammonia in different phases of manure management.
In the last phase of the cycle, manure can be applied to the field, releasing NH3_d and leaving the N_field quantity to fertilize the ground.
The total atmospheric emissions from the farm or district are due to the sum of all the phases: NH3_h, NH3_s, and NH3_d. The nitrogen fluxes expressed in N-NH3 are converted into NH3 by multiplying by the ratio of molecular weights, 17/14.
The BAT-Tool allows for the introduction of emission reduction techniques in all the phases, calculating not only the effect on the phase but also accounting for the effect on the successive phases. Emissions are calculated by the product of nitrogen input for each phase by a volatilization coefficient, expressed as % of the total nitrogen. The introduction of a reduction technique modifies the volatilization coefficient of the phase to which it is applied (decreasing) but also the amount of nitrogen reaching the downstream phase (increasing). All the model parameters are published in the BAT-Tool manual []. The excreted nitrogen factors and average weight of the animal categories derive from the values defined in the national legislation, limiting the losses from housing and storage to 28% in the case of cattle and pigs and 30% in the case of poultry.
The UNECE technical document is the main source for nitrogen loss and abatement technologies in terms of removal efficiencies. In the specific case of bovines, the technologies are derived from local studies in the Po-basin since the technologies reported in UNECE documentation are not diffused in the domain.
2.3. Modeling the Nitrogen Fluxes from Livestock
The overall characteristics of the farms are the main input data for estimating emissions in the Po-basin with the BAT-Tool. These accounts of technologies for manure management were obtained from a complete database for the regional administration of Lombardy. Data on housing, storage, and manure spreading techniques commonly used were used to replicate the Lombardy livestock sector within the BAT-tool software. This approach enabled the calculation of total ammonia emissions from livestock farms for the year 2022 and the definition of local emission factors. To develop emission scenarios using the software, the following steps were undertaken:
- Establishing a correspondence between the animal categories defined in the BAT-tool and those used in the local database;
- Matching the housing systems prevalent with those available in the BAT-tool and specifying the corresponding number of animals;
- Selecting data from the regional database on manure volumes and storage cover types to complete the BAT-tool’s storage module, which requires input on the proportions of uncovered and/or covered liquid and solid manure;
- Finalizing the simulations by entering the manure spreading techniques used for slurry, specifying their respective shares.
The following animal categories were considered in this study: dairy cattle, non-dairy cattle, pigs, sows, laying hens, and broilers. The available data for the manure spreading phase referred exclusively to slurry. Therefore, to complete the scenarios in the BAT-tool, it was assumed that all solid manure was applied in the field using the least efficient technique. Table 1 shows the main parameters obtained from the BAT-Tool.
Table 1.
Nitrogen flux parameters [kg of N of Year−1 Head−1] calculated with the BAT-Tool.
The variables in Table 1 are defined in the nitrogen balance reported in Figure 2 and expressed as kg of N_NH3 specific to head on an annual basis. The emissions in the atmosphere are N_h, N_s, and N_d, while the intermediate N fluxes are N_ex, N_ex_h, and N_ex_st. N_field represents the residual amount of nitrogen remaining on the field at the end of all the phases. Based on the outputs generated using the BAT-tool, the amount of nitrogen applied to the field was determined for each livestock category. This value, which serves as input for estimating emissions from manure spreading, was normalized by dividing it by the livestock population. The application of the BAT-Tool to the characteristics of manure management allows us to define overall parameters on an annual and head basis, not only for atmospheric emissions but also for the entire flux of nitrogen in the different phases described in Figure 2. Considering each phase of manure management, the mass balance of nitrogen is always verified.
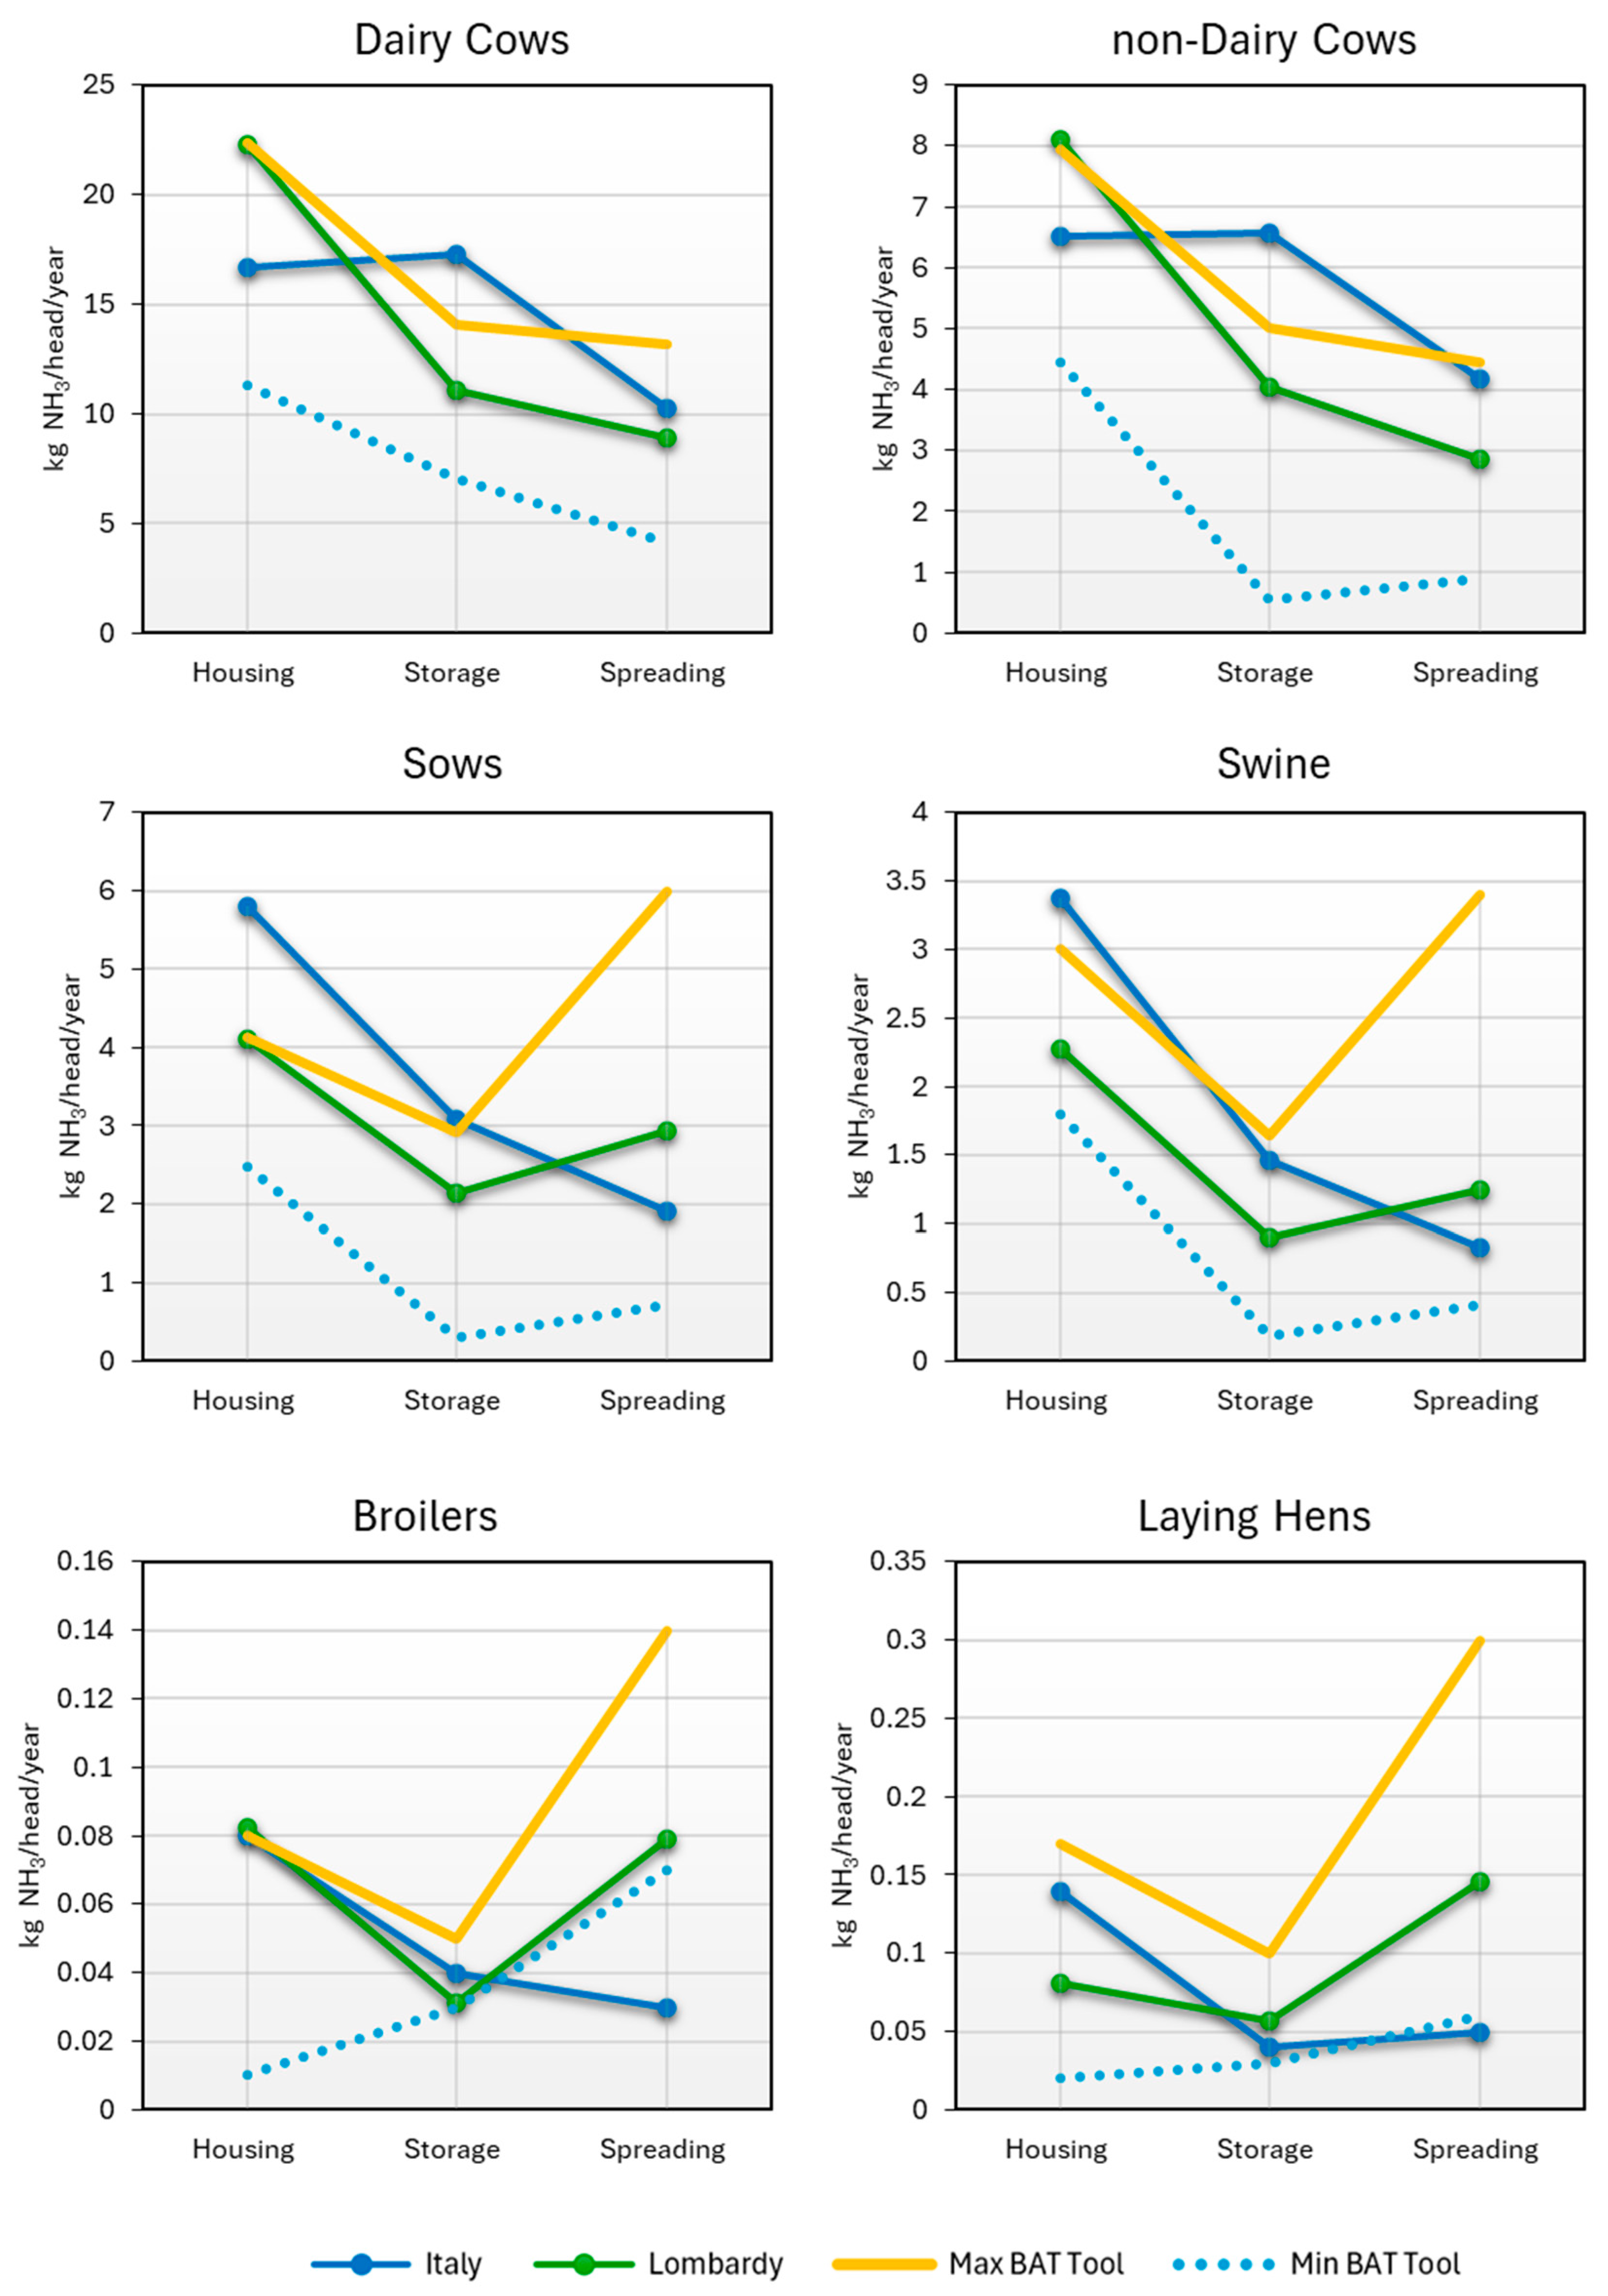
By definition, N_h, N_s, and N_d are the implied emission factors (IEFs) for the domain, which can be easily converted into t of NH3 and represent the main emissive characteristics for manure management. An interesting validation of these regional IEFs consists of their comparison with the national IEF calculated for Italy in the Informative Inventory Report, IIR [], as shown in Figure 3.
Figure 3.
Local emission factors calculated with the BAT-Tool, minimum and maximum range for emissions, and comparison with the Italian National Emission Inventory [].
The IIR, in illustrating the data sources and calculation methodologies underlying the analyses conducted and the results obtained, follows the structure of the EEA/EMEP manual and refers to the chapter relating to the management of livestock effluents (3B), according to the NFR (Nomenclature for Reporting) classification. It also presents an examination of the evolution of ammonia emission abatement technologies over time, showing the differences between emission factors over the years.
The methodological–operational approach of the IIR is aligned with the EEA/EMEP manual and the IPCC Guidelines [,]. Figure 3 shows the national average emission factors for ammonia (Tier 2) expressed in kg per head on an annual basis, referring to 2023.
The proposed local IEFs in this paper are consistent with the national ones. The high technological details used for local IEFs and the intensive nature of the farms could explain the differences and their relatively lower values.
The IEFs are also compared with the minimum and maximum range of emissions calculated with the BAT-Tool. These extremes are obtained considering the most efficient techniques and the non-abated system in manure management. The high-emission scenario is obtained by always considering high-emission and low-efficiency techniques, while the low-emission scenario is developed considering some of the best available techniques present in the BAT-tool Plus and derived from the BAT-C and the UNECE-TFRN (Task Force for Reactive Nitrogen) technical document.
The distance of the local IEF from the maximum indicates the overall abatement efficiency for the manure management phase, while the distance from the minimum values indicates the possible range of improvement.
2.4. Livestock Consistence in Po-Basin
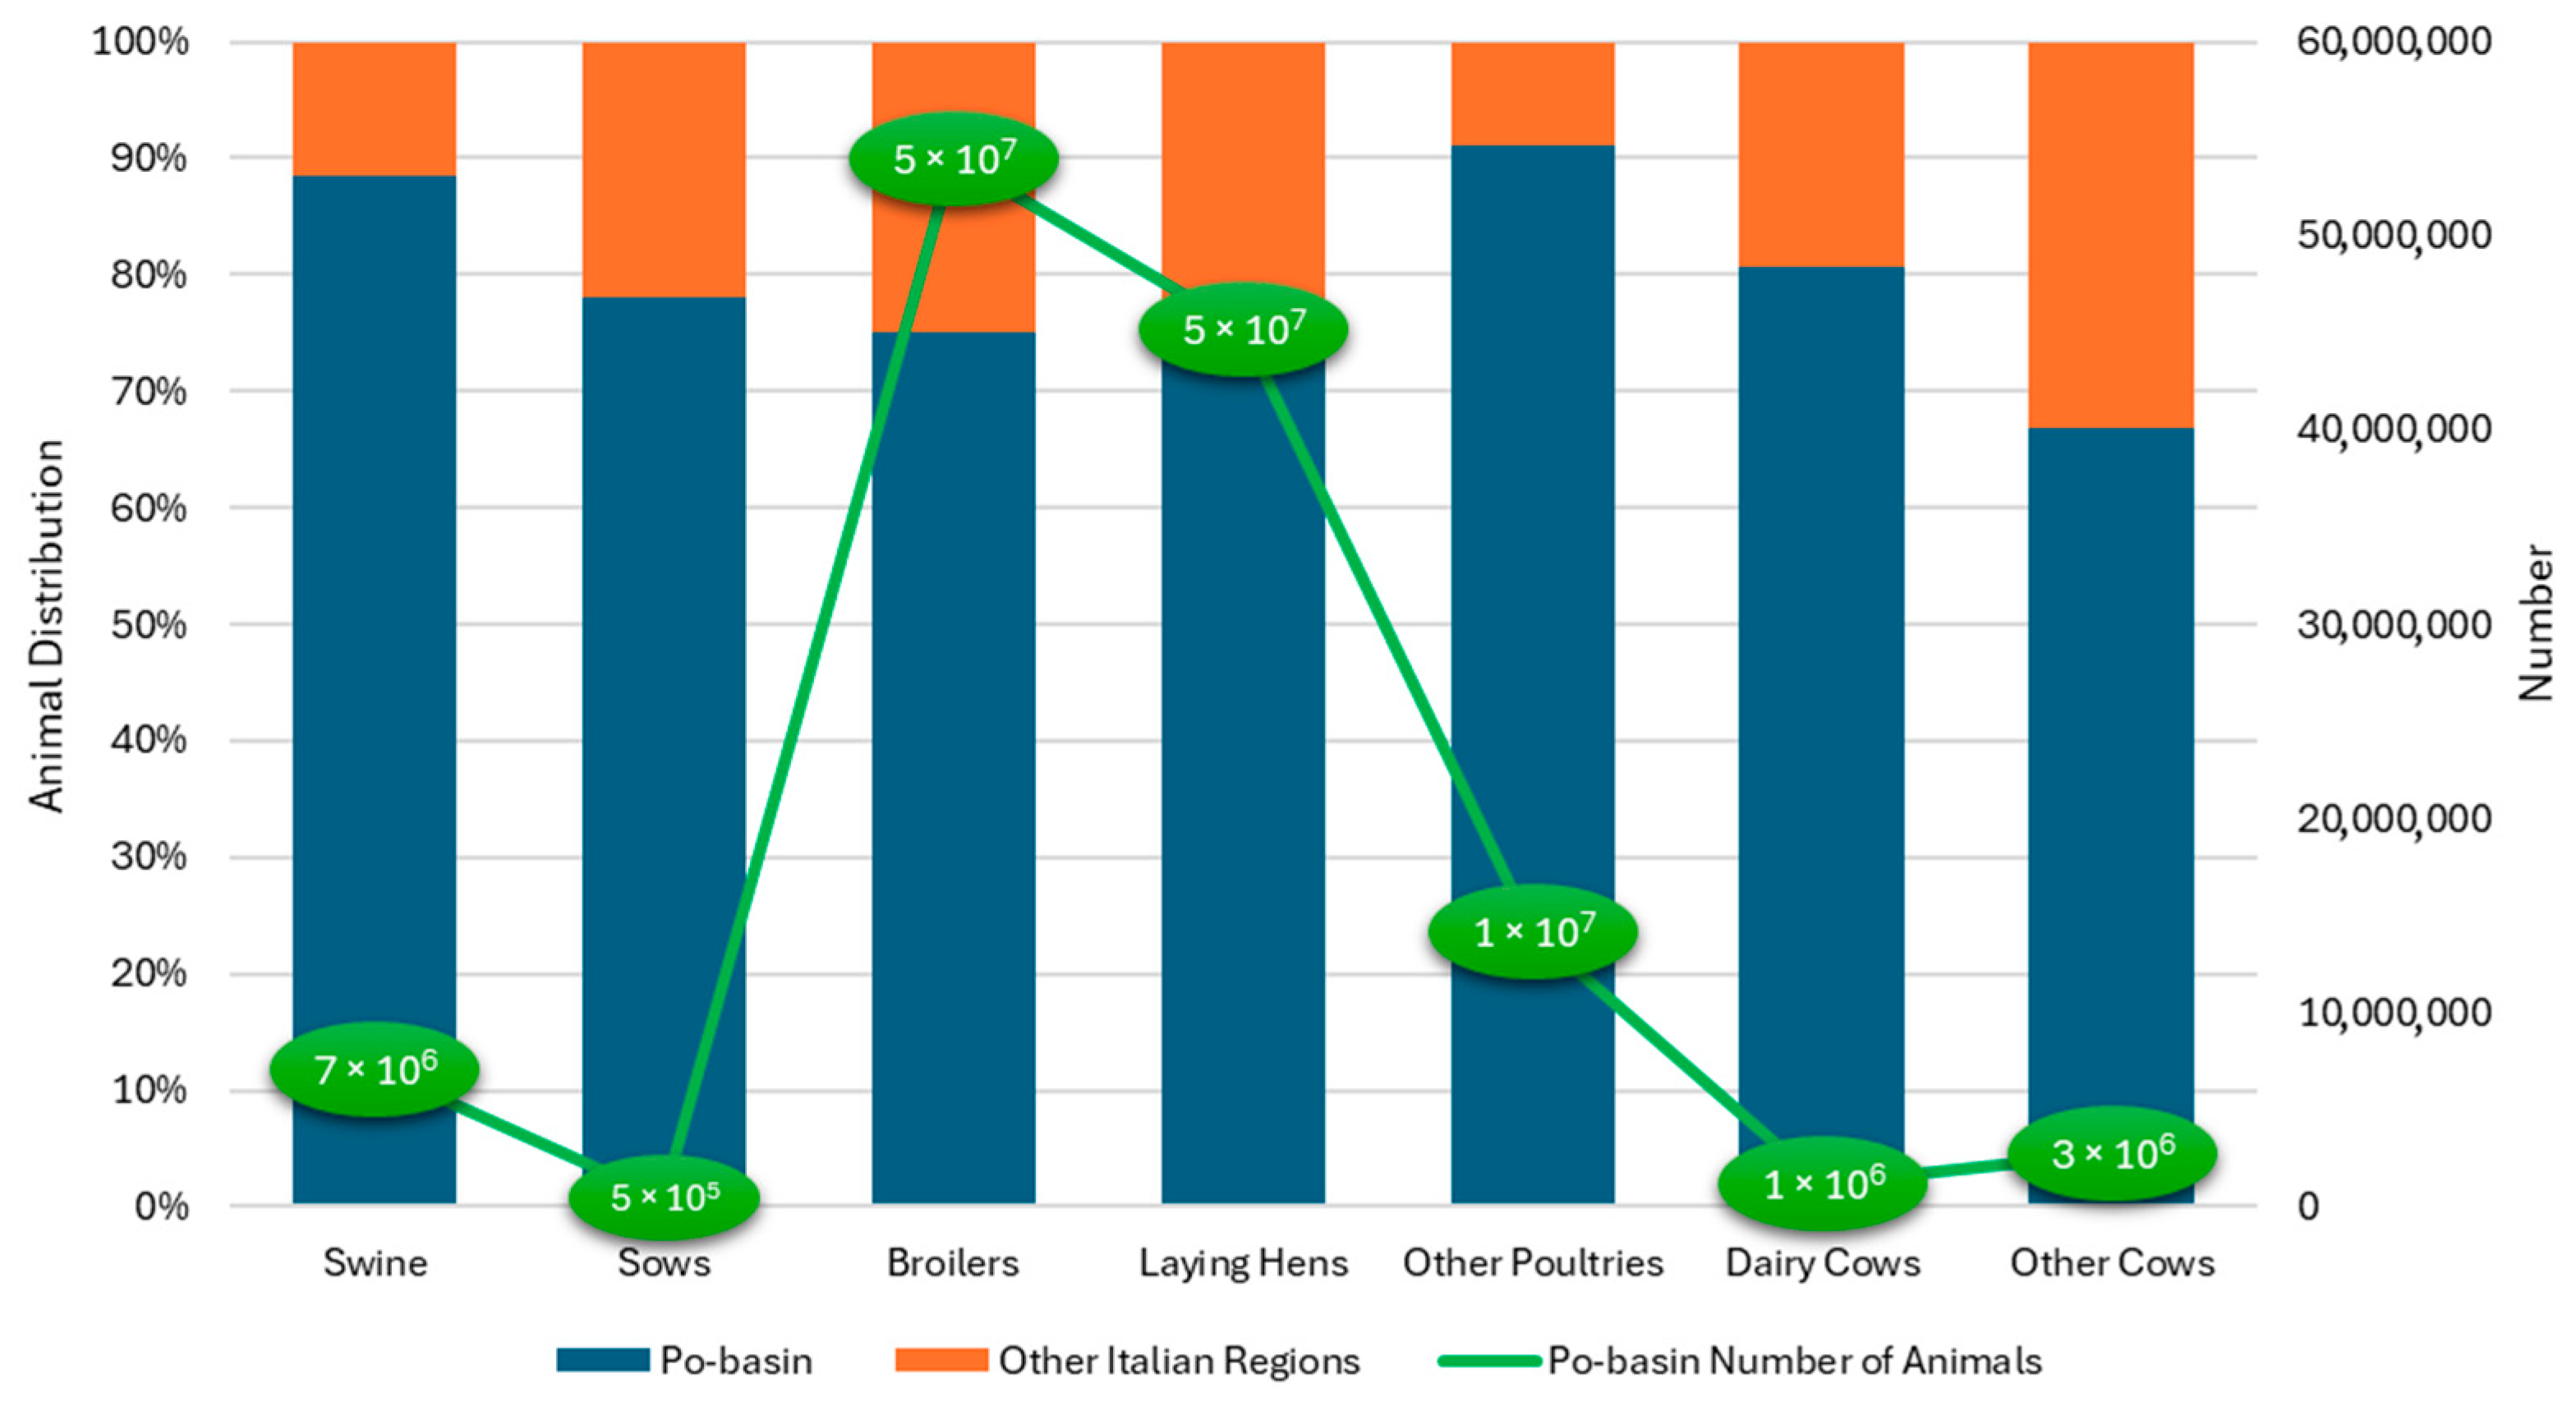
As discussed, the intensive nature of animal production in Lombardy and in the Po-basin is confirmed by the emission factors that are lower than the reference national total, which also includes more widespread livestock. The higher density of animals in the northern part of Italy is depicted in data reported by BDN—Anagrafe Nazionale Zootecnica [], as shown in Figure 4.
Figure 4.
Number of animals bred in the Po-basin and in the remaining part of Italy [].
The BDN dataset is available to the public and reports complete data on livestock at a municipal level for all of Italy, obtained by the veterinary authority. The representativeness of this data source has been widely confirmed in previous papers [], and the spatial distribution and maps for livestock consistency in northern Italy are available in Marongiu et al. 2025 [].
The majority (approximately 80%) of cows, swine, and poultry are farmed in the Po Valley, explaining the relatively higher emission density of the Po Valley area compared to Italy and the EU [,].
2.5. Methodology for Mineral Fertilizer Emissions
In the Po-basin, the use of mineral fertilizers represents the second NH3 emission source after livestock []. The estimates are based on data on fertilizers sold at the NUTS 3 level from the Italian National Bureau of Statistics, ISTAT []. The emissions are calculated by emission factors specific to fertilizers and the quantity of nitrogen applied to the field. The N applied is obtained by multiplying the nitrogen content of each fertilizer by the quantity sold. Table 2 shows the main indicators for the Po-basin.
Table 2.
Mineral fertilizers sold in the Po-basin, nitrogen content, and NH3 emission factors.
As discussed for manure field applications [], the type and quantity of pollutants emitted are influenced by the dose, the type of fertilizer used, the type of soil (specific characteristic parameters: chemical–physical–agronomic), and pedoclimatic conditions. The estimation of emissions can therefore be affected locally by significant underestimation or overestimation of the indicators. In Table 2, atmospheric emissions can be expressed as t of NH3 and as t of N, always considering the conversion factor of 14/17. The total amount of nitrogen remaining in fields is calculated by mass balance between the nitrogen content in fertilizers sold and the atmospheric emissions.
3. Results
3.1. Nitrogen Fluxes in the Po-Basin
The proposed local IEFs were validated and compared with measurements obtained from DATAMAN [,]. Figure 5 shows the IEF calculated in this work, the median of the measurements, and the measured interval between the 25th and 75th percentiles. The IEFs are in very good agreement considering the large variability in the measurements, which can be explained by many factors, e.g., meteorological conditions, technology, manure, and soil characteristics []. The R2 is higher than 0.8, and a comparison was performed only for animals and phases where the measured data were sufficiently numerous.
Figure 5.
Comparison of the emission factors of this work with measurements (log scale).
To calculate the nitrogen mass balance across the entire Po Valley, 2023 livestock population data were retrieved from the BDN for the following Italian regions: Emilia-Romagna, Friuli Venezia Giulia, Lombardy, Piedmont, Autonomous Provinces of Trento and Bolzano, Aosta Valley, and Veneto []. The coefficients reported in Table 1 (kg N per head and per year) were then multiplied by the livestock population within the Po Valley to estimate the total nitrogen load (kg N). Table 3 shows the results of the estimates for the entire Po-basin. Table 4 shows the estimates of N fluxes in the Po-basin determined by mineral fertilization.
Table 3.
Main annual nitrogen fluxes derived from livestock in the Po-basin expressed in kt of N.
Table 4.
Main annual nitrogen fluxes derived from mineral fertilization in the Po-basin expressed in kt of N.
The total annual emissions in the atmosphere from livestock and fertilization can be calculated as the sum of N_h, N_s and N_d. The nitrogen load to the field is due to N_ex_st and N_app.
Table 4 shows that urea contributes to the largest part of the emissions derived from mineral fertilization. In the LIFE PREPAIR project, a specific activity was performed to explore the applicability of alternative techniques to the traditional urea distribution to assess the achievable reductions in ammonia emissions from nitrogenous chemical fertilization [].
3.2. Emission Reduction from Urea Application
Field trials were conducted with instrumental analysis of emissions after fertilizer application using various techniques, including wind tunnel analysis, as shown in Figure 6. The techniques were also compared through interviews with farmers and fertilizer producers, and applicability and cost analysis were conducted for the most commonly grown crops in the Po Valley.
Figure 6.
Wind tunnel test.
The wind tunnel is a system developed and validated to detect ammonia emissions from surfaces subject to the distribution of effluents/fertilizers. For soil that has been fertilized with different methods, the technique consists of covering a small area (1 m2) of the fertilized soil with a mini-greenhouse, passing a known flow of air over the surface of the fertilized soil, and sampling the air entering and exiting the tunnel.
The concentration of NH3 in the air entering and exiting the tunnel is measured by bubbling in an acid solution. The main meteorological and climatic parameters that influence the emission dynamics are also detected. Measurement sessions lasting at least 48 h are carried out at each distribution operation.
Based on the data collected, a qualitative evaluation of the applicability of the techniques for the main crops (autumn–winter cereals and summer cereals) was obtained, as shown in Table 5.
Table 5.
Applicability of possible urea distribution techniques for cereals.
Considering different application scenarios of the techniques in Table 5, the possible reductions achievable within the Po Valley are shown in Figure 7, where the emission scenarios are defined as BAU: Business As Usual, NEC: requirement contained in NAPCP 2019 (Air Pollution Reduction National Plans), EQU: balanced dissemination of good practices, and BAN: urea ban.
Figure 7.
Possible abatement scenarios for the emissions of mineral fertilization.
3.3. Emission Scenarios and Air Quality
The importance of NH3 in the Po-basin for the formation of secondary particulate matter has been widely analyzed [,], and air quality improvement will necessitate a reduction in all the primary pollutants (SOX, NOX, PM, NH3, and NMVOC). The simulations indicate that even with significant emission reductions (−50% and −80%) in all sectors, most sections of the Po Valley will not meet WHO pollution standards []. For the agriculture sector, in these simulations, the replacement of urea was considered, and the complete conversion of effluent management techniques to the best-performing technologies was calculated by the BAT-Tool (see the range of minimum emissions in Figure 3). The expected reductions in livestock in terms of emission factors, representative of the national average, were as follows:
- 47% for dairy cows and 76% for other cattle;
- 68% for pigs and 82% for sows;
- 17% for laying hens and 31% for chickens.
3.4. Nitrogen Losses
According to the main results of the emission inventory of the Po-basin [], other sources, such as agriculture, non-industrial combustion, and road transport, can contribute to annual emissions for 11.7 kt of N.
Around 33% of the total nitrogen excreted by livestock in the Po-basin is lost to the atmosphere as NH3, calculated using the results in Table 3:
Using the same formula adapted for mineral fertilizers, the nitrogen release in the atmosphere is around 10%.
According to the Italian National Bureau of Statistics (ISTAT), the UAA (Utilized Agricultural Area) [] in the Po-basin amounts to 4,345,341 ha. With this information, it is possible to estimate the overall load of nitrogen to a field from manure with the following ratio:
The same calculation can be performed for mineral fertilizers, obtaining a N load to fields of 67 kg N/ha. Considering manure and mineral fertilizers, the total nitrogen load to fields in the Po-basin accounts for 134 kg N/ha.
This value is relatively lower than the maximum threshold established by the Nitrates Directive (Annex III, point 2b) []: 170 kg N/ha.
4. Discussion
The application of the BAT-Tool within the Lombardy and Po-basin context demonstrates its effectiveness as a decision support system for environmental policy. By integrating a nitrogen mass balance approach with farm-level data, the tool produces standardized, transparent, and comparable estimates of ammonia (NH3) and nitrogen flows across different management stages. Compared to existing international tools, the BAT-Tool offers the advantage of direct alignment with EU Best Available Techniques (BAT) conclusions and Italian regulatory frameworks, filling a gap in national-level applications where no similar integrated tool is currently available (ERICA provides only partial coverage). This makes the BAT-Tool a unique model for the Italian context and a potential reference at the European level.
The strengths of the BAT-Tool lie in its capacity to connect detailed farm management practices with regional-scale inventories, ensuring that emission factors reflect actual techniques applied on farms rather than default assumptions. This allows for more accurate scenario analyses, including the impact of wider adoption of covered storage, low-emission spreading, and precision feeding. In Lombardy, the tool has proven its ability to close nitrogen balances and quantify the share of losses to air, soil, and water, offering robust indicators for policy monitoring. Nevertheless, limitations persist, especially regarding spatial resolution: the current aggregation may not fully capture heterogeneity in local pedoclimatic conditions, soil types, or cropping systems, which significantly affect nitrogen fate [,,].
A key policy implication concerns the misalignment between existing EU directives. The Industrial Emissions Directive (IED) regulates large intensive farms through BAT-AELs, while the Nitrates Directive focuses on field-level applications. A more holistic regulatory framework would be desirable to integrate nitrogen flows from housing to spreading, ensuring consistency between air quality, water quality, and climate policies [,].
Ammonia’s role as a precursor to secondary particulate matter (PM2.5) further underlines the urgency of coordinated measures. Studies across the Po Valley confirm that NH3 abatement can substantially reduce PM2.5 concentrations, with direct implications for human health and associated economic costs [,,]. The BAT-Tool provides a practical instrument to quantify such benefits and to assess the cost-effectiveness of interventions, from low-emission spreading of manure to urea fertilization alternatives tested under LIFE PREPAIR. Importantly, our results show that nitrogen loads in fields from mineral fertilizers are comparable to those from manure (~67–68 kg N/ha), highlighting the need for integrated strategies targeting both sources.
Considering recent external shocks, such as the COVID-19 pandemic and the war in Ukraine, which have affected fertilizer markets and availability, the capacity to model different nitrogen management scenarios becomes even more relevant for resilience and sustainability planning []. By combining agronomic, environmental, and socio-economic dimensions, the BAT-Tool can support both short-term mitigation and long-term structural change in the Po Valley’s agri-food system.
5. Conclusions
The results of this study confirm the reliability of the BAT-Tool as a robust and standardized model for estimating nitrogen and ammonia flows at both the farm and regional levels. By integrating farm-specific practices with a nitrogen mass balance approach, the tool provides emission factors that are consistent, transparent, and well adapted to the intensive livestock systems of the Po-basin. This represents a significant advancement compared to default methodologies, ensuring that estimates reflect the actual management techniques adopted in the field.
The scalability of the approach highlights the potential for replication in other Italian regions and in European contexts where intensive livestock production contributes substantially to air pollution and nitrogen surpluses. By enabling both farm-level assessments and regional-scale inventories, the BAT-Tool can become a reference model for harmonized nitrogen management strategies across the EU.
At the same time, the findings underscore the urgency of integrated policies for sustainable agriculture and air quality improvement in the Po Valley. Ammonia emissions remain a dominant precursor of PM2.5 formation, with considerable implications for public health and environmental costs. Aligning agricultural policies under the Industrial Emissions Directive, the Nitrates Directive, and emerging frameworks for climate mitigation is therefore crucial to ensure consistency and maximize environmental benefits.
In terms of development stage, the BAT-Tool has already reached operational maturity for application in the Lombardy context and across the Po-basin. However, future improvements are required to strengthen its effectiveness and policy relevance. These may include (i) improving the connection of the BAT-Tool with existing regional and national databases; (ii) incorporating BAT-Tool data into the EU framework as a methodological basis for the evaluation of the nitrogen and carbon cycles; (iii) further investigating the effect of the measures on specific pollutant emissions following the evolution of knowledge and regulations (e.g., methane); and (iv) exploring “win–win” strategies that simultaneously reduce NH3 and CO2 emissions.
In conclusion, the BAT-Tool not only provides a reliable system for monitoring nitrogen flows but also offers a forward-looking platform to guide technological innovation, regulatory convergence, and sustainable agricultural practices. Strengthening its development and integration into European policy frameworks would be useful for promoting both environmental protection and the resilience of agri-food systems in the Po Valley and beyond.
In general terms, the knowledge tools implemented are important because they allow the evaluation of the best combination of interventions that adapts to the context for reduced emissions, both on a larger scale (definition of a national or regional regulatory framework or of the incentive policies) and on a single-company scale (definition of production and technological structures to meet certain regulatory or performance standards). This also allows for a better possibility of building databases and defining the standards desired by decision makers.
Many of the possible interventions for reducing emissions in livestock farming, especially those concerning structural aspects, require significant economic resources. In the context of a sector like agriculture, which benefits from several specific lines of financing for the operation and requalification of production, funding interventions to reduce emissions requires appropriate attention.
But technical analysis and incentives are not enough: as reported in a recent release, several barriers to change have been identified, including limited knowledge of available alternatives, the habit of using traditional practices, a lack of understanding of the potential savings and efficiency derived from the virtuous use of fertilizers, and difficulty in finding alternative products. It is therefore necessary to implement training and information activities throughout the supply chain, especially for farmers, and to also foster dialogue with public administration.
Operator involvement can also contribute to the removal of cultural barriers to innovation and the success of professional training initiatives. Training is essential, especially starting in schools.
It is important for institutions to foster the creation of a system that offers technical consultancy to businesses. But training and information initiatives are also important for citizens, as they can develop an awareness of the connection between air quality and agricultural techniques. This can also encourage more informed choices among citizens towards products with a lower environmental impact, thus providing the production sector with further motivation.
Author Contributions
Conceptualization, D.V., A.M. and M.B. methodology, A.M.; software, M.B.; validation, D.V., A.M. and M.B.; formal analysis, A.M.; investigation, A.M.; resources, M.B.; data curation, A.M. and M.B.; writing—original draft preparation, D.V.; writing—review and editing, D.V., A.M. and M.B.; visualization, D.V.; supervision, D.V. All authors have read and agreed to the published version of the manuscript.
Funding
This research was funded by the LIFE-IP PREPAIR (Po Regions Engaged to Policies of AIR) project, Grant Number LIFE15 IPE/IT/000013.
Institutional Review Board Statement
Not applicable.
Informed Consent Statement
Not applicable.
Data Availability Statement
The data presented in this study are available on request from the corresponding author due to the limitations of the project.
Acknowledgments
Acknowledgments are given to all the beneficiaries of the LIFE-IP PREPAIR project: Emilia-Romagna Region (Project Coordinator) Veneto Region, Lombardy Region, Piedmont Region, Friuli Venezia Giulia Region, Autonomous Province of Trento, Regional Agency for Environment of Emilia-Romagna (ARPAE), Regional Agency for Environment of Veneto, Regional Agency for Environment of Piedmont, Regional Agency for Environmental Protection of Lombardy, Environmental Protection Agency of Valle d’Aosta, Environmental Protection Agency of Friuli Venezia Giulia, Slovenian Environment Agency, Municipality of Bologna, Municipality of Milan, City of Turin, ART-ER, and Lombardy Foundation for Environment. The authors have reviewed and edited the output and take full responsibility for the content of this publication. Acknowledgments are given to ENEA, dott.ssa Ilaria d’Elia and dott. Antonio Piersanti and to CRPA Soc. cons. p. A.- centro ricerche produzioni animali. The authors wish to acknowledge the support of dott.ssa Anna Gilia Collalto for the important contribution to the definition of local emission factors and main indicators.
Conflicts of Interest
The authors declare no conflicts of interest.
References
- REGULATION (EU) 2024/1244 of the European Parliament and of the Council of 24 April 2024 on Reporting of Environmental Data from Industrial Installations, Establishing an Industrial Emissions Portal and Repealing Regulation (EC) No 166/2006.
- DGR Regione Lombardia n. 1926/2019 and ARPAE Guidelines Det-2020-337, Additional Instructions for E-PRTR Declaring Farms. Available online: https://www.isprambiente.gov.it/it/attivita/aria-1/emissioni-in-atmosfera/dichiarazione-prtr-2025-dati-2024 (accessed on 9 September 2025).
- Region Emilia-Romagna DGR n. 2385 of 23/12/2024.
- Air Quality Plans: Council Deliberations of Emilia-Romagna Regione n. 152/2024 (PAIR2030) and of Piedmont Region n. 284/2023 (Agriculture air quality plan). Available online: https://www.terraria.com/en/case-studies/pair-2030/ (accessed on 9 September 2025).
- ISPRA. Italian Emission Inventory 1990–2023; Informative Inventory Report 2025; Report 410/2025; ISPRA: Rome, Italy, 2025. [Google Scholar]
- CTN_ACE. Linee Guida Agli Inventari Locali di Emissioni in Atmosfera; RTI CTN_ACE 3/2001; Agenzia Nazionale per la Protezione dell’Ambiente: Rome, Italy, 2001. [Google Scholar]
- De Lauretis, R.; Taurino, E.; Angelino, E.; Antognazza, F.; Caserini, S.; Clemente, M.; Tomazzolli, V.; Votano, A.; Susanetti, L.; Pinat, T.; et al. Emissioni in Atmosfera. In Qualità Dell’ambiente Urbano VIII Rapporto Edizione 2012; ISPRA: Rome, Italy, 2012; pp. 138–143. [Google Scholar]
- SNPA. Inventari Regionali Delle Emissioni in Atmosfera e Loro Articolazione a Livello Locale. Available online: https://www.isprambiente.gov.it/files/snpa/consiglio-federale/DOC78_CFInventariemisisoniinatmconallegati.pdf (accessed on 9 September 2025).
- AgrEE Tool—Agricultural Emission Estimation Tool. Available online: https://www.tfeip-secretariat.org/_files/ugd/e5a9c7_eee53299f86948edac11147fc7134390.pdf (accessed on 9 September 2025).
- EMEP/EEA. Air Pollutant Emission Inventory Guidebook 2023: Technical Guidance to Prepare National Emission Inventories; EMEP/EEA: Copenhagen, Denmark, 2023. [Google Scholar]
- IPCC. Refinement to the 2006 IPCC Guidelines for National Greenhouse Gas Inventories; IPCC: Geneva, Switzerland, 2019. [Google Scholar]
- ALFAM2 Project—Ammonia Loss from Field-Applied Manure. Available online: https://projects.au.dk/alfam (accessed on 9 September 2025).
- Hafner, S.D.; Pacholski, A.; Bittman, S.; Burchill, W.; Bussink, W.; Chantigny, M.; Sommer, S.G. The ALFAM2 database on ammonia emission from field-applied manure: Description and illustrative analysis. Agric. For. Meteorol. 2018, 258, 66–79. [Google Scholar] [CrossRef]
- FarmAC Model. Available online: https://www.farmac.dk (accessed on 9 September 2025).
- Aether, U.K. Available online: https://aether-uk.com/ (accessed on 9 September 2025).
- DATAMAN—A Database of Greenhouse Gas Emissions from Manure Management. Available online: https://www.dataman.co.nz/?AspxAutoDetectCookieSupport=1 (accessed on 9 September 2025).
- Hassouna, M.; van der Weerden, T.J.; Beltran, I.; Amon, B.; Alfaro, M.A.; Anestis, V.; Simon, P. DATAMAN: A global database of methane, nitrous oxide, and ammonia emission factors for livestock housing and outdoor storage of manure. J. Environ. Qual. 2023, 52, 207–223. [Google Scholar] [CrossRef] [PubMed]
- Beltran, I.; van der Weerden, T.J.; Alfaro, M.A.; Amon, B.; de Klein, C.A.; Grace, P.; Velthof, G.L. DATAMAN: A global database of nitrous oxide and ammonia emission factors for excreta deposited by livestock and land-applied manure. J. Environ. Qual. 2021, 50, 513–527. [Google Scholar] [CrossRef]
- Van der Weerden, T.J.; Noble, A.; de Klein, C.A.M.; Hutchings, N.; Thorman, R.E.; Alfaro, M.A.; Velthof, G.L. Ammonia and nitrous oxide emission factors for excreta deposited by livestock and land applied manure. J. Environ. Qual. 2012, 50, 1005–1023. [Google Scholar] [CrossRef] [PubMed]
- Van der Weerden, T.J.; Noble, A.N.; Beltran, I.; Hutchings, N.J.; Thorman, R.E.; De Klein, C.A.M.; Amon, B. Influence of key factors on ammonia and nitrous oxide emission factors for excreta deposited by livestock and land-applied manure. Sci. Total Environ. 2023, 889, 164–173. [Google Scholar] [CrossRef] [PubMed]
- Webb, J.; van der Weerden, T.J.; Hassouna, M.; Amon, B. Guidance on the conversion of gaseous emission units to standardized emission factors and recommendations for data reporting. Carbon Manag. 2021, 12, 663–679. [Google Scholar] [CrossRef]
- ENEA. Strumenti per il Calcolo Delle Emissioni Ammoniacali in Agricoltura e Zootecnica. Available online: https://www.espa.enea.it/prodotti-e-servizi/strumenti-per-il-calcolo-delle-emissioni-ammoniacali-in-agricoltura-e-zootecnica.html (accessed on 9 September 2025).
- BAT-Tool Software and User Manual. Available online: https://www.lifeprepair.eu/index.php/azioni/air-quality-and-agriculture/#toggle-id-2 (accessed on 17 September 2025).
- BDN-Anagrafe Nazionale Zootecnica. Available online: https://www.vetinfo.it/j6_statistiche/# (accessed on 9 September 2025).
- Marongiu, A.; Angelino, E.; Moretti, M.; Malvestiti, G.; Fossati, G. Atmospheric emission sources in the Po-basin from the LIFE-IP PREPAIR project. Open J. Air Pollut. 2022, 11, 70–83. [Google Scholar] [CrossRef]
- Marongiu, A.; Colombo, L.; Collalto, A.G. Dynamic emission inventory of ammonia in northern Italy by machine learning. Air Qual. Atmos. Health 2025. [Google Scholar] [CrossRef]
- ISTAT. Banca Dati Agricoltura. Available online: http://agri.istat.it/sag_is_pdwout/index.jsp (accessed on 9 September 2025).
- Collalto, A.G.; Marongiu, A.; Angelino, E. Rassegna ed analisi delle variabili che influenzano le emissioni di ammoniaca dal settore zootecnico. Ing. Dell’ambiente 2024, 10, 492. [Google Scholar] [CrossRef]
- LIFE-IP PREPAIR—Air Quality and Agriculture, Action C4 Final Report. Available online: https://www.lifeprepair.eu/index.php/azioni/air-quality-and-agriculture/#toggle-id-1 (accessed on 17 September 2025).
- Veratti, G.; Stortini, M.; Amorati, R.; Bressan, L.; Giovannini, G.; Bande, S.; Pillon, S. (Impact of NOx and NH3 emission reduction on particulate matter across Po Valley: A LIFE-IP PREPAIR study. Atmosphere 2023, 14, 762. [Google Scholar] [CrossRef]
- Colombo, L.; Marongiu, A.; Fossati, G.; Malvestiti, G.; Angelino, E. PM2.5 wintertime sensitivity to changes in NOx, SO2, and NH3 emissions in Lombardy region. Air Qual. Atmos. Health 2024, 17, 1451–1466. [Google Scholar] [CrossRef]
- Colombo, L.; Marongiu, A.; Malvestiti, G.; Fossati, G.; Angelino, E.; Lazzarini, M.; Gurrieri, G.L.; Pillon, S.; Lanzani, G.G. Assessing the impacts and feasibility of emissions reduction scenarios in the Po Valley. Front. Environ. Sci. 2023, 11. [Google Scholar] [CrossRef]
- Council Directive 91/676/EEC of 12 December 1991 Concerning the Protection of Waters Against Pollution Caused by Nitrates from Agricultural Sources (Nitrates Directive), Annex III, point 2b. Off. J. Eur. Communities 1991, 375, 1–8. Available online: https://eur-lex.europa.eu/legal-content/EN/TXT/?uri=CELEX:31991L0676 (accessed on 17 September 2025).
- Carozzi, M.; Ferrara, R.M.; Acutis, M.; Rana, G. Dynamic of ammonia emission from urea spreading in Po Valley (Italy): Relationship with nitrogen compounds in the soil. In Proceedings of the 17th International Nitrogen Workshop, Wexford, Ireland, UK, 26–29 June 2012; pp. 1–4. [Google Scholar]
- Agrimonia Consortium. Agrimonia: A Dataset on Livestock, Meteorology and Air Quality in the Lombardy Region, Italy. Available online: https://arxiv.org/abs/2210.10604 (accessed on 17 September 2025).
Disclaimer/Publisher’s Note: The statements, opinions and data contained in all publications are solely those of the individual author(s) and contributor(s) and not of MDPI and/or the editor(s). MDPI and/or the editor(s) disclaim responsibility for any injury to people or property resulting from any ideas, methods, instructions or products referred to in the content. |
© 2025 by the authors. Licensee MDPI, Basel, Switzerland. This article is an open access article distributed under the terms and conditions of the Creative Commons Attribution (CC BY) license (https://creativecommons.org/licenses/by/4.0/).