Abstract
Tourism is a fast-growing sector that generates a significant greenhouse gas (GHG) footprint, yet subnational data needed to measure the sector remain scarce. Quantifying tourism-related emissions is essential for effective climate policy and alignment with international targets. This study contributes to quantifying tourism sector GHG emissions using the 2023 Korean National Travel Survey data and a spend-based environmentally extended input–output (EEIO) model. Expenditure data were mapped onto the 33-sector multiregional EEIO framework, estimating a total of 2623 tCO2eq emissions by region, expenditure type, and industry sector in 2023, where about 73% of the total was attributed to tourism-related sectors with the sample data, 24,282. The results illustrate how tourism emissions are shaped especially by transportation systems and regional context. Provinces that surround metropolitan cities in the mainland, for example, Gyeonggi and Gangwon Provinces near Seoul and Incheon, and Gyeongnam Province neighboring Busan and Ulsan, record higher emissions due to large travel volumes from these metropolitan cities and energy-intensive transportation services. Jeju Island stands out as an outlier, with disproportionately high emissions relative to its size, driven by reliance on aviation, which significantly raises its per-visitor footprint. Sectoral analysis identified transportation services, agriculture, electricity, and gas as key sectors. By providing detailed provincial-level data, this study offers a first empirical foundation to corporate Category 6 of Scope 3 reporting and supports central and local governments in designing region-specific climate strategies associated with tourism-related sectors.
1. Introduction
Tourism has become one of the world’s fastest-growing industries, but with its economic benefits comes a substantial environmental cost. In 2019, the global tourism sector was responsible for approximately 5.2 GtCO2eq(=5.2 × 10⁹ tCO2eq)—nearly 8.8% of total global greenhouse gas (GHG) emissions—and its footprint continues to grow at an annual rate of 3.5% [1]. These emissions primarily arise from transportation, accommodation, and food services, reflecting the energy- and resource-intensive nature of tourism activities. As international and domestic tourism expands, their role in climate change mitigation has become increasingly critical.
Quantifying GHG emissions from tourism is essential for designing effective mitigation strategies, setting sustainability targets, and supporting evidence-based policymaking. Without robust quantification, policymakers and businesses alike face blind spots in assessing the true environmental costs of tourism and cannot adequately align with global climate commitments such as the Paris Agreement and the Sustainable Development Goals [2]. However, tourism-related GHG estimation remains fragmented. While studies for global and national assessments are available, detailed subnational data and reliable provincial-level models remain scarce [3,4,5]. The research gap is critical, as regional variations in industrial structure, energy supply mix, and transportation infrastructure can lead to significantly different environmental impacts even for the same level of tourism activity [5,6]. To date, most regional studies have been fragmented, concentrating on a single province or a specific sector, such as accommodation [5,7]. Further, reliance on disparate methodologies, including top-down and life cycle approaches, prevents direct comparison of findings [8,9]. This lack of standardized, region-specific data creates a dual challenge: hindering the formulation of effective, tailored environmental policies by local governments and complicating the increasingly mandatory reporting of Scope 3, Category 6 emissions involved within corporate value chains [10].
The novelty of this study lies in its first comprehensive, provincial-level quantification of domestic tourism emissions in South Korea. The approach synthesized two key resources: the latest 2023 Korean National Travel Survey data [11] and a detailed, provincial-level multiregional Environmentally Extended Input-Output (EEIO) model [12]. This study established a consistent and replicable methodology for subnational emissions accounting by adapting the globally recognized GHG Protocol Scope 3, Category 6 framework—a standard typically applied to corporate business travel—to the broader context of regional domestic tourism. This EEIO-based approach moves beyond the limitations of simple activity-based methods by capturing the full scope of indirect emissions embedded across entire supply chains [13], thereby offering a comprehensive, regionally differentiated perspective that current literature lacks.
Under the GHG Protocol, Scope 3 encompasses “other indirect emissions” generated throughout an organization’s value chain. Within Scope 3, Category 6 refers specifically to business travel, which includes emissions from third-party transportation, accommodations, and meals [10]. Although Category 6 is typically applied to corporate business travel, the methodological approach offers a useful proxy when assessing broader tourism-related emissions because both involve similar expenditure categories and indirect emissions sources. However, quantifying Category 6 emissions is challenging due to fragmented data, methodological inconsistencies, and variations in emission factors [14]. By applying this framework to tourism, this study demonstrated how an established corporate accounting method could be repurposed for regional tourism emissions assessment.
Therefore, the main objectives of this study are to quantify total GHG emissions from Korean domestic tourism expenditure in 2023, adapting the framework for Scope 3, Category 6 of the GHG Protocol. Specifically, the study aims to analyze the emissions profile by province (17 Si/Do level), expenditure type (transportation, accommodation, and food and beverage), and industry sector (33 sectors) to identify key emissions hotspots. Additionally, to assess the sensitivity of the estimates, this study compared differences in GHG emissions by region and by sector when expenditure types changed by ±5~10%. Finally, it validated the methodological robustness by comparing the Korean results with a recognized international benchmark study, specifically the Massachusetts Institute of Technology (MIT) report on business travel emissions.
In doing so, three contributions can be summarized as follows: (1) providing the first provincial-level quantification of GHG emissions from Korean domestic tourism; (2) validating findings against the MIT benchmark study to ensure methodological robustness; and (3) highlighting implications for regional policy, corporate ESG strategies, and global tourism sustainability research.
The paper is organized as follows: Section 2 provides background on tourism’s carbon footprint studies that includes literature, GHG protocol’s scope 3 and category 6, and methods measuring GHG emissions for category 6. Section 3 explains the data and the model, and Section 4 follows the results, sensitivity analysis, and validation. Section 5 discusses the main results and concludes, and Section 6 comprehensively discusses the limitations of the study and future research directions.
2. Background
2.1. Tourism’s Carbon Footprint
Quantifying the carbon footprint of tourism is critical for effective climate mitigation and sustainable development. A growing amount of literature on this subject has sought to estimate the impacts across different geographical scales. Table 1 and Table 2 summarize key studies on tourism’s carbon footprint, including their geographical focus, methodological approach, and main findings.
Tourism’s contribution to GHG emissions has been well established in global and national studies. Tourism accounted for 8% of global emissions between 2009 and 2013, with transportation and accommodation identified as dominant contributors [3]. Factors such as increased incomes, consumption patterns, and globalization have reinforced emissions growth in the tourism sector [1,4]. At the national level, Ref. [15] applied an input–output approach to Spain, while Ref. [16] estimated Iceland’s consumption-based footprint; both studies showed the significance of tourism in national carbon inventories. It is, however, worth noting that tourism can complicate national emissions accounting, shifting its impacts across borders [17,18].
By contrast, regional and subnational studies remain relatively rare. In China, interprovincial tourism emissions have been analyzed [5,7]. In Korea, emissions for Jeju and Busan have also been analyzed [6,19]. These studies illustrated the value of region-specific perspectives, still remaining fragmented and often methodologically inconsistent. Most rely on top-down or life cycle approaches that limit comparability across regions and make it difficult to capture indirect emissions embedded in supply chains.
The rarity and difficulty of regional-level studies stem from several limitations. First, reliable subnational data on tourism expenditures and energy use are limited, restricting the feasibility of detailed carbon accounting [7]. Second, methodological approaches differ substantially, ranging from spend-based EEIO to activity-based and life cycle assessments (LCA), making cross-study comparisons difficult [8,9]. Third, variations in emission factors across time, industries, and locations further reduce consistency, a problem also noted in broader Scope 3 estimation research [14]. As a result, despite progress at global and national levels, no standardized approaches to capturing the carbon footprint of tourism at subnational scales have been introduced.
This study addressed these challenges. By adapting the methodology developed by the Massachusetts Institute of Technology (MIT) for estimating Scope 3, Category 6 emissions from business travel [20], this approach is grounded in the GHG Protocol. It applies expenditure data to sector-specific emission factors and calculates indirect emissions via multiregional EEIO as a consistent, quantitative tool. By extending this framework to Korean domestic tourism, this study provided the provincial-level estimates that can be analyzed by region, industry, and expenditure type for the first time.

Table 1.
Studies on Estimating GHG Emissions from Tourism Activities (1).
Table 1.
Studies on Estimating GHG Emissions from Tourism Activities (1).
| Studies | [21] | [15] | [8] | [9] | [16] | [3] |
|---|---|---|---|---|---|---|
| Subjects | Italy Lake District AHI Travel case study | Spanish tourism | EPFL Academic Air Travel | Australian hotel business | Iceland | Global Tourism (160 countries) |
| Period | 2023 | 1995–2007 | 2014–2016 | 2015 | 2010–2012 | 2009–2013 |
| GHG Methods | · GHG Protocol Activity-Based -Land based | · LCA–IO | · Activity-based (DEFRA) | · EEIO vs. LCA | · Eora MRIO-based (Consumption-based) | · MRIO + TSA (Consumption-based) |
| Main Results | · Economy Class: ~50% off · 5-star to 4-star accommodations: 57% off | · Large contribution from construction, infrastructure, and imported machinery/equipment | · Aviation accounts for ~1/3 of corporate CO2eq · The top 10% causes ~60% | · LCA 3.890 vs. EEIO 3.488 kgCO2eq (similar) | · National: 22.5 t/person, ~55% increase compared to PBCF | · Tourism CF 3.9→4.5 GtCO2eq · ~8% of the global total · Transportation, Shopping, Food and Beverage |
Notes: (1) The authors summarized the published studies by category: subjects, period, GHG methods, and main results. (2) 1 GtCO2eq = 109 tCO2eq, 1 kgCO2eq = 10−3 tCO2eq.
Table 2.
Studies on Estimating GHG Emissions from Tourism Activities (2).
Table 2.
Studies on Estimating GHG Emissions from Tourism Activities (2).
| Studies | [22] | [4] | [5] | [7] | [19] | [6] |
|---|---|---|---|---|---|---|
| Subjects | Iceland | G20 Tourism | Gansu Province Tourism, China | Inter-provincial China | Jeju Island Eco-Tourism Course | Busan tourism industry |
| Period | 2010–2015 | 2019–2021 | 1997–2016 | 2002–2022 | 2014 | 2015 |
| GHG Methods | · Hybrid (LCA/IO + Activity) | · Country TSA/OECD + MRIO | · Inter-provincial EEIO and Eco-efficiency | · EEIO + Super-SBM | · LCA | · Energy IO, · Tourist Satellite Account (TSA) |
| Main Results | · Average 1.35 tCO2eq/person · Total 0.6→1.8 MtCO2eq · Aviation 50–82% | · A sharp decline in 2020 · A variably recovering economy in 2021 · Transportation dominates. | · Hotels dominate indirect emissions · Food and tobacco manufacturing contribute significantly | · Main sources of indirect emissions: food and tobacco · Decoupling in progress | · Accommodation (235,939 tCO2eq) Transportation (20,798 tCO2eq) Ecotourism (4178 tCO2eq) | · Wholesale and retail and commodity brokerage services > Road transport > Air transport |
Notes: (1) The authors summarized the published studies by category: subjects, period, GHG methods, and main results. (2) 1 MtCO2eq = 106tCO2eq.
2.2. GHG Accounting Frameworks: Scope 3, Category 6
GHG accounting is the process of quantifying GHG emissions from the activities of an entity (e.g., a company, government, or region) within a given scope. The GHG Protocol, developed by the World Resources Institute (WRI) and the World Business Council for Sustainable Development (WBCSD), is the most widely used framework for corporate emissions accounting [10,23], categorizing emissions into three scopes: Scope 1 (direct), Scope 2 (indirect from purchased electricity and energy), and Scope 3 (all other indirect). Scope 3 is further divided into 15 categories, where Category 6 covers business travel.
Category 6 includes emissions from third-party services such as air travel, rail, long-distance buses, taxis, rental cars, hotels, and meals [14]. Quantifying the emissions is challenging due to fragmented data sources, inconsistent emission factors, and boundary ambiguities. Despite these difficulties, Scope 3 reporting is becoming increasingly important, with several jurisdictions, including the EU, Australia, and Korea, moving toward mandatory disclosure. Though often used interchangeably in general discourse, a precise distinction between the terms ‘emission’ and ‘carbon footprint’ (CF) [24] lies in the following: the former refers to the direct physical release of specific GHGs such as CO2, CH4, and N2O from an activity. In contrast, the latter is an aggregated, standardized metric representing the total amount of all relevant direct and indirect GHG emissions across a service or product’s life cycle. To quantify this impact uniformly, the CF converts all component GHG emissions into CO2eq units using each gas’s Global Warming Potential. This CF accounting framework is what this study applies to the tourism sector. Although it is still designed for corporate travel, Category 6 provides a useful framework for tourism-related emissions, since both involve expenditures on transportation, accommodation, and food and beverage (F&B) services that were methodologically parallelled by [20].
2.3. Measuring Carbon Footprints in Category 6
Several approaches have been developed to quantify the Scope 3 emissions, including Category 6, each with distinct advantages and limitations. Table 3 presents four approaches commonly used to estimate the Scope 3 emissions: spend-based, activity-based, LCA, and hybrid methods. For each approach, the table outlines its meaning, key strengths, major limitations, data requirements, general estimation bias, suitability at the provincial scale, and examples.
The most widely applied is the spend-based approach, which multiplies monetary expenditures by industry- or service-specific emission factors. This method is straightforward to apply and requires only annual accounting financial data, making it particularly useful when detailed travel activity data are unavailable. However, its reliance on generalized dollar-based emission factors limits accuracy, as it may not reflect regional variations in energy intensity or service characteristics [9]. For the spend-based approach, data such as financial expenditure records, mapped industrial sectors, and average emission factors per monetary unit are used. However, this approach fails to reflect differences in the emission intensities of individual products and processes and is sensitive to price fluctuations. The MIT study on business travel emissions exemplifies the effectiveness of the spend-based approach to institutional accounting [20].
By contrast, activity-based approaches estimate emissions by applying emission factors to physical measures such as distance traveled or fuel consumed. These methods enable more precise differentiation among transportation modes, routes, and service classes [8]. However, they are data-intensive, often require cooperation with carriers and agencies, and can be burdensome to implement for large populations or dispersed travel activities. Also, missing data risks underestimation, making it difficult to fully cover the entire supply chain.
A third, LCA approach, considers emissions across the full life cycle of travel-related services. LCA is particularly valuable when analyzing the detailed process impacts of infrastructure, energy supply chains, and service provision that are known. Nonetheless, the method is resource-intensive and constrained by the availability of detailed life cycle inventory data for specific processes, products, and/or regions [19]. This comprehensively requires a full life cycle inventory of a product or process (inputs and outputs at each stage, energy use, transportation, etc.); however, depending on the system boundary setting, sizable truncation errors can occur.
Finally, hybrid approaches integrate elements of the above methods to balance data availability with analytical precision. For example, emissions from flights may be calculated through activity-based data, while expenditures on accommodation and meals are estimated through spend-based factors [4]. While hybrid models improve flexibility, they introduce complexity in maintaining consistent boundaries and assumptions across different methodological components [17]. The hybrid approach shares some of the drawbacks of both methods, and complex data linking can lead to inconsistency issues and the risk of duplicate calculations.
Given the absence of detailed distance or fuel data for Korean domestic tourism and the practical limitations of applying LCA or hybrid models at a provincial scale, this study employed the spend-based EEIO approach. This choice ensures consistency with the MIT benchmark study while providing a feasible framework for regional-level analysis with the latest EEIO model construction process using the Flexible Input-Output approach [25,26,27,28].
The calculation methodology links CF directly to expenditures on tourism activities within the GHG Protocol’s Scope 3, Category 6 boundary. The core activities informing the calculation are the three major expenditure categories from the National Travel Survey: (1) Transportation (e.g., air, rail, road, water); (2) Accommodation (e.g., hotels, vacation cottages); and (3) F&B (e.g., dining-out and groceries). By integrating these expenditures with the comprehensive EEIO model, the study captures not only the immediate GHG impact of these Category 6 activities but also the upstream indirect emissions embedded in the supply chains, such as those from the Agriculture and Electricity, gas, and steam sectors that supply the food and accommodation industries.
Table 3.
Four Approaches to Calculating Scope 3 Carbon Footprint.
Table 3.
Four Approaches to Calculating Scope 3 Carbon Footprint.
| Criteria | Spend-Based | Activity-Based | LCA | Hybrid |
|---|---|---|---|---|
| Method | Expenditure × industry/service-specific EF | · Distance-based: travel distance × transport mode EF · Fuel-based: fuel consumption × fuel EF | Apply product/service full life cycle | Combine two or more methods |
| Pros | · Easy data collection · Fast calculation | · Higher accuracy · Can reflect transport mode, route, seat class · Easier verification | · Covers the entire supply chain · Detailed analysis by material/energy flows | · Balances accuracy with data availability · Allows optimal method per segment |
| Cons | · Lower accuracy · Affected by exchange rates and inflation · Limited reflection of regional/service characteristics | · High data collection burden · High cost to build data/model · Lack of LCI data · Cannot calculate if key details are missing | · High cost to build data/model · Lack of LCI data | · Consistency in boundaries and assumptions is challenging · More complex to implement |
| Data required | · Financial expenditure records · Mapped to economic sectors · Industry average emissions per monetary unit | · Detailed physical activity data · Example: fuel consumed, kWh electricity, km traveled, tonnes of material, etc. | · Comprehensive life cycle inventory data for products/processes · inputs, outputs, energy use, transport at each stage of the product’s life cycle | · A mix of data: supplier or process-specific activity data, secondary data (either process-based or economic input-output factors |
| Typical Bias | · Emission intensity not reflected · sensitive to price fluctuations | · Risk of underestimation if data is missing · difficulty in covering all supply chain activities | · Truncation errors due to boundary setting | · Some of the drawbacks of both methods · Complex data linking, potential double-counting, or distortion |
| Suitability at the provincial scale | Suitable at the provincial scale, but constructing provincial EEIO may be challenging for a country | Suitable, but collecting local data is a challenge | Not suitable due to data limitations | Suitable, if combining Spend-based and Activity-based, while still challenging to collect provincial data. |
| Example | MIT business travel (transport/accommodation/food) by [20] | Business travel emissions by distance from airline/rail data (e.g., WRI practical case) | Flight life cycle analysis to estimate route-specific emissions (e.g., ICAO LCA study) | Flights via activity-based, accommodation & meals via spend-based (e.g., [29]) |
Note: The authors summarized the pros and cons of each approach to the Scope 3 calculation with examples.
2.4. Provincial-Level EEIO Model
The Environmentally Extended Input-Output (EEIO) model has emerged as a powerful tool for estimating the carbon footprint of tourism. EEIO extends traditional input–output analysis by incorporating environmental coefficients, thereby capturing both direct and indirect emissions across supply chains [13,17,30,31]. Unlike LCAs, which are often case-specific and data-intensive in the production process, EEIO provides economically systematic coverage across industries, making it appropriate for application in the tourism context, where expenditures cut across multiple sectors and quantifies the supply chain emissions from purchased accommodation, transportation, and F&B that aligns well with the requirements of GHG Protocol Scope 3 Category 6 not covered in Scope 1 or 2.
EEIO for the tourism industry at the provincial level has been applied primarily in China, while its applications remain limited. Ref. [5] applied a provincial-level EEIO model combined with Data Envelopment Analysis (DEA) to examine tourism’s eco-efficiency in Gansu Province, China, while Ref. [7] extended this framework to analyze the hotel sector across multiple Chinese provinces using a super-SBM model. They both showed how provincial EEIO can capture indirect emissions and provide regionally differentiated insights into tourism’s environmental performance. However, their scope and applicability remain limited due to a single-province application [5] or a narrow concentration on accommodation only, excluding transportation and food-related expenditures [7].
In South Korea, no EEIO applications to tourism have been studied: LCA analyzing ecotourism in Jeju [19] and a top-down approach for tourism in Busan [6], both confining to an individual region rather than offering a multiregionally interconnected national framework. By applying recent advancements in Korea’s multiregional EEIO model that covers 17 provinces and 33 industrial sectors as a core operation EEIO, now updated to the year 2024 with a detailed 380-sector system [12], the core provincial-level multiregional EEIO was adapted to Korean domestic tourism expenditure data, providing a unique and detailed regional assessment of tourism’s carbon footprint in Korea. Addressing an important gap in the literature for the EEIO application to tourism-related emissions, this study analyzed tourism activity types matched to local industrial structures and transportation infrastructure and assessed subnational GHG emissions, providing insights for policymakers and businesses to support targeted decarbonization strategies at both the local and national levels.
3. Research Framework, Data, and Methodology
The study’s research framework begins with data collection. After mapping to match different sectors by data source with the Korean economic sector system that is officially provided by the Bank of Korea and developing the Korean EEIO that is a fundamental economic and emission sectors framework, empirical analysis and validation have been conducted. Figure 1 summarizes the research framework (For basic data cleaning and chart creation, this study used Excel 2019 and Python 3.13 for data management and EEIO analysis).
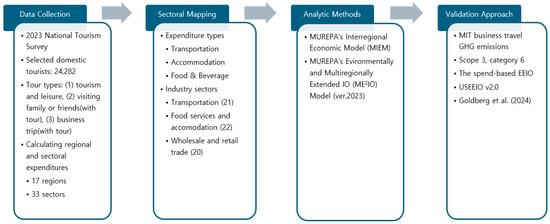
Figure 1.
Research Framework.
3.1. Data Collection, Preparation, and Sectoral Mapping
This study was conducted with the ⌊2023 National Travel Survey⌋ to calculate domestic tourist spending by type (transportation, accommodation, and F&B) across 17 cities and provinces. The National Travel Survey is a nationally approved statistic conducted and published by the Ministry of Culture, Sports and Tourism of Korea. The survey items include total travel volume, travel behavior, accommodation, spending on shopping items at travel destinations, travel evaluation, travel constraints, and demographic characteristics. Data are collected through face-to-face household interviews, in which one eligible individual aged 15 years or older is selected from each sampled household. The survey is conducted monthly, and the data analyzed in this study were selected for the year 2023 (January to December). The survey is the most recent dataset available at the time of analysis and aligns with the 2023 reference year used by [20], which serves as a benchmark for this study.
For the purposes of this analysis, a “domestic tourist” refers to individuals who reported at least one domestic trip during the survey month, where domestic tourism encompasses three types of travel: (1) tourism and leisure, (2) visiting family or friends that includes tourism or leisure activities, and (3) business trips that also include tourism or leisure activities [11]. This analysis is limited to Korean residents; therefore, foreign inbound tourists and Koreans’ overseas trips are not included. This study only included respondents engaged in at least one of the three included activities and excluded expenditures unrelated to tourism, such as purely work-related or non-leisure family visits, while it may impose certain limitations. This expenditure will account for approximately 94% of the total expenditure [32]. While the dataset relies on self-reported survey responses rather than direct activity data, it has merit because it provides detailed and reliable information on transportation, accommodation, and F&B expenditures, which account for about 86% of the total expenditure. The total number of domestic tourists included in the 2023 expenditure calculations is 24,282 out of a total sample of 52,111.
Regional expenditures were calculated as follows. First, expenditures are categorized into transportation, accommodation, and F&B item types. The expenditure excludes transportation, accommodation, and meals bundled with tour-agency package products. Specifically, the transportation item includes railways, air, water, roads, rental cars, and private cars. The accommodation item includes hotels, vacation cottages, camping, guesthouses, and private lodging. F&B is composed of the sum of total restaurant expenses and total grocery expenses among the travel expenditure items. The restaurant type includes general restaurants, pubs, bars, teahouses, and bakeries. The grocery type includes street food from convenience stores, supermarkets, department stores, rest areas, and markets.
Additionally, the questionnaire distinguishes between lodging and visiting regions. The number of visits to each region was counted, and then, lodging, transportation, and F&B expenditures were proportionally allocated to each region. Accommodation costs were allocated based on the area of stay, while transportation and F&B expenditures were allocated based on the area visited. For example, for respondents in Seoul, accommodation costs were calculated as “Total Accommodation Cost × (Number of Nights Stayed in Seoul/Total Number of Nights Visited).” Conversely, transportation and F&B expenditures were calculated based on the number of visits. Accordingly, “Total Transportation Cost × (Number of Visits to Seoul/Total Number of Visits)” was calculated, and F&B expenditures were also calculated based on the number of visits. This is performed for all respondents and then aggregated for each region to be used as input data for regionally specific activity types.
Table 4 presents the total spending by type and region of domestic tourist travelers for one year, based on the respondents in the survey. An annual average spending amount per person in the sample is about 0.277 million KRW, which only accounts for tourism and leisure activities as well as the three item types for the reduced samples, where the exclusion multiplier is about 2.7 (see the exclusion multiplier calculation in Note 2 under Table 4). Specifically, the regions with the highest tourism spending were Gangwon and Jeju, while Sejong had the lowest. Jeju had the highest spending on transportation, while Gangwon had the highest on accommodation and F&B. Gangwon’s natural forests and ocean environments and abundant leisure facilities such as ski resorts account for its popularity as a domestic tourist destination. It is easily accessible from the Seoul Metropolitan Area, which includes Seoul, Incheon, and Gyeonggi, and takes about 50% of the total population. Further, Jeju, the largest island in Korea, is considered a representative domestic tourist destination. Visiting Jeju requires air and sea transportation, and spending on the transportation modes was the highest. Sejong, a multi-functional administrative city that was separated from Chungnam in 2012, houses government ministries and national research complexes, making it far from a typical tourist destination.
Table 4.
2023 Tourism Expenditure by Region and Type (million KRW).
3.2. Korean Multiregional EEIO Model
To estimate GHG emissions, MUREPA’s Environmentally and Multiregionally Extended Input-Output (ME2IO) Model (year 2023, ME2IO2023), as a Korean multiregional EEIO model, was applied to avoid temporal inconsistency with 2023 Travel data. Figure 2 shows the construction process of ME2IO2023. ME2IO2023 was built by combining the 2023 version of MUREPA’s Interregional Economic Model (MIEM) that is an interregional input-output (IRIO)-type model and 2023 GHG emission data, “Regional Greenhouse Gas Inventories (1990–2019)” provided by the Greenhouse Gas Information Center of the Ministry of Environment of Korea. This study considered only intermediate exchanges when combining GHG emission data by industry and region. MIEM is updated to the latest year using the Flexible Input-Output (FlexIO) approach using each year GDP and final demand vectors, based on the Bank of Korea’s 2015 Interregional Input-Output Table [12,33]. FlexIO is a Bayesian-based quasi-dynamic model that simultaneously considers demand-based and supply-based IO coefficients for the economic estimation stemming from a specific event or targeting a period for the target year [25,26,27]. In the context of carbon emissions, EEIO analysis assesses environmental impacts from a final-consumption perspective by tracing the environmental journey of final products through the entire industrial supply chain [34], assuming that all carbon emissions embodied in the purchase of goods and services are included.
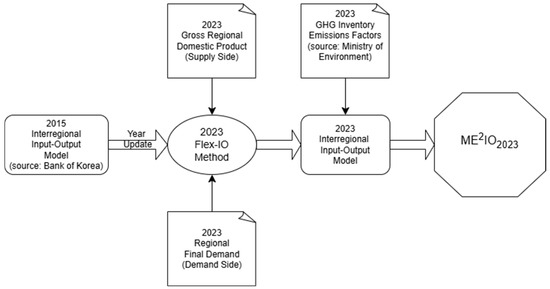
Figure 2.
The Construction Process of 2023 MUREPA’s Environmentally and Multiregionally Extended Input-Output (ME2IO2023). Note: This figure was created with the support of a tool available at www.drawio.com (accessed on 12 August 2025).
Table 5 shows bridges connecting Tourism expenditure types and the MIEM industry sectors. Mapping the bridge required two efforts: first, while the accommodation and F&B sectors are distinct expenditure types, they are grouped together in the same industry sector, Food services and accommodation. Note that once estimating GHG emissions, the Food services and accommodation sector was disaggregated proportionally with its own accommodation and F&B types to measure type-based GHG emissions using total output (see Table A1 in Appendix A). Also, because the F&B expenditure type is the sum of expenditures on dining out at a restaurant and groceries, it is split into Food services and accommodation and Wholesale and retail trade. Hence, the final GHG emissions are presented into three expenditure types: transportation, accommodation, and F&B.
Table 5.
Tourism Expenditure Types Classified into the Korean 33 Industry Sectors.
As a first step in constructing the ME2IO Model, following the traditional EEIO approach suggested by [35], the GHG emission factor of the kth industry is defined as in Equation (1).
where = The generated GHG emissions when producing one unit of total output in the kth industry
Here, is redefined in the matrix form as shown in Equation (2).
where a diagonal matrix whose main diagonal element is and all other elements are 0, when ; a diagonal matrix whose main diagonal element is and all other elements are 0, when ; a diagonal matrix whose main diagonal element is and all other elements are 0, when
The total GHG emissions matrix T is defined as in Equation (3),
where , Leontief inverse matrix of MEIM, F: Value vector of purchases for the Tourism sector.
Next, ME2IO utilizes total purchase value as an input dataset for estimating the carbon emissions inherent in the entire industrial process via intermediate goods and services used in an entity’s production process and calculates the carbon dioxide emissions of all industries measured in a market with items finally purchased by the entity. It has 17 regions at the province level and 33 industries that are consistent with the Korean Industrial Standards Classification provided by the Bank of Korea, and hence, a total of 314,721 (=561 × 561) coefficients [12]. Table A2 (in Appendix A) presents the industry classification in ME2IO2023. These regional GHG emission factors are matched to three key industries: transportation, accommodation, and F&B. In Food & Accommodation, the F&B and accommodation categories are split by their share of total output.
4. Results
4.1. GHG Emissions by Expenditure Type, Region, and Industry
The GHG emissions from Korean domestic tourism expenditures in 2023 by expenditure type were estimated using ME2IO2023, yielding a total of 2623 tCO2eq. The total GHG emissions by region and industry sector are suggested in Table A3 (in Appendix A). Of this amount, as shown in Table 6, approximately 1917 tCO2eq were attributed to the combined effects of transportation, accommodation, and F&B types. The remaining 706 tCO2eq were distributed across other industries, reflecting indirect emissions embedded in goods and services consumed by the Korean tourists. The total serves as the baseline for the breakdowns presented in the following subsections.
Table 6.
Regional GHG Emissions by Expenditure Type.
Figure 3 demonstrates the estimated GHG emissions by region. Categorized with GHG emissions into 50, 100, 200 tCO2eq intervals, each region was colored with the corresponding range. GHG emissions only account for tourism-related outputs as corresponding to the results in Table 6. As GHG emissions increase, the color darkens. Tourism-related GHG emissions were recorded relatively high in provinces such as Gangwon, Gyeongnam, Gyeongbuk, Jeonnam, Gyeonggi, Chungnam, Chungbuk and Jeonbuk because of their sizable area scale and various natural environments including national parks and national gardens, attracting domestic visitors [36], which account for high emissions in transportation and accommodation. Jeju, as the largest island in Korea, stood out as a unique case: despite its small population, it recorded disproportionately high emissions, primarily due to its reliance on aviation for trip destinations. The emissions associated with Jeju’s aviation sector illustrate how dependence on carbon-intensive transport can dramatically elevate the footprint of an otherwise small region.
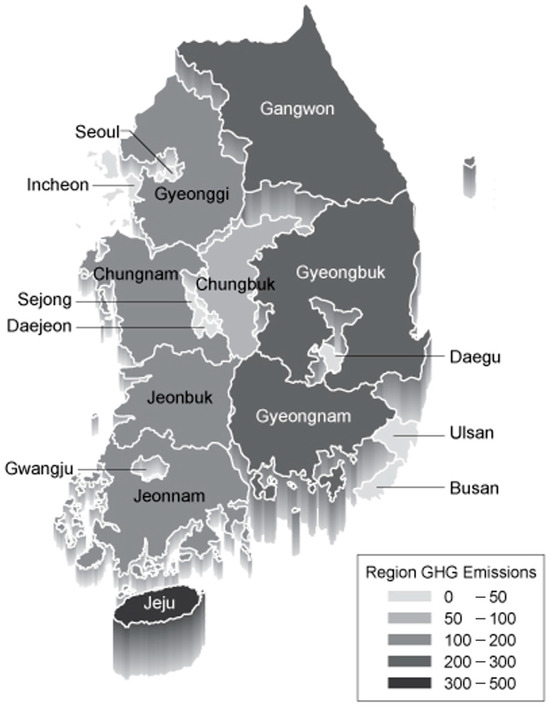
Figure 3.
Regional GHG Emissions estimated from Tourism-related industries via ME2IO2023. Notes: 1. Unit: tCO2eq. 2. Regional rankings were identical across the sensitivity tests when constant percent changes (±10%) were made. 3. The map was generated using QGIS Desktop 3.16.5 and modified with Adobe Illustrator 2025.
GHG emissions by tourism expenditure type are shown in Figure 4a (transportation), Figure 4b (accommodation), and Figure 4c (F&B). Note that each axis uses a different scale by sector. Transportation accounts for the overwhelming share of emissions, followed by F&B and accommodation. Transportation-related emissions were largely driven by air travel and private vehicles, where air transport plays an especially large role in emissions for Jeju. F&B expenditure represented a meaningful share of emissions due to the energy embedded in agricultural production and food preparation. Accommodation emissions, while smaller in comparison, were also significant, accounting for the energy-intensive nature of hotel operations and other lodging facilities.
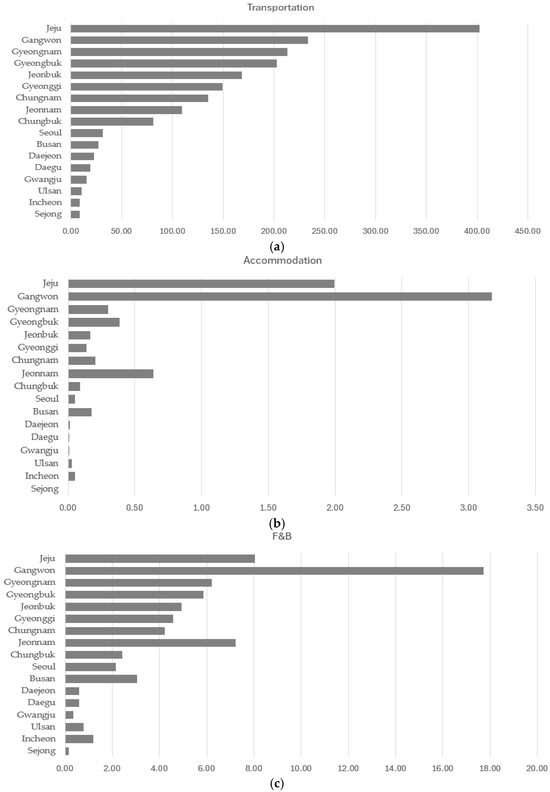
Figure 4.
(a) Regional GHG Emissions by Expenditure Type: Transportation, (unit: tCO2eq.); (b) Regional GHG Emissions by Expenditure Type: Accommodation, (unit: tCO2eq.); (c) Regional GHG Emissions by Expenditure Type: F&B, (unit: tCO2eq.). Note: Regional rankings were identical across the sensitivity tests when constant percent changes (±10%) were made.
This breakdown highlights the dual importance of transportation and F&B in shaping tourism’s carbon footprint in Korea. Together, these two categories account for the majority of emissions, with accommodation serving as a secondary but still important contributor in certain regions.
Via the multiregional EEIO model, different industrial effects on GHG emissions were identified. Among the 33 industrial sectors, Table 7 shows the top five GHG emission industries by region generated by Tourism. In most regions, the largest contributors include transportation services and the accommodations and food industry. While electricity and energy supply, Agriculture, Water, and Waste management sectors are not included in the input sectors for ME2IO2023, they are top emission sectors via inter-industrial and interregional connections. Hence, reduction strategies in tourism-related emissions could be achieved most effectively by targeting a relatively small number of high-emission sectors. Moreover, the results reflect both direct consumption by tourists and indirect emissions embodied in supply chains, demonstrating the advantage of the EEIO approach for capturing upstream impacts. In addition to these dominant industries, smaller contributions were observed across wholesale and retail trade, cultural services, and other supporting industries. Although their shares were less substantial, these sectors illustrate the broad range of indirect emissions embedded within the tourism supply chain, with variation by region.
Table 7.
Top 5 Industries by CO2 Emissions from Tourism Expenditure.
4.2. Sensitivity Analysis
As a robustness check, a sensitivity analysis has been made, where expenditures for transportation, accommodation, and F&B were differentiated by ±5~10%. Table 8 summarizes sector-specific GHG emission scenarios under these shocks and the deviations from the baseline output values. In an EEIO framework, note that a constant proportional change (e.g., ±10%) in any input sector yields the same changes for all sector outputs (or ±10% across all sectors constantly). Instead, sensitivity tests were conducted with diverse input changes across three industry sectors—Transportation, Accommodation & food, and Wholesale & retail trade—and the resulting Total GHG changes are shown in Table 8. The gaps between the baseline and the simulated GHG emissions (=ΔGHG) demonstrate the consistency of the EEIO model, showing the same order of GHG emission contributing industries (Transportation > Accommodation & food > Wholesale & retail trade). Various sector-related policies targeting a future year can be simulated by providing GHG reduction pathways.
Table 8.
Sensitivity Tests with Various Scenarios with Changes in GHG Emissions.
4.3. Validation
Validation has been conducted to ensure the robustness and credibility of GHG emission estimates. The results derived from the Korean ME2IO model were validated via comparison with the MIT benchmark study on Scope 3, Category 6 emissions from business travel [20]. The MIT study is particularly suitable as a reference because it employed a spend-based EEIO approach consistent with this study and is widely recognized as a representative EEIO application that follows the GHG Protocol. MIT’s estimates are based on all MIT-sponsored travel, including air, ground, water, and rail transport, as well as accommodation and meals. This includes, but is not limited to, travel for conferences, business meetings, athletic competitions, and participation in study-abroad programs. Any MIT travel expenses not directly paid with MIT funds are excluded. Excluded trip types include travel paid by other sources—such as external scholarships for students (e.g., round-trip tickets between home and a study-abroad location), family members, or organizations that sponsor invited speakers or consultants [20]. MIT’s institutional GHG emissions are estimated using the USEEIO framework developed by the U.S. Environmental Protection Agency. As a national model, USEEIO aggregates emissions to a single U.S. geography and therefore cannot provide region-specific GHG emission factors for subnational analysis. Further, a temporal mismatch exists in the report: their 2023 fiscal-year travel data is analyzed, but the 2012 USEEIO model for the MIT report is constructed with 2012 national IO. In contrast, ME2IO2023, developed for this study, has two distinct advantages: spatial disaggregation and temporal consistency, providing the same year between the EEIO model and the trip data. Also, while the recent USEEIO model incorporated import emission factors but applied the domestic technology assumption [37], it is questionable whether the MIT report included the factor when considering the Tourism-related industries used in the analysis [38]. The current ME2IO does not include imports; it only considers intermediate industries. However, both USEEIO and ME2IO are built on the same foundational EEIO framework.
Specifically, the comparison focuses on three major expenditure categories: transportation, accommodation, and F&B. The Korean National Travel Survey [39] categorizes expenditures in the same way, which enables a direct comparison of proportional contributions across categories. By aligning results across these comparable categories, both the magnitude and structure of emissions were assessed. Similarities strengthen the validity of the Korean estimates, while deviations provide opportunities to discuss contextual differences such as regional energy mixes, travel patterns, and infrastructure reliance. Note that MIT’s benchmark results are normalized to 2012 U.S. dollars, in accordance with the USEEIO 2.0 model requirements, to control for inflation and maintain consistency across years. While absolute levels of emissions are expected to differ due to contextual differences between the U.S. and Korea, the validation emphasizes proportional distributions among categories. This provides a more robust benchmark for comparison and strengthens confidence in the methodology.
While absolute values vary across national contexts and system boundaries, the proportional similarity across categories confirms the robustness of the expenditure-based EEIO approach. Table 9 shows the numerical differences in sectoral shares for Korean National Travel (KNT) and MIT business travel, including the sectoral shares of spending and GHG emissions. Note the sectoral shares of GHG emissions estimated by each EEIO. The largest difference in spending was in F&B, while the largest in GHG emissions was in transportation.
Table 9.
Expenditure and GHG Emissions Shares: Korean National Travel vs. MIT.
While absolute values differ due to national contexts and system boundaries, the proportional similarities across categories confirm the robustness of the spend-based EEIO approach. Differences between the KNT and MIT results highlight structural variations in travel patterns, such as Korea’s reliance on private vehicles in addition to aviation, compared to MIT’s emphasis on a bit longer international air travel with business purposes, generating different spending patterns. Additionally, because day trips and short stays account for a large share of domestic travel in Korea, accommodation spending is relatively low. Further, differences in national context, such as territory size, industrial structure, and in the EEIO model applications between a U.S. nation model (USEEIO) and a Korean multiregional EEIO (ME2IO2023) may generate the gap. These contextual contrasts provide further insights into how methodological frameworks can be adapted across diverse contextual settings.
Through this validation approach, the study demonstrated methodological rigor and positioned its findings within an internationally recognized framework. This not only enhances the credibility of our results but also facilitates their application to comparative research and policy discussions beyond Korea.
5. Conclusions
This study quantifies regional and sector-specific GHG emissions induced by domestic tourism expenditures in Korea. The analysis employed a spend-based EEIO approach using the 2023 provincial-level Korean Multiregional EEIO model (ME2IO2023) to quantify GHG emissions. The findings on total emissions are based on a sample of 24,282 domestic tourists only and reflect an estimate of the tourism-related portion of total emissions, not the entire national territorial emissions, as polished from the 2023 National Travel Survey. Hence, it made three key contributions towards (1) the first regional quantification of domestic tourism emissions in Korea; (2) an internationally recognized corporate accounting framework (Scope 3, Category 6) to tourism research; and (3) sectoral and regional hotspots that can inform targeted mitigation strategies against climate change.
The first provincial-level estimates of GHG emissions from Korean domestic tourism revealed a total of 2623 tCO2eq in 2023, where about 73% of the total was attributed to the tourism-related sectors. The results illustrate how tourism emissions are shaped by travel patterns, energy intensity, transportation systems, and regional context. Provinces that surround metropolitan cities in the mainland, for example, Gyeonggi and Gangwon Provinces near Seoul and Incheon, and Gyeongnam Province neighboring Busan and Ulsan, record higher emissions due to large travel volumes from these metropolitan cities and energy-intensive transportation services. Jeju Island stands out as an outlier, with disproportionately high emissions relative to its size, driven by reliance on aviation, which significantly raises its per-visitor footprint.
At the expenditure level, transportation dominated, followed by F&B and accommodation. The breakdown by expenditure type further emphasizes the structural challenges of reducing transportation emissions. Unlike F&B and accommodation, where efficiency gains can be achieved through renewable energy adoption, energy-saving technologies, and sustainable sourcing, reducing transport emissions requires systemic changes in infrastructure, modal shifts, and low-carbon alternatives. Also, at the industry level, emissions were also heavily concentrated in transportation services, electricity and energy supply, and food-related sectors, highlighting clear industrial hotspots where targeted interventions could deliver substantial reductions. Various sensitivity tests showed the consistency of the EEIO model by preserving the original order across sectors and regions; hence, various tourism sector-related policy effects can be simulated, depending on the future GHG reduction pathway scenarios. These findings reinforce the established understanding that tourism is a carbon-intensive sector primarily driven by mobility. Ref. [3] estimated that global tourism accounted for 8% of global GHG emissions between 2009 and 2013, with transportation and accommodation identified as the leading contributors. The Korean results mirror this structure but highlight the outsized role of aviation in Jeju and private vehicle use on the mainland. Similarly, Ref. [1] found that structural drivers such as energy supply and consumption preferences strongly shape tourism emissions. In Korea, these drivers still appear clearly in the reliance on high-carbon energy for accommodation and in the strong cultural emphasis on food-related tourism.
The comparison with MIT’s Scope 3, Category 6, business travel study [20], strengthens the robustness of the Korean estimates. Both studies showed transportation as the primary source of emissions, with accommodation and meals as secondary contributors. However, the relative emission shares of accommodation and F&B were higher at MIT than in Korea, accounting for national differences in travel patterns, culture and infrastructure. At the international level, studies in Spain [15], Iceland [16], and China [5,7] confirm the central role of mobility but also highlight regional variations depending on energy mixes, transportation modes, and tourist behaviors. Korea’s results align with these findings, while also offering new insights into how emissions are distributed across subnational regions. This subnational detail fills a critical gap in the literature, which has typically focused on national or global aggregates.
6. Limitations and Discussion
Despite the study’s contributions, it has several limitations. The spend-based EEIO approach provides broad coverage but may mask heterogeneity in energy use and emission intensity at the lower local level or firm level. Activity-based data, such as distance traveled by mode or direct fuel consumption, would provide greater precision but are currently unavailable in the Korean survey data. Additionally, emissions from certain indirect activities, such as the construction of tourism infrastructure or imported goods, may not be fully captured. By adding imports, the EEIO can be extended for this type of study in the future.
This study focused solely on emissions generated by Korean domestic tourism activities in 2023, excluding inbound tourism by foreign visitors and outbound tourism by Korean residents. Subsequent work should incorporate inbound foreign tourism to quantify GHG emissions by region and compare travel patterns and emissions contributions between foreign and domestic visitors, with the aim of providing an integrated regional tourism carbon footprint. Also, the expenditure data is limited to three key categories: transportation, accommodation, and F&B (which includes both dining-out and grocery purchases); however, the expenditure excludes transportation, accommodation, and meals bundled with tour-agency package products. Moreover, this study only estimated GHG emissions with domestic sample data, so the emission amounts do not necessarily account for the entire territorial GHG emissions. Depending on the research purpose, the results in this study can be expanded to a region, a group, or a specific trip type with GHG emissions per capita and the exclusion factor, 2.7. These limitations suggest that future research should combine EEIO with activity-based or hybrid methods.
Even with the limitations, the findings carry several implications for climate and tourism policy in Korea. First, the dominance of transportation emissions suggests that decarbonization of tourism will depend on reducing reliance on aviation and private vehicles. Expanding and electrifying the rail network, improving intermodal connectivity, and incentivizing low-carbon mobility options could all reduce emissions. Jeju’s reliance on aviation makes it a priority case for targeted mitigation, potentially through carbon pricing on flights or promotion of longer-stay tourism to reduce per-trip emissions. Second, the significant role of accommodation highlights the need for stricter energy efficiency standards in the hospitality sector, along with the integration of renewable energy sources. This aligns with Korea’s broader push for building energy efficiency improvements under its Green New Deal framework. Third, emissions embedded in food systems require policies that encourage sustainable sourcing, reduced food waste, and greater consumer awareness. Since culinary tourism is an important part of Korean domestic travel, addressing food-related emissions offers both environmental and cultural opportunities. Finally, at a governance level, this study supports the growing movement toward mandatory Scope 3 disclosure (or at least part of it such as Category 6) as measurable emissions via EEIO in Korea, set to begin in 2026. Tourism-related emissions, often overlooked in current corporate and government accounting, need to be integrated into these reporting frameworks to provide a more complete picture of Korea’s carbon footprint.
Taken together, the findings emphasize the urgency of addressing tourism’s carbon footprint within Korea’s broader climate policy and extend to the global scale. By providing detailed regional-level estimates, this study equips policymakers with the evidence needed to design differentiated strategies—such as prioritizing aviation mitigation in Jeju or food system improvements in Jeonju, located in Jeonbuk. Aligning tourism policy with national decarbonization pathways and international frameworks like the Paris Agreement will be essential if Korea is to achieve its climate targets while maintaining the vitality of its tourism economy. Further, by applying this ME2IO-type model to GHG reduction simulations globally, the potential of specific regional policy interventions practically applied for each country can be explored in targeting renewable energy adoption in accommodations and/or incentivizing a modal shift to low-carbon transportation such as (1) implementing a destination carbon levy to fund Sustainable Aviation Fuel (SAF) infrastructure at major regional airports; (2) establishing a green hotel mandate tied to mandatory installation of a minimum percentage of on-site renewable energy capacity for lodging facilities in climate-vulnerable destinations; and/or (3) incentivizing a ‘train-and-hike’ modal shift by offering tax rebates for tourist packages that bundle high-speed rail with local electric shuttle services that contributes to reducing private car emissions in scenic mainland regions. This study is expected to serve as a cornerstone for local governments to simulate various tourism policy scenarios, thereby supporting climate adaptation and mitigation.
Author Contributions
Conceptualization, J.P.; methodology, C.P. and J.P.; software, J.P. and Y.L.; validation, S.P. and D.J.; formal analysis, D.J. and C.P.; investigation, J.P. and C.P.; data curation, D.J.; writing—original draft preparation, D.J.; writing—review and editing, J.P., S.P. and D.J.; visualization, Y.L.; supervision, C.P.; project administration, J.P.; funding acquisition, J.P. All authors have read and agreed to the published version of the manuscript.
Funding
This study was supported by the Technology Development Program (RS-2024-00510948) funded by the Ministry of SMEs and Startups (MSS, Republic of Korea).
Institutional Review Board Statement
Not applicable.
Informed Consent Statement
Not applicable.
Data Availability Statement
The data presented in this study are available on request from the corresponding author.
Acknowledgments
We appreciate the comments and suggestions from anonymous reviewers. Also, we acknowledge that Boram Lee at MUREPA Korea supported the Adobe Illustrator work of Figure 3. However, any opinions, findings, conclusions, or recommendations in this study are those of the authors and do not necessarily reflect the views of supporters.
Conflicts of Interest
Dasom Jeong, Yongbin Lee, Jiyoung Park, and Changkeun Park are employed by the company MUREPA Korea LC. The remaining authors declare that the research was conducted in the absence of any commercial or financial relationships that could be construed as a potential conflict of interest.
Appendix A
Table A1.
GHG Emissions Factors and Total Output by ME2IO2023.
Table A1.
GHG Emissions Factors and Total Output by ME2IO2023.
| Industry Sector (Code) | Transportation Services (21) | Wholesale and Retail Trade (20) | Food and Accommodation Services (22) | ||
|---|---|---|---|---|---|
| Region | Emission Factors | Emission Factors | Emission Factors | Total Output | |
| F&B | Accommodation | ||||
| Seoul | 0.0003798 | 0.0000073 | 0.0000068 | 35,188,338 | 2,716,661 |
| Incheon | 0.0001536 | 0.0000114 | 0.0000117 | 7,806,353 | 439,647 |
| Gyeonggi | 0.0010281 | 0.0000104 | 0.0000101 | 36,492,712 | 1,386,632 |
| Daejeon | 0.0011509 | 0.0000110 | 0.0000118 | 4,191,821 | 140,762 |
| Sejong | 0.0016237 | 0.0000100 | 0.0000147 | 1,037,475 | 20,521 |
| Chungbuk | 0.0014400 | 0.0000149 | 0.0000141 | 4,669,232 | 217,162 |
| Chungnam | 0.0011509 | 0.0000112 | 0.0000103 | 6,149,014 | 362,270 |
| Gwangju | 0.0010995 | 0.0000091 | 0.0000084 | 3,817,299 | 140,857 |
| Jeonbuk | 0.0014937 | 0.0000152 | 0.0000157 | 5,630,093 | 232,706 |
| Jeonnam | 0.0005771 | 0.0000135 | 0.0000140 | 4,448,247 | 481,084 |
| Daegu | 0.0007613 | 0.0000101 | 0.0000100 | 5,674,588 | 167,567 |
| Gyeongbuk | 0.0013508 | 0.0000151 | 0.0000128 | 6,503,272 | 535,329 |
| Busan | 0.0002398 | 0.0000100 | 0.0000095 | 8,975,198 | 650,762 |
| Ulsan | 0.0004831 | 0.0000156 | 0.0000151 | 3,332,740 | 147,265 |
| Gyeongnam | 0.0012298 | 0.0000126 | 0.0000134 | 8,349,256 | 501,038 |
| Gangwon | 0.0009983 | 0.0000217 | 0.0000230 | 5,290,096 | 1,144,031 |
| Jeju | 0.0008816 | 0.0000150 | 0.0000156 | 2,883,051 | 860,496 |
Notes: 1. The unit of total output is million KRW. 2. The source of the total output is the Bank of Korea’s ⌊2020 Regional Input-Output Table⌋ [33]. 3. The unit of GHG Emission Factors is tCO2eq/KRW.
Table A2.
Korean MIEM’s 33 Industry Codes and Sector Names.
Table A2.
Korean MIEM’s 33 Industry Codes and Sector Names.
| Industry Code | Industrial Sectors | Industry Code | Industrial Sectors |
|---|---|---|---|
| 1 | Agricultural, forestry and fishery products | 18 | Water, waste disposal and recycling services |
| 2 | Mining products | 19 | Construction |
| 3 | Food products | 20 | Wholesale, retail trade and brokerage services |
| 4 | Textile and leather products | 21 | Transportation services |
| 5 | Wood, paper, and printing | 22 | Food and accommodation services |
| 6 | Coal and petroleum products | 23 | Information and communication services |
| 7 | Chemical products | 24 | Financial and insurance services |
| 8 | Non-metallic mineral products | 25 | Real Estate Services |
| 9 | Primary metal products | 26 | Professional, scientific and technical services |
| 10 | Fabricated metal products | 27 | Business support services |
| 11 | Computers, electronic and optical equipment | 28 | Public administration, defense and social security |
| 12 | Electrical equipment | 29 | Education services |
| 13 | Machinery and equipment | 30 | Health and social welfare services |
| 14 | Transportation equipment | 31 | Arts, sports, and leisure-related services |
| 15 | Other manufactured products | 32 | Other services |
| 16 | Manufacturing, processing, and repair of industrial equipment | 33 | Etc. |
| 17 | Electricity, gas, and steam |
Table A3.
(1) Total GHG emissions by region and industrial sector (unit: ton CO2eq); (2) Total GHG emissions by region and industrial sector (unit: ton CO2eq).
Table A3.
(1) Total GHG emissions by region and industrial sector (unit: ton CO2eq); (2) Total GHG emissions by region and industrial sector (unit: ton CO2eq).
| (1) | |||||||||
| Industry Code | Seoul | Incheon | Gyeonggi | Daejeon | Sejong | Chungbuk | Chungnam | Gwangju | Jeonbuk |
| 1 | 0.505 | 0.819 | 12.345 | 0.227 | 0.733 | 5.688 | 15.364 | 0.485 | 11.363 |
| 2 | 0.030 | 0.017 | 0.078 | 0.074 | 0.015 | 0.022 | 0.002 | 0.025 | 0.076 |
| 3 | 0.039 | 2.004 | 1.307 | 0.070 | 0.037 | 1.199 | 0.891 | 0.082 | 0.788 |
| 4 | 0.014 | 0.009 | 0.224 | 0.009 | 0.000 | 0.035 | 0.032 | 0.001 | 0.057 |
| 5 | 0.016 | 0.114 | 0.319 | 0.218 | 0.037 | 0.094 | 0.212 | 0.041 | 0.055 |
| 6 | 1.086 | 1.941 | 0.656 | 0.393 | 0.017 | 0.169 | 13.649 | 0.131 | 0.128 |
| 7 | 0.022 | 2.070 | 0.273 | 0.196 | 0.044 | 0.257 | 6.415 | 0.095 | 0.195 |
| 8 | 0.111 | 0.052 | 0.197 | 0.000 | 0.024 | 5.005 | 1.070 | 0.082 | 0.240 |
| 9 | 0.015 | 0.123 | 0.065 | 0.005 | 0.001 | 0.052 | 5.746 | 0.001 | 0.107 |
| 10 | 0.002 | 0.117 | 1.065 | 0.012 | 0.009 | 0.188 | 0.237 | 0.052 | 0.139 |
| 11 | 0.246 | 0.011 | 0.783 | 0.085 | 0.003 | 0.275 | 0.033 | 0.014 | 0.006 |
| 12 | 0.290 | 0.208 | 0.665 | 0.104 | 0.019 | 0.423 | 0.184 | 0.187 | 0.072 |
| 13 | 0.104 | 0.011 | 0.061 | 0.039 | 0.000 | 0.045 | 0.021 | 0.014 | 0.027 |
| 14 | 0.016 | 0.014 | 0.164 | 0.106 | 0.002 | 0.747 | 0.160 | 0.029 | 0.250 |
| 15 | 0.309 | 0.014 | 0.160 | 0.030 | 0.000 | 0.152 | 0.009 | 0.011 | 0.035 |
| 16 | 0.465 | 0.012 | 0.054 | 0.021 | 0.001 | 0.149 | 0.057 | 0.011 | 0.058 |
| 17 | 0.544 | 134.326 | 24.116 | 0.202 | 5.058 | 1.048 | 76.549 | 0.148 | 1.602 |
| 18 | 0.813 | 0.589 | 4.691 | 1.061 | 0.864 | 6.650 | 6.463 | 0.190 | 2.781 |
| 19 | 0.009 | 0.005 | 0.017 | 0.002 | 0.000 | 0.006 | 0.011 | 0.003 | 0.008 |
| 20 | 1.486 | 0.255 | 0.993 | 0.174 | 0.014 | 0.469 | 0.783 | 0.144 | 0.901 |
| 21 | 31.093 | 8.826 | 149.388 | 22.754 | 8.644 | 81.012 | 135.183 | 15.631 | 168.524 |
| 22 | 0.711 | 1.004 | 3.714 | 0.449 | 0.148 | 2.035 | 3.639 | 0.214 | 4.206 |
| 23 | 0.300 | 0.005 | 0.153 | 0.009 | 0.005 | 0.028 | 0.044 | 0.006 | 0.043 |
| 24 | 0.408 | 0.040 | 0.132 | 0.033 | 0.003 | 0.020 | 0.025 | 0.030 | 0.077 |
| 25 | 0.320 | 0.077 | 0.235 | 0.027 | 0.015 | 0.058 | 0.109 | 0.046 | 0.059 |
| 26 | 0.675 | 0.035 | 0.154 | 0.022 | 0.002 | 0.015 | 0.012 | 0.022 | 0.022 |
| 27 | 0.191 | 0.056 | 0.139 | 0.032 | 0.003 | 0.046 | 0.046 | 0.041 | 0.058 |
| 28 | 0.001 | 0.001 | 0.003 | 0.000 | 0.000 | 0.001 | 0.001 | 0.000 | 0.001 |
| 29 | 0.003 | 0.001 | 0.004 | 0.002 | 0.000 | 0.001 | 0.001 | 0.001 | 0.001 |
| 30 | 0.017 | 0.004 | 0.015 | 0.005 | 0.000 | 0.005 | 0.006 | 0.004 | 0.007 |
| 31 | 0.032 | 0.003 | 0.024 | 0.002 | 0.000 | 0.003 | 0.005 | 0.002 | 0.006 |
| 32 | 0.045 | 0.007 | 0.051 | 0.007 | 0.001 | 0.012 | 0.022 | 0.009 | 0.031 |
| 33 | 0.003 | 0.002 | 0.005 | 0.001 | 0.000 | 0.002 | 0.003 | 0.000 | 0.004 |
| Region total | 39.922 | 152.773 | 202.247 | 26.369 | 15.701 | 105.909 | 266.985 | 17.752 | 191.925 |
| (2) | |||||||||
| Industry Code | Jeonnam | Daegu | Gyeongbuk | Busan | Ulsan | Gyeongnam | Gangwon | Jeju | Industry Total |
| 1 | 27.050 | 0.837 | 18.512 | 4.982 | 3.660 | 13.521 | 9.153 | 3.938 | 129.184 |
| 2 | 0.001 | 0.016 | 0.072 | 0.060 | 0.000 | 0.054 | 0.170 | 0.049 | 0.760 |
| 3 | 0.867 | 0.102 | 0.662 | 0.656 | 0.254 | 2.252 | 1.378 | 0.266 | 12.852 |
| 4 | 0.020 | 0.151 | 0.157 | 0.023 | 0.001 | 0.042 | 0.000 | 0.000 | 0.775 |
| 5 | 0.018 | 0.211 | 0.141 | 0.002 | 0.073 | 0.132 | 0.004 | 0.012 | 1.697 |
| 6 | 5.098 | 0.450 | 0.337 | 0.453 | 19.387 | 0.612 | 0.405 | 0.005 | 44.918 |
| 7 | 8.733 | 0.016 | 0.549 | 0.051 | 7.270 | 0.266 | 0.011 | 0.006 | 26.468 |
| 8 | 1.999 | 0.005 | 1.254 | 0.011 | 0.054 | 0.135 | 11.169 | 0.011 | 21.421 |
| 9 | 6.866 | 0.014 | 6.611 | 0.107 | 0.328 | 0.092 | 0.000 | 0.000 | 20.134 |
| 10 | 0.083 | 0.037 | 0.184 | 0.045 | 0.235 | 0.305 | 0.012 | 0.000 | 2.721 |
| 11 | 0.014 | 0.039 | 1.162 | 0.216 | 0.169 | 0.007 | 0.114 | 0.001 | 3.176 |
| 12 | 0.163 | 0.190 | 0.466 | 0.879 | 2.346 | 0.198 | 0.321 | 0.025 | 6.741 |
| 13 | 0.041 | 0.035 | 0.046 | 0.033 | 0.031 | 0.033 | 0.118 | 0.006 | 0.665 |
| 14 | 0.653 | 0.127 | 0.422 | 0.053 | 0.141 | 0.321 | 1.327 | 0.000 | 4.530 |
| 15 | 0.095 | 0.026 | 0.080 | 0.022 | 0.034 | 0.013 | 0.569 | 0.077 | 1.637 |
| 16 | 0.279 | 0.044 | 0.115 | 0.032 | 0.023 | 0.030 | 0.754 | 0.081 | 2.185 |
| 17 | 32.711 | 2.950 | 1.492 | 10.375 | 4.146 | 45.663 | 18.165 | 3.058 | 362.153 |
| 18 | 10.520 | 0.692 | 6.989 | 4.954 | 1.283 | 3.189 | 2.030 | 2.195 | 55.954 |
| 19 | 0.008 | 0.003 | 0.010 | 0.002 | 0.002 | 0.011 | 0.008 | 0.003 | 0.108 |
| 20 | 1.340 | 0.209 | 1.145 | 0.615 | 0.158 | 1.207 | 3.040 | 1.365 | 14.300 |
| 21 | 109.506 | 19.325 | 202.710 | 26.985 | 10.514 | 213.015 | 233.581 | 402.553 | 1839.243 |
| 22 | 6.525 | 0.394 | 5.108 | 2.608 | 0.655 | 5.321 | 17.843 | 8.675 | 63.246 |
| 23 | 0.055 | 0.009 | 0.062 | 0.016 | 0.005 | 0.041 | 0.202 | 0.055 | 1.038 |
| 24 | 0.053 | 0.036 | 0.039 | 0.057 | 0.011 | 0.049 | 0.136 | 0.080 | 1.229 |
| 25 | 0.162 | 0.026 | 0.122 | 0.096 | 0.024 | 0.223 | 0.375 | 0.300 | 2.274 |
| 26 | 0.021 | 0.030 | 0.046 | 0.060 | 0.023 | 0.040 | 0.094 | 0.052 | 1.323 |
| 27 | 0.068 | 0.034 | 0.062 | 0.062 | 0.024 | 0.056 | 0.123 | 0.070 | 1.113 |
| 28 | 0.003 | 0.001 | 0.002 | 0.002 | 0.000 | 0.002 | 0.012 | 0.007 | 0.036 |
| 29 | 0.002 | 0.001 | 0.002 | 0.001 | 0.001 | 0.002 | 0.004 | 0.003 | 0.029 |
| 30 | 0.014 | 0.005 | 0.011 | 0.008 | 0.003 | 0.011 | 0.026 | 0.020 | 0.163 |
| 31 | 0.007 | 0.002 | 0.006 | 0.009 | 0.001 | 0.012 | 0.023 | 0.047 | 0.183 |
| 32 | 0.027 | 0.012 | 0.028 | 0.019 | 0.006 | 0.029 | 0.090 | 0.088 | 0.484 |
| 33 | 0.007 | 0.001 | 0.004 | 0.004 | 0.001 | 0.005 | 0.035 | 0.020 | 0.096 |
| Region total | 213.009 | 26.030 | 248.607 | 53.498 | 50.864 | 286.886 | 301.291 | 423.069 | 2622.837 |
References
- Sun, Y.Y.; Faturay, F.; Lenzen, M.; Gössling, S.; Higham, J. Drivers of global tourism carbon emissions. Nat. Commun. 2024, 15, 10384. [Google Scholar] [CrossRef]
- IPCC. Climate Change 2021: The Physical Science Basis. Annex VII: Glossary; Cambridge University Press: Cambridge, UK; New York, NY, USA, 2021. [Google Scholar]
- Lenzen, M.; Sun, Y.Y.; Faturay, F.; Ting, Y.P.; Geschke, A.; Malik, A. The carbon footprint of global tourism. Nat. Clim. Change 2018, 8, 522–528. [Google Scholar] [CrossRef]
- Tsutsumi, A.; Furukawa, R.; Kitamura, Y.; Itsubo, N. G20 tourism carbon footprint and COVID-19 impact. Sustainability 2024, 16, 2222. [Google Scholar] [CrossRef]
- Xia, B.; Dong, S.; Li, Z.; Zhao, M.; Sun, D.; Zhang, W.; Li, Y. Eco-efficiency and its drivers in tourism sectors with respect to carbon emissions from the supply chain: An integrated EEIO and DEA approach. Int. J. Environ. Res. Public Health 2022, 19, 6951. [Google Scholar] [CrossRef]
- Hong, S.-K.; Kim, N.-J. A study on the estimation of carbon emissions in the tourism industry in Busan: Focusing on the top-down methodology using local tourism satellite accounts. J. Tour. Sci. 2023, 47, 45–63. [Google Scholar] [CrossRef]
- Zhang, J.; Xia, B. Carbon emissions and its efficiency of tourist hotels in China from the supply chain based on the input–output method and super-SBM model. Sustainability 2024, 16, 9489. [Google Scholar] [CrossRef]
- Ciers, J.; Mandic, A.; Toth, L.D.; Op’t Veld, G. Carbon footprint of academic air travel: A case study in Switzerland. Sustainability 2018, 11, 80. [Google Scholar] [CrossRef]
- Demeter, C.; Lin, P.C.; Sun, Y.Y.; Dolnicar, S. Assessing the carbon footprint of tourism businesses using environmentally extended input–output analysis. J. Sustain. Tour. 2021, 30, 128–144. [Google Scholar] [CrossRef]
- World Resources Institute; World Business Council for Sustainable Development. Technical Guidance for Calculating Scope 3 Emissions; Version 1.0; Greenhouse Gas Protocol; World Resources Institute: Washington, DC, USA, 2013. [Google Scholar]
- Ministry of Culture, Sports and Tourism (MCST); Korea Culture & Tourism Institute (KCTI). 2023 National Travel Survey [Data Set]. 2023. Available online: https://know.tour.go.kr/main/main.do (accessed on 12 October 2025).
- MUREPA KOREA. MUREPA Environmental Regional Input–Output Model Guidebook V.1.1; MUREPA PRESS: Seongnam-si, Republic of Korea, 2024; Available online: https://www.murepa.com (accessed on 22 October 2025).
- Minx, J.C.; Wiedmann, T.; Wood, R.; Peters, G.P.; Lenzen, M.; Owen, A.; Ackerman, F. Input–output analysis and carbon footprinting: An overview of applications. Econ. Syst. Res. 2009, 21, 187–216. [Google Scholar] [CrossRef]
- Huang, Y.A.; Weber, C.L.; Matthews, H.S. Categorization of scope 3 emissions for streamlined enterprise carbon footprinting. Environ. Sci. Technol. 2009, 43, 8509–8515. [Google Scholar] [CrossRef]
- Cadarso, M.Á.; Tobarra, M.Á.; García-Alaminos, Á.; Ortiz, M.; Gómez, N.; Zafrilla, J. The input–output method for calculating the carbon footprint of tourism: An application to the Spanish tourism industry. In Advances of Footprint Family for Sustainable Energy and Industrial Systems; Springer International Publishing: Cham, Switzerland, 2021; pp. 35–57. [Google Scholar]
- Clarke, J.C. The Carbon Footprint of an Icelander: A Consumption-Based Assessment Using the Eora MRIO Database. Ph.D. Thesis, University of Iceland, Reykjavík, Iceland, 2017. [Google Scholar]
- Hertwich, E.G.; Peters, G.P. Carbon footprint of nations: A global, trade-linked analysis. Environ. Sci. Technol. 2009, 43, 6414–6420. [Google Scholar] [CrossRef]
- Peters, G.P.; Minx, J.C.; Weber, C.L.; Edenhofer, O. Growth in emission transfers via international trade from 1990 to 2008. Proc. Natl. Acad. Sci. USA 2011, 108, 8903–8908. [Google Scholar] [CrossRef]
- Lee, W.; Lim, C.-H.; Yoo, S.; Lee, W.-K. Estimating the carbon dioxide emission in Jeju ecotourism. J. Clim. Change Res. 2019, 10, 79–87. [Google Scholar] [CrossRef]
- Goldberg, B.; Gregory, J.; Cheng, Y.; DeMartino, G. MIT Scope 3 Greenhouse Gas Documentation: Business Travel—Emissions Calculation Documentation; Massachusetts Institute of Technology, Office of Sustainability: Cambridge, MA, USA, 2024. [Google Scholar]
- Boychuck, S.; Curaming, W.; Martin, R.; Zarif, A. A Carbon Footprint Analysis of Travel. Ph.D. Thesis, Duke University, Durham, NC, USA, 2025. [Google Scholar]
- Sharp, H.; Grundius, J.; Heinonen, J. Carbon footprint of inbound tourism to Iceland: A consumption-based life-cycle assessment including direct and indirect emissions. Sustainability 2016, 8, 1147. [Google Scholar] [CrossRef]
- World Resources Institute; World Business Council for Sustainable Development. A Corporate Accounting and Reporting Standard (Revised Edition); Greenhouse Gas Protocol; World Resources Institute: Washington, DC, USA, 2004. [Google Scholar]
- Issa-Zadeh, S.B.; López-Gutiérrez, J.S.; Esteban, M.D.; Fernández-Sánchez, G.; Garay-Rondero, C.L. A framework for accurate carbon footprint calculation in seaports: Methodology proposal. J. Mar. Sci. Eng. 2023, 11, 1007. [Google Scholar] [CrossRef]
- Gordon, P.; Park, J.Y.; Richardson, H.W. Modeling economic impacts in light of substitutions in household sector final demand. Econ. Model. 2009, 26, 696–701. [Google Scholar] [CrossRef]
- Park, J.Y.; Gordon, P.; Moore, J.E., II; Richardson, H.W. A new approach to quantifying the impact of hurricane-disrupted oil refinery operations utilizing secondary data. Group Decis. Negot. 2017, 26, 1125–1144. [Google Scholar] [CrossRef]
- Park, J.Y.; Richardson, H.W. Refining the Isard multiregional input–output model theory. In Regional Science Matters: Studies Dedicated to Walter Isard; Nijkamp, P., Rose, A., Kourtit, K., Eds.; Springer: Berlin/Heidelberg, Germany, 2014; pp. 35–54. [Google Scholar]
- Park, C.; Park, J. COVID-19 and the Korean economy: When, how, and what changes? Asian J. Innov. Policy 2020, 9, 187. [Google Scholar]
- Stridsland, T.; Stounbjerg, A.; Sanderson, H. A hybrid approach to a more complete emissions inventory: A case study of Aarhus University. Carbon Manag. 2023, 14, 2275579. [Google Scholar] [CrossRef]
- Munksgaard, J.; Pedersen, K.A. CO2 accounts for open economies: Producer or consumer responsibility? Energy Policy 2001, 29, 327–334. [Google Scholar] [CrossRef]
- Peters, G.P. From production-based to consumption-based national emission inventories. Ecol. Econ. 2008, 65, 13–23. [Google Scholar] [CrossRef]
- Korea Culture & Tourism Institute (KCTI). 2023 National Travel Survey: Statistical Volume [Report]. 2024. Available online: https://know.tour.go.kr/main/main.do (accessed on 12 October 2025).
- Bank of Korea. 2020 Regional Input–Output Tables (Producer’s Prices; Large-Sized Classification) [Data Set]. 2 July 2025. Available online: https://www.bok.or.kr/portal/bbs/B0000501/view.do?menuNo=201264&nttId=10092264 (accessed on 12 October 2025).
- Yeo, Y.; Cho, H.; Jung, H. Industry Impacts and Responses to the Introduction of the Carbon Border Adjustment Mechanism. Natl. Future Strategy Insight 2021, 27; National Assembly Futures Institute (in Korean). Available online: https://share.google/GaKyhxXpCtd1bBFn4 (accessed on 22 October 2025).
- Miller, R.E.; Blair, P.D. Input–Output Analysis: Foundations and Extensions, 2nd ed.; Cambridge University Press: Cambridge, UK, 2009. [Google Scholar]
- Park, Y.J.; Park, Y.M.; Park, C.K. A study on establishing an ecosystem service evaluation system in response to climate change focusing on garden value evaluation indicators. Asian J. Innov. Policy 2023, 12, 277–303. [Google Scholar]
- Ingwersen, W.W.; Li, M.; Young, B.; Vendries, J.; Birney, C. USEEIO v2.0, the US environmentally-extended input–output model v2.0. Sci. Data 2022, 9, 194. [Google Scholar] [CrossRef] [PubMed]
- EPA. US Environmentally-Extended Input-Output (USEEIO) Models. 2024. Available online: https://www.epa.gov/land-research/us-environmentally-extended-input-output-useeio-models (accessed on 1 September 2025).
- Korea Culture & Tourism Institute (KCTI). 2023 National Travel Survey: User Guide [Technical Report]. Investigation Period: 2023-01-01–2023-12-31; Korea Culture & Tourism Institute, 2023; Available online: https://know.tour.go.kr/main/main.do (accessed on 12 October 2025).
Disclaimer/Publisher’s Note: The statements, opinions and data contained in all publications are solely those of the individual author(s) and contributor(s) and not of MDPI and/or the editor(s). MDPI and/or the editor(s) disclaim responsibility for any injury to people or property resulting from any ideas, methods, instructions or products referred to in the content. |
© 2025 by the authors. Licensee MDPI, Basel, Switzerland. This article is an open access article distributed under the terms and conditions of the Creative Commons Attribution (CC BY) license (https://creativecommons.org/licenses/by/4.0/).