Abstract
Subsidence over abandoned goaves is a primary trigger for secondary geological hazards such as surface collapse, landslides, and cracking. This threatens safe mining operations, impairs regional economic progress, and endangers local inhabitants and their assets. At present, goaf areas are mainly treated through grouting. However, owing to the deficiencies of traditional deformation monitoring methods (e.g., leveling and GPS), including their slow speed, high cost, and limited data accuracy influenced by the number of monitoring points, the surface deformation features of goaf zones treated with grouting cannot be obtained in a timely fashion. Therefore, this study proposes a method to analyze the spatio-temporal patterns of surface deformation in grout-filled goaves based on the fusion of Multi-temporal InSAR technologies, leveraging the complementary advantages of D-InSAR, PS-InSAR, and SBAS-InSAR techniques. An investigation was conducted in a coal mine located in Shandong Province, China, utilizing an integrated suite of C-band satellite data. This dataset included 39 scenes from the RadarSAT-2 and 40 scenes from the Sentinel missions, acquired between September 2019 and September 2022. Key results reveal a significant reduction in surface deformation rates following grouting operations: pre-grouting deformation reached up to −98 mm/a (subsidence) and +134 mm/a (uplift), which decreased to −11.2 mm/a and +18.7 mm/a during grouting, and further stabilized to −10.0 mm/a and +16.0 mm/a post-grouting. Time-series analysis of cumulative deformation and typical coherent points confirmed that grouting effectively mitigated residual subsidence and induced localized uplift due to soil compaction and fracture expansion. The comparison with the leveling measurement data shows that the accuracy of this method meets the requirements, confirming the method’s efficacy in capturing the actual ground dynamics during grouting. It provides a scientific basis for the safe expansion of mining cities and the safe reuse of land resources.
1. Introduction
In 2023, China produced 4.71 billion tons of raw coal, with this resource representing 55.3% of the nation’s total energy consumption [1]. Coal resources continue to dominate primary energy sources. However, issues such as underground voids, rock layer fissures, and delamination caused by long-term mining have persisted. The surface of the goaf still experiences residual deformation within a specific period [2,3]. Currently, grouting and filling in goaf areas represent effective technical measures to prevent the instability of residual coal pillars and control surface deformation. However, grouting in the goaf does not ensure that the overburden strata will cease to settle. Influenced by factors such as coal seam occurrence, mining methods, the lithology of strata, filling processes, and filling materials, the surface can still undergo significant movement and deformation after grouting and filling [4,5]. In addition, modern buildings in goaf regions are developing toward larger scales, with greater heights and wider spans, which increases the likelihood of activating the strata system. This poses a serious threat to ecological balance, human settlements, and socio-economic sustainability, hindering the achievement of Sustainable Development Goals (SDGs) [6,7]. Therefore, to ensure safe production in coal mining areas and to protect residents’ lives and property, it is imperative to conduct deformation monitoring and impact analysis of the mining area surface during the grouting process.
In recent years, scholars have conducted extensive studies on monitoring methods and influencing factors of surface settlement deformation in mining areas, while continuously advancing new theoretical and technical approaches [6,7,8,9,10,11]. Traditional methods for monitoring surface settlement and deformation mainly include leveling and Global Navigation Satellite System (GNSS) measurement, which are expensive and have limited spatial resolution, making it challenging to obtain surface deformation information with accuracy and timeliness [12,13,14,15]. Temporal interferometry using Interferometric Synthetic Aperture Radar (InSAR) is characterized by short orbital cycles, high measurement accuracy, and the capacity for continuous large-scale monitoring, effectively mitigating the deficiencies of traditional approaches. This has led to its growing adoption for observing mining-, oil-, and groundwater-related surface deformation [16,17,18,19]. Du and Zhang et al. [20,21] employed Differential InSAR (D-InSAR) technology to detect and assess surface subsidence in coal mining regions, thereby validating its efficacy for large-area monitoring. However, this research did not resolve the difficulty of extracting coherent target points in the D-InSAR model. Fan et al. [22] introduced an underground goaf location and inversion method that integrates InSAR technology with the probabilistic integral model (PIM). This approach proved successful in characterizing the key extraction parameters of the mined panel. However, this method applies only to large deformation areas and does not meet the accuracy requirements for monitoring smaller deformation zones in goaf grouting regions. By employing Persistent Scatterers InSAR (PS-InSAR), some scholars [23,24,25,26,27] conducted a time-series analysis of ground subsidence at the Taibao lead-zinc mine, comparing patterns across three distinct treatment approaches: capping, partial filling, and full filling. However, the issue of phase noise introduced by PS-InSAR in areas with complex terrain and dense vegetation remains unresolved. Chen et al. [28] proposed a hybrid DInSAR-PS superposition methodology by integrating the PS three-threshold method (based on coherence coefficient, amplitude dispersion index, and deformation velocity interval) with the Small Baseline Subset InSAR (SBAS-InSAR) technique. The merged time-series deformation results showed strong agreement with actual ground conditions. However, this method relies on a complex algorithm and still exhibits considerable deformation errors in large-scale collapse zones.
Although many studies have applied InSAR technology to deformation monitoring in mining areas, achieving high-precision and reliable measurements in the specific scenario of grouting to treat goaf areas still faces challenges. These challenges include the difficulty of extracting coherent targets in complex phase gradient regions, phase noise in non-urban environments, and significant errors in regions experiencing a large number of nonlinear deformations. Therefore, this study proposes an analysis method for the spatio-temporal distribution characteristics of surface deformation that integrates various InSAR technologies, using the grouting site of a goaf in a domestic area as the research area. A total of 79 SAR images were processed, comprising 39 RadarSAT-2 scenes (August 2019–September 2022) and 40 Sentinel scenes (July 2015–December 2016, January 2023–October 2024). Key findings include a significant shift from substantial pre-grouting deformation (subsidence: −98 mm/a; uplift: 134 mm/a) to markedly stabilized rates during (uplift: 18.7 mm/a; subsidence: −11.2 mm/a) and after grouting (uplift: 16.0 mm/a; subsidence: −10.0 mm/a). The spatio-temporal evolution of deformation derived from InSAR was consistent with leveling measurements, exhibiting excellent agreement. The principal contributions of this study are summarized below:
- (1)
- An analysis method for the spatio-temporal distribution characteristics of surface deformation in grouting and filling of the goaf is proposed, which integrates various InSAR technologies, effectively addressing the model errors of each InSAR technology and enhancing monitoring accuracy.
- (2)
- Through the analysis of regional settlement rates, cumulative settlement values over time series, and typical coherent points, the distribution characteristics of surface deformation in the study area from before grouting, during grouting, and after grouting are obtained. This reveals the variation law of surface deformation in the study area, showing a transition from surface subsidence and residual deformation caused by mining before grouting to slow surface subsidence and uplift during grouting, and then to the stabilization of surface deformation after grouting. These results can provide effective technical support for mining activities and the management of the mining area.
2. Research Area and Data Sources
2.1. Overview of the Research Area
The study area is situated in Shandong Province and covers approximately 15.8 km2 (see Figure 1). The region is characterized by the landform of mountain basin foothills with predominantly flat terrain. The surface elevation varies between +71.942 m and +103.790 m, showing a general decrease from south to north, with a relative height difference of about 25 m. The landform type is identified as an erosion-accumulation landform, presenting a simple terrain structure and a single landform category. No large faults were found within the study area, which provides favorable conditions for analyzing the deformation caused by mining without significant structural interference.
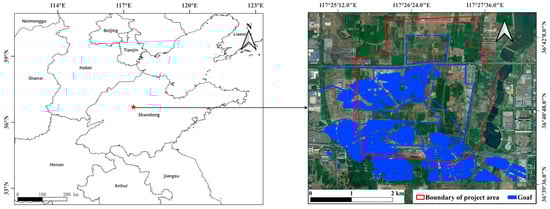
Figure 1.
Study area scope and the distribution of coal goaf.
During the coal mining period, three coal seams were either fully or partially extracted within the study area (the 1st coal seam, the 3rd coal seam, and the 9th coal seam), with operations officially closed on 30 September 2015. The mining method applied a single working face layout in both single-wing and double-wing mining zones, using the retreat mining method along the strike, while strip mining was employed in specific sections. The mine workings were located between −400 m and −725 m in elevation, with a total mining thickness varying between 0.5 and 3.9 m. The distribution of the mined-out zones is presented in Figure 1. The maximum mining depth of the working face reached 725 m. The surface subsidence duration was estimated at five years, a conclusion drawn in compliance with regulations governing coal pillar retention for mining beneath infrastructure, water bodies, railways, and key shafts.
Grouting projects were conducted in the study area to eliminate residual deformation that restricts land use. Based on the distribution of mined-out zones and a comprehensive analysis of geological mining conditions along with the characteristics of surface construction projects, the region was partitioned into four distinct treatment sectors. as illustrated in Figure 2. A grouting and filling scheme was applied, combining vertical drilling with directional drilling based on cluster wells, resulting in a total of 528 drilled holes. The construction period began in September 2021 and concluded in November 2022, with a total grouting volume of approximately 870,000 m3, as presented in Table 1.
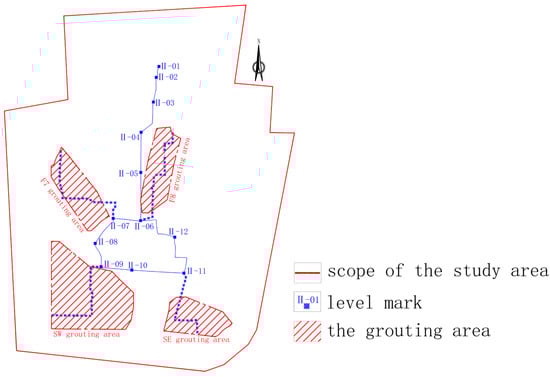
Figure 2.
Grouting area distribution.

Table 1.
Basic data of grouting areas.
2.2. Data Sources
This study employs RadarSAT-2 radar satellite C-band data together with Sentinel satellite data. The data are respectively sourced from the Canadian Space Agency (CSA) and the European Space Agency (ESA). The basic parameters of the RadarSAT-2 radar satellite XF mode data are provided in Table 2. The data spans the period from September 2019 to September 2022, covering a total of 39 acquisition periods, as summarized in Table 3. The Sentinel satellite data includes the periods from July 2015 to December 2016 and from January 2023 to October 2024. Precise orbital parameters for each data acquisition period were also collected. The DEM data used for calibration were derived from STRM data produced and released globally by NASA and the NGA. This DEM has a resolution of 30 m and an elevation accuracy of approximately 10 m, which adequately satisfies the terrain compensation requirements for InSAR data processing.
Table 2.
Basic parameters of RadarSAT-2 radar satellite XF mode data.
Table 3.
Data collected by the RadarSAT-2 radar satellite.
3. Data Processing Methods and Procedures
3.1. Data Processing Techniques
The analysis primarily applies a coherent target time series approach combined with the Small Baseline Subset (SBAS) technique. This method amalgamates all available SAR imagery of a given area into a number of smaller data subsets [29,30,31]. The calculation of coherent targets follows the combinatorial strategy of the Small Baseline Subset (SBAS) approach. This method effectively reduces geometric decorrelation caused by long baselines and improves temporal sampling, allowing a greater number of SAR images to contribute to the calculations [32,33].
Assuming there are M (M > 2) SAR images arranged in chronological order of acquisition, there exist N distinct interferometric pairs that meet the critical baseline condition, as expressed in Equation (1).
M/2 ≤ N ≤ M/(M − 1)
For all coherent points, the total differential phase value in any given interferogram is composed of four primary components: surface deformation, atmospheric phase delay, errors from the digital elevation model (DEM), and phase decorrelation, as detailed in Equation (2).
φdiff = φtopo + φdef + φorb + φatm + φnoise
In the formula: φtopo represents the residual caused by the inaccurate DEM data adopted Terrain phase. , Among them, T is the time baseline of the interferogram, and v is the average deformation rate within this time period. φorb is the orbital error phase; φatm and φnoise represent the phase introduced by the atmosphere and the phase introduced by noise, respectively.
The terrain phase can be corrected using an external DEM. A linear model is employed, followed by spatial and temporal filtering of the residual phase to isolate the atmospheric and nonlinear deformation components. The cumulative surface deformation phase is then derived by integrating the nonlinear deformation phase with the linear deformation phase, yielding the final deformation estimate.
3.2. Data Processing Workflow
Based on D-InSAR technology, an interferogram collection is constructed, and stable coherent target points are identified using the PS-InSAR. The phase information of these coherent target points is analyzed to determine surface subsidence rates and time series data. The overall technical workflow for data processing is presented in Figure 3.
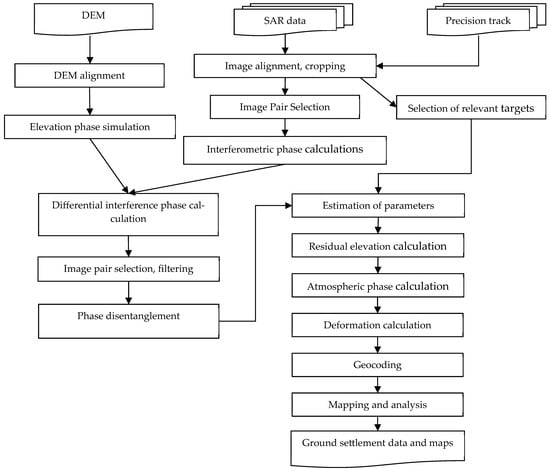
Figure 3.
Processing flow of SBAS-InSAR data.
- Radar Data Registration
Radar data registration is initially performed to obtain precise orbital data for each dataset, with the primary image selected from 24 November 2020. High-precision registration between the primary and secondary images is achieved by applying orthogonal correlation techniques, with the accuracy of mosaic data registration exceeding 0.2 pixels.
Digital Elevation Model (DEM) data are registered using the RadarSAT-2 primary image as the reference for DEM alignment. Terrain phase contributions in subsequent interferometric measurements are removed by incorporating the information from the DEM and the radar imaging geometry. SRTM DEM data covering the test area are obtained, and the external DEM data undergo coordinate system transformation, or geographic coding, based on SAR image geometry and related information.
This process establishes a transformation lookup table between the SAR images and the external DEM. Through DEM simulation, texture matching between SAR images is conducted, achieving a matching accuracy greater than 0.2 pixels, which allows for correction of the lookup table. Using this table, DEM data can be resampled into the SAR radar imaging coordinate system, and by integrating satellite orbital information, the correct terrain phase can be simulated, completing the differential processing of the interferometric phase.
Although the application of orthogonal correlation technology has achieved high-precision registration between images, sub-pixel-level registration errors are still inevitable. Such errors will introduce systematic phase deviations in the subsequent generated interferograms, especially in areas with significant terrain undulations, where the impact is more prominent. To effectively control the registration quality, in this paper, by statistically analyzing the average registration offset of all image pairs, abnormal image pairs with registration errors greater than 0.3 pixels are eliminated, thereby effectively suppressing the influence of this error source on the interference phase.
- Interference selection of image pairs and processing using D-InSAR technology
To form a sequence of interferometric pairs, each data point is systematically paired with its five nearest neighbors. This approach is formulated based on the baseline configuration of the gathered SAR dataset and the inherent behavior of regional ground deformation [34,35]. Specifically, 180 interferometric pairs were generated from 39 periods of RadarSAT-2 data, as shown in Figure 4. Based on the 24-day data sampling, the temporal baseline ranges from 24 to 120 days. Due to missing data in intermediate sections, some interferometric pairs exhibit longer temporal baselines, all of which remain less than 240 days. Interferometric processing is conducted on the pairs that satisfy the baseline requirements, generating a sequence of interferograms that are subjected to adaptive filtering. Following baseline estimation using precise orbital parameters, differential interferograms were generated, comprising phases associated with deformation, the atmosphere, and noise. A filtration criterion was then applied to remove interferograms corrupted by strong convection or those displaying significant residual fringes.
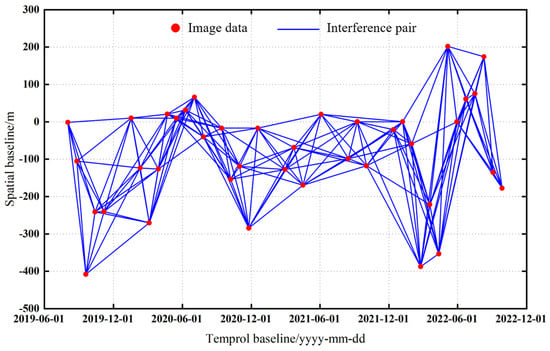
Figure 4.
Distribution of spatial-temporal baselines.
The measurement accuracy of D-InSAR technology is significantly affected by factors such as atmospheric delay effect and spatio-temporal incoherence. Among them, long spatial baselines can cause geometric decoherence, while long temporal baselines can intensify temporal decoherence. Both can lead to the degradation of interference phase quality. Furthermore, the phases contained in the differential interferogram are actually a mixed product of various signals such as surface deformation, atmospheric disturbances, satellite orbit errors, and random noise. To effectively suppress these uncertainties, this study set strict spatio-temporal baseline thresholds and visually inspected all the generated differential interferograms. During this process, two types of low-quality interferograms were eliminated: one was the result affected by intense atmospheric turbulence; the second was the result with obvious residual fringes (usually indicating phase unwrapping failure or the presence of high-gradient deformation). This quality control process provides a guarantee for the reliability of subsequent time series analysis.
- Coherent Objective Temporal Analysis
Coherent targets are objects that exhibit temporal stability in their backscattering properties and phase information. These targets, which are generally classified as either point-like or distributed scatterers, enable the measurement of surface deformation by analyzing their phase history over time. Identification of coherent target pixels relies on a stability detection algorithm requiring a large number of radiometrically corrected SAR images. The algorithm evaluates the stability of scattering characteristics using the discrete index of pixel intensity. Generally, more than 20 scenes of SAR data are necessary to obtain statistically reliable results. This study applies a point target detection algorithm to identify coherent targets and evaluates their correlation based on the degree of correlation between subviews. The differential interferometric phase derived from this process is utilized to extract the interferometric phase of coherent point targets. Spatial phase unwrapping is applied to the phases of these targets, and a Delaunay triangulation is constructed using their locations to detect residual points. The minimum cost flow algorithm is utilized to link positive and negative residual points, thereby producing unwrapped phase values for all points. For the differential interferometric phase series of coherent targets, a two-dimensional periodic function is applied to perform parameter inversion, which facilitates the determination of displacement rates and the correction of elevation errors for adjacent points. After multiple iterations of error adjustment, the correlation coefficient of the two-dimensional periodic function is improved to a range between 0.80 and 0.85, allowing for the precise retrieval of linear deformation rates.
The identification of coherent targets depends on the backscattering stability of the targets in the time series. In vegetated areas or farmlands, poor target stability can lead to insufficient density of coherent points. Furthermore, the phase unwrapping process, especially in regions with large deformation gradients or low coherence, is one of the largest sources of error in time series analysis. The linear model adopted for inversion may also fail to fully capture nonlinear deformation signals. To verify the reliability of the time series results, we have taken multiple measures: (1) We set an amplitude dispersion threshold to screen for high-quality permanent scatterers; (2) we use a robust combination of Delaunay triangulation and the minimum cost flow algorithm for phase unwrapping and manually check and correct the residual points detected in the triangulation; and (3) through iterative inversion, the correlation coefficient of the model is increased to between 0.80 and 0.85 to ensure the goodness of fit. Most importantly, we cross-validated the final obtained deformation rate and time series with independent leveling data (see Section 5.1 for details), which provided the most direct evidence for the accuracy of the entire time series analysis process.
4. Experimental Results and Analysis
4.1. Analysis of Regional Settlement Rates and Cumulative Settlement Values over Time
The study analyzes InSAR surface deformation data across three distinct time periods by integrating image processing techniques with GIS technology: July 2015 to December 2016 (prior to grouting), August 2019 to September 2022 (during grouting), and January 2023 to December 2023 (post-grouting). The results (Figure 5) indicate that positive values correspond to surface uplift, whereas negative values represent subsidence. The analysis indicates that between July 2015 and December 2016, the maximum subsidence rate observed was 98 mm/a, contrasted by a peak uplift rate of 134 mm/a. During the following period from August 2019 to September 2022, 20 points exhibited annual uplift rates surpassing 17 mm/a, where the highest uplift reached 18.7 mm/a and the greatest subsidence was recorded at −11.2 mm/a. In the most recent interval, from January to December 2023, the maximum uplift and subsidence rates were measured at 16.0 mm/a and −10.0 mm/a, respectively. Overall, the findings indicate a consistent decline in surface deformation rates, progressing from the pre-grouting phase through the grouting phase and into the post-grouting phase.
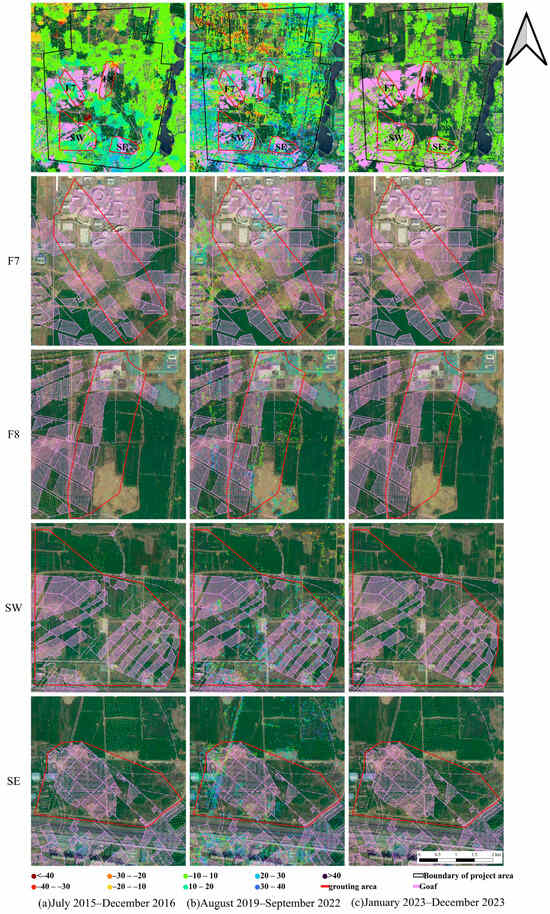
Figure 5.
Annual average deformation rates of the surface.
InSAR technology was employed to derive the distribution of cumulative surface deformation across various time periods, allowing for an assessment of overall ground movement within the study area. As shown in Figure 6, negative values correspond to subsidence, whereas positive values denote uplift.
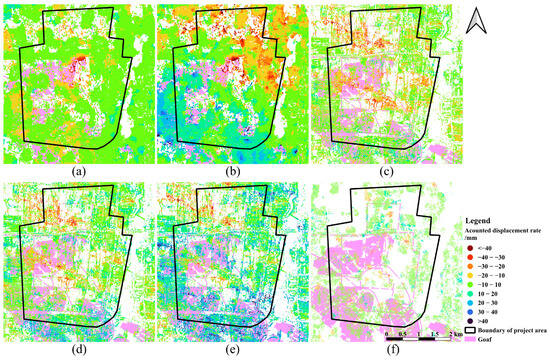
Figure 6.
Distribution of accumulated deformation of the surface. (a) From July 2015 to March 2016; (b) From July 2015 to December 2016; (c) From August 2019 to September 2020; (d) The period from August 2019 to September 2021; (e) From August 2019 to September 2022; (f) From January 2023 to December 2023.
Figure 6a,b reveal that the maximum subsidence value reached 50 mm during the period from July 2015 to March 2016, while the maximum subsidence value increased to 60 mm from July 2015 to December 2016. This reflects a gradual increase in maximum subsidence values, particularly evident in the expansion of the subsiding area in the northeastern region. These results indicate that the surface deformation caused by underground mining remained unstable, with the deformation magnitude continuing to increase progressively.
Figure 6c–e show that during the periods from August 2019 to September 2020, August 2019 to September 2021, and August 2019 to September 2022, the maximum subsidence values within the region were 34 mm, 39 mm, and 43 mm, respectively, showing minimal variation. In contrast, the maximum uplift values during these same periods were recorded at 26 mm, 40 mm, and 54 mm, with a pronounced increase in uplift observed after September 2021. Overall, from August 2019 to September 2022, the total subsidence values ranged between −43 mm and 54 mm, reflecting relatively minor cumulative deformation over the three-year span. The southern part of the region exhibited a general trend of uplift, while the northern part showed minimal deformation. The uplift in the southern area intensified between September 2021 and September 2022, with an expansion in the uplift range and an increasing trend in cumulative surface deformation. Investigations confirmed that grouting operations were conducted in the area, beginning in September 2021 and ending in November 2022. The observed trend of surface uplift corresponds with the timeline of the grouting project, indicating that the remediation measures effectively mitigated subsidence and induced uplift phenomena. Due to the fractured nature of the overlying strata in the mined-out areas, characterized by well-developed and interconnected fissures, a significant volume of grout was injected into the upper soil layers under high pressure, resulting in soil compaction and expansion, which caused surface uplift. In addition, high-pressure grouting can have induced varying degrees of expansion in the joints and fractures of the underlying bedrock in the old mined-out areas, producing upward movement of the rock layers that manifested at the surface as a certain degree of uplift.
Figure 6f indicates there is a marked reduction in the number of coherent points with reliable results, with the maximum subsidence value records at 32 mm and the maximum uplift value at 24 mm. This represents a substantial decrease compared to pre-grouting conditions and a slight reduction during the grouting process, further demonstrating that the grouting measures played a significant role in mitigating surface subsidence.
4.2. Analysis of Typical Coherent Point Settlement Values
Analysis of the surface subsidence monitoring results indicates that between August 2019–September 2022 and January–December 2023, ground deformation within the study area remained limited. To investigate subsidence patterns at representative coherent points, four observation locations situated above the mined-out area were selected: P1 (117.4397° E, 36.6871° N), P2 (117.4324° E, 36.6850° N), P3 (117.4370° E, 36.6746° N), and P4 (117.4491° E, 36.6713° N). The spatial distribution of these points is illustrated in Figure 7, and their respective time-series cumulative deformation is shown in Figure 8.
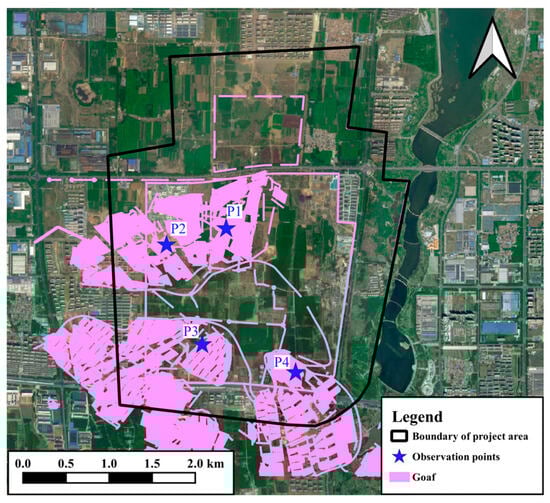
Figure 7.
Distribution of observation points locations.
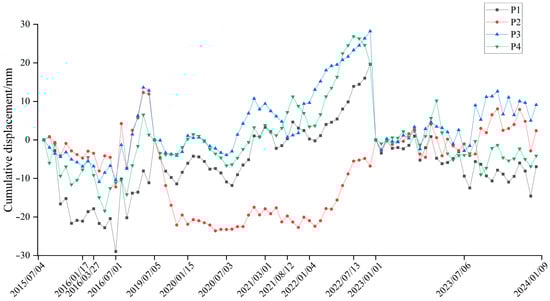
Figure 8.
Time series accumulated deformation distribution of observation points.
Figure 8 reveals that the four coherent points experienced consistent subsidence from July 2015 to December 2016, with the maximum recorded subsidence reaching 29 mm. Between July 2019 and October 2022, the deformation pattern shifted to gradual subsidence followed by progressive uplift, with the maximum subsidence reaching approximately 20 mm and the maximum uplift approaching 30 mm. During the period from January 2023 to December 2023, the deformation range at the four coherent points remained between −10 and +10 mm, indicating that the surface in this area stabilized and that the effects of grouting on mitigating subsidence were evident. The subsurface of these coherent points primarily consists of bands and localized old mining voids. Before grouting, subsidence was mainly caused by the instability of the overlying rock structure above the abandoned mining voids after the cessation of surface movement, along with the compaction of fractured rock layers and cavities. The subsequent uplift during the grouting process was directly related to the grouting activities, and the surface deformation gradually stabilized following the completion of the grouting operations.
5. Discussion
5.1. Discussion on Experimental Results
The entire experimental process demonstrated the deformation evolution and grouting effect of the old goaf. Before grouting: The high settlement rate (−98 mm/a) and uplift (+134 mm/a) reflect the unstable state of the continuous collapse, compaction and residual deformation of the overlying strata in the goaf. This is consistent with the “activation” phenomenon of goaf areas described in the literature [2]. During grouting, the deformation rate drops sharply. The reduction in settlement is due to the slurry filling the voids and fissures, supporting the overlying rock strata and preventing further collapse. The observed uplift (from +134 mm/a to +18.7 mm/a) is direct evidence of the grouting project. This is mainly due to the injection of high-pressure slurry, which causes the soil to compact and expand. Under pressure, the slurry squeezes into the loose cover layer, causing its volume to expand. After grouting, the deformation rate further stabilized at an extremely low level (−10.0 mm /a, +16.0 mm /a). This indicates that the grouting body has basically stabilized and played an effective supporting role, and the residual deformation has been effectively controlled. Minor residual deformation may result from the long-term consolidation of the slurry or extremely slow rheology of the rock mass.
A comparative analysis was conducted using leveling data collected during the same period within the study area to validate the accuracy of the processing results obtained using this method. The spatial distribution of the leveling points is shown in Figure 9. As these points do not exactly match the coherent points identified through image processing, the 16 leveling points nearest to the corresponding coherent points were chosen for comparison, as illustrated in Figure 10.
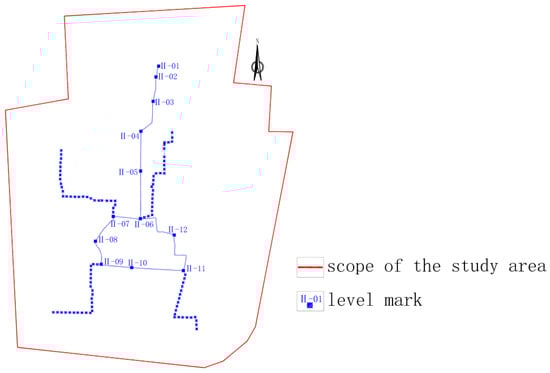
Figure 9.
Distribution of surface leveling points.
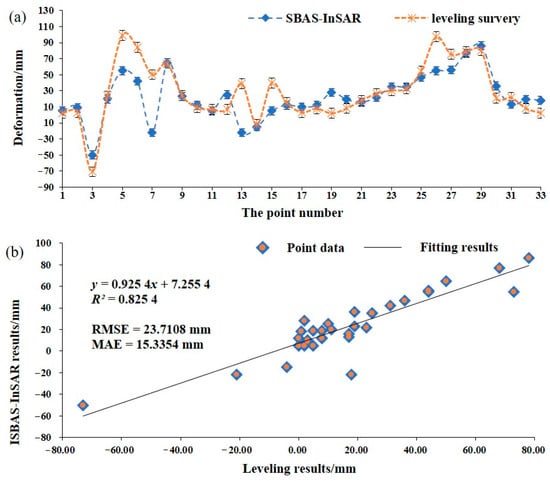
Figure 10.
Comparison between leveling measurement results and InSAR results. (a) Comparison of deformation trends; (b) Linear fitting result.
To further elaborate, Figure 10a intuitively reveals that the deformation trends derived from the proposed method and leveling survey are highly consistent. They show synchronous variations in deformation phases (e.g., ascending, descending stages) and near key feature points (such as peaks and valleys), with only minor local deviations, which reflects the reliability of the proposed method in capturing deformation trends. Additionally, Figure 10b quantitatively verifies this consistency: the coefficient of determination R2 for the fitting equation (with leveling results as the independent variable and proposed method results as the dependent variable) reaches 0.8254, indicating a significant linear correlation between the two methods. Model performance evaluation results showed that the root-mean-square error (RMSE) was 23.7108 mm and the mean absolute error (MAE) was 15.3354 mm. This demonstrates that the proposed method’s deformation monitoring results can well match those of leveling survey (a traditional high-precision deformation monitoring method). Combined with qualitative and quantitative analyses, it fully proves the effectiveness and accuracy of the proposed method in deformation monitoring, and its results can be used as a reliable basis for deformation analysis. When compared to other monitoring studies, our integrated InSAR approach demonstrates advantages in capturing complex deformation patterns. For instance, while traditional point-based methods like leveling provide high-accuracy validation at discrete points, they lack the spatial density to detect localized uplift or differential settlement patterns that our method revealed.
5.2. Comparative Analysis
In terms of grouting technology, the research found that the settlement rate decreased by approximately 90% after grouting, which is highly consistent with the research results of Chen et al. [28] in similar deep goaf areas (settlement reduction of 85–92%), jointly verifying the effectiveness of the grouting technology. However, we observed significant surface uplift (up to +54 mm), while Huang et al. [23] did not report obvious uplift in the mining area using the full filling method. This difference might stem from the high-pressure grouting process we adopted, which generates a stronger ‘splitting—squeezing’ effect. In contrast, the area studied by Huang et al. might have utilized low-pressure permeation grouting, mainly for filling.
In terms of technical application, the strategy of integrating D-InSAR, PS-InSAR and SBAS-InSAR adopted in this study effectively overcomes the difficulty of extracting coherent targets in complex phase gradient regions (such as the junction of uplift and settlement caused by grouting). This contrasts with the problem of coherence loss encountered by Zhang et al. [30] in the vegetation coverage area using only SBAS-InSAR, highlighting the advantages of multi-technology integration. The method proposed in this paper shows better performance than the traditional PS-InSAR [27] in capturing nonlinear deformations (such as instantaneous lifting during grouting), because SBAS components are more sensitive to distributed scatterers.
5.3. Limitations and Uncertainties
While our integrated InSAR method yielded robust results, it is imperative to acknowledge its limitations and associated uncertainties. Atmospheric Delays: Despite applying spatio-temporal filtering, residual atmospheric phase delays remain a primary source of error in InSAR measurements. These can mask or distort small-magnitude deformation signals, particularly in areas with significant topographic relief or variable weather conditions. Coherence Loss: In areas with dense vegetation, rapid deformation, or significant surface change, radar signal coherence can be lost. This prevents the retrieval of deformation data in such pixels, potentially creating gaps in the spatial analysis. Generalizability: The success of the grouting operation and the subsequent deformation response are highly dependent on site-specific factors such as geology, mining depth, grouting pressure, and volume. The quantitative deformation rates observed here are therefore characteristic of this specific case, although the overall trend and monitoring methodology are widely applicable.
5.4. Implications for Mine Safety and Sustainable Practices
The findings and the methodology developed in this study have direct and significant implications for mine safety and the sustainable management of mining-impacted lands.
Proactive Safety Management: The ability to monitor surface deformation with high spatial and temporal resolution provides a powerful tool for proactive risk management. It allows for the continuous assessment of the stability of grout-treated goafs, especially in areas proximal to critical infrastructure, buildings, or transportation routes. Early detection of anomalous deformation can serve as a warning sign for potential instability, enabling pre-emptive intervention and preventing catastrophic collapse.
Verification of Engineering Efficacy: This method offers a quantitative and objective means to verify the effectiveness of grouting treatments. By comparing pre- and post-grouting deformation rates, mining companies and regulatory bodies can assess whether the treatment has successfully achieved its design objectives, ensuring that safety standards are met before land is released for development.
Safe Urban Expansion and Land Reuse: In many mining regions, the scarcity of land drives construction above old goafs. Our research provides a scientific foundation for the safe reuse of these lands. By accurately characterizing the residual deformation and confirming its stabilization post-grouting, it enables informed planning and risk assessment for future construction projects, thereby supporting the sustainable expansion of mining cities.
6. Conclusions
- (1)
- An integrated approach to analyzing the spatio-temporal characteristics of surface deformation was developed by synthesizing multiple InSAR methodologies, including D-InSAR, PS-InSAR, and SBAS-InSAR. This method applies a strategy to select image pairs with optimal spatial and temporal baselines from SBAS images. Using D-InSAR as the foundation, an interferogram collection is generated, and stable coherent target points are identified through the PS method. The phase information of these coherent target points is resolved to derive surface subsidence rates and time series. The comparison with the leveling measurement data shows that the accuracy of this method meets the requirements and it is suitable for monitoring the residual deformation of the surface after grouting
- (2)
- Through an examination of regional subsidence rates, cumulative settlement values over time, and typical coherent points, the study outlines the distribution characteristics of surface deformation in the research area across the pre-grouting, grouting, and post-grouting stages. The findings show the progression of surface deformation patterns, indicating that prior to grouting, mining activities lead to surface subsidence and residual deformation. During grouting, the deformation gradually shifts to subsidence and uplift, and following grouting, the deformation stabilizes.
- (3)
- Prior to grouting (July 2015–December 2016), the study area exhibited peak deformation rates, with subsidence reaching 98 mm/a and uplift attaining 134 mm/a. During the grouting phase (August 2019–September 2022), these rates were substantially reduced, with maximum uplift and subsidence measured at 18.7 mm/a and −11.2 mm/a, respectively. The maximum uplift rate is 16.0 mm/a, and the maximum subsidence rate is −10.0 mm/a in the post-grouting stage (January 2023–December 2023). Overall, from the pre-grouting stage through the grouting and post-grouting stages, the surface deformation rates in the project area show a consistent declining trend.
The method proposed in this study provides key technical support and scientific basis for the mining area to achieve the goal of coordinated development of “environment, society and economy”. This method, through precise monitoring and assessment of the residual deformation in the goaf and the effect of engineering treatment, directly serves the effective restoration of the geological environment of the mine, ensuring the long-term safety of the surrounding communities of the mining area and avoiding social and economic losses caused by secondary surface deformation. Meanwhile, this method has laid a solid foundation for the ecological restoration and safe reuse of mining area land, effectively promoting the coordination between mineral resource development and regional ecological environment protection, and has significant practical significance for promoting the green transformation and sustainable development of resource-based regions. Future work may adopt advanced atmospheric correction models and combine InSAR with other monitoring technologies to obtain more comprehensive spatio-temporal distribution characteristics of surface deformation in the grouting and filling of old goaf areas.
Author Contributions
Conceptualization, X.L. and H.D.; methodology, X.L. and H.D.; software, X.L. and J.F.; formal analysis, X.L. and F.L.; investigation.; resources, F.L.; writing—original draft preparation, X.L.; writing—review and editing, X.L. and H.Z.; visualization, J.F.; supervision, H.Z.; project administration, X.L. All authors have read and agreed to the published version of the manuscript.
Funding
This research was funded by the Science, Technology, and Innovation Fund of CCTEG Ecological Environment Technology Co., LTD., grant number 0206KGST0027, and the Laboratory management project of CCTEG Ecological Environment Technology Co., Ltd., grant number 0209KGST0002.
Institutional Review Board Statement
Not applicable.
Informed Consent Statement
Not applicable.
Data Availability Statement
The radar data and the Precise Orbit Determination (POD) data were obtained from the European Space Agency’s (ESA) Sentinel-1A satellite (https://search.asf.alaska.edu/ (accessed on 7 August 2024)). The external Digital Elevation Model (DEM) utilized was derived from the Shuttle Radar Topography Mission (SRTM) (https://earthexplorer.usgs.gov/ (accessed on 7 August 2024)).
Conflicts of Interest
Authors Xingli Li, Fengming Li, Haolei Zhang and Jun Fang were employed by the CCTEG Ecological Environment Technology Co., Ltd. The remaining authors declare that the research was conducted in the absence of any commercial or financial relationships that could be construed as a potential conflict of interest.
References
- Statistical Bulletin on National Economic and Social Development of the People’s Republic of China, 2023. Available online: https://www.yicaiglobal.com/star50news/2024_02_296663307186254381071 (accessed on 4 November 2025).
- Zhang, H. Research and Application of the Distribution Patterns of Residual Voids in Old Mining Areas. Ph.D. Thesis, China University of Mining and Technology, Xuzhou, China, 2013. [Google Scholar]
- Ghulam, A.; Grzovic, M.; Maimaitijiang, M.; Sawut, M. InSAR monitoring of land subsidence for sustainable urban planning. In Remote Sensing for Sustainability; CRC Press: Boca Raton, FL, USA, 2016; pp. 61–65. [Google Scholar]
- Liang, Y. Research on Grouting Reinforcement in Old Mining Areas of Longwall Mining to Mitigate Residual Subsidence of Overburden. Master’s Thesis, Shandong University of Science and Technology, Qingdao, China, 2020. [Google Scholar]
- Xu, L.; Guo, H.; Zhu, N.; Qin, C. Study on residual deformation law of overlying rock strata and surface above old mined goaf under the building loading. Bull. Surv. Mapp. 2015, 5, 103–108. [Google Scholar]
- Castellazzi, P.; Garfias, J.; Martel, R.; Brouard, C.; Rivera, A. InSAR to support sustainable urbanization over compacting aquifers: The case of Toluca Valley, Mexico. Int. J. Appl. Earth Obs. Geoinf. 2017, 63, 33–44. [Google Scholar] [CrossRef]
- Liu, M.; Li, W.; Ye, Y.; Li, X.; Wei, W.; Xin, C. Identification and Assessment of Geological Hazards in Highly Vegetated Areas Based on Multi-Source Radar Remote Sensing Data: Supporting Sustainable Disaster Risk Management. Sustainability 2025, 17, 8070. [Google Scholar] [CrossRef]
- Zhou, D.; Zuo, X.; Zhao, Z.; Xi, W.; Ge, C. Prediction of urban land subsidence by SBAS-InSAR and improved BP neural network. Geol. Bull. China 2023, 42, 1774–1783. [Google Scholar]
- Wang, F.; Tao, Q.; Liu, G.; Chen, Y.; Han, Y.; Guo, Z.; Liu, X. Monitoring of surface deformation in mining area integrating SBAS InSAR and logistic function. Environ. Monit. Assess. 2023, 195, 1493. [Google Scholar] [CrossRef]
- Wang, Z.; Zhao, Y.; Wang, P.; Wang, X.; Jiang, A.; Zhang, G.; Li, W.; Liu, J. Refined subsidence monitoring and dynamic prediction in narrow and long mining areas based on InSAR and probabilistic integral method. Sci. Rep. 2024, 14, 28009. [Google Scholar] [CrossRef]
- Zhu, M.; Yu, X.; Tan, H.; Yuan, J. Integrated high-precision monitoring method for surface subsidence in mining areas using D-InSAR, SBAS, and UAV technologies. Sci. Rep. 2024, 14, 12445. [Google Scholar] [CrossRef]
- Chen, Y.; Yu, S.; Tao, Q.; Liu, G.; Wang, L.; Wang, F. Accuracy verification and correction of D-InSAR and SBAS-InSAR in monitoring mining surface subsidence. Remote Sens. 2021, 13, 4365. [Google Scholar] [CrossRef]
- Wang, Z.; Dai, H.; Yan, Y.; Liu, J.; Ren, J. Combination of InSAR with a depression angle model for 3D deformation monitoring in mining areas. Remote Sens. 2023, 15, 1834. [Google Scholar] [CrossRef]
- He, Q.; Wei, L.; Xiao, Y. Analysis of spatial-temporal distribution characteristics and influencing factors of land subsidence in Bozhou City, Anhui Province based on SBAS-InSAR technology. Chin. J. Geol. Hazard Control 2023, 34, 81–90. [Google Scholar]
- Liu, X.; Tao, Q.; Niu, C.; Li, B.; Zhang, Y.; Ren, Y. Comparative analysis and veriffcation of D-InSAR and SBAS-InSAR in mining subsidence monitoring. Prog. Geophys. 2022, 37, 1825–1833. [Google Scholar]
- Wang, L.; Zhang, X.N.; Chi, S.S.; Zha, J.F. Parameter inversion model for mining subsidence prediction based on fusion of InSAR and GA. Geomat. Inf. Sci. Wuhan Univ. 2018, 43, 1635–1641. [Google Scholar]
- Colomina, I.; Molina, P. Unmanned aerial systems for photogrammetry and remote sensing: A review. ISPRS J. Photogramm. Remote Sens. 2014, 92, 79–97. [Google Scholar] [CrossRef]
- Zhao, J.; Yang, X.; Zhang, Z.; Niu, Y.; Zhao, Z. Mine subsidence monitoring integrating DS-InSAR with UAV photogrammetry products: Case studies on Hebei and Inner Mongolia. Remote Sens. 2023, 15, 4998. [Google Scholar] [CrossRef]
- Long, N.Q.; Goyal, R.; Bui, L.K.; Cuong, C.X.; Canh, L.V.; Minh, N.Q.; Bui, X.N. Optimal choice of the number of ground control points for developing precise DSM using light-weight UAV in small and medium-sized open-pit mine. Arch. Min. Sci. 2021, 66, 369–384. [Google Scholar]
- Du, S.; Wang, Y.; Zheng, M.; Zhou, D.; Xia, Y. Goaf locating based on InSAR and probability integration method. Remote Sens. 2019, 11, 812. [Google Scholar] [CrossRef]
- Zhang, L.; Gao, P.; Gan, Z.; Wu, W.; Sun, Y.; Zhu, C.; Long, S.; Liu, M.; Peng, H. Surface subsidence monitoring of mining areas in hunan province based on Sentinel-1A and DS-InSAR. Sensors 2023, 23, 8146. [Google Scholar] [CrossRef]
- Fan, H.; Li, T.; Gao, Y.; Deng, K.; Wu, H. Characteristics inversion of underground goaf based on InSAR techniques and PIM. Int. J. Appl. Earth Obs. Geoinf. 2021, 103, 102526. [Google Scholar] [CrossRef]
- Huang, X.; Li, X.; Li, H.; Duan, S.; Yang, Y.; Du, H.; Xiao, W. Study on the Movement of Overlying Rock Strata and Surface Movement in Mine Goaf under Different Treatment Methods Based on PS-InSAR Technology. Appl. Sci. 2024, 14, 2651. [Google Scholar] [CrossRef]
- Xia, Y.; Xia, F.; Hui, Z.; Li, H.; Wan, R.; Ai, J. Combined ps-insar technology and high-resolution optical remote sensing for identifying illegal underground mining in the suburb of yangquan city, shanxi province, China. Remote Sens. 2023, 15, 3565. [Google Scholar] [CrossRef]
- Lee, S.J.; Yun, H.S.; Kwak, S.W. Sustainable Risk Mapping of High-Speed Rail Networks Through PS-InSAR and Geospatial Analysis. Sustainability 2025, 17, 7064. [Google Scholar] [CrossRef]
- Sajjad, M.M.; Wang, J.; Afzal, Z.; Hussain, S.; Siddique, A.; Khan, R.; Ali, M.; Iqbal, J. Assessing the impacts of groundwater depletion and aquifer degradation on land subsidence in Lahore, Pakistan: A PS-InSAR approach for sustainable urban development. Remote Sens. 2023, 15, 5418. [Google Scholar] [CrossRef]
- Lu, X.; Li, X.; Zhang, Q.; Huang, H. Surface subsidence monitoring of old goaf based on the PS-InSAR technology. China Min. Mag. 2019, 28, 104–110. [Google Scholar]
- Chen, Y.; Dong, X.; Qi, Y.; Huang, P.; Sun, W.; Xu, W.; Tan, W.; Li, X.; Liu, X. Integration of DInSAR-PS-stacking and SBAS-PS-InSAR methods to monitor mining-related surface subsidence. Remote Sens. 2023, 15, 2691. [Google Scholar] [CrossRef]
- Wang, R.; Fei, M.; Liang, S.; Xue, H.; Luo, X. Monitoring of surface deformation characteristics in Xi’an based on SBAS-InSAR technology. Bull. Surv. Mapp. 2023, 1, 173–178. [Google Scholar]
- Zhang, F.; Chang, L.; Xun, Z. Surface deformation monitoring in Yanghuopan Mining Area based on SBAS-InSAR technology. China Min. Mag. 2024, 33, 152–159. [Google Scholar]
- Liang, S.; Hu, H. Analysis of residual deformation in goaf based on SBAS-InSAR technology. China Min. Mag. 2022, 31, 70–78. [Google Scholar]
- Yang, L.; Xue, D.; Wang, H.; Fu, L.; Zhang, T. Time series InSAR surface deformation monitoring in Wulonggou Mining Area. China Min. Mag. 2021, 30, 107–112. [Google Scholar]
- Zhang, J.; Cui, L.; Liu, Z.; Wang, X.; Lin, L.; Xu, F. Large-area surface deformation monitoring using Sentinel-1 SAR data and SBAS technology. Bull. Surv. Mapp. 2020, 7, 125–129. [Google Scholar]
- Ma, X.; Wu, P. Polarimetric radar image despeckling by iteratively refined nonlocal means. Acta Geod. Cartogr. Sin. 2019, 48, 1038–1045. [Google Scholar]
- Liu, Z.; Lu, C.; Zhang, S.; Li, M.; He, Z. Surface subsidence monitoring in mining area based on multi-threshold target extraction time series InSAR. China Min. Mag. 2022, 31, 79–85. [Google Scholar]
Disclaimer/Publisher’s Note: The statements, opinions and data contained in all publications are solely those of the individual author(s) and contributor(s) and not of MDPI and/or the editor(s). MDPI and/or the editor(s) disclaim responsibility for any injury to people or property resulting from any ideas, methods, instructions or products referred to in the content. |
© 2025 by the authors. Licensee MDPI, Basel, Switzerland. This article is an open access article distributed under the terms and conditions of the Creative Commons Attribution (CC BY) license (https://creativecommons.org/licenses/by/4.0/).