Abstract
The tourism industry is currently experiencing a substantial digital transformation, with Online Travel Agencies (OTAs) committed to integrating innovations such as artificial intelligence (AI) in order to enhance service delivery and personalize user experiences. This study investigates the relationship between the utilization of AI and the technical quality scores of tourism websites, aiming to identify significant associations and variances in the critical conversion phase. An exploratory research design is employed to evaluate the technical quality of three prominent international tourism websites, i.e., Booking.com, Airbnb.com, and Tripadvisor.com. The investigation uses Google Lighthouse, with Performance, Accessibility, Best Practices, and Search Engine Optimization (SEO) as variables analyzed across both desktop and mobile versions, as well as on pages with and without AI functionality. Data analysis is performed using JASP (version 0.19.3), including linear regression analysis to quantify the predictive relationship. The analysis confirms that the Performance variable is the most sensitive to the influence of AI. AI integration demonstrates a significant positive influence on the Performance score of travel websites. The regression model indicates that AI usage explains 78.9% of the variation in the Performance score ( = 0.789, p < 0.001), indicating a substantial correlation with technical sustainability. Nevertheless, there remains an ongoing necessity for optimization, particularly with regard to the enhancement of overall performance and improvement of scores for mobile devices. The study acknowledges certain limitations related to the sample size of AI applications and the accessibility of specific AI versions in particular geographic regions.
1. Introduction
The tourism industry has experienced a significant transformation due to the impact of digital technology, the Internet, and mobile telecommunications technologies (ICT) [1]. This evolution has redefined the distribution channels of travel services and has substantially altered consumer perceptions on the procurement of tourist packages [2].
The significance of this evolution is obvious, with Online Travel Agencies (OTAs) serving as a pivotal component in this transformation [2]. OTAs have emerged as the preferred sales channel for travel and accommodation services, developing into critical aggregators that connect consumers with offline suppliers [2]. Their business model is undergoing continuous evolution, transitioning from web services to mobile applications. [2,3]. Additionally, they are incorporating innovations such as consumer intelligence, data mining, and artificial intelligence (AI) to enhance customer service [2,4].
Artificial intelligence (AI) equips OTAs to deliver personalized and contextually relevant services in real time, personalized recommendation systems, and chatbots [5,6].
Artificial intelligence has the potential to significantly reduce operational costs by automating administrative and support tasks, thereby reallocating resources towards higher-value activities. AI algorithms facilitate the development of personalized recommendation systems that analyze user data so that OTAs may deliver tailored travel suggestions, subsequently enhancing user experience and increasing booking rates. Customer service chatbots proficiently manage inquiries and reservations, offering immediate support and reducing human workload. The implementation of dynamic pricing models allows for real-time adjustments of prices based on demand and market conditions, optimizing revenue generation. AI-powered analytics tools enable OTAs to forecast travel trends and consumer behavior, thereby enhancing strategic management. The integration of AI can markedly improve user experiences through the provision of personalized services that are dynamically developed via technology and AI-enhanced human interactions. This advancement not only fosters competitiveness but also facilitates market entry into new domains [6]. Similarly, innovations such as VoiceBack, an artificial intelligence-driven voice-based feedback system, are designed to enhance communication and support throughout the online booking process [7].
This focus on AI applications and their impact on customer experience aligns with the emerging research frontier clearly identified in the thematic cluster analysis (Cluster 3) presented in Section 3 (see Figure 1).
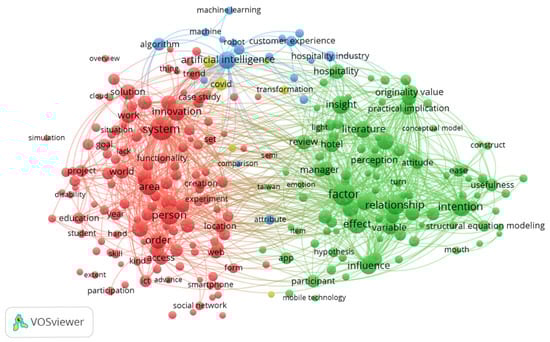
Figure 1.
VOSviewer 1.6.20 clusters.
Researchers collectively investigate the quality of electronic services, technical performance, and the implications of emerging technologies on user experience. The literature has shown that understanding the factors that constitute e-service quality significantly influences customer satisfaction and repurchase [8,9,10].
However, the academic discourse is structurally polarized, as demonstrated by the bibliometric analysis: while one stream focuses on subjective user perception and acceptance factors (Cluster 2), the other focuses on AI applications (Cluster 3). AI has the potential to enhance productivity and minimize human error within the code development process. Conversely, organizations may leverage artificial intelligence for data analysis and predictive modeling [11].
Despite its importance, the literature has failed to directly quantify and integrate the objective relationship between AI usage and technical quality scores within evaluation models. This structural gap, confirmed by the literature mapping (Section 3), indicates a disjunction between innovation metrics and technical performance metrics. Therefore, our study adopts an exploratory approach to investigate the predictive nature of the relationship between the use of AI features and the technical performance of travel websites, with a specific focus on simulating the critical conversion phase (purchasing a tour). The main objective of this exploratory research is to identify and quantify the variables measured by Lighthouse that demonstrate a significant association with the presence or absence of AI features.
The article is structured into five primary sections: introduction, bibliometric analysis aimed at identifying gaps within the existing literature, methodology section that elaborates on the application of the Lighthouse tool and the JASP statistics program, and, lastly, the results derived from the statistical analysis. The article concludes with a fifth section that synthesizes the findings.
1.1. E-Service Quality
E-service quality (e-SQ) is conceptualized as the evaluative judgments made by customers regarding the quality of services rendered within a digital environment. Broadly speaking, e-SQ encompasses the capacity of e-commerce platforms to facilitate efficient and effective communication with consumers, encompassing essential functions such as searching, purchasing, ordering, and fulfilling consumer requests [12].
The research highlights the need to understand the factors that constitute e-service quality for customers of Online Travel Agencies, given that these factors significantly influence customer satisfaction and repurchase intentions. Bernardo et al. [8] delineate two main dimensions, namely functional and hedonic, which diverge from traditional definitions. The authors specify that the functional dimension refers to the technical efficiency and usefulness of the website. Traditionally, the evaluation of this dimension has been based on either compliance with standards or the subjective perception of users. The present study extends and complements Bernardo et al.’s [8] concept of functional dimension (technical efficiency) by integrating objective measurements. With the proliferation of dynamic technologies based on artificial intelligence (AI), technical efficiency can no longer be assessed solely through perception. By using Lighthouse scores, this study moves from subjective to objective evaluation. Thus, our contribution provides the empirical basis and metrics needed to assess the technical sustainability of the functional dimension in a dynamic, AI-dominated digital environment.
E-SQ comprises both a process or functional dimension and an output or technical dimension. Within the scope of this study, the technical quality of a website is of paramount importance, significantly influenced by various characteristics including layout, visual complexity, user-friendliness, speed of processing visitor requests, and overall reliability. The speed at which visitor requests are processed serves as a critical determinant of both the reliability and professionalism of a website [13].
The functionality and user-friendliness of websites and mobile applications are critical for hotel bookings, encompassing the provision of detailed information, efficient communication, rapid transactions, and relationship management features [3]. Moreover, the adaptation to digital technology via innovative practices is essential for the performance and survival strategies of small- and medium-sized enterprises (SMEs), including Advanced Technology Organizations (ATOs) [6]. Key factors such as perceived security, which exerts a positive influence, and perceived privacy, which has a negative impact, are pivotal in shaping travelers’ intentions to engage in online purchasing [1,12,14]. In this dynamic landscape, travel enterprises, encompassing traditional travel agencies and global distribution systems (GDSs), have faced challenges due to disintermediation. Research indicates that perceived usefulness, perceived ease of use, perceived trust, and ubiquitous connectivity substantially impact the intention to purchase tourism products and services via mobile devices [1].
Consequently, this study aims to objectively quantify these functional and technical elements, which are pivotal for the conversion phase, utilizing the Google Lighthouse tool.
1.2. Google Lighthouse as an Assessment Tool
Ioannis Drivas et al. [15] describe the metrics utilized for evaluating technical performance as follows: Total Performance Score: This metric assesses the performance of a web page across mobile and desktop devices, emphasizing critical factors such as loading speed, responsiveness, and visual stability. First Contentful Paint (FCP): This measurement quantifies the duration required for visible content on the web page, such as text and images, to appear on the screen. For an optimal user experience, it is recommended that FCP occurs within 1.8 s or less. Total Blocking Time (TBT): This metric gauges the duration following FCP during which the main thread is obstructed, thereby inhibiting user interaction with the web page. To provide an adequate user experience, web pages should strive for a TBT of less than 200 milliseconds. Speed Index: This estimate assesses the rapidity with which the visual content of a web page becomes visible during the loading process. Scores below 3.4 s are classified as indicative of fast performance. Largest Contentful Paint (LCP): This metric calculates the time taken to render the largest visible element within the viewport following navigation. An LCP of 2.5 s or less is deemed optimal for fostering a positive user experience. Cumulative Layout Shift (CLS): This metric evaluates the visual stability of a web page by monitoring unexpected alterations in visible elements. A favorable CLS score is defined as 0.1 or less.
Lighthouse serves as an automated audit tool that produces scores ranging from 0 to 100 across five critical categories: Performance, Accessibility, Best Practices, and Search Engine Optimization (SEO). Subsequently, we delineate each indicator in accordance with the definitions established by Chrome [16]. Performance: Once Lighthouse has collected the performance metrics, primarily measured in milliseconds, it converts each raw metric value into a score ranging from 0 to 100. This conversion is based on where the metric falls within Lighthouse’s scoring distribution, which follows a log-normal distribution derived from real website performance data in the HTTP Archive. For instance, Largest Contentful Paint (LCP) measures the moment a user perceives that the largest visible content on a page has loaded. The LCP metric value reflects the time taken from the moment the user initiates the page load to the moment the primary content is rendered. Based on actual website data, top-performing sites achieve an LCP of approximately 1220 ms, which corresponds to a score of 99; The Lighthouse Accessibility score, in contrast, is calculated as a weighted average of all accessibility audits, with weights determined by axe user impact assessments (https://developer.chrome.com/docs/lighthouse, accessed on 6 September 2025). Each accessibility audit results in a pass or fail outcome. Unlike Performance audits, a page does not receive partial credit for an accessibility audit. For instance, if certain buttons on a page have accessible names while others do not, the page will receive a score of 0 for the buttons that do not have an accessible name audit. The 16 Best Practices tested by Lighthouse primarily focus on the security aspects of websites and modern web development standards. HTTPS and HTTP/2 verify that resources originate from secure sources and assess the vulnerability of JavaScript libraries. Additional Best Practices address secure database connections and discourage the use of insecure commands, such as document.write(), as well as the incorporation of outdated APIs [17]; SEO Lighthouse conducts a variety of tests to evaluate how effectively a website or app can be crawled by search engines and appear in search results. Google labels these tests as “SEO,” but they are quite limited. If the website or app does not achieve a perfect score, it is important to implement the necessary corrections. After making these adjustments, search engine optimization can unlock significant opportunities for further enhancements that should definitely be considered [17].
1.3. Sustainability AI in Tourism
Artificial intelligence has been acknowledged to have an increasingly transformative role in the tourism industry, fostering improvements in efficiency, personalization, and innovation throughout travel and hospitality [18,19,20]. Tussyadiah [18] highlights the applications of automation in tourism experiences and structures a research agenda focusing on four key priorities: designing beneficial AI, facilitating its adoption, assessing its broad impacts, and ensuring the creation of a sustainable future with these intelligent systems. In the same vein, Chavan et al. [19] investigate specific applications of AI, including sentiment analysis of social media data, personalized services, administrative automation, and fostering sustainability through positive tourist behavior change and smart resource management. As noticed, research has naturally expanded to encompass themes of economic, sociocultural, and environmental sustainability [16,21] in response to the global sustainability and ethics agenda. Majid et al. [21] underscore that sustainability must be at the heart of any tourism operation, noting the attention that should be paid to aspects of environmental conservation, along with economic and sociocultural sustainability. The authors propose an “AI4GoodTourism” framework that may strengthen the sustainable use of intelligent automation in tourism.
In addressing sustainability, AI has the potential to transform tourism practice in two ways. On the one hand, AI has the potential to facilitate more personalized and mindful-focused, sustainable travel experiences, and support decision-making that ensures the industry’s long-term growth and resilience [16,20,22,23].
Majid et al. [21] name five themes of intelligent automation research within the “AI4GoodTourism” framework: intelligent automation to enhance tourist experience; intelligent automation to preserve heritage; intelligent automation to promote quality of life; intelligent automation to measure tourist experience; and intelligent automation to conserve the environment. Other studies, synthesized by Chavan et al. [19], link artificial intelligence and robotics to sustainability and resilience within the tourism sector and highlight some key areas: tourism trend prediction and management, smart resource management, robot-assisted services, robot-assisted services, waste management, feedback and reviews, eco-friendly route planning, and AI for wildlife conservation.
On the other hand, the concept of sustainability usage, particularly in the context of digital systems and services like the Internet, focuses on technical methods used to minimize environmental impact, primarily by reducing carbon emissions and energy consumption [22,23,24].
AI enhances technology by optimizing processes, such as reducing energy consumption on websites and digital platforms, making systems more efficient and environmentally friendly. In addressing low-emission and sustainable approaches to web design and optimization, Krol [24] assesses the conformity of websites with Green SEO and low-emission digital design principles. The role of artificial intelligence (AI) is focused on auditing, measurement, and data analysis. Within this context, the main contribution is the operationalization of Green Software Engineering (GSE) and Sustainable Interaction Design (SID).
Other researchers are skeptical. Sanchez-Cuadrado and Morato [23] maintain that emerging technologies such as 5 G, AI, and cryptocurrencies are contributing to the global increase in electricity consumption and call for more appropriate technical instruments to measure and control carbon emissions and energy consumption during digital activities.
The variables analyzed in this research, i.e., Performance, Accessibility, Best Practices, and Search Engine Optimization (SEO), fall within the two areas of AI intervention.
Accessibility and Best Practices, described by indicators like efficient navigation, searchability, security, and modern, responsible web development standards, and guided by personalization and eco-friendliness, can be enhanced through AI potential to facilitate more personalized and mindful-focused, sustainable travel experiences.
Performance and SEO, described by indicators like speed, efficiency, technical performance of websites, responsiveness, code quality, page load stability, and guided by efficiency and control, are driven by the AI potential to improve technical parameters. In this paper, we trace the elements of technical sustainability. We examine the elements of technical sustainability in terms of the parts they may play in shaping future sustainability investigations.
2. Bibliometric Analysis
In this study, we performed a bibliometric analysis of the scientific literature based on the Web of Science databases, concentrating on the intersection of artificial intelligence (AI), website quality, and the tourism sector.
2.1. Literature Review on Artificial Intelligence and Website Quality in Tourism
On 6 June 2025, we commenced our analysis of artificial intelligence and its impact on Website Quality in the Tourism sector.
Purpose: To identify underexplored research niches and potential avenues for future inquiry, particularly within the context of digital travel service quality.
Bibliometric Analysis Methodology, performed on the platform Web of Science, included articles, conference papers, and books. The investigation spanned a period of 10 years from 2015 to 2025.
In the subsequent sections, we delineate the keywords employed to conduct the database search, along with the resulting query. The keywords were generated utilizing Power Thesaurus.
Keywords for tourism website quality: user experience, website performance, customer satisfaction, usability, user interface, user surface, design and functionality, experience of a person using an application, presentation and interaction, customer experience, easier to use, convenient operation, experience of the users, handling properties, experience of clients, experience of end-users, look and interaction, functionality of the site, accessibility.
Keywords for tourism: tourism business, tourism sector, travel websites, travel platforms, travel booking site.
Keywords for tourism AI: artificial intelligence, natural language processing, computer-aided testing, ai, information technology.
Query: TS = (website* quality OR user experience OR website performance OR customer satisfaction OR usability OR user interface OR user surface OR design and functionality OR experience of a person using an application OR presentation and interaction OR customer experience OR easier to use OR convenient operation OR experience of the users OR handling properties OR experience of clients OR experience of end-users OR look and interaction OR functionality of the site OR accessibility) AND TS = (tourism business OR tourism sector OR travel websites OR travel platforms OR travel booking site) AND TS = (artificial intelligence OR natural language processing OR computer-aided testing OR ai OR information technology).
Results: A total of 547 results were obtained.
Visualization tool: VOSviewer was employed for cluster analysis and visualization.
2.2. Key Findings from the VOSviewer Analysis—Clusters
An analysis of binary terms using VOSviewer revealed four distinct clusters:
- People-Oriented Innovation in Specific Systems and Areas (131 Terms)
Cluster 1 emphasizes human-centered innovation across various systems and domains, proposing a comprehensive approach to human interaction with technology. The dominant term is system (with 1657 links); other important keywords include area (1051), person (1291), and innovation (1069). This cluster constitutes the foundational conceptual and methodological framework of the analyzed literature, emphasizing the interplay between innovation, the working environment, and the human user. It synthesizes research that examines system design and the processes through which innovations are implemented, accepted, or prioritized across diverse organizational and social contexts.
- 2.
- Analysis of Relationships, Factors, and Impact (101 Terms)
The terms within Cluster 2 exhibit a robust interconnection with those in Cluster 1, suggesting that the examination of factors and relationships—such as user intention and the impact of technology—is frequently associated with systems and innovation. The dominant term is factor (with 1815 links); other important keywords include relationship (1292), intention (1260), insight (1156), effect (1266), and influence (1051). This research cluster emphasizes the exploration of causal mechanisms and empirical validation regarding the influence of technology on user behavior. The robust interrelationship among intention, perception, and various factors, coupled with the application of structural equation modeling (SEM), unveils a focus on psychological and sociological frameworks that elucidate the decision-making processes related to the adoption and utilization of innovations. This cluster exemplifies a conventional quantitative methodology for assessing the efficacy of a “system” (Cluster 1). The term “insight” highlights the emphasis on substantial theoretical contributions derived from these models.
- 3.
- Consumer Experience through Artificial Intelligence, Robotics, and Hospitality (18 Terms)
Within Cluster 3, only Artificial Intelligence and Consumer Experience exhibit correlations with the initial two clusters, indicating a more focused examination of the application of AI within the consumer experience in the hospitality sector. Artificial intelligence is presently a topic of significant interest and is associated with elements such as robotics, customer experience, the hospitality industry, and insights pertaining to hospitality. This underscores the current relevance of AI in the context of hospitality and customer experience. A dominant term is Artificial Intelligence (AI) with 937 links; other important keywords are as follows: Consumer Experience (400), Robot (251), Algorithms (491), and Hospitality Industry (441). This cluster signifies a highly specialized research front, concentrating on the application of advanced technologies, specifically artificial intelligence and robotics, within the context of direct interaction services in the hospitality industry and customer experience. This theme applies and transposes the concepts of systems and factors, as discussed in Clusters 1 and 2, into a specific business framework. The analysis examines how algorithms and robotics fundamentally reshape the customer experience.
- 4.
- Pandemic (6 Terms)
Cluster 4, although modest in size, illustrates the recent scholarly interest in the literature regarding the pandemic’s impact on the studied domains. The dominant term is COVID-19 with 610 links; another important keyword is Pandemic with 189 links.
Although small, this cluster is of significant importance. It does not reflect an internal theme within the field; instead, it represents an external contextual variable (exogenous shock) that calls for the modification or acceleration of innovation and technology processes (Clusters 1 and 2). Research within this cluster is likely to address resilience, rapid adaptation, or alterations in consumer behavior in response to the pressures exerted by global crises.
The four clusters are illustrated in Figure 1 below to facilitate a more comprehensive understanding.
2.3. Areas of Interest and Their Interconnections
In an overarching analysis, we examined the diverse interconnections among topics of significant interest. Artificial intelligence emerges as a prominent area of study, with links to issues such as robotics, customer experience, and the hospitality industry. This underscores the idea that AI represents a central and increasingly relevant theme in contemporary discourse.
Marginal or Isolated Terms: Several terms relevant to the study appear to be under-explored or have limited connections in the existing literature: Online Platform (OCC 13); Online Travel Agency (OTA) (OCC 14); Travel Industry (OCC 16); Travel Planning (OCC 10); Travel Website (OCC 16); and Traveler (OCC 13). See Figure 2.
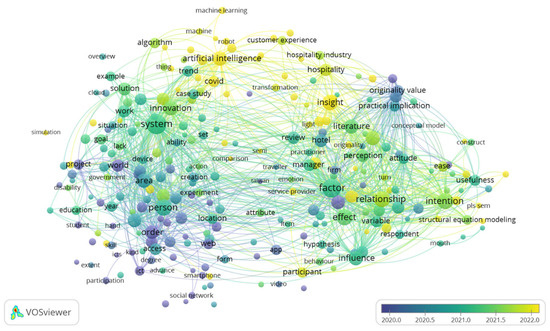
Figure 2.
VOSviewer items of interest over the years.
The sole exception is the Travel Agency, which maintains a connection with the keyword Relationship. Regarding the terms of interest to our study, marginal and isolated areas with no connections include elements such as online platforms and travel websites. This observation highlights a substantial research gap concerning specific aspects of travel platforms and websites. TripAdvisor is associated with the concept of “review,” a topic that has been the subject of extensive debate since 2020. This indicates that the examination of reviews, and by extension, qualitative feedback, constitutes a well-established domain of research. “Comparison” and “digital transformation” are among several topics of interest currently under investigation.
“Quality” and “Perception”: An examination of the concept of quality reveals the emergence of terms such as perception, which further correlate this concept to its utility. Nevertheless, the discourse surrounding “quality” within the broader framework remains underexplored, with minimal attention given to “perception.” This underscores a significant gap in the literature: the in-depth investigation of perceived quality in the context of travel websites is notably limited.
2.4. Research Gaps and Opportunities for Further Inquiry
Artificial intelligence (AI) constitutes a dynamic and emergent frontier in research within the field, as indicated by the analysis of thematic clusters (Figure 1 and Figure 2). The literature reveals a growing interest in AI applications (Cluster 3); however, established models pertaining to technology acceptance and quality perception (Cluster 2) were primarily formulated for passive systems, rather than for the intricate technologies predicated on AI.
This conceptual and methodological disjunction leaves unexamined the extent to which AI implementation directly affects the objective technical performance metrics of travel websites. Consequently, this study adopts an exploratory approach to investigate the relationship between the utilization of AI features and the technical performance of travel websites, with a particular emphasis on simulating the critical conversion phase of purchasing a tour.
3. Methodologies
Research Design: The exploratory research was designed to identify and quantify the variables, as measured by Lighthouse, that demonstrate a significant association with the presence or absence of AI features.
The sample comprised the most frequently visited international tourism websites [25]. A total of three websites were incorporated into the analysis: Booking.com (B), Airbnb.com (A), and Tripadvisor.com (T), which are subsequently referred to by their initials B, A, and T, respectively. Additionally, the inclusion criteria encompassed the services provided, with a particular emphasis on the available experiences.
The study employed two primary methodologies: the automated website evaluation tool, Lighthouse, developed by Google, and JASP for the measurement and analysis of the collected data. We selected JASP as an ideal tool for exploratory research due to its capacity to facilitate the rapid execution of multiple analyses and the effective visualization of data.
A panel of three academics collaborated to ensure the comprehensiveness of the study. One researcher conducted the Lighthouse audits (see Table 1), performing five repeated assessments in both desktop and mobile modes to ensure consistency, with an average internet download speed of 477 Mbps employed to simulate realistic usage conditions. Subsequently, we organized the collected results using Excel to prepare the dataset for subsequent statistical analysis. We conducted the statistical analysis, which included analysis of variance (ANOVA). Linear regression analysis was then employed. This methodology was selected to address the limitations inherent in simple association and to quantify the degree to which the presence of AI features (“AI/Non-AI”) serves as a predictor of variation in Lighthouse performance metrics (e.g., Total Blocking Time and Largest Contentful Paint) and other aggregate scores (Accessibility, Best Practices, and Search Engine Optimization), and provided a thorough interpretation of the results. To ensure the reliability of the evaluation instruments and the validity of the technical sustainability assessment, Lighthouse was employed as a standardized tool. Specifically, the technical sustainability dimension was primarily reflected in the Performance and Best Practices categories, which capture the efficiency, optimization, and robustness of web applications. Metrics such as Largest Contentful Paint (LCP), Total Blocking Time (TBT), and Cumulative Layout Shift (CLS) were interpreted as indicators of system efficiency and resource management, while the Best Practices score provided insight into long-term maintainability, security, and adherence to modern development standards. Together, these indicators were considered representative of the application’s technical sustainability.

Table 1.
Standard Audit Phases.
Given that the study specifically examines the influence of artificial intelligence (AI), we observed variations in the structure of the results pages. A distinct and explicit AI feature was identified solely on TripAdvisor. In this context, we introduced an additional audit page, designated as Page 4, to compare platform and architecture-specific differences impacted by AI. This phase was exclusively implemented within the TripAdvisor framework, as this platform uniquely presented a “Build your trip” feature powered by AI at the top of Page 2 (the standard search results page). Page 4 represented the results page after interaction with the AI functionality, specifically following the AI’s initiation of inquiries regarding details for a travel plan, via the following initial set of questions pertaining to travel timeline, specification of the timeframe, or duration of the trip: “When are you going?”; trip type and group: “What kind of trip are you planning? (i.e., solo trip, partner trip, friends trip, family trip)” and pet travel inclusion: “Are you traveling with pets?”; and interests and priorities, detailing the thematic goals and preferences to shape the itinerary content: “Tell us what you’re interested in (i.e must-see attraction, great food, hidden gems etc.)”. These inputs serve as the core parameters that the AI utilizes to formulate the initial draft of the travel itinerary.
Data Collection Procedure: The data collection process was conducted from 4 July to 7 July 2025. A distinct website was selected for each audit, which encompassed both desktop and mobile devices. The audits were performed in incognito mode, targeting pages that did not call for authentication with personal data to guarantee a clean and objective analysis. All collected data were systematically introduced into Excel files, with variables organized according to the audited and tested pages. Ultimately, these files were consolidated into a comprehensive database that included all three analyzed websites, categorized by the two types of devices.
All statistical analyses were conducted using JASP version 0.19.3. The database was meticulously organized to eliminate any errors that could affect the analyses within JASP. Statistical computations were performed to evaluate internal consistency, thereby corroborating the integrity of the statistical analysis. Sphericity was assessed to identify any violations, after which the Greenhouse–Geisser correction was applied as necessary.
Hypothesis Overview:
The primary objective of this research is to assess the impact of the integration of artificial intelligence technologies on the technical quality of web pages, utilizing Lighthouse scores as the primary evaluation metric.
Three null hypotheses and three alternative hypotheses were formulated as follows:
Null Hypothesis (H0): There are no significant differences in Lighthouse scores among web pages that do not use artificial intelligence (H0.1). There are no significant differences among webpages that are optimized by artificial intelligence, in terms of Lighthouse scores (H0.2). Lighthouse scores remain constant regardless of the devices used, such as desktop or mobile (H0.3).
Alternative Hypothesis (H1): There are significant differences among web pages that do not use artificial intelligence in at least one of the Lighthouse dimensions (H1.1). There are significant differences among AI-optimized web pages in at least one of the Lighthouse dimensions (H1.2). Lighthouse scores differ between desktop and mobile devices (H1.3).
Repeated Measures ANOVA
The study employs a repeated measures analysis of variance (mixed ANOVA) to assess the mean frequencies of various characteristics, including Performance, Accessibility, Best Practices, and SEO, across the tourism platforms Booking (B), Airbnb (A), and TripAdvisor (T). ANOVA is additionally utilized to evaluate whether significant differences exist in multiple dependent variables (dimensions) among different groups (website types).
4. Results
In the following section, we present the results obtained for the aforementioned hypotheses: H0.1/H1.1, H0.2/H1.2, and H0.3/H1.3.
To evaluate the hypotheses outlined below, a repeated measures ANOVA was conducted.
4.1. Repeated Measure ANOVA for Pages Without AI
(H0.1).
There are no significant differences in Lighthouse scores among web pages that do not use artificial intelligence.
(H1.1).
There are significant differences among web pages that do not use artificial intelligence in at least one of the Lighthouse dimensions.
4.1.1. Within-Subject Effects
To examine the impact of the Lighthouse dimensions on scores obtained under the condition of absence of artificial intelligence, a repeated measures analysis of variance (ANOVA) was conducted employing the Greenhouse–Geisser correction. The results revealed a significant main effect of the assessed dimensions, F = 4960.934, p < 0.001, indicating substantial differences among Performance, Accessibility, Best Practices, and SEO.
Additionally, several significant interactions were identified between the assessed dimensions, including the interaction with website type, F = 160.708, p < 0.001. Another noteworthy interaction was observed concerning the type of device utilized, F = 324.746, p < 0.001, as well as between the analyzed pages, F = 97.077, p < 0.001. Furthermore, other pertinent interactions were identified, including dimensions analyzed × website × device; dimensions analyzed × website × page; and dimensions analyzed × device × page (see Table 2).
Table 2.
Within Subject Effects—Without AI.
4.1.2. Post Hoc Comparisons
The ANOVA analysis revealed dimensions exhibiting statistical significance, with p-values less than 0.05. Consequently, we proceeded with Post Hoc analysis (Table 3) to elucidate the significant differences and to identify which of the analyzed criteria were influenced. Performance consistently shows significant differences.
- Accessibility (by 45.356 points);
- Best Practice (by 46.722 points);
- SEO (by 34.044 points).
Best Practices seem to have the highest scores, as they are significantly higher than Accessibility and SEO, and Accessibility is also significantly lower than Best Practices. Accessibility is significantly higher than SEO, but significantly lower than Best Practices. SEO appears to have the lowest scores compared to Accessibility and Best Practices.
Table 3.
Post Hoc Comparisons—RM Without AI.
Table 3.
Post Hoc Comparisons—RM Without AI.
| Mean Difference | SE | df | t | pholm | ||
|---|---|---|---|---|---|---|
| Performance | Accessibility | −45.356 | 0.591 | 36 | −76.803 | <0.001 |
| Best Practices | −46.722 | 0.484 | 36 | −96.493 | <0.001 | |
| SEO | −34.044 | 0.594 | 36 | −57.342 | <0.001 | |
| Accessibility | Best Practices | −1.367 | 0.404 | 36 | −3.379 | 0.002 |
| SEO | 11.311 | 0.188 | 36 | 60.283 | <0.001 | |
| Best Practices | SEO | 12.678 | 0.354 | 36 | 35.797 | <0.001 |
Note. p-value adjusted for comparing a family of 6 estimates. Results are averaged over the levels of Website, Test, Device, and Page.
Performance appears to be the lowest, and Best Practices the highest, with Accessibility and SEO falling in between, but with significant differences among all of them.
4.2. Repeated Measure ANOVA for Pages with AI
(H0.2).
There are no significant differences among webpages that are optimized by artificial intelligence in terms of Lighthouse scores.
(H1.2).
There are significant differences among AI-optimized web pages in at least one of the Lighthouse dimensions.
4.2.1. Within-Subject Effects
As indicated in the preceding analysis, a significant relationship between the values was identified (see Table 4). The results showed a significant value, where F = 1388.410, p < 0.001. Additionally, several significant interactions were identified between the assessed dimensions, including the interaction with page F = 1185.304, p < 0.001; interactions with device F = 131.994, p < 0.001; and between page × device F = 33.963, p < 0.001.
Table 4.
Within-Subject Effects—With AI.
4.2.2. Post Hoc Comparisons
To identify groups that exhibited semi-significant differences, a Post Hoc analysis was conducted, the results of which are presented in Table 5. Performance demonstrated significant differences across the three Lighthouse dimensions.
Table 5.
Post Hoc Comparisons—RM With AI.
The mean differences are negative, indicating that the scores for Performance are lower than those for Accessibility (by 33.100 points), Best Practice (by 34.700 points), and SEO (by 22.100 points).
Best Practices seem to have the highest scores, as they are significantly higher than Accessibility and SEO. Accessibility is significantly higher than SEO, but significantly lower than Best Practices.
4.3. Post Hoc Comparisons—Device
(H0.3).
Lighthouse scores remain constant regardless of the devices used, such as desktop or mobile devices.
(H1.3).
Lighthouse scores differ between desktop and mobile devices.
Table 6 and Table 7 present the results of the Post Hoc comparative analysis for devices, designed to evaluate the validity of the null hypothesis in relation to the alternative hypothesis.
Table 6.
Post Hoc Comparisons—Device without AI.
Table 7.
Post Hoc Comparisons—Device with AI.
4.4. Comparisons Website
4.4.1. Post Hoc Comparison—Website Without AI
To enhance the significance of the findings, we undertook additional analyses aimed at offering a more nuanced perspective on the comparisons among websites. These results, while not part of the initial hypotheses, provide critical insights into the evaluation of website performance in both the presence and absence of artificial intelligence, as well as into the establishment of performance positioning among websites that do not employ artificial intelligence. In Table 8, we can see that Airbnb demonstrates lower performance metrics in comparison to Booking.com, exhibiting an average difference of (−3.642), with a significance level of p < 0.001. In relation to TripAdvisor, the average difference is (−4.458), with a significance level of p < 0.001. Conversely, the comparison between Booking.com and TripAdvisor reveals a negative difference of (−0.0817); however, this difference is not statistically significant, as indicated by a p-value of 0.257.
Table 8.
Post Hoc Comparisons—Website without AI.
4.4.2. Post Hoc Comparisons—Page
Following the identification of the Lighthouse scores and the corresponding platforms, this study aimed to differentiate between pages that utilize artificial intelligence and those that do not, but only for TripAdvisor. Table 8 below includes all pages; however, the only page that employed artificial intelligence and was available for analysis is Page 4. Page 2 was included in both analyses, but the results were identical; therefore, no distinction is made between them. According to Table 9, five significant differences were identified. Page 1 exhibits positive scores in comparison to the other three pages. Page 2, while demonstrating a relatively small positive difference compared to Page 3, reveals significant negative differences when compared to Page 4. Furthermore, Page 3 displays negative scores relative to Page 4, thereby underscoring a significant difference.
Table 9.
Post Hoc Comparisons—Page with and without AI.
4.5. Linear Regression
In the linear regression model, the primary dependent variable was the aggregate Performance score derived from the Google Lighthouse audit. This selection is substantiated by three interrelated arguments: First, scores in the Performance category uniquely encapsulate the tension between technical efficiency and user experience. The key metrics comprising this score, specifically Total Blocking Time (TBT) and Largest Contentful Paint (LCP), provide precise measurements of processing time and user-perceived delays, rendering them particularly sensitive to the dynamic impacts of AI tasks. Our study was designed to simulate the critical conversion phase, characterized by the intention to purchase a tour. During this phase, performance emerges as a sine qua non factor of technical quality. Perceived delays (LCP) or interface freezes (TBT) resulting from suboptimal performance directly contribute to increased abandonment rates and negatively influence purchase intent. Consequently, performance represents the technical variable with the most substantial predictive power regarding user experience at this commercially significant juncture.
As presented in Table 10, the comprehensive model (M1) exhibits a correlation coefficient (R) of 0.888 and a coefficient of determination (R2) of 0.789, which suggests that approximately 78.9% of the variability in website performance can be accounted for by the variables incorporated in the model. The adjusted R2 value is 0.778, while the root mean square error (RMSE) is 6.767. In contrast, the null model (M0) shows no explanatory power, as indicated by an R2 value of 0.
Table 10.
Model Summary—Performance.
Table 11 presents the results of the ANOVA test, which demonstrates that the regression model is statistically significant, F(5, 94) = 70.37, p < 0.001. This finding substantiates the conclusion that the predictors included in the model significantly contribute to explaining the variance in performance.
Table 11.
ANOVA.
Efficient values for each predictor are delineated in Table 12. The findings indicate that Best Practices (β = 0.195, p < 0.001), SEO (β = 0.126, p = 0.017), AI_Status (β = 0.526, p < 0.001), and Device (β = −0.755, p < 0.001) serve as statistically significant predictors of performance. Conversely, the Accessibility variable did not attain the significance threshold (p = 0.140).
Table 12.
Coefficients.
5. Discussion
Concerning hypothesis H0.1/H1.1, which addresses the impact of AI absence on Lighthouse scores, the following conclusions can be drawn: There are no significant differences in Lighthouse scores among web pages that do not use artificial intelligence (H0.1); there are significant differences among web pages that do not use artificial intelligence in at least one of the Lighthouse dimensions (H1.1). The ANOVA results (F(5, 94) = 70.37, p < 0.001) and regression coefficient associated with AI_Status (β = 25.070, t = 10.301, p < 0.001) demonstrate statistically significant differences between the groups, indicating that websites lacking AI components received lower scores than their AI-integrated counterparts. Furthermore, the Performance variable exhibited the lowest scores overall (p < 0.001). These results, supported by the regression model (R2 = 0.789; Adjusted R2 = 0.778), confirm that the presence of AI significantly influences website performance values. SEO exhibited notable distinctions when compared to Accessibility and Best Practices (p < 0.001), with lower performance metrics in these areas. Accessibility (p = 0.140) did not show statistically significant effects. Best Practices (β = 0.454, p < 0.001) and SEO (β = 0.092, p = 0.017) contributed positively to overall performance.
It should be noted that, in several analyzed pages labeled “powered by AI,” the AI component is not active by default but becomes operational only after the user initiates it by pressing a specific button. In such cases, the initial performance measured before activation is lower than after AI functionality is enabled. Consequently, while pages containing inactive AI elements may show slightly reduced performance values compared to fully active implementations, these scores remain higher than those of non-AI websites.
Concerning hypothesis H0.2/H1.2, which posits the influence of artificial intelligence on Lighthouse scores, the conclusions are as follows: (H0.2) There are no significant differences among webpages optimized by artificial intelligence in terms of Lighthouse scores. (H1.2) There are significant differences among AI-optimized web pages in at least one of the Lighthouse dimensions. The regression analysis confirms the rejection of H0.2 (p < 0.001) and validates the alternative hypothesis (H1.2), as AI-related variables significantly contribute to the explained variance of performance metrics. The data presented in Table 9 show substantial differences (p < 0.001), with one exception: for page 2 on the TripAdvisor platform, the performance-diminishing score is associated with a Total Blocking Time (TBT) of 3330 ms, in contrast to page 4, which recorded a TBT score of 0 ms. In cases where the “powered by AI” feature is implemented but not fully active—remaining idle until the user initiates it—the system may slightly reduce performance due to unused embedded scripts. However, when AI functionality is activated and fully operational, the page benefits from its entire potential, resulting in higher performance scores compared to the inactive state and outperforming non-AI websites overall.
In practical terms, performance improvement requires addressing actions that produce low scores in Total Blocking Time, Speed Index, and Largest Contentful Paint. To improve these scores, certain optimizations are required, such as reducing JavaScript execution, minimizing main-thread activity, serving images in next-generation formats, and reducing unused JavaScript for all analyzed websites. Although performance and SEO are considered distinct dimensions, there exists a significant correlation between them (p < 0.05), as technical performance directly affects search engine positioning, which is part of Google’s ranking algorithms.
Hypothesis H0.3/H1.3 investigates the impact of the device type, contingent upon the presence or absence of artificial intelligence, on Lighthouse performance metrics: (H0.3) Lighthouse scores remain constant regardless of the devices used, such as desktop or mobile. (H1.3) Lighthouse scores differ between desktop and mobile devices. The observed differences support the alternative hypothesis (H1.3). The regression coefficient for Device (β = −21.566, t = −14.838, p < 0.001) confirms a statistically significant difference between desktop and mobile implementations. Specifically, desktop versions of web pages yield superior scores compared to responsive versions designed for mobile devices. Statistically significant differences were identified in pages without artificial intelligence (p = 0.001) and in those incorporating artificial intelligence (p = 0.002).
Although Adli et al. [26] posited that performance is not a significant factor for e-commerce sites, the results of this study indicate that performance is statistically significant for OTAs. As Upadhyaya [11] indicates, if AI identifies that customers are abandoning the payment page due to slow loading times, developers can prioritize performance enhancements to mitigate shopping cart abandonment, affecting the conversion rate. The ANOVA and regression analyses confirm that the integration of artificial intelligence significantly enhances website performance without negatively affecting other Lighthouse scores (F(5, 94) = 70.37, p < 0.001). These findings provide a consistent statistical framework for developers and designers to evaluate technical effects associated with artificial intelligence integration. However, companies must strike a balance between using AI technologies and maintaining consumer trust [27].
In the context of sustainability, performance is closely associated with energy efficiency. An optimized website, characterized by enhanced performance, necessitates fewer computational resources. Given that artificial intelligence (AI) serves as a primary predictor of performance metrics, the incorporation of efficient AI systems significantly advances the digital sustainability of the tourism industry by mitigating technical sustainability.
This study presents several limitations. Regarding the sample, its size is relatively small; however, this study is exploratory in nature, serving as an initial test of the methodology, and it can be replicated across different websites and scales to further validate the approach. A pertinent aspect of this research is the technological context of emerging markets, such as Romania, where network infrastructure and the geographical distribution of servers can significantly influence performance as measured by Lighthouse indicators. Network latency, particularly in relation to accessing international Online Travel Agency (OTA) servers, can extend resource download times, especially when connections are directed toward servers situated in Western regions. Furthermore, Domain Name System (DNS) resolution and content delivery network (CDN) propagation mechanisms may introduce additional delays, particularly in the absence of local caching infrastructures. These delays can adversely affect performance scores, even in instances where artificial intelligence (AI) components are implemented effectively, if traffic is routed through international pathways characterized by high latency. Nonetheless, these findings must be contextualized within the evolution of digital infrastructures. The literature underscores that the integration of AI into content delivery networks (CDNs) is not susceptible to such constraints; rather, it represents a viable solution for optimizing performance [28]. Consequently, while the network infrastructure in emerging markets may temporarily constrain overall website performance, the incorporation of AI into CDNs has the potential to mitigate these limitations by anticipating demand, facilitating dynamic routing, and enabling edge-level processing, thereby significantly reducing the impact of latency. Another limitation identified in the TripAdvisor analysis is represented by Lighthouse on pages displaying AI-generated content (referred to as Page 4 in our research). The Lighthouse analysis was performed on the first query generated by the system, “when are you going?” However, we were unable to extend this assessment to subsequent interactions. Specifically, when we attempted to run Lighthouse to evaluate the page states generated in response to questions 2 and 3 of the planning session, the system exhibited a refresh behavior, reverting to the first query. This limitation prevented us from collecting metrics for the entire AI-generated flow. Another limitation is that Booking.com has implemented the AI Trip Planner functionality within its platform; however, this tool is not accessible in Romania.
Future research will aim to expand the sample and examine the impact of artificial intelligence more comprehensively. Consequently, the sample remains limited in terms of AI integration, indicating that this area requires further investigation.
To sum up, this work demonstrates how AI can strengthen sustainability in tourism digital infrastructures by enhancing Accessibility and Best Practices through responsible, user-centric design, and improving Performance and SEO via technical efficiency. Tourism SMEs and DMOs can apply AI tools to advance sustainability metrics by adopting AI-based personalization systems to promote low-impact travel choices, and monitoring tools to optimize website performance in an energy-efficient manner. Additionally, AI-driven SEO and content generation can reduce resource-intensive marketing while improving visibility. These applications provide a practical framework for integrating technically sustainable, AI-supported strategies into tourism management and future sustainability research, aligning with broader ESG (Environmental, Social, and Governance) principles and supporting relevant SDGs (Sustainable Development Goals), such as SDG 9 (Industry, Innovation, and Infrastructure), SDG 12 (Responsible Consumption and Production), and SDG 13 (Climate Action).
Author Contributions
Conceptualization, T.M.B.; methodology, T.M.B., S.S. and A.N.; software, T.M.B.; validation, T.M.B., S.S. and A.N.; resources, T.M.B. and S.S.; data curation, S.S.; writing—original draft preparation, T.M.B.; writing—review and editing, S.S.; visualization, A.N.; supervision, A.N. All authors have read and agreed to the published version of the manuscript.
Funding
This research received no external funding.
Institutional Review Board Statement
Not applicable.
Informed Consent Statement
Not applicable.
Data Availability Statement
The raw data supporting the conclusions of this article will be made available by the authors on request.
Conflicts of Interest
The authors declare no conflicts of interest.
References
- Falcao, R.P.Q.; Ferreira, J.B.; Carrazedo Marques Da Costa Filho, M. The Influence of Ubiquitous Connectivity, Trust, Personality and Generational Effects on Mobile Tourism Purchases. Inf. Technol. Tour. 2019, 21, 483–514. [Google Scholar] [CrossRef]
- Giovanis, A.; Rizomyliotis, I.; Kavoura, A. On the Relationships between Digital Brand Evidence, Relationship Quality and Behavioural Intentions among Online Tourism Agencies’ Customers. Eur. J. Tour. Res. 2021, 30, 3005. [Google Scholar] [CrossRef]
- Sun, S.; Law, R.; Hyun, S.S. Exploration of Hotel Reservation Through Mobile Online Travel Agencies. Int. J. Tour. Res. 2024, 26, e2734. [Google Scholar] [CrossRef]
- Cho, Y.-N.; Thyroff, A.; Rapert, M.I.; Park, S.-Y.; Lee, H.J. To Be or Not to Be Green: Exploring Individualism and Collectivism as Antecedents of Environmental Behavior. J. Bus. Res. 2013, 66, 1052–1059. [Google Scholar] [CrossRef]
- Buhalis, D.; Sinarta, Y. Real-Time Co-Creation and Nowness Service: Lessons from Tourism and Hospitality. J. Travel Tour. Mark. 2019, 36, 563–582. [Google Scholar] [CrossRef]
- Hernández-Tamurejo, Á.; González-Padilla, P.; Saiz-Sepúlveda, Á. The Economics of AI Adoption in OTAs: Market Dynamics and Future Research. Glob. Econ. Res. 2025, 1, 100001. [Google Scholar] [CrossRef]
- Edén, A.S.; Sandlund, P.; Faraon, M.; Rönkkö, K. VoiceBack: Design of Artificial Intelligence-Driven Voice-Based Feedback System for Customer-Agency Communication in Online Travel Services. Information 2024, 15, 468. [Google Scholar] [CrossRef]
- Bernardo, M.; Marimon, F.; Alonso-Almeida, M.D.M. Functional Quality and Hedonic Quality: A Study of the Dimensions of e-Service Quality in Online Travel Agencies. Inf. Manag. 2012, 49, 342–347. [Google Scholar] [CrossRef]
- Fu Tsang, N.K.; Lai, M.T.H.; Law, R. Measuring E-Service Quality for Online Travel Agencies. J. Travel Tour. Mark. 2010, 27, 306–323. [Google Scholar] [CrossRef]
- Park, C.; Kim, Y. Does Digital Space Shape Physical Space? Unraveling Spatial Characteristics of Third Places Distinguished by Online Platform Using Explainable AI. Cities 2025, 165, 106144. [Google Scholar] [CrossRef]
- Upadhyaya, N. Artificial Intelligence in Web Development: Enhancing Automation, Personalization, and Decision-Making. Int. J. Adv. Res. Sci. Commun. Technol. 2024, 4, 534–540. [Google Scholar] [CrossRef]
- O’Connor, P.; Assaker, G. Examining the Role of Reputation as a Moderator of E-Service Quality, Trust, and E-Loyalty in Online Travel Services. J. Theor. Appl. Electron. Commer. Res. 2024, 19, 3429–3442. [Google Scholar] [CrossRef]
- Tomić, T.; Lavrnić, I.; Viduka, D. The Impact of Website Design on Customer Satisfaction and Purchase Intention. J. Process Manag. New Technol. 2025, 13, 1–13. [Google Scholar] [CrossRef]
- Chu, K.-M. Innovation Practices of New Technology Adoption for the Business Survival Strategy of Online Travel Agencies During the COVID-19 Pandemic: Two Case Studies in Taiwan. J. Knowl. Econ. 2023, 15, 9556–9575. [Google Scholar] [CrossRef]
- Drivas, I.; Vraimaki, E. Evaluating and Enhancing Museum Websites: Unlocking Insights for Accessibility, Usability, SEO, and Speed. Metrics 2025, 2, 1. [Google Scholar] [CrossRef]
- Dalipi, F.; Kastrati, Z.; Öberg, T. The Impact of Artificial Intelligence on Tourism Sustainability: A Systematic Mapping Review. In Proceedings of the 2023 International Conference on Computational Intelligence and Knowledge Economy (ICCIKE), Dubai, United Arab Emirates, 9–10 March 2023; IEEE: Dubai, United Arab Emirates, 2023; pp. 119–125. [Google Scholar]
- Google Lighthouse–SEO Glossary. Available online: https://www.conductor.com/academy/glossary/google-lighthouse/ (accessed on 6 September 2025).
- Tussyadiah, I. A Review of Research into Automation in Tourism: Launching the Annals of Tourism Research Curated Collection on Artificial Intelligence and Robotics in Tourism. Ann. Tour. Res. 2020, 81, 102883. [Google Scholar] [CrossRef]
- Chavan, S. Online Room Booking System for HotelVilla18. Gurukul Int. Multidiscip. Res. J. 2024, 7, 363–370. [Google Scholar] [CrossRef]
- Bulchand-Gidumal, J.; William Secin, E.; O’Connor, P.; Buhalis, D. Artificial Intelligence’s Impact on Hospitality and Tourism Marketing: Exploring Key Themes and Addressing Challenges. Curr. Issues Tour. 2024, 27, 2345–2362. [Google Scholar] [CrossRef]
- Majid, G.M.; Tussyadiah, I.; Kim, Y.R.; Pal, A. Intelligent Automation for Sustainable Tourism: A Systematic Review. J. Sustain. Tour. 2023, 31, 2421–2440. [Google Scholar] [CrossRef]
- Hulleberg, O.; Landgraff Granum, H.; Gullberg Hansen, S.; Moen, M.; Vicient Monllaó, C.; Inal, Y. The Awareness and Practices of Web Developers Toward Sustainable Web Design. In Design, User Experience, and Usability; Marcus, A., Rosenzweig, E., Soares, M.M., Eds.; Springer Nature: Cham, Switzerland, 2023; Volume 14030, pp. 134–145. ISBN 978-3-031-35698-8. [Google Scholar]
- Sanchez-Cuadrado, S.; Morato, J. The Carbon Footprint of Spanish University Websites. Sustainability 2024, 16, 5670. [Google Scholar] [CrossRef]
- Król, K. Sustainability Audit of University Websites in Poland: Analysing Carbon Footprint and Sustainable Design Conformity. Appl. Sci. 2025, 15, 8666. [Google Scholar] [CrossRef]
- Most Visited Travel and Tourism Websites Worldwide. 2025. Available online: https://www.statista.com/statistics/1215457/most-visited-travel-and-tourism-websites-worldwide/ (accessed on 26 May 2025).
- Adli, A.; Wihayanti, T.; Witarsyah, D. Top 5 E-Commerce Performance Analysis Using Google Lighthouse Matrix. In Proceedings of the International Conference on Enterprise and Industrial Systems (ICOEINS 2023), Badung, Indonesia, 4–5 October 2023; Sulistiyo, M.D., Nugraha, R.A., Eds.; Advances in Economics, Business and Management Research; Atlantis Press International BV: Dordrecht, The Netherlands, 2023; Volume 270, pp. 239–248. ISBN 978-94-6463-339-9. [Google Scholar]
- Kavya, G.B. Impact of artificial intelligence on e-commerce: “A study of consumer behavior”. EPRA Int. J. Environ. Econ. Commer. Educ. Manag. 2024, 11, 51–54. [Google Scholar] [CrossRef]
- Gottepu, A.K. AI-Enhanced Content Delivery Networks: Optimizing Traffic and User Experience in the Edge Computing Era. Eur. J. Comput. Sci. Inf. Technol. 2025, 13, 88–98. [Google Scholar] [CrossRef]


Disclaimer/Publisher’s Note: The statements, opinions and data contained in all publications are solely those of the individual author(s) and contributor(s) and not of MDPI and/or the editor(s). MDPI and/or the editor(s) disclaim responsibility for any injury to people or property resulting from any ideas, methods, instructions or products referred to in the content. |
© 2025 by the authors. Licensee MDPI, Basel, Switzerland. This article is an open access article distributed under the terms and conditions of the Creative Commons Attribution (CC BY) license (https://creativecommons.org/licenses/by/4.0/).