Abstract
Carbon capture and storage is recognized as the best method for CO2 emission mitigation in cases where the emissions cannot be avoided by switching to renewable energy or by increasing efficiency. In the Republic of Croatia, there are a number of gas-condensate reservoirs with a high content of CO2 that are adequate candidates for CO2 storage. The injection starts at selected different points before the end of production and might bring financial benefits as a result of CO2 injection patterns and efficient permanent storage. Employing a model of a typical reservoir, various scenarios of CO2 injection are examined to assess the impact of injection well positioning and timing on the reservoir’s sustainability for permanent CO2 storage. The main indicators used for the assessment are additional hydrocarbon recovery, retention, and storability.
1. Introduction
In recent decades, the European Union had set ambitious plans to reduce CO2 emissions and other greenhouse gases into the atmosphere. Although an increase in the share of renewable energy sources and the reduction in fossil fuel consumption can contribute toward these goals, it is unreasonable to believe that any significant emission reduction would be achieved without the implementation of carbon capture and storage (CCS) and carbon capture, utilization and storage (CCUS) technologies [1,2]. Reduced use of fossil fuels in a cost-effective way creates an opportunity for the development of CCUS-related technologies. Those technologies have the potential to simultaneously reconcile energy security and ecology [3]. The petroleum industry is traditionally seen as a big polluter, contributing 8% to direct global emissions and 33% to indirect global emissions [4]. This is the main reason why new approaches and innovative solutions are explored within the petroleum industry: in order to reduce its significant environmental impact.
The study presented in this paper (CO2 storage in gas reservoirs) supports sustainable energy practices by repurposing the existing infrastructure, minimizing new hydrocarbon exploration needs, and achieving gate-to-gate carbon negativity, where stored CO2 exceeds CO2 produced over the reservoir lifecycle. In this way, the proposed concept delivers reduced environmental impacts through GHG reduction, economic feasibility via EGR cost savings, and social benefits by supporting fossil-to-renewable transitions without disrupting energy supply.
CCS technology represents the geological storage of CO2, which aims to capture CO2 from different industries, transport it, and retain it underground permanently, to prevent its release into the atmosphere. There are numerous studies examining the suitability of depleted oil and gas reservoirs and large and deep saline aquifers for CO2 storage [5,6,7]. At the same time, hydrocarbon reservoirs are considered to be more reliable for geological storage, due to their proven ability to retain fluids for a long time. Far more data about subsurface properties, and therefore about CO2 storage suitability, is acquired through producing oil and gas wells, compared to deep saline aquifers which are characterized by a more general approach, and eventually, from the data from exploration wells that were not drilled into in an oil or gas reservoir. Due to growing awareness of CCS as a perspective carrier for achieving the ambitious goals established by the Paris Agreement [8] and the high price of CO2, which became less volatile after the Green Deal, positive changes can be expected in the coming period [9]. One of the motives was to examine early CO2 injection, not only to store greenhouse gas, but also to improve the efficiency of the reservoir, including improving CO2 storage aspects in a sustainable manner and reducing the need for new hydrocarbon exploration.
The concepts of chemical utilization imply the conversion of carbon dioxide into another chemical compound, while the concepts of physical utilization with simultaneous storage mostly refer to methods for increasing the hydrocarbon production, whereby CO2 is stored in underground formations without chemical structure alteration [10]. Utilization is practically the only way to offset high CO2 capturing and storage costs [11], and the benefit of trapping significant amounts of CO2 makes such simultaneous CO2 storage and (to some extent) enhanced hydrocarbon recovery attractive from both an emission reduction and a financial point of view [12]. Many years of successful CO2-enhanced oil recovery (CO2-EOR) practice around the world, including two projects for enhancing oil recovery (EOR) in Croatia, is a guarantee of the advanced level of development of these technologies, meaning their technological readiness level (TRL) is at its maximum, considering the Global CCS Institute’s classification [13]. Furthermore, economic profitability and retention of large amounts of CO2 underground during CO2-enhanced hydrocarbon production make these options extremely attractive. Unlike CO2 injection for enhanced oil recovery, it is hardly possible to enhance the recovery of natural gas reservoirs because of the CO2 and methane mixing, leading to the rapid breakthrough of CO2 [14,15]. These challenges can be mitigated by finding the optimal position of the injectors and producers—it is advisable to place the injection wells deeper in the reservoir, while production wells should be perforated in the upper layers to exploit the gravity segregation effects [16]. This position management logic is based on CO2 PVT (pressure–volume–temperature) behavior. CO2 density can be two to six times higher than natural gas density in reservoir conditions, and at the same time, CO2 has lower mobility compared to natural gas (methane). These properties cause CO2 to migrate towards lower (deeper) parts of the reservoir. Additionally, the difference in these properties should enable a slower exchange of CO2 and methane. Furthermore, CO2 has a higher solubility factor in brine than methane (considering reservoir conditions), which affects the CO2 breakthrough, i.e., it delays it [17,18]. It was found [19] that besides the careful positioning of the injection and production wells, another crucial parameter for enhanced gas recovery (EGR) design is the decision on the injection rate, which is highly dependent on the reservoir’s anisotropy (i.e., the difference between horizontal and vertical permeabilities). Furthermore, CO2–methane mixing could be hindered by the injection of carbonated water slugs [20].
All these previously published findings confirm that, for enhanced natural gas production, the favorable effects such as oil-swelling and oil viscosity reduction are not appearing in the case of CO2 injection into gas reservoirs. However, by injecting CO2 into a (mature) producing gas reservoir, we expect slower pressure depletion compared to gas production without CO2 injection, and also better conditions for CO2 injection, because gas production wells act as “pressure relief” wells. Consequently, despite the fact that significant total gas production will not increase, we focused on the assumption that by pressurizing the reservoir at the injection well, about the same amount of total gas production can be achieved earlier (than in the case without injection). This concept entails a new approach to CO2 storage, advancing sustainable greenhouse gas mitigation in producing reservoirs and balancing efficient hydrocarbon recovery, including an early start of emission reductions with long-term environmental and economic benefits.
The issues of injecting CO2 into gas reservoirs are still insufficiently investigated and leave a lot of room for research, especially when considering reservoirs with high CO2 content that are already producing. This study used a natural gas reservoir with a high concentration of CO2 in its original composition to perform a history-matching of production data, hence enhancing the accuracy of CO2 injection simulations. Given the scarcity of the existing literature on the subject, this study primarily focuses on the CO2 storage rather than the gas-production enhancement. However, the underlying premise is that initiating CO2 injection during gas production would yield greater (cost) effectiveness. This can be explained by early installation of CO2 injection equipment, data gathering, and a relatively higher depletion of the reservoir, which would result in additional capacity being available for CO2 storage.
While CO2 injection in a dry gas reservoir can increase the recovery by 4–12%, and it is advisable to start EGR only after the primary production ceases, additional recovery from a wet gas reservoir can be as high as 40% if the injection is started early enough to avoid condensate dropout (related to the pressure drop) in the reservoir [21]. The main challenge of CO2 injection (both for EGR and ‘pure’ storage) is low reservoir pressures that are typical for depleted gas reservoirs, because at these low pressures, Joule–Thomson cooling effect could take place, leading to further operational problems, such as hydrate-forming and reduced well injectivity: i.e., an increased wellbore skin factor [22]. Considering that the reservoir fluid examined in this study is a gas-condensate reservoir (which is condensing because of high CO2 content), the additional recovery rate of 40%, found in the literature, was the main reason why EGR scenarios were considered in addition to assessing the storage efficiency. Furthermore, the mentioned issues that are related to low reservoir pressures are the main motivation for examining the influence of different injection timings.
2. Materials and Methods
The goal of this work was primarily to observe the impact of the injection well position and (since such problem statement has not been found in the literature) the start time of the CO2 injection on the reservoir’s suitability for CO2 long-term storage, but the impact on the hydrocarbon recovery was also observed. As reservoir behavior depends on the injected and produced fluid characteristics: a short overview was given in that regard.
2.1. Characteristics of CO2 Injection into Gas Reservoirs
Due to significantly different CO2 and natural gas properties in reservoir conditions, they usually do not mix easily, which reduces the likelihood of natural gas contamination. Gravitational segregation causes the CO2 (due to its density) to sink towards the reservoir bottom. This way, a “gas cushion” is formed that can enhance the production of natural gas through piston-like displacement (Figure 1): i.e., CO2 “pushes” natural gas towards production wells [23]. Furthermore, CO2 is more viscous than natural gas in the reservoir conditions, leading to a favorable mobility ratio and an efficient displacement process [24].
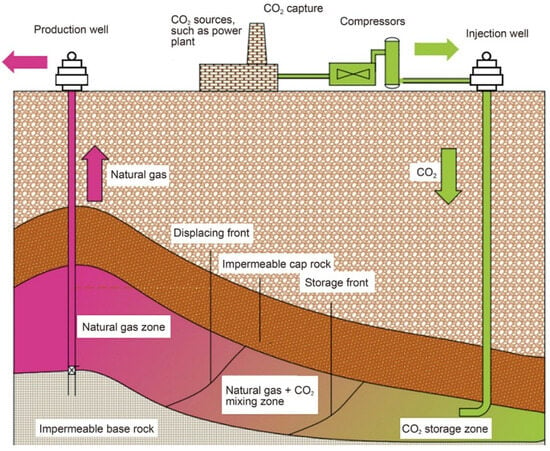
Figure 1.
Displacement mechanism scheme for CO2 and natural gas [3].
Different PVT (pressure–volume–temperature) behavior of CO2 and natural gas suggests that CO2 could have several “roles” in reservoir processes. It contributes to the repressurization of the reservoir (i.e., it helps to restore the original reservoir pressure) and displaces natural gas at the same time. Earlier simulation studies ([25,26]) indicate that an additional 5 to 15% of natural gas can be produced through CO2-enhanced gas recovery (EGR). The results of the K12-B pilot project have shown that an additional 0.03 to 0.05 t of gas can be recovered per one ton of injected CO2 [27], leaving room for storing CO2, even while the gas reservoir is still in production. This is in line with the understanding that depleted gas reservoirs have greater CO2 storage capacity in comparison with depleted oil reservoirs, as the recovery factor (which is directly proportional to the reservoir’s CO2 storage capacity) in gas reservoirs can be around 60%, while the ultimate oil primary recovery rarely exceeds 30%. Volumetric equations can be used in the initial estimation of the reservoir’s CO2 storage capacity with a satisfactory accuracy [28], especially in dry gas reservoirs [29]. It was found that the CO2 injection rate does not affect the overall storage capacity of a reservoir [30].
2.2. The Research Overview
A geological model of a producing reservoir was built with Schlumberger Petrel software (version 2024.4), which is also used to run compositional Eclipse (E300) implicit simulations [31]. Among commonly used cubic equations of state, such as Peng–Robinson [32], Redlich–Kwong [33], or Stryjek–Vera [34], in this research, the PR equation of state (EoS) was selected for describing the fluid behavior, based on the available experimental data obtained within the previous research [35]. Except for the selected EoS, estimation of the dynamic injectivity changes depends on the additional details related to reservoir properties and the CO2 injection strategy [36]. The injectivity primarily depends on reservoir permeability, effective layer thickness, heterogeneity, and reservoir and injection pressure. Relative permeability for CO2 increases in regions with increased CO2 saturation ([14,37]), leading to better injectivity. Low injectivity can cause an increase in pressure, meaning that more energy for CO2 compression is needed, which directly increases the injection costs [38]. Due to differences in relative permeability, supercritical CO2 can displace natural gas, making the process immiscible [38]. As described in the reviewed literature ([39,40]), many challenges arise when attempting to incorporate detailed microscopic effects (e.g., wettability, miscibility, and interfacial tension changes between rock, natural gas, brine, and CO2) into a full-scale (reservoir) simulation model.
Different development strategies (dynamic models) were defined, regarding the injection timing and injection well placement.
The research was conducted through eight steps:
- Develop a reliable simulation model by achieving satisfactory field pressure and production history matching.
- Create prediction strategies for base cases (business as usual, BAU) where the current production strategy continues (no CO2 injection) until the production’s end, when the reservoir is repurposed as CO2 storage.
- Create predictive strategies that include simultaneous CO2 injection and gas production.
- Assess the impact of the CO2 injection timing and the injection well selection on the storage capacity.
- Evaluate different CO2 injection strategies in terms of permanently stored amount of CO2.
- Compare the defined injection strategies with the BAU scenarios, regarding the hydrocarbon recovery.
- Determine the impact of the CO2 injection timing and the injection well selection on the CO2 breakthrough and reservoir fluid composition changes.
- Assess the effect of CO2 injection in BAU cases (‘pure’ storage after reservoir depletion) on the storage potential, including reservoir pressure.
Prior to describing the details of the simulation scenarios, a short rationale is given to put the examined reservoir into a broader context, and some theoretical background is introduced for better understanding of the results and their meaningful interpretation.
2.3. Theoretical Background
Although the CO2 storage history started in the early 1970s [41], most of the development projects have not become operational until today. However, there are some indications of the increasing popularity of CCS, mostly in North America and Europe [42]. Depleted oil and gas reservoirs are currently considered to be the best option for CO2 storage sites from an infrastructural, reservoir reliability, and economic point of view, although capacity-wise, aquifers seem more advantageous [43].
With the rising importance of a natural gas supply on one side, and emerging stricter legislation on GHG emissions on the other, special cases of natural gas reservoirs with high initial CO2 content might become a controversial issue, since it is virtually impossible for such reservoirs to be exploited in a carbon neutral way without CO2 injection.
The reservoir from this research has around 50% mol of CO2 in the initial reservoir fluid (gas-condensate) composition, which makes it an interesting example for storage capacity assessment (expressed through two indicators—retention and storability), and is especially interesting from the hydrocarbon recovery point of view, considering that CO2 is not an efficient fluid for natural gas production enhancement, as already explained in the Introduction.
As this research is not focused on the typical EGR process, the usual indicators, such as additional gas recovery, are not relevant, and the efficiency of CO2 permanent storage for each scenario is evaluated through relevant indicators, such as retention (Equation (1)) and storability (Equation (2)): parameters that account for CO2 that is cumulatively injected and produced (considering the period of simultaneous production and injection). Retention represents the difference between the injected and produced CO2, and storability is expressed as the ratio of this difference (i.e., retention) and produced CO2 [44]. The primary focus of this research is permanent CO2 storage, while hydrocarbon recovery enhancement was considered only as a secondary indicator. However, both parameters should have positive values, and their high values are a good indicator that carbon negativity can be achieved in the scenarios (more CO2 injected than produced). To fully assess the carbon negativity of the overall process, a thorough life cycle assessment should be conducted, which is out of the scope of this research, so for the purpose of this work, carbon negativity refers solely to the gate-to-gate comparison of CO2 that is produced and permanently stored.
Retention = injected CO2 volume–produced CO2 volume in the injection period, m3.
Storability = Retention/Produced CO2 volume in the injection period, (-)
While retention can be directly interpreted as the amount of the injected CO2 that is permanently stored (retained) in the reservoir, this indicator is not sufficient to assess the storage efficiency in the simultaneous injection and production period, especially for reservoirs with high initial CO2 content. Storability gives a relative relation between the stored and produced CO2 amount: i.e., it quantifies the storage efficiency in terms of the CO2 being permanently stored that is expressed as a percentage of the CO2 produced, eliminating the ambiguity that might arise from expressing only the absolute value of the CO2 retained. Although the permanently stored amount of CO2 could be observed in relation to the injected CO2, for the purpose of this research, it is more useful to observe it in the context of the amount of CO2 produced.
2.4. The Research Workflow and the Reservoir Model Details
The model developed in the Schlumberger Petrel simulation software (version 2024.4) was initialized using the available geological model of a real reservoir, including known reservoir and fluid data (Table 1).

Table 1.
Initial reservoir fluid mole composition.
For those properties that were not sufficiently tested, appropriate correlations were applied. Production strategies were created by choosing different well production constraints. Figure 2 conceptually shows the workflow in this research, with green and orange boxes containing input data that is the same for all scenarios (strategies) and gray boxes describing the differences between the scenarios. The obtained results were compared in order to establish the effect of different production and injection well selections and different injection timings on the reservoir response. The main parameters of interest observed include the amount of CO2 injected and produced (the difference between the two being the permanently retained CO2), hydrocarbon production, and the reservoir pressure.
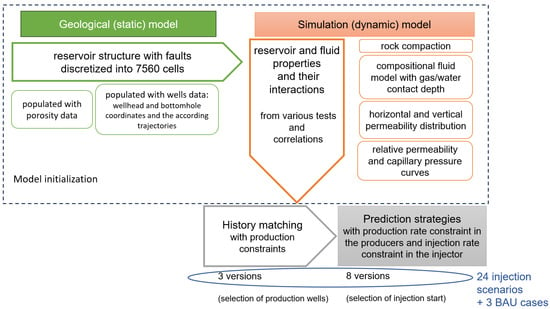
Figure 2.
Simulation workflow.
The used model has a corner-point grid of NX × NY × NZ = 28 × 30 × 9 = 7560 grid blocks to describe the structure with dimensions DX × DY × DZ = 129.1 × 124.5 × 26.1 m.
Figure 3 displays the wells utilized in the model, along with the porosity model derived from actual field data (namely well logging and seismic).
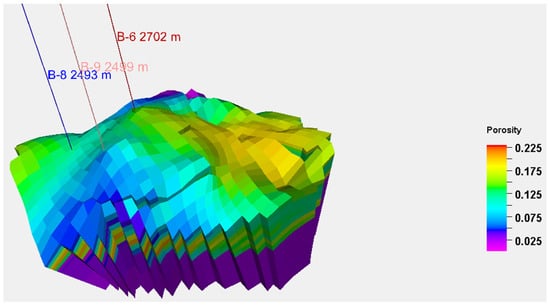
Figure 3.
Reservoir porosity distribution.
Reservoir permeability in horizontal directions was modeled with a log-normal distribution, using a mean value of 5 mD with a standard deviation of 1 mD, while vertical permeability was also described with a log-normal distribution, but with the mean and standard deviation being 10 times smaller. Correlations were used for rock compaction [45], relative permeability (using Corey exponents that are typical for natural gas reservoirs, Figure 4), and brine properties (based on water salinity of 30,000 ppm).
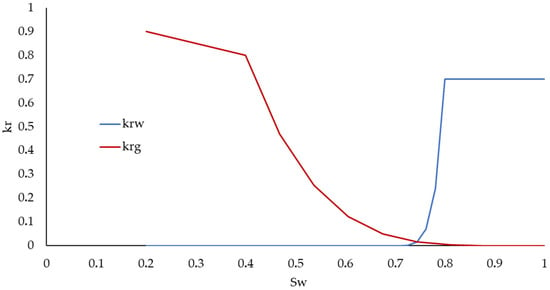
Figure 4.
Relative permeability curves used in the model.
The gas–water contact was determined based on well-logs, and it was set at an absolute depth of −2525 m (Table 2). Reservoir temperature and pressure at the contact depth are also given in Table 2.

Table 2.
General reservoir data.
The saturation relations in the reservoir are of particular interest as the reservoir fluid is a gas condensate, containing around 50% of CO2 in the composition. Numerous phase changes occur in the system (surface installations, wells, and reservoir), due to changing p-T conditions during CO2 injection. This is why compositional simulation was inevitable, as it accounts not only for the natural gas composition, but also the phase changes (near production wells, the gas, mostly CO2, condensates in later production periods when the pressure falls below the critical value), which gives a fairly realistic representation of the saturations and distribution of the reservoir and injected fluid individually, including their mixture.
2.5. History Matching and Base Case Prediction Scenarios
The efficiency of each injection strategy could only be assessed if there are baseline scenarios that they can be compared to [46]. Each of the three simulated base cases consists of three characteristic phases:
- Primary production based on historical data, used for assessment of the model reliability (history matching, HM).
- Extrapolated production with identical production constraints as in HM (business as usual, BAU).
- ‘Pure’ storage after the reservoir depletion (end of production).
The model was validated by simulating the first 16.5 years of production and comparing it to the actual historical data. In all three base scenarios (that differ by the selection of the production wells), an acceptable history matching of cumulatively produced gas was obtained (Figure 5). To achieve this, the production rates were adjusted to obtain the material balance that was observed in this reservoir in reality.
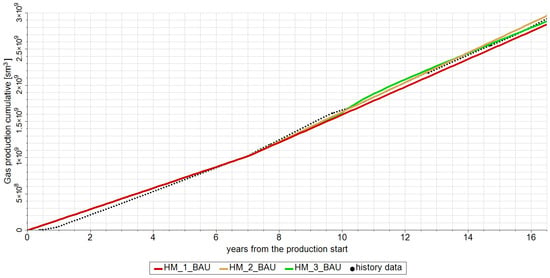
Figure 5.
Comparison of cumulative production for the base cases and actual data.
In each case, two production wells were selected for simulating the overall reservoir production, while the third one was only activated for the injection after the reservoir depletion. The reason for not including all three wells in the storage period is to obtain the identical well pattern in the base case and the corresponding injection cases (making the scenarios comparable).
2.6. The Injection Scenarios Definition
After history matching individual base scenarios, they were used for building injection (prediction) scenarios that differ from each other by the start of the injection (Table 3).

Table 3.
Timings of the CO2 injection scenarios.
Following the evaluation of strategies, including the injection well bottom-hole (dynamic) pressure limitations, the decision was made to adopt the method of volumetric replacement at the reservoir level during the concurrent natural gas production and CO2 injection. The main reason for this decision is to alleviate an excessive reservoir pressure increase. Production rates were determined to match the base cases’ production. In all cases, hydrocarbon production lasts for 40 years, after which the ‘pure’ storage phase was simulated for 60 years. The injection rate in the storage period was 150,000 m3/day (at the surface, unlike the reservoir rate during the period of injection and simultaneous production), which is considered to be realistic for one well in a depleted reservoir in this specific field, considering the historic data.
3. Results and Discussion
Considering different aspects from which the simultaneous natural gas production and CO2 injection can be viewed, several indicators were observed to assess the success of each strategy: cumulative gas production (hydrocarbons without CO2), cumulatively produced CO2, retention, storability (storage efficiency), and reservoir pressure.
3.1. Production Indicators
Cumulative hydrocarbon production was compared for all prediction scenarios (Figure 6, Figure 7 and Figure 8), to determine the CO2 breakthrough and the original reservoir fluid contamination and to evaluate the success of the scenarios, considering the increase in hydrocarbon production. This is especially interesting, considering that the original reservoir fluid has a high CO2 content.
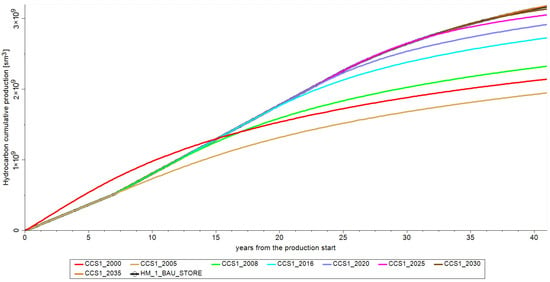
Figure 6.
Cumulative hydrocarbon production for the case with B-9 as the injection well.
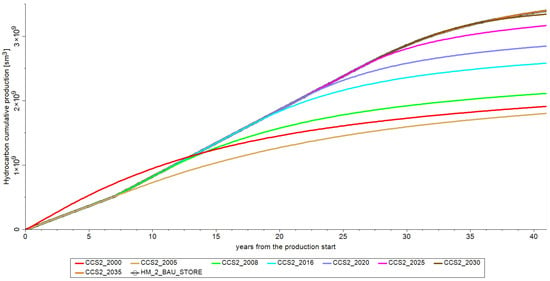
Figure 7.
Cumulative hydrocarbon production for the case with B-8 as the injection well.
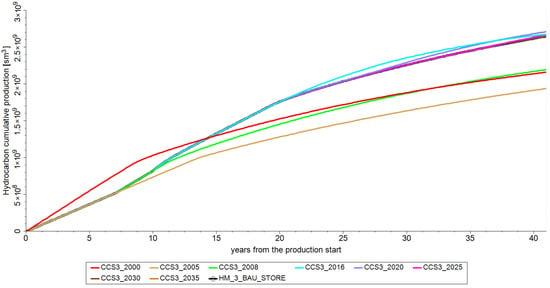
Figure 8.
Cumulative hydrocarbon production for the case with B-6 as the injection well.
For cases where injection wells are B-8 and B-9 (strategies CCS1 and CCS2), the base-line scenarios (BAU) have the highest cumulative hydrocarbon gas (without CO2) production, with the exception of the latest timing (35 years after the production start). This can be attributed to minimal fluid contamination. However, for the scenarios where the injection starts simultaneously with production (CCS1_2000 and CCS2_2000, and also CCS3_2000), hydrocarbon gas production in the first fifteen years is greater than the corresponding base cases. Cumulative production at the end of the observed period is still lower compared to the base cases. This can be attributed to the earlier breakthrough of CO2. Nevertheless, cumulative productions that are similar to BAU scenarios are noticed in scenarios where the injection is started only after the reservoir depletion (CCS1_2030 and CCS1_2035, and CCS2_2030 and CCS2_2035). This is in line with the findings from the literature [25,46], where the simulations implied that it is desirable to deplete the reservoir as much as possible prior to the implementation of EGR (when the goal is to maximize natural gas production, i.e., recovery).
The same phenomenon is observed in the third well arrangement (B-6 as the injection well), but in these strategies, more cases achieve higher cumulative hydrocarbon production than the base case. This can be attributed to the injection and production wells’ selection. When B-6 (as the deepest of the three wells) is chosen as the injector, hydrocarbon production is lower than in the other two well positionings. This indicates that B-6 has the best productivity (cumulative hydrocarbon production is higher if B-6 is chosen as a producer), and the best injectivity too—the most favorable retention results are achieved with well B-6 as the injector, which implies that this well is positioned in the most favorable part of the anticline. Further EGR optimization could be achieved by varying the production and injection rates.
A later injection start increases the ultimate recovery, but for storage assessment, the effect on the CO2 retention efficiency must be taken into account as well. Although the ultimate recovery is a criterion that affects the project’s profitability, other parameters have to be considered to assess the suitability of the reservoir for storage with simultaneous production.
Cumulative CO2 production has the same trend, regardless of the wells’ arrangement (Figure 9). The base cases produce the smallest amounts of CO2 because CO2 is not injected, and the only CO2 production is from the original reservoir fluid. The greatest CO2 production is obtained in cases where the injection starts early, meaning that the fluid composition degradation (CO2 content increase) cannot be avoided. However, it can be optimized by varying the production and injection rates.
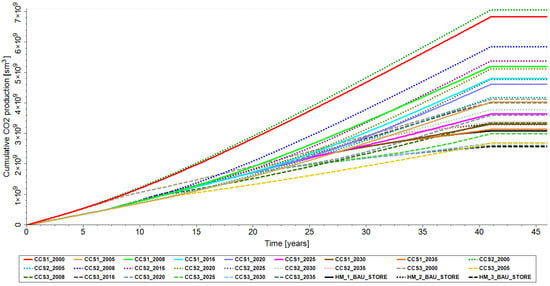
Figure 9.
Cumulative CO2 production.
3.2. Retention
As opposed to the previously evaluated criteria that are relevant only in the production phase (the first 40 years), retention (Figure 10) should also be observed in the ‘pure’ storage period (the last 60 years). A positive value of retention indicates that CO2 is permanently stored (more CO2 is injected than is produced) and also confirms gate-to-gate carbon negativity of the process.
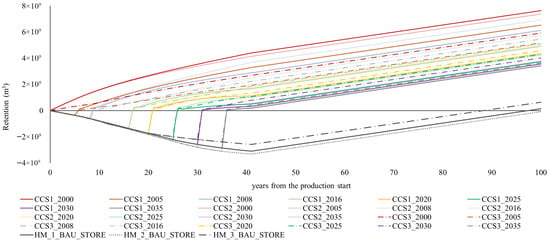
Figure 10.
Retention results.
Retentions follow the same trend in all strategies, but their values vary because of the different quantities of the produced and injected CO2. All scenarios that include both injection and production have positive retentions from the start of injection.
When observing earlier injection starts, the CCS3 scenarios achieve notably lower retentions than cases with alternate well arrangements. For later injection starts, this effect changes, and the latest injection start yields the highest retention in CCS3 strategies. Furthermore, CCS1 scenarios only yield the highest retention in the first two injection timings (compared to the other two well arrangements), and it can be concluded that this well placement is the most sensitive to the injection start, since the retention for this set of scenarios falls below retentions of the other two well arrangements in later injection starts. Considering that reservoir properties (namely porosity, which, in combination with permeability and the productive interval thickness, dictates the well’s deliverability) around the injection well (B-9) are poorer compared to the producers (B-6 and B-8), the described effect can be explained by lower injectivity than productivity, which becomes more prominent with time.
When comparing individual cases for each well’s arrangement, the highest retention at the end of the observed period is (in general) achieved in those where the injection starts earlier. This is explained by the highest cumulative amounts of CO2 injected. The only exceptions were observed in strategies CCS2 and CCS3, when comparing scenarios with the injection starting in the eighth year (after the start of production) to scenarios with the injection starting in the fifth year (retention in CCS2_2008 is higher than in CCS2_2005, and retention in CCS3_2008 is higher than in CCS3_2005).
The ultimate retentions in the baseline scenarios are low, leading to the conclusion that simultaneous CO2 injection and gas production increase the CO2 storage capacity of gas reservoirs.
Negative retention values mean that less CO2 is injected than is produced; therefore, the case is not carbon negative and, considering the high initial CO2 content in the reservoir fluid, negative retention is expected. This implies that the only way to achieve carbon negativity in this specific field is to inject CO2.
3.3. Storability
Another important indicator that has to be observed in both production and ‘pure’ storage phases is storability.
In the production period of CCS1 scenarios (Figure 11), better results for storability were generally observed for an earlier injection start, which is in accordance with retention results for these cases. It was noticed that storability decreases with time in the production phase, and this can be attributed to an increase in CO2 breakthrough.
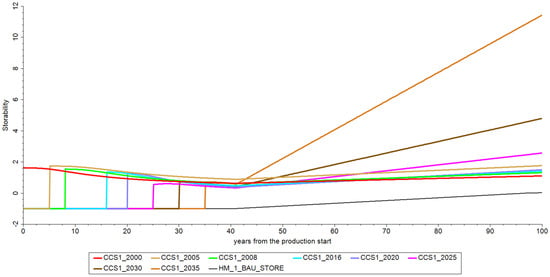
Figure 11.
Storability for cases with B-9 as the injection well.
Somewhat different storability results are observed in CCS2 (Figure 12) and CCS3 (Figure 13), as later injection starts yielded initially higher storability values.
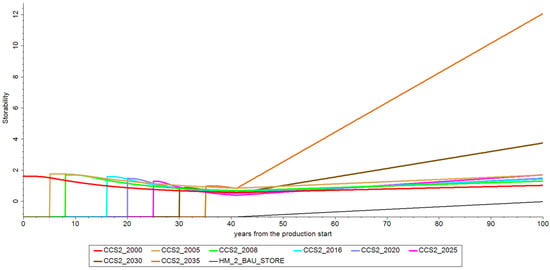
Figure 12.
Storability for scenarios with B-8 as the injection well.
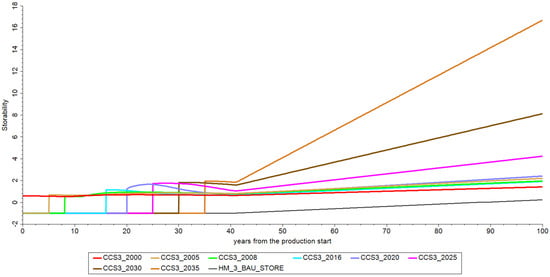
Figure 13.
Storability for scenarios with B-6 as the injection well.
The ‘pure’ storage phase scenarios with later injection starts yielded the best storability results. This can be attributed to a fast decrease in CO2 production and a somewhat slower increase in the retention. The highest storability for all wells’ arrangements (CCS1, CCS2, CCS3) is achieved in scenarios with the latest injection start, and it is significantly higher than in cases with earlier injection starts.
The differences in the results can again be attributed to the well positioning—the scenarios with the deepest well (CCS3) as the injector yield higher storability values, meaning that the amounts of CO2 injected exceed those of the CO2 produced (the result of leaving out the “best” well from the production period and activating it in the injection period), and their difference is favorable in relation to the cumulatively produced CO2. Aside from the well depth (which dictates the pressure, i.e., reservoir energy), other important factors influencing this well’s best performance are the reservoir properties, such as porosity, permeability, and productive interval thickness, which are all more favorable in the vicinity of B-6 compared to the other two wells.
During the storage phase of the base cases, there is no production; hence, all CO2 injected in these scenarios will be permanently kept (Figure 14). It is evident that the volume of injected CO2 is consistent throughout all base cases, mostly because of the selected injection restriction of 150,000 Sm3/day. Low storability values of the base case scenarios do not indicate poor storage performance, but are a result of the very long period without any injection whatsoever. It is practically impossible to store a sufficient CO2 quantity at the given conditions (namely the injection rate) during the storage phase (60 years) to offset all CO2 produced in the production phase (40 years).
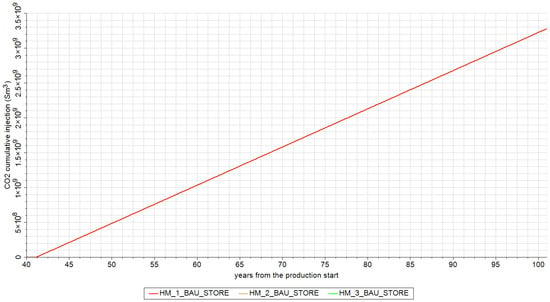
Figure 14.
CO2 injection, cumulative for the scenarios with ‘pure’ storage after the end of production.
3.4. Pressure Behavior
The retention amounts for the base cases (shown in Section 3.2) do not represent the ultimate storage capacities, as the reservoir pressure is not restored in 60 years of injection (Figure 15), meaning there is still available pore space for further CO2 injection (storage).
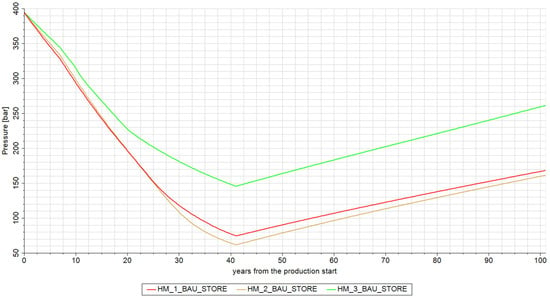
Figure 15.
Average reservoir pressure for the scenarios with ‘pure’ storage after the end of production.
However, it was out of the scope of this work to investigate the influence of different injection rates in the ‘pure’ storage period. This would surely change the dynamics of the reservoir pressure increase in time.
Some of the cases yield an increase in reservoir pressure above the initial almost immediately as the ‘pure’ storage phase begins, but in general, it can be concluded that the reservoir can be used as a CO2 storage facility for a long time (Figure 16). Throughout both the production and injection phases, pressure typically remains above its critical value (73.8 bar), meaning that the reservoir process is almost always supercritical.
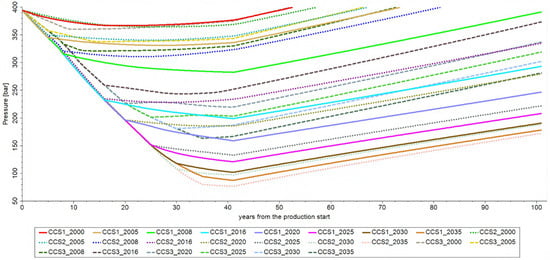
Figure 16.
Reservoir pressure for cases with simultaneous production and injection.
Aside from the reservoir (or productive interval) thickness, reservoir pressure is also an important factor influencing gravity segregation, as it dictates the CO2 density. Under given reservoir p-T conditions, it can be expected that CO2 would have a significantly higher density than the original reservoir fluid, which enhances piston-like displacement.
The reservoir’s capacity, i.e., CO2 storage potential, can be assessed by analyzing the pressure–retention relationship for each scenario. Because of the high CO2 content in the original fluid composition, BAU_STORE scenarios yield decreasing retention until the CO2 injection starts. The retention in these cases stays negative for most of the ‘pure’ storage phase, i.e., the period in which the reservoir pressure increases (Figure 17).
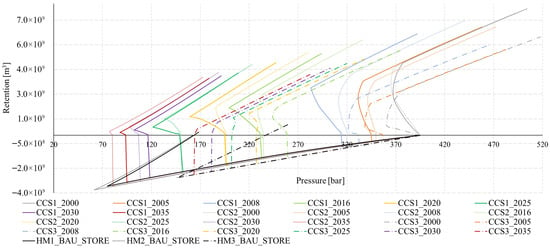
Figure 17.
Retention vs. pressure for all cases with simultaneous production and injection.
In the scenarios with an early injection start, the reservoir is not sufficiently depleted and the pore volume available for further injection is rather low. Higher initial retention in earlier injection timings (as illustrated in Figure 10 and Figure 17) can mostly be attributed to the highest cumulative CO2 injection leveraging the large amounts of CO2 produced in these cases. However, the ultimate storage capacity is rather limited, considering the reservoir repressurization—the initial reservoir pressure is reached at relatively low retentions (less than 6 × 10⁹ m3). The main justification for an early injection start can be found in favorable discounted cash-flow, resulting from produced gas sales. Additionally, an early injection start eliminates the need for capital investments at a later ‘pure’ storage phase. Extrapolation of the lines, under the assumption that they would exhibit the same trend in the future, leads to the conclusion that higher ultimate retention could be achieved in ‘later’ scenarios, since the reservoir pressure is far from the initial. Extrapolation of the BAU cases shows that they would not always yield the highest ultimate retention, considering the initial reservoir pressure. It should be noted, however, that in practice, the storage design would include far more consideration of various injection rates.
Finally, the scenarios can be compared based on the CO2 content in the produced gas (Figure 18).
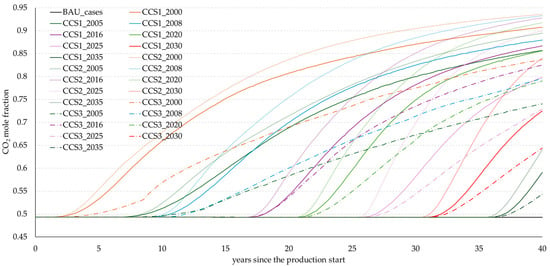
Figure 18.
CO2 mole fractions.
It can be observed that in earlier injection timings, the CO2 content eventually exceeds 85% (and even 90% in some cases), which might imply that these scenarios are less feasible compared to those with later injection starts. It can also be concluded that well placement has a notable influence on the CO2 content, as the scenarios with B-8 as the injection well (CCS2) have the highest CO2 fraction, no matter the injection timing.
However, the absolute values of CO2 content in the produced gas at the end of the observed period cannot be the only criterion for scenario assessment, since the scenarios with a late injection start have less time to exhibit the CO2 content trend to its fullest extent. It can be seen that the CO2 fraction in the CCS2_2030 scenario exceeded 80% less than 10 years after the injection start. It is therefore useful to detect the times of significant increase in the CO2 fraction for each scenario (Table 4).

Table 4.
Time of significant increase in CO2 content.
CCS3 scenarios, where the injection well is the one with best flow properties (B-6), exhibited delayed CO2 breakthroughs. This can be ascribed to relatively low productivity of the two producing wells, and is in line with storability results, which showed that this well arrangement yields the best ratio of retained (permanently stored) and produced CO2.
Figure 19 is a graphical representation of these data, and it can be concluded that the earliest injection timing has a moderate increase in CO2 fraction, while the injection start in the fifth year (from the production start) exhibits the biggest delay in the CO2 fraction increase, no matter the well placement.

Figure 19.
Occurrence of significant increases in CO2 fraction.
Although some similarities in trends for all well placements were detected, the CO2 breakthrough cannot be unambiguously determined, which can be mostly attributed to the process miscibility.
4. Conclusions
Suitability of a reservoir for permanent CO2 storage can be estimated through a set of indicators, and by strategically positioning the injection well and determining the optimal injection start time, it is possible to optimize CO2 storage strategies according to the retention criterion. The results drawn from the analysis of simulation strategies are as follows:
- An earlier start of CO2 injection results in greater retention (i.e., CO2 storage) at the end of the observed period, no matter the well pattern. However, those ‘early’ scenarios reach the initial reservoir pressure soon after the ‘pure’ storage period starts, meaning that, at given production and injection rates, the ultimate retention is lower compared to later injection starts. This is partly a consequence of increased gas (including CO2) production in the period of simultaneous injection and production.
- All CCS scenarios become (gate-to-gate) carbon negative almost immediately at the start of injection, and only one of the base cases resulted in negative retention value (more CO2 was produced than injected), but this is understandable, considering the fraction of CO2 present in the initial reservoir fluid composition.
- The importance of well placement became obvious when the well with the most favorable flow properties was selected as the injector. These scenarios exhibited the best storability and the latest CO2 breakthrough, meaning that properties such as reservoir porosity, permeability, and productive interval thickness, along with the reservoir pressure, significantly influence the storage efficiency, probably due to gravity segregation and miscibility effects.
- Simultaneous gas production and CO2 storage could be feasible in this specific reservoir, because of the readily available CO2 (from this reservoir but from nearby reservoirs as well), which is the primary carrier of costs in EGR projects.
The main factors influencing the optimal strategy are technological limitations and the ultimate goal (e.g., increased recovery or efficient storage). Later injection timings result in slightly higher hydrocarbon recovery, which can be partly attributed to lesser fluid contamination. The fast increase in reservoir pressure in the storage phase that occurred in cases with early injection supports the conclusion that a high-CO2-content gas reservoir should be at least partly depleted before the injection start. Further optimization would be achieved by changing CO2 injection rates. In the region where the analyzed gas reservoir is located, it is common to find gas compositions containing approximately 50% or more CO2. The facilities for gas processing (purification) are constructed before the discovery of this particular gas reservoir, resulting in a favorable economic aspect for gas processing. In gas reservoirs that have a low initial CO2 content, the separation of produced CO2 following the CO2 breakthrough will show up as a significant economic factor. In such cases, increased CO2 retention can be expected, significantly modifying the economics of the entire concept. This indicates the need for further research focusing on the initial CO2 content and the economics of the complete gas production and CO2 (re)injection cycle.
No investments in new wells were considered, as all options analyzed in this paper count on the existing infrastructure (wells and technology).
The results presented here include the CO2 flow simulation in a complex (heterogeneous) model of an existing producing gas reservoir. Although the composition and properties of the reservoir fluid are very unfavorable (around 50% mol of CO2, which is not unusual for the observed area), gate-to-gate (injected CO2 from capture and production wells vs. CO2 at production wells) carbon negativity can be achieved by the selection of appropriate timing and injection well. It is expected that the results would be even more favorable if the initial composition contained less CO2. Additionally, scenarios with simultaneous CO2 injection/storage and production are considered justified, as this concept creates market value. Furthermore, CCS technology is readily available, thus eliminating the standard estimate issues, where the injection starts up to five years after the hydrocarbon reservoirs depletion. Finally, regarding CO2 storage in deep saline aquifers, it is expected that the first projects could start within ten years of the initial storage capacity assessments.
Author Contributions
Conceptualization, D.V.; methodology, D.V. and L.J.; formal analysis, L.J. and V.K.; investigation, V.K. and A.D.; writing—original draft preparation, V.K. and A.D.; writing—review and editing, D.V. and L.J.; visualization, L.J., V.K. and A.D.; supervision, D.V. All authors have read and agreed to the published version of the manuscript.
Funding
This research received no external funding.
Institutional Review Board Statement
Not applicable.
Informed Consent Statement
Not applicable.
Data Availability Statement
No new data were created or analyzed in this study. Data sharing is not applicable to this article.
Acknowledgments
The authors would like to thank Schlumberger for providing academic license for the software in this paper.
Conflicts of Interest
Authors Valentina Kružić and Ante Dujaković are employed by Heidelberg Materials and Ina Industrija Nafte d.d. The remaining authors declare that the research was conducted in the absence of any commercial or financial relationships that could be construed as a potential conflict of interest.
Abbreviations
The following abbreviations are used in this manuscript:
| BAU | Business as usual; injection starts after production end |
| CCS | Carbon capture and storage; injection starts simultaneously with production |
| CCS1 | Enhanced recovery scenarios with injector B-9 |
| CCS2 | Enhanced recovery scenarios with injector B-8 |
| CCS3 | Enhanced recovery scenarios with injector B-6 |
| HM_1 | History matching for case with injector B-9 |
| HM_2 | History matching for case with injector B-8 |
| HM_3 | History matching for case with injector B-6 |
| HM_BAU_STORE_1 | Injection starts after the production with injector B-9 |
| HM_BAU_STORE_2 | Injection starts after the production with injector B-8 |
| HM_BAU_STORE_3 | Injection starts after the production with injector B-6 |
| rm3 | Reservoir cubic meter |
| sm3 | Standard cubic meter |
| Gi | Gas initially in place (standard conditions), sm3 |
| Gp | Gas production, sm3 |
| VCO2(s.c.) | Reservoir’s storage capacity for CO2 (expressed at standard conditions), sm3 |
| Bgi | Gas FVF (formation volume factor) at initial conditions, |
| Vg(r.c.) | |
| Vg(s.c.) | Volume of gas (standard conditions), sm3 |
| Combined CO2 and natural gas FVF (final injection reservoir conditions), |
References
- Edouard, M.N.; Okere, C.J.; Ejike, C.; Dong, P.; Suliman, M.A.M. Comparative numerical study on the co-optimization of CO2 storage and utilization in EOR, EGR, and EWR: Implications for CCUS project development. Appl. Energy 2023, 347, 121448. [Google Scholar] [CrossRef]
- Wang, W.; Wen, J.; Wang, C.; Gomari, S.R.; Xu, X.; Zheng, S.; Su, Y.; Li, L.; Hao, Y.; Li, D. Current status and development trends of CO2 storage with enhanced natural gas recovery (CS-EGR). Fuel 2023, 349, 128555. [Google Scholar] [CrossRef]
- Liu, S.Y.; Ren, B.; Li, H.Y.; Yang, Y.Z.; Wang, Z.Q.; Wang, B.; Xu, J.C.; Agarwal, R. CO2 storage with enhanced gas recovery (CSEGR): A review of experimental and numerical studies. Pet. Sci. 2022, 19, 594–607. [Google Scholar] [CrossRef]
- Savenkova, O.; Remme, J.-E. Key energy transition trends in the exploration and production sector. Energy News 2022, 40, 12–16. [Google Scholar] [CrossRef]
- Klusman, R.W. Evaluation of leakage potential from a carbon dioxide EOR/sequestration project. Energy Convers. Manag. 2003, 44, 1921–1940. [Google Scholar] [CrossRef]
- Michael, K.; Golab, A.; Shulakova, V.; Ennis-King, J.; Allinson, G.; Sharma, S.; Aiken, T. Geological storage of CO2 in saline aquifers—A review of the experience from existing storage operations. Int. J. Greenh. Gas Control 2010, 4, 659–667. [Google Scholar] [CrossRef]
- Wang, Y.; Vuik, C.; Hajibeygi, H. CO2 Storage in deep saline aquifers: Impacts of fractures on hydrodynamic trap-ping. Int. J. Greenh. Gas Control 2022, 113, 103552. [Google Scholar] [CrossRef]
- IPCC. Global Warming of 1.5 °C; IPCC: Geneva, Switzerland, 2018; Volume 1, pp. 43–50. [Google Scholar]
- Rickels, W.; Proelß, A.; Geden, O.; Burhenne, J.; Fridahl, M. Integrating Carbon Dioxide Removal Into European Emissions Trading. Front. Clim. 2021, 3, 690023. [Google Scholar] [CrossRef]
- Zimmermann, A.W.; Schomäcker, R. Assessing Early-Stage CO2 utilization Technologies—Comparing Apples and Oranges? Energy Technol. 2017, 5, 850–860. [Google Scholar] [CrossRef]
- Bajpai, S.; Shreyash, N.; Singh, S.; Memon, A.R.; Sonker, M.; Tiwary, S.K.; Biswas, S. Opportunities, challenges and the way ahead for carbon capture, utilization and sequestration (CCUS) by the hydrocarbon industry: Towards a sustainable future. Energy Rep. 2022, 8, 15595–15616. [Google Scholar] [CrossRef]
- Stosur, G.J. EOR: Past, Present and What the Next 25 Years May Bring. In Proceedings of the SPE International Improved Oil Recovery Conference in Asia Pacific, Kuala Lumpur, Malaysia, 20–21 October 2003. [Google Scholar] [CrossRef]
- Kearns, D.; Liu, H.; Consoli, C. Technology Readiness and Costs of CCS. Glob. CCS Insitute 2021, 3, 50. Available online: https://www.globalccsinstitute.com/wp-content/uploads/2021/03/Technology-Readiness-and-Costs-for-CCS-2021-1.pdf (accessed on 16 March 2025).
- Hamza, A.; Hussein, I.A.; Al-Marri, M.J.; Mahmoud, M.; Shawabkeh, R.; Aparicio, S. CO2 enhanced gas recovery and sequestration in depleted gas reservoirs: A review. J. Pet. Sci. Eng. 2021, 196, 107685. [Google Scholar] [CrossRef]
- Polak, S.; Grimstad, A.A. Reservoir simulation study of CO2 storage and CO2 -EGR in the Atzbach-Schwanenstadt gas field in Austria. Energy Procedia 2009, 1, 2961–2968. [Google Scholar] [CrossRef]
- CO2CRC Technologies Pty Ltd. Assessment of the Capture and Storage Potential of CO2 Co-Produced with Natural Gas in South-East Asia; CO2CRC Technologies Pty Ltd.: East Melbourne, Australia, 2010; Volume 5, pp. 61–62. Available online: https://www.apec.org/publications/2010/05/assessment-of-the-capture-and-storage-potential-of-co2-coproduced-with-natural-gas-in-southeast-asia (accessed on 21 April 2025).
- Mamora, D.D.; Seo, J.G. Enhanced Gas Recovery by Carbon Dioxide Sequestration in Depleted Gas Reservoirs. In Proceedings of the SPE Annual Technical Conference and Exhibition, San Antonio, TX, USA, 29 September–2 October 2002; pp. 151–159. [Google Scholar] [CrossRef]
- Khan, C.; Amin, R.; Madden, G. Carbon dioxide injection for enhanced gas recovery and storage (reservoir simula-tion). Egypt. J. Pet. 2013, 22, 225–240. [Google Scholar] [CrossRef]
- Abba, M.; Abbas, A.; Saidu, B.; Nasr, G.; Al-Otaibi, A. Effects of gravity on flow behaviour of supercritical CO2 during Enhanced Gas Recovery (EGR) by CO2 injection and sequestration. In 5th CO2 Geological Storage Workshop; European Association of Geoscientists & Engineers: Houten, The Netherlands, 2018; Volume 2018, pp. 1–5. [Google Scholar] [CrossRef]
- Omar, A.; Addassi, M.; Vahrenkamp, V.; Hoteit, H. Co-optimization of CO2 storage and enhanced gas recovery using carbonated water and supercritical CO2. Energies 2021, 14, 7495. [Google Scholar] [CrossRef]
- Neele, F.; Hewson, C.; Loeve, D.; Eyvazi, F.J.; Hegen, D.; Hofstee, C. CO2-EGR: Using CO2 to Enhance Gas or Condensate Recovery. In Proceedings of the 14th Greenhouse Gas Control Technologies Conference Melbourne, Melbourne, Australia, 21–26 October 2018. [Google Scholar] [CrossRef]
- Cao, C.; Liu, H.; Hou, Z.; Mehmood, F.; Liao, J.; Feng, W. A review of CO2 storage in view of safety and cost-effectiveness. Energies 2020, 13, 600. [Google Scholar] [CrossRef]
- Oldenburg, C.M.; Pruess, K.; Benson, S.M. Process Modeling of CO2 Injection into Natural Gas Reservoirs for Carbon Sequestration and Enhanced Gas Recovery. Energy Fuels 2001, 15, 293–298. [Google Scholar] [CrossRef]
- Oldenburg, C.M.; Benson, S.M. CO2 Injection for Enhanced Gas Production and Carbon Sequestration. In Proceedings of the SPE International Petroleum Conference and Exhibition in Mexico, Villahermosa, Mexico, 10–12 February 2002. [Google Scholar] [CrossRef]
- Jikich, S.A.; Smith, D.H.; Sams, W.N.; Bromhal, G.S. Enhanced gas recovery (EGR) with carbon dioxide sequestration: A simulation study of effects of injection strategy and operational parameters. In Proceedings of the SPE Eastern Regional Meeting, Pittsburgh, PA, USA, 6–10 September 2003. [Google Scholar] [CrossRef]
- Al-Hasami, A.; Ren, S.; Tohidi, B. CO2 Injection for Enhanced Gas Recovery and Geo-Storage: Reservoir Simulation and Economics. In Proceedings of the SPE Europec/EAGE Annual Conference, Madrid, Spain, 13–16 June 2005. [Google Scholar] [CrossRef]
- Van Der Meer, L.G.H.; Kreft, E.; Geel, C.R.; D’Hoore, D.; Hartman, J. CO2 storage and testing enhanced gas recovery in the K12-B reservoir. Int. Gas Union World Gas Conf. Pap. 2006, 1, 61–71. [Google Scholar]
- Lai, Y.T.; Shen, C.H.; Tseng, C.C.; Fan, C.H.; Hsieh, B.Z. Estimation of Carbon Dioxide Storage Capacity for Depleted Gas Reservoirs. Energy Procedia 2015, 76, 470–476. [Google Scholar] [CrossRef]
- Akai, T.; Saito, N.; Hiyama, M.; Okabe, H. Numerical modelling on CO2 storage capacity in depleted gas reservoirs. Energies 2021, 14, 3978. [Google Scholar] [CrossRef]
- Cao, C.; Hou, Z.; Li, Z.; Pu, X.; Liao, J.; Wang, G. Numerical modeling for CO2 storage with impurities associated with enhanced gas recovery in depleted gas reservoirs. J. Nat. Gas Sci. Eng. 2022, 102, 104554. [Google Scholar] [CrossRef]
- Schlumberger. “Petrel” and “Eclipse.” Version 2024.4. Available online: https://www.software.slb.com/products/eclipse (accessed on 16 March 2025).
- Peng, D.-Y.; Robinson, D.B. A New Two-Constant Equation of State. Ind. Eng. Chem. Fundam. 1976, 15, 59–64. [Google Scholar] [CrossRef]
- Soave, G. Equilibrium constants from a modified Redlich-Kwong equation of state. Chem. Eng. Sci. 1972, 27, 1197–1203. [Google Scholar] [CrossRef]
- Stryjek, R.; Vera, J.H. PRSV: An improved Peng—Robinson equation of state for pure compounds and mixtures. Can. J. Chem. Eng. 1986, 64, 323–333. [Google Scholar] [CrossRef]
- Jukić, L.; Vulin, D.; Kružić, V.; Arnaut, M. Carbon-Negative Scenarios in High CO2 Gas Condensate Reservoirs. Energies 2021, 14, 5898. [Google Scholar] [CrossRef]
- Vulin, D.; Saftić, B.; Macenić, M. Estimate of dynamic change of fluid saturation during CO2 injection—Case study of a regional aquifer in Croatia. Interpretation 2018, 6, SB51–SB64. [Google Scholar] [CrossRef]
- Al-Abri, A.; Hiwa, S.; Robert, A. Experimental investigation of the velocity-dependent relative permeability and sweep efficiency of supercritical CO2 injection into gas condensate reservoirs. J. Nat. Gas Sci. Eng. 2009, 1, 158–164. [Google Scholar] [CrossRef]
- Zhang, L.; Niu, B.; Ren, S.; Zhang, Y.; Yi, P.; Mi, H.; Ma, Y. Assessment of CO2 Storage in DF1-1 Gas Field South China Sea for a CCS Demonstration. J. Can. Pet. Technol. 2010, 49, 9–14. [Google Scholar] [CrossRef]
- Honari, A.; Zecca, M.; Vogt, S.J.; Iglauer, S.; Bijeljic, B.; Johns, M.L.; May, E.F. The impact of residual water on CH4-CO2 dispersion in consolidated rock cores. Int. J. Greenh. Gas Control 2016, 50, 100–111. [Google Scholar] [CrossRef]
- Kashefi, K.; Pereira, L.M.C.; Chapoy, A.; Burgass, R.; Tohidi, B. Measurement and modelling of interfacial tension in methane/water and methane/brine systems at reservoir conditions. Fluid Phase Equilib. 2016, 409, 301–311. [Google Scholar] [CrossRef]
- Global CCS Institute. Introduction to Industrial Carbon Capture and Storage, Global Status of CCS: Special Report; Global CCS Institute: Melbourne, Australia, 2016. [Google Scholar]
- Askarova, A.; Mukhametdinova, A.; Markovic, S.; Khayrullina, G.; Afanasev, P.; Popov, E.; Mukhina, E. An Overview of Geological CO2 Sequestration in Oil and Gas Reservoirs. Energies 2023, 16, 2821. [Google Scholar] [CrossRef]
- Liu, E.; Lu, X.; Wang, D. A Systematic Review of Carbon Capture, Utilization and Storage: Status, Progress and Chal-lenges. Energies 2023, 16, 2865. [Google Scholar] [CrossRef]
- Arnaut, M.; Vulin, D.; Lamberg, G.J.G.; Jukić, L. Simulation Analysis of CO2-EOR Process and Feasibility of CO2 Storage during EOR. Energies 2021, 14, 1154. [Google Scholar] [CrossRef]
- Newman, G.H. Pore-Volume Compressibility of Consolidated, Friable, and Unconsolidated Reservoir Rocks Under Hydrostatic Loading. J. Pet. Technol. 1973, 25, 129–134. [Google Scholar] [CrossRef]
- Clemens, T.; Wit, K. CO2 Enhanced Gas Recovery Studied for an Example Gas Reservoir. In Proceedings of the SPE Annual Technical Conference and Exhibition, San Antonio, TX, USA, 29 September–2 October 2002; pp. 161–168. [Google Scholar] [CrossRef]
Disclaimer/Publisher’s Note: The statements, opinions and data contained in all publications are solely those of the individual author(s) and contributor(s) and not of MDPI and/or the editor(s). MDPI and/or the editor(s) disclaim responsibility for any injury to people or property resulting from any ideas, methods, instructions or products referred to in the content. |
© 2025 by the authors. Licensee MDPI, Basel, Switzerland. This article is an open access article distributed under the terms and conditions of the Creative Commons Attribution (CC BY) license (https://creativecommons.org/licenses/by/4.0/).