Abstract
During peak hours, the large-scale and spatiotemporal imbalance of passenger flow in subway stations results in passenger crowding, queuing issues, and uneven utilization of facility capacities. These problems not only decrease the overall throughput efficiency of the station but also increase safety risks related to large passenger gatherings. This research constructed a pedestrian facility network for subway station access and egress by defining minimum capacity control units of node facilities (including station entrances/exits, fare gates, security check machines, and staircases/escalators) as network nodes and the connecting channels among these nodes were assumed as edges. With the optimization objectives of minimizing both the average walking time of passengers in the pedestrian facility network and the risk of passenger flow aggregation at nodes, an integrated optimization model for passenger flow control and service capacity configuration in the pedestrian facility network of subway stations is established. The ε-constraint method is employed to transform it into a single-objective linear integer programming model, which is then directly solved using the Gurobi optimizer version 11.0. The following conclusion were drawn form a case study on the National Convention and Exhibition Center Station of Shanghai Metro: compared with pre-optimization conditions, the optimized solution reduced the average walking time of access/egress passengers during peak hours by 11%, decreased the number of nodes with queue overflow by 76%, lowered node-level crowding risks by 45%, and reduced facility supply–demand balance standard deviation by 22.8%. Compared to single-objective optimization approaches, the proposed method only increased the average walking time by 8% while decreasing the number of overflow-prone nodes by 60% and crowding risk by 26.1%. These findings provided scientific support for the formulation of crowd management strategies and optimization of operational control in subway stations under heavy passenger flow conditions.
1. Introduction
Against the backdrop of the ongoing acceleration of global urbanization, subways have gradually become the backbone of public transportation systems in major cities, thanks to their advantages of large capacity, high efficiency, energy conservation, and environmental friendliness. In recent years, the scale of China’s subway network has expanded rapidly, with some hub stations and transfer nodes facing persistent pressure from growing passenger flows during specific time periods. Under the condition of heavy passenger flow, high-density crowds gather at bottleneck facilities such as subway station entrances/exits, staircases/escalators, and fare gates, posing serious safety threats to station operations [1]. To mitigate risks, stations have developed “one-station-one-plan” strategies based on historical passenger flow patterns and operational experience for regular large passenger flows during morning and evening peaks [2], which have proven effective in practice. However, for large passenger flows due to major events or emergencies—characterized by complexity and sporadicity—existing management practices still face challenges such as imprecise implementation, untimely control, and high safety risks [3]. Balancing safety risk prevention, congestion mitigation, and service level maintenance has become a critical requirement in subway operational safety. With the advent of smart stations, the remote automation of facilities such as escalators, fare gates, and railings can provide strong support for integrated, refined, and dynamic service capacity configuration and passenger flow control.
The challenges of managing large passenger flows in subway stations are equally prominent in comprehensive transportation hubs such as airports and railway stations, which feature complex spatial structures and diverse passenger compositions. Research methods applied in these hubs offer valuable references for subway-related studies. A review of existing literature reveals that micro-simulation, queuing network theory, and data-driven optimization are the core methodologies for addressing passenger flow issues in such hubs. In airport hub research, emphasis is placed on precise modeling and simulation of passenger queuing systems at nodes like check-in counters and security checkpoints to evaluate and enhance service levels [4,5,6]. Additionally, stochastic queuing network models are constructed to simulate the overall operation of the hub, enabling the identification of operational bottlenecks [7]. For extreme scenarios such as large-scale flight delays, data-driven optimization methods are adopted for emergency evacuation [8], reflecting a full-cycle research approach that covers both routine services and emergency management. In railway stations and comprehensive hubs, research focuses more on spatial integration and passenger flow route optimization. Pedestrian micro-simulation technology can accurately replicate passenger behaviors during the check-in process, facilitating the optimization of facility layout and guidance strategies [9,10]. Studies also explore the coordination and interoperability of passenger flow organization across different transportation modes (e.g., high-speed rail and aviation), using system simulation to optimize the entire collection and distribution network [11,12]. This research paradigm—using simulation and modeling to “diagnose” passenger flow operations in hubs, then applying system optimization to “prescribe” measures for improving safety and efficiency [13]—provides a robust methodological foundation for integrating optimization methods in subway stations to simultaneously implement passenger flow control and facility capacity allocation.
Relevant research and applications have demonstrated that passenger flow control can effectively improve the operational safety of subway systems under oversaturated conditions during peak hours. Regarding coordinated passenger flow control across multiple stations, researchers have integrated passenger flow data from multiple stations or lines to achieve network-wide coordinated passenger flow control [14]. This approach enhances overall operational efficiency and balances supply and demand for passenger flow. Shi et al. proposed an optimized subway passenger flow control method based on multi-line coordinated scheduling for peak-hour passenger flows. They developed a bi-objective integer programming model and transformed it into a single-objective model with threshold constraints for solution [15]. Zhao Peng established a mathematical programming method for passenger flow control on a single line, aiming to minimize passenger delay losses and maximize passenger turnover. Optimal inflow rates for passenger flow during each time period were solved to formulate control strategies [16]. Lu Gongyuan et al. constructed a passenger flow control model with the objective of maximizing passenger turnover [17], while Li Denghui et al. developed a coordinated model to maximize passenger turnover and minimize passenger waiting time [18]. Feng Shumin et al. addressed sudden large passenger flows by using station passenger flow control rates as decision variables. They built a multi-objective coordinated control model to maximize section load factors and minimize average passenger delay time [19]. Huan Ning et al. took the number of passengers allowed to board trains as a variable, constructing an optimization model to balance the number of passengers stranded on platforms and train capacity utilization for passenger flow [20]. Li et al. established a network-wide coordinated passenger flow control model to minimize total passenger delay time and control intensity for passenger flow at each station [21]. Xu et al. proposed a bi-level programming model for multi-station cooperative control of passenger flow during subway peak hours and designed a solution algorithm combining the Method of Successive Averages (MSA) and a genetic algorithm [22]. Shi Jungang et al. developed a safety-oriented coordinated passenger flow control model for subway peak hours, ensuring that passenger gatherings related to passenger flow at all stations remain within safe limits [23].
For in-station passenger flow control in subway stations, some scholars have used micro-simulation technology to model specific passenger behavior patterns associated with passenger flow within subway stations. From an individual perspective, they analyzed details such as passengers’ walking route choices for passenger flow, boarding/alighting behaviors affecting passenger flow [24], and dwell times at different facilities during passenger flow movement [25], thereby designing more targeted and adaptive passenger flow management strategies. Baee et al. conducted micro-simulations of passenger travel behaviors related to passenger flow within rail transit systems and proposed different boarding/alighting strategies based on simulation results to reduce platform overcrowding caused by passenger flow [26]. Davidich et al. analyzed passenger travel behaviors influencing passenger flow and built a simulation model to predict passenger capacity in station waiting areas for passenger flow. Interventions in passenger boarding behaviors related to passenger flow were implemented based on these predicted capacities [27]. Hoogendoorn et al. developed the microscopic pedestrian flow model NOMAD to predict passenger behavior characteristics under different facility design schemes in Lisbon Metro stations, which are closely related to passenger flow. This model was used to evaluate the safety of station designs under large passenger flow scenarios [28]. In addition, some scholars have studied single-station passenger flow control by establishing mathematical models. Xu et al. designed algorithms to rationally allocate station and train capacity for passenger flow, aiming to better utilize station capacity and improve system operational efficiency and passenger experience related to passenger flow [29]. Yoo et al. established a subway station passenger flow control model to minimize platform overcrowding from passenger flow and train delay time affected by passenger flow. They used passenger flow rates at station entrances as decision variables to adjust the opening speed of Automatic Fare Collection (AFC) gates for passenger flow management [30]. Ding et al. proposed a model for passenger arrival distribution on platforms related to passenger flow and developed a passenger guidance model to maximize passengers’ spatial comfort on platforms during passenger flow movement [31].
In summary, existing research on large passenger flow management in stations primarily relies on passenger flow simulation and optimization modeling. However, three key limitations remain. First, simulation optimization exhibits poor adaptability to dynamic changes in passenger flow characteristics, making it unable to quickly generate optimal control schemes for different passenger flow demand scenarios. Second, mathematical optimization modeling studies mostly focus on coordinated control across multiple stations for regular peak-hour passenger flows. Few studies address control optimization for abrupt large passenger flows at single stations during major events—scenarios that demand higher solution efficiency from optimization models for passenger flow. Third, regarding optimization objectives for passenger flow, most existing studies prioritize a single goal related to passenger flow transportation efficiency (e.g., maximizing passenger flow volume or minimizing passenger waiting time). Although a small number of multi-station coordinated control studies have incorporated operational safety objectives for passenger flow, they treat each station as a single node. This limits their analysis to macro-indicators such as the maximum number of passengers gathered at a station for passenger flow, failing to identify the specific locations of passenger flow congestion risks within a station and their corresponding risk values at the micro level. For single-station passenger flow control optimization, most studies use decision variables such as passenger flow inflow rates, passenger flow restriction rates, or capacity allocation for a single type of facility related to passenger flow. There is a lack of research on the synchronous optimization of in-station passenger flow control and bidirectional (inbound/outbound) service capacity allocation for different types of facilities for passenger flow. Given the coupled relationship between passenger flow control and facility capacity allocation for passenger flow, their synchronous optimization can yield significantly better practical management outcomes for passenger flow.
This study constructs a microscopic walking network for subway stations based on graph theory. Considering the dual optimization objectives of minimizing the total walking time of inbound and outbound passengers and minimizing passenger flow congestion risks, an integrated optimization model for passenger flow control and service capacity configuration in the pedestrian facility network of subway stations (covering both inbound and outbound flows) is developed. This model aims to enhance the passenger flow organization efficiency and operational safety level of subway stations under scenarios of abrupt large passenger flows, such as those during major public events.
2. Construction of Access/Egress Walking Facility Network
Subway station passenger flow control is defined as the management of the number of passengers entering the station or specific flow paths to avoid localized crowding. It generally includes three control strategy types: passenger flow restriction, passenger flow diversion guidance, and equipment service capacity adjustment [32]. This research conceptualized a subway station as a pedestrian walking network consisting of node facilities (nodes) such as entrances/exits, fare gates, security check machines, and staircases/escalators, as well as connecting channel facilities (edges) between these nodes. The integrated optimization model of passenger flow control and service capacity configuration in the subway station access/egress walking facility network investigated here involved controlling the departure and arrival passenger flows at node facilities within the network and adjusting the number of open entrances/exits, operating widths, and travel directions of node or channel facilities. The objective was the reduction in high-density crowding risks at localized facilities in the station walking network and enhancement of the overall supply–demand matching degree of the network under the condition of large passenger flow.
In practice, when regulating subway station node facility service capacity, a single node facility at the same location is generally subdivided into multiple minimum capacity control units. Precise regulation and control of the service capacity of the node facility are achieved by synchronous modification of the operating state (travel direction or open/closed status) of these units. Generally, when dividing into minimum capacity control units, facility type, quantity, and passenger flow fluctuation characteristics should be taken into account. For example, a fare gate group near an entrance/exit with 6 gates might be divided into 2 control units, each consisting of 3 gates; a set of staircases/escalators connecting the concourse and platform might be divided into 3 minimum capacity control units: one bidirectional staircase, one inbound escalator, and one outbound escalator; and platform waiting areas could be divided into multiple independent platform passenger flow guidance zones (minimum capacity control units) on the basis of the location of staircases/escalators accessing the platform.
This research constructed a subway station access/egress walking facility network based on graph theory, as illustrated in Figure 1, with nodes being minimum capacity control units of node facilities in a directed graph and edges being connecting channels among nodes. The number of nodes within the same group (or type) of node facilities was not fixed and adjacent node facility groups formed sub-networks. Taking inbound flow as an example and assuming that the passengers passed through groups of node facilities during entry, the entire inbound network could be divided into n interconnected sub-networks.
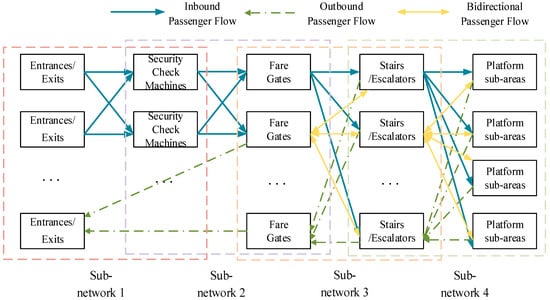
Figure 1.
Directed network diagram of pedestrian facilities for access and egress in subway stations. Note: 1. The square lines in the diagram represent subnetworks. 2. In the subsequent directed network graph, E represents entrances/exits, C represents se-curity check machines, A represents fare gates, S represents stairs/escalators, and P repre-sents platform sub-areas.
3. Optimization Model and Solution Algorithm
3.1. Model Assumptions
The optimization of passenger flow control and service capacity configuration in the access/egress walking facility network of a subway station was affected by various factors, including passenger behavior patterns, train schedules, and station facility layout [33]. To simplify the modeling, the following assumptions were made:
Assumption 1.
Passenger arrival rate remained constant within a train departure interval.
Assumption 2.
Passenger arrivals followed a uniform distribution and no passenger was stranded on the platform.
Assumption 3.
The maximum remaining transport capacity after a train arrived at the platform was constant and could be estimated based on historical passenger flow data combined with the timetable [34].
3.2. Parameter and Variable Definitions
The symbols and definitions of parameters and variables needed for the development of the model are listed in Table 1.

Table 1.
Description of model parameter symbols.
3.3. Objective Function
A passenger flow control and facility service capacity configuration integrated optimization model in the subway station access/egress walking facility network was established with the two goals of minimizing the average walking time of access/egress passengers in the station walking facility network and decreasing node passenger flow crowding risks, as expressed in Equation (1).
The average passenger walking time was calculated as the sum of the following three components: average queuing time at nodes, average walking time in channels, and average waiting time on the platform. The passenger flow crowding risk value was obtained as the maximum crowding risk across all nodes.
3.3.1. Average Passenger Walking Time
- (1)
- Passenger Queuing Time at Non-Platform Nodes
In node facilities such as entrances/exits, fare gates, security check machines, and staircases/escalators, queuing occurs when the passenger arrival rate exceeds the maximum service capacity of the facility. In this research, the queuing time of outbound passengers in the platform area was allocated to the platform staircase/escalator node. Assuming that the arrival time of each passenger at a node was independent from others and they arrived at a uniform rate [35], a passenger flow queuing delay model was developed for the node, as presented in Figure 2.
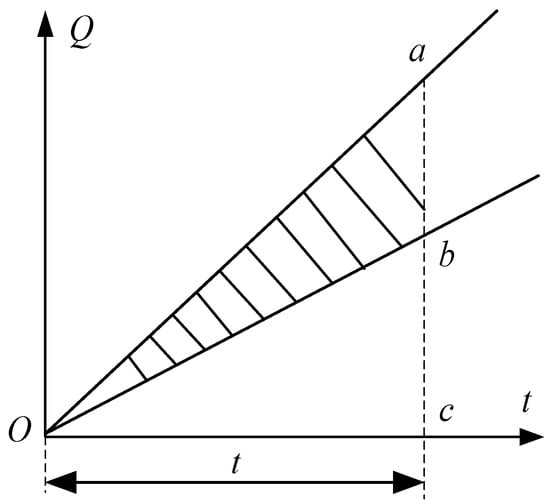
Figure 2.
Schematic diagram of the calculation results of node passenger flow queuing time.
Taking the inbound flow as an example:
The slope of line is passenger inflow rate at node k of sub-network i.
The slope of line is service capacity at node k of sub-network i.
The area of the shaded region is the average queuing time for the inbound passenger flow at this node. The calculation equation is expressed in Equation (2).
Correspondingly, the calculation equation of the average queuing time of the outbound passenger flow at each respective node is stated in Equation (3).
As mentioned above, the average inbound passenger flow delay at the node was stated as:
and the average outbound passenger flow delay at the node was expressed as:
Therefore, inbound and outbound passenger flow departure rates at each node were expressed by Equations (4) and (5), respectively, as:
- (2)
- Average Walking Time in Paths
Walking time in a path (channel) was calculated based on path length and passenger walking speed. Specifically, the passage width allocation ratio for inbound/outbound flows in a path was obtained from passenger flow assignment results, and passenger walking speed was determined based on a calibrated path flow-speed relationship model. When a channel served both inbound and outbound passengers simultaneously, corresponding passenger walking speeds were denoted as and , respectively. The calculation equations are given in Equations (6) and (7).
Outbound passenger walking time in the path was expressed as:
- (3)
- Passenger Waiting Time at Platform Nodes
Figure 3a,b show the waiting delay for platform passengers for a train departure interval of and train arrivals at times and e:
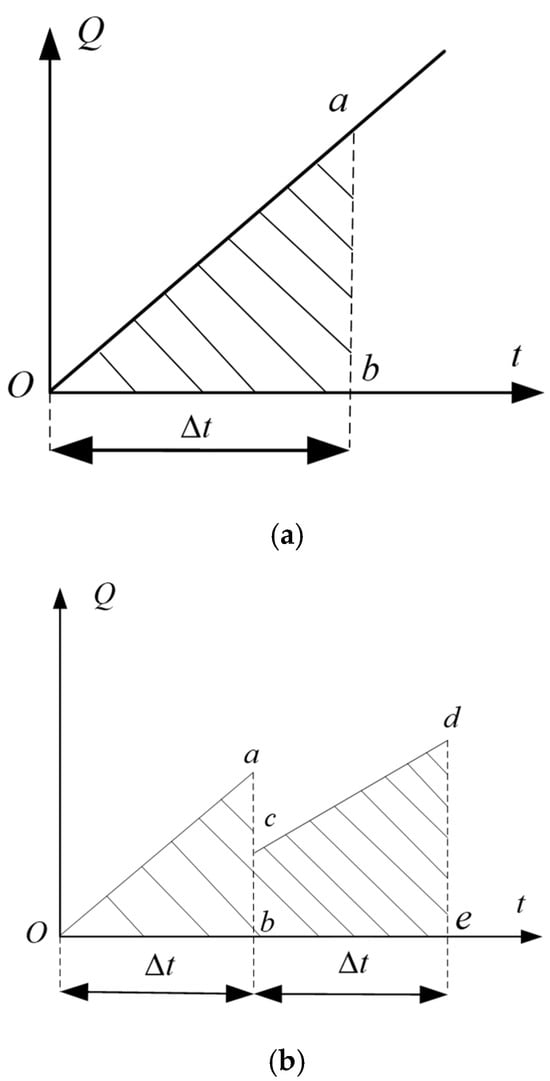
Figure 3.
Schematic diagrams of passenger waiting delay on the platform. (a) No Secondary Queuing. (b) With Secondary Queuing.
The slopes of lines and cd represent inbound passenger arrival rates .
The areas of shaded regions and bcde correspond to inbound passenger waiting times, calculated via Equation (8).
For outbound passengers, queuing delay typically occurred at platform stairs/escalator nodes. Therefore, the platform waiting delay for outbound passengers was set to 0.
The waiting delay for inbound passengers on the platform was stated as:
3.3.2. Node Passenger Flow Crowding Risk
This research adopted the queue space saturation ratio as a quantitative indicator for passenger crowding risk. The queue space saturation ratio was defined as the ratio of queuing passengers at a node to the maximum allowable queue capacity at that node. When this value exceeded 1, it not only indicated that crowd density in the queuing area of the node might exceed permitted safety levels, but also signified queue overflow risk, meaning queuing passengers would significantly impede the safety and efficiency of other flow paths or facilities [36], thereby exacerbating crowding risks. The calculation equations for node queue space saturation ratios are expressed in Equations (9)–(11).
- (1)
- Crowding Risk at Non-Platform Nodes
Node facilities such as entrances/exits, fare gates, security check machines, and stairs/escalators are major bottleneck points in subway stations. When their service capacity is lower than the passenger arrival rate, queuing occurs, which results in passenger flow crowding risk. The queue space saturation ratios (inbound) and (outbound) at node facility () in inbound (outbound) sub-network () were calculated as:
- (2)
- Crowding Risk at Platform Nodes
Within one departure interval, the effective waiting space on the platform gradually becomes congested because waiting passengers arrive continuously. When a train arrives and alighting is completed, the platform area becomes a high-density passenger flow interweaving zone for both boarding and alighting passengers and the platform passenger flow reaches its peak. The queue space saturation ratio at the platform node was obtained as:
3.4. Constraints
Based on flow conservation principle in transportation networks, passenger inflow and outflow at each node and path had to satisfy the following constraints (Equations (12)–(23)):
(1) For any sub-network along inbound/outbound direction, the sum of inflow rates at a downstream node had to be equal to the sum of outflow rates at its adjacent upstream nodes minus queue size at that downstream node which was stated as:
(2) For any sub-network along inbound/outbound direction, the sum of inflow rates at the starting point of a path had to be equal the sum of outflow rates at its corresponding upstream nodes and the sum of outflow rates at the ending point of a path had to be equal to the sum of inflow rates at its corresponding downstream nodes which were determined as:
(3) For paths sharing the same origin node but different destination nodes within an inbound/outbound sub-network, the sum of inflow rates had to be equal to the outflow rate at their common origin node, which was calculated as:
(4) For paths sharing the same terminal node within an inbound/outbound sub-network, the sum of outflow rates had to be equal to the inflow rate at their common downstream node, which was expressed as:
(5) Non-negativity constraints were assumed to be:
(6) Boundary constraint was defined as follows:
At the initial time step, there was no passenger flow on the subway station walking network and the crowding risk was zero:
(7) Service capacity constraints were as defined below:
For an existing subway station, facility configurations remained fixed during an operational period; therefore, the design service capacity of each node and path in the network was predetermined, as stated below:
3.5. Model Solution
The developed optimization model was a bi-objective nonlinear convex programming problem, with Equations (2), (3) and (9)–(11) presenting quadratic functions. Before solving, the temporal distribution characteristics of inbound/outbound passenger flows were analyzed, two fixed periods during which inbound/outbound flow rates remained relatively stable were identified, and the smaller value of the two periods was assigned to parameter t (i.e., t was treated as a constant). This transformed Equations (2) and (3) into linear constraints. In addition, since passenger arrival rates at facilities (entrances/exits, staircases/escalators, fare gates, platforms) during peak hours generally follow a uniform distribution [37], Equations (9)–(11) were also transformed into linear constraints. After the linearization of the objective function, Optimization Model (1) became a bi-objective linear convex programming problem.
In comparison with traditional approaches that integrate multiple objectives into a single weighted objective, ε-constraint method alleviates the need to explore multiple weight combinations. By controlling the value of ε, this method can generate more non-extreme solutions along the Pareto front, ensuring faster convergence, solution diversity, and flexibility [38]. This method provided subway stations with various optimization schemes for passenger flow control and service capacity configuration. Therefore, this research employed the developed ε-constraint method to solve the bi-objective linear convex programming model. The solution steps were as follows:
Step 1: Optimization was performed to solely minimize the average walking time of access/egress passengers. The node crowding risk objective was disregarded and the Gurobi optimizer implemented in C# was applied to solve for the minimum average walking time X.
Step 2: The minimized average walking time objective was converted into Constraint (24):
Step 3: Constraint (24) was added to the optimization model, the original objective of minimizing average walking time was removed, the model was converted into a single-objective linear programming model, and it was solved using Gurobi optimizer to determine the optimal integrated configuration scheme for passenger flow control and facility service capacity.
4. Case Study
4.1. Basic Data
A case analysis was performed using the data obtained in the departure peak period (17:00–18:20) on the first exhibition day of an import expo at the National Convention and Exhibition Center Station on Shanghai Metro Line 2. During this period, the station opened 3 entrances/exits, with 45 fare gates, 4 security check machines, and 5 staircase/escalator sets deployed on the concourse level. To facilitate the configuration of inbound/outbound passage width ratios at entrances/exits, the locations and numbering of entrance/exit passages presented in Figure 4 were adopted.
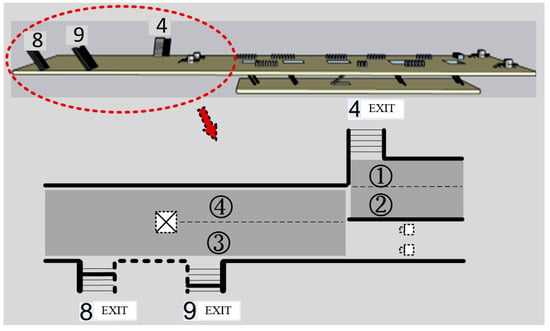
Figure 4.
Floor map of National Convention and Exhibition Center Station.
Further division yielded nine minimum capacity control units for fare gates, six minimum capacity control units for platforms, and nine minimum capacity control units for staircases/escalators. Figure 5 shows the established access/egress walking facility network for the National Convention and Exhibition Center Station. Table 2 summarizes the service capacities and allowable queue sizes for each node. The service capacity of each node was measured using station video data during peak dispersal hours: when various node facilities were in a saturated state, the passage times of 50 consecutive pedestrians were recorded, and their average passage time and maximum service capacity were calculated. The allowable queue length at each node was determined based on the pre-demarcated allowable queuing area for each node (considering no obstruction to the normal movement of passengers in other flow lines), queue formation (ascertained by installing flow-restriction railings or warning signs, etc.), and per capita queuing area (corresponding to Level E service level).
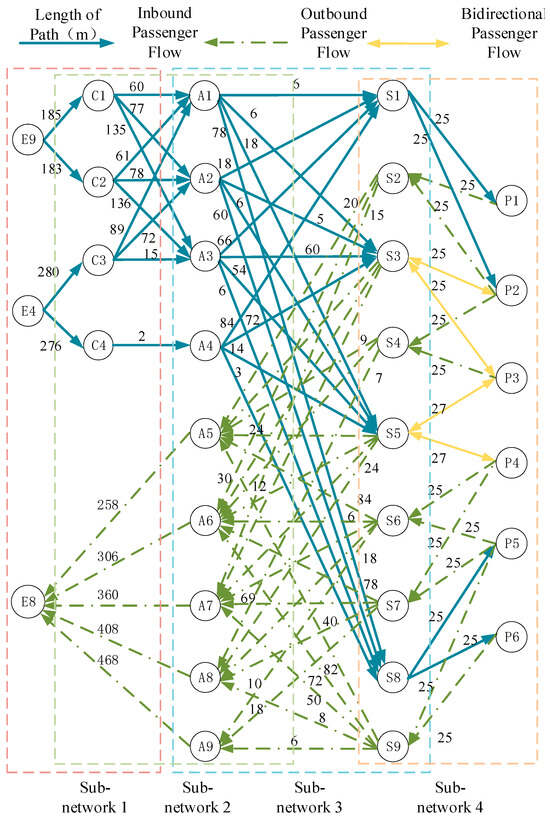
Figure 5.
The schematic diagram of the access/egress walking network of National Convention and Exhibition Center Station during the expo. Note: The square lines in the diagram represent subnetworks.
Table 2.
Maximum service capacity and allowable maximum queuing passengers for each node.
4.2. Optimization Scheme
National Convention and Exhibition Center Station is a terminal station with a train departure interval of 4 min. Each train can carry 2480 passengers. The optimization scheme targeted the peak departure period (17:52–18:20), during which the total inbound and outbound passenger flows of the station were 350 and 50 pax/min, respectively.
(1) The minimum average walking time for access/egress passengers was obtained by inputting the base data of the station into the model and solving with the Gurobi optimizer (C# implementation) while ignoring node crowding risk. The optimal solution achieved a relative gap of 0.00%, yielding X = 23 min (overall average), with inbound passengers averaging 18 min (13 min queuing time, accounting for 72% of total) and outbound passengers averaging 5 min. However, this solution exhibited queue overflow at 10 nodes (queue space saturation ratio > 1), primarily at entrances, fare gates, and security machines, with a peak crowding risk value of 2.3.
(2) Setting δ = 1\%, the average walking time objective was transformed into:
(3) The optimal integrated scheme for passenger flow control and facility service capacity configuration at National Convention and Exhibition Center Station was obtained using Gurobi optimizer (C# implementation) by introducing Equation (25) to the model and optimizing for minimizing maximum node crowding risk. An exhaustive search was performed with an initial δ = 1\% and an incremental increase of 1% per iteration. At δ = 8\%, crowding risk value reduction was maximized.
At this point, the optimal passenger flow allocation scheme for the walking facility network of the National Exhibition and Convention Center Station is shown in Figure 6; the comparative analysis of effects before and after optimization is presented in Table 3; and the optimization scheme for facility service capacity configuration is displayed in Table 4.
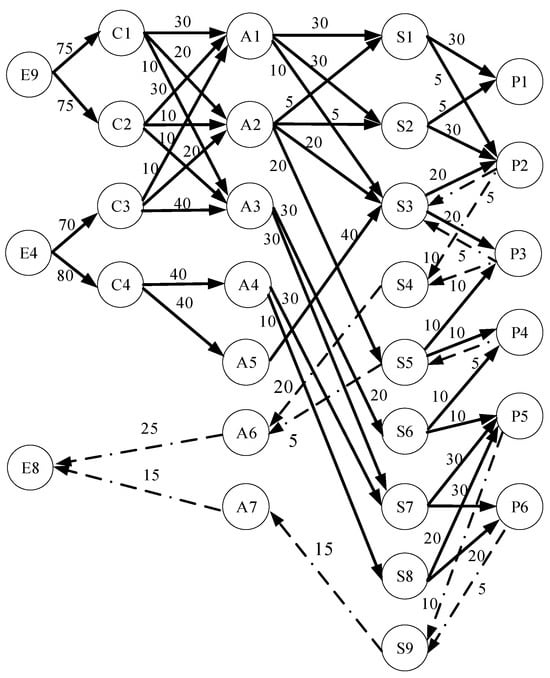
Figure 6.
The optimal passenger flow configuration scheme for the National Exhibition and Convention Center Station during the peak dispersal hour.
Table 3.
The comparative analysis of passenger flow management and control optimization effects at the National Exhibition and Convention Center Station during the peak dispersal hour.
Table 4.
The optimization scheme for service capacity configuration of access/egress facilities at the National Exhibition and Convention Center Station during the peak dispersal hour.
As presented in Table 3, during the departure peak period of the expo, the dual-objective optimization approach developed in this research obtained significant improvements at the National Convention and Exhibition Center Station after considering both efficiency and safety. The method shortened the average walking time of access/egress passengers by 11%, decreased crowding risk by 45.2%, and reduced the number of nodes with queue overflow by 76%. For supply–demand matching at node and channel facilities, the maximum value was decreased by 30.4%, the minimum value was reduced by 6.9%, and the standard deviation was decreased by 22.8%. Compared with Optimization Scheme 1 (efficiency-only objective), Optimization Scheme 2 increased average walking time by 8% but decreased overflow nodes by 60% and crowding risk by 26.1%, presenting a remarkable improvement in balancing operational efficiency and safety risks.
In the same way, the optimization objectives (considering the dual objectives of efficiency and safety) and management and control schemes for other dispersal periods are solved, as shown in Table 5 and Table 6.
Table 5.
Comparative analysis of passenger flow management and control optimization effects at the National Exhibition and Convention Center Station during different dispersal periods.
Table 6.
The optimization scheme for service capacity configuration of access/egress facilities at the National Exhibition and Convention Center Station during different dispersal periods.
As can be seen from Table 5 and Table 6, during the 17:00–17:32 period, the inbound passenger flow during dispersal began to increase, and queuing occurred at Security Inspection Machine 1. Therefore, a flow restriction of 150 persons/min was implemented at Entrance 4. Meanwhile, the inbound–outbound width ratio of Channels ① and ② was adjusted from 1:1.4 to 5:3, Security Inspection Machine 2 and 5 inbound turnstiles were added, and the escalators and stairs were adjusted to 5 for inbound and 3 for outbound, so as to enhance the overall inbound capacity. Since entering through Security Inspection Machine 2 requires a detour, the queuing time at Security Inspection Machine 1 was reduced, while the inbound walking time was prolonged. As a result, the average passenger walking time remained unchanged after optimization, but the passenger flow congestion risk at Security Inspection Machine 1 decreased by 88.9%.
During the 17:32–17:52 period, the inbound passenger flow during dispersal increased to 285 persons/min. Therefore, guidance measures were implemented to divert passengers from Entrance 4 to Entrance 9, so as to alleviate the inbound passenger flow pressure at Entrance 4. At the same time, the inbound–outbound width ratio of Channels ③ and ④ was adjusted from 1:1 to 3:2, Security Inspection Machine 3 was added, and 6 inbound turnstiles were added. Since passengers entering from Entrance 4 to Entrance 9 need to take a long detour, the average passenger walking time increased slightly by 7.4% after optimization, but the inbound passenger flow congestion risk at Entrance 4 decreased by 76.9%.
During the 17:52–18:20 period, the inbound passenger flow during dispersal reached its peak. A flow restriction of 150 persons/min was also implemented at Entrance 9, Security Inspection Machine 4 was added, 5 inbound turnstiles were added, and the escalators and stairs were adjusted to 5 for inbound and 3 for outbound. After optimization, due to the reduction in the overall inbound queuing time for passengers and the balance of inbound passenger flow distribution, the average passenger walking time decreased by 11% and the passenger flow congestion risk decreased by 45.2%, achieving a good management and control effect.
5. Conclusions
In this paper, the minimum capacity control unit of node facilities is taken as the node of a directed graph, and the channels connecting the nodes are taken as edges to construct the access/egress walking facility network of the subway station. A dual-objective optimization model was developed for large passenger flow management to minimize average walking time (Objective 1) and node crowding risk (Objective 2), with decisions focusing on network-wide flow allocation and facility capacity configuration. By converting Objective 1 into a constrained tolerance for increased walking time, the model was transformed into a single-objective linear program and solved via Gurobi optimizer using C#.
Case study results obtained during the departure peak of an expo demonstrated that the proposed method decreased node crowding risk by 26.1% and nodes with queue overflow by 60% and increased passenger walking time by only 8%, effectively mitigating station congestion without compromising travel efficiency.
Further analysis verified the improvements of 11% in average walking time, 76% in overflow nodes, and 45.2% in crowding risk. Supply–demand matching degree for node/channel facilities presented reductions of 30.4% in maximum value, 6.9% in minimum value, and 22.8% in standard deviation, realizing synergistic optimization of flow efficiency and crowding risk while improving alignment between passenger demand and facility capacity.
Since this study constructs a microscopic pedestrian walking network for a single station and conducts modeling and algorithm research based on this network, the research results are only applicable to single stations, such as stations adjacent to large event venues. The coordinated optimization of passenger flow organization across multiple rail transit stations during major events will be the direction of future research.
Author Contributions
H.H. raised the research question and wrote the manuscript. R.Z. and Y.H. (Yuxin He) contributed to manuscript writing. Y.H. (Yanxi He) and Z.L. supervised the research and provided constructive suggestions. All authors have read and agreed to the published version of the manuscript.
Funding
This study is supported by the National Natural Science Foundation of China (52472322, 52072235).
Institutional Review Board Statement
Not applicable.
Informed Consent Statement
Not applicable.
Data Availability Statement
The original contributions presented in this study are included in the article. Further inquiries can be directed to the corresponding author.
Acknowledgments
The authors thank the editors and anonymous reviewers for their valuable comments.
Conflicts of Interest
The authors declare no conflicts of interest.
References
- Zhang, Y.N.; Zhang, P.; Chen, H.; Bao, L.X. Optimum Facilities Collocation Model for Subway Station in Condition of Large Passenger Flow. Urban. Mass. Transit. 2014, 17, 67–70. [Google Scholar] [CrossRef]
- Shi, X.J. Counter measures in Passenger Flow Organization for Metro Station. Urban. Mass. Transit. 2009, 12, 70–72. [Google Scholar] [CrossRef]
- Ma, C.Z. Research on the Coupling Mechanism of Sudden Large Passenger Flow Warning in Urban Rail Transit Operation. Chin. J. Undergr. Space Eng. 2025, 21, 648–653. [Google Scholar] [CrossRef]
- Kierzkowski, A.; Kisiel, T.; Pawlak, M. Passenger level of service estimation model for queuing systems at the airport. Arch. Transp. 2018, 46, 29–38. [Google Scholar] [CrossRef]
- Kierzkowski, A.; Kisiel, T. Modelling the passenger flow at an airport terminal to increase the safety level. In Proceedings of the IEEE International Conference on Military Technologies (ICMT), Swansea, UK, 19–21 May 2015; pp. 1–7. [Google Scholar] [CrossRef]
- Lu, J.; Tan, T.; Sun, Z.; Jiang, C. Passenger flow simulation of hub airports incorporating interactive chain-based guidance. J. Simul. 2025, 19, 535–554. [Google Scholar] [CrossRef]
- Kazakov, A.; Vu, G.; Zharkov, M. A stochastic model of a passenger transport hub operation based on queueing networks. In Proceedings of the International Conference on Information Technologies and Mathematical Modelling, Tomsk, Russia, 4–9 December 2023; Springer: Cham, Switzerland, 2023; pp. 48–62. Available online: https://link.springer.com/chapter/10.1007/978-3-031-65385-8_4 (accessed on 31 October 2025).
- Ma, R.; Huang, A.; Jiang, Z.; Wang, Z.A.; Luo, Q.; Zhang, X. A data-driven optimal method for massive passenger flow evacuation at airports under large-scale flight delays. Reliab. Eng. Syst. Saf. 2024, 245, 109988. [Google Scholar] [CrossRef]
- Liu, X. Simulation and Optimization of Inbound Passenger Flow Line in Large-scale Railway Passenger Station. Railw. Transp. Econ. 2024, 46, 91–101. [Google Scholar] [CrossRef]
- Duan, J.S.; Fang, X.H. Application of VisWalk-based Pedestrian Microsimulation in Complex Underground Transportation Hub Design. Railw. Stand. Des. 2025, 1–11. [Google Scholar] [CrossRef]
- Qu, X.Y.; Liu, L.; Zou, X.L. Interconnection of Passenger Flow Organization between High-Speed Railway and Airline at Intermodal Terminal and Application of Simulation Optimization. Railw. Transp. Econ. 2020, 42, 93–98. [Google Scholar] [CrossRef]
- Li, X.L.; Chen, Y.L.; Zhang, Z.X.; Zhang, Z.Y. Passenger flow organization optimization of rail transit stations connected with railway hubs. Sci. Technol. Eng. 2024, 24, 15242–15248. [Google Scholar] [CrossRef]
- Park, S.; Kim, J.; Kim, J.; Wang, S. Fault Diagnosis of Air Handling Units in an Auditorium Using Real Operational Labeled Data across Different Operation Modes. J. Comput. Civ. Eng. 2025, 39, 04025065. [Google Scholar] [CrossRef]
- Liu, J.; Hu, L.; Xu, X.; Wu, J. A queuing network simulation optimization method for coordination control of passenger flow in urban rail transit stations. Neural. Comput. Appl. 2021, 33, 10935–10959. [Google Scholar] [CrossRef]
- Shi, J.; Yang, L.; Yang, J.; Zhou, F.; Gao, Z. Cooperative passenger flow control in an oversaturated metro network with operational risk thresholds. Transp. Res. Part. C Emerg. Technol. 2019, 107, 301–336. [Google Scholar] [CrossRef]
- Zhao, P.; Yao, X.M.; Yu, D.D. Cooperative Passenger Inflow Control of Urban Mass Transit in Peak Hours. J. Tongji Univ. (Nat. Sci.) 2014, 42, 1340–1346. [Google Scholar]
- Lu, G.Y.; Ma, S.; Wang, K.; Deng, N. Integer Programming Model of Passenger Flow Assignment for Congested Urban Rail lines. J. Southwest. Jiaotong Univ. 2017, 52, 319–325. [Google Scholar] [CrossRef]
- Li, D.H.; Peng, Q.Y.; Lu, G.Y.; Wang, K.; Wu, Z.Y. Control Method for Passenger Inflow Control with Coordination on Urban Rail Transit Line in Peak Hours. J. Transp. Syst. Eng. Inf. Technol. 2019, 19, 141–147. [Google Scholar] [CrossRef]
- Feng, S.M.; Chen, Y.; Xin, M.W. Coordination passenger flow control model for metro under sudden large passenger flow. J. Harbin Inst. Technol. 2019, 51, 179–185. [Google Scholar]
- Huan, N.; Zhang, J.M.; Yao, E.J. Coordinated optimization model for passenger flow control in metro network considering both efficiency and equity. J. Southeast Univ. (Nat. Sci. Ed.) 2020, 50, 1148–1155. [Google Scholar] [CrossRef]
- Li, X.; Bai, Y.; Su, K. Collaborative passenger flow control of urban rail transit network considering balanced distribution of passengers. Mod. Phys. Lett. B 2021, 35, 2150461. [Google Scholar] [CrossRef]
- Xu, X.; Li, H.; Liu, J.; Ran, B.; Qin, L. Passenger flow control with multi-station coordination in subway networks: Algorithm development and real-world case study. Transp. B Transp. Dyn. 2019, 7, 446–472. [Google Scholar] [CrossRef]
- Shi, J.G.; Yang, J.; Yang, L.X. Safety-oriented Cooperative Passenger Flow Control Model in Peak Hours for a Metro Line. J. Transp. Syst. Eng. Inf. Technol. 2019, 19, 125–131. [Google Scholar] [CrossRef]
- Karlo, B.; Luka, N. Modelling of Driver and Pedestrian Behaviour—A Historical Review. Promet-Traffic Transp. 2020, 32, 727–745. [Google Scholar] [CrossRef]
- Shuaib, M.; Zainuddin, Z. An Investigation Capability Model for Bidirectional Pedestrian Flow. Mod. Appl. Sci. 2015, 9, 88. [Google Scholar] [CrossRef]
- Baee, S.; Eshghi, F.; Hashemi, S.M.; Moienfar, R. Passenger Boarding/alighting Management in Urban Rail Transportation. Jt. Rail Conf. JRC 2012, 44656, 823–829. [Google Scholar] [CrossRef]
- Davidich, M.; Geiss, F.; Mayer, H.G.; Pfaffinger, A.; Royer, C. Waiting zones for realistic modelling of pedestrian dynamics: A case study using two major German railway stations as examples. Transp. Res. Part. C Emerg. Technol. 2013, 37, 210–222. [Google Scholar] [CrossRef]
- Hoogendoorn, S.P.; Daamen, W. Design Assessment of Lisbon Transfer Stations using Microscopic Pedestrian Simulation. WIT Trans. Built Environ. 2004, 74. [Google Scholar]
- Xu, X.Y.; Liu, J.; Li, H.Y.; Jiang, M. Capacity-oriented passenger flow control under uncertain demand: Algorithm development and real-world case study. Transp. Res. Part. E-Logist. Transp. Rev. 2016, 87, 130–148. [Google Scholar] [CrossRef]
- Yoo, S.; Kim, H.; Kim, W.; Kim, N.; Lee, J. Controlling passenger flow to mitigate the effects of platform overcrowding on train dwell time. J. Intell. Transp. Syst. 2022, 26, 366–381. [Google Scholar] [CrossRef]
- Ding, H.; Di, Y.; Zheng, X.; Liu, K.; Zhang, W.; Zheng, L. Passenger arrival distribution model and riding guidance on an urban rail transit platform. Phys. A Stat. Mech. Its Appl. 2021, 571, 125847. [Google Scholar] [CrossRef]
- Hao, S.; Song, R.; He, S. Collaborative passenger flow control optimization of urban rail transit network based on sliding window mechanism. Appl. Math. Model. 2023, 124, 639–660. [Google Scholar] [CrossRef]
- Chen, Z.Y.; Gan, J.R.; Wang, X.J. Three-level passenger flow control model for urban rail transit in consideration of safety. J. Cent. South Univ. (Sci. Technol.) 2020, 51, 1441–1450. [Google Scholar] [CrossRef]
- Shi, J.G.; Qin, T.; Li, X.; Yang, L.X.; Yang, X.G. Train Capacity Allocation Strategy and Optimization Model for an Oversaturated Metro Line. J. Transp. Syst. Eng. Inf. Technol. 2022, 22, 112–119+131. [Google Scholar] [CrossRef]
- Yang, R.; Zhou, W.; Han, B.; Li, D.; Zheng, B.; Wang, F. Research on Coordinated Passenger Inflow Control for the Urban Rail Transit Network Based on the Station-to-Line Spatial-Temporal Relationship. J. Adv. Transp. 2022, 2022, 8895935. [Google Scholar] [CrossRef]
- Shi, J.G.; Xiao, X.F.; Guo, J.H.; Dong, H. Model and algorithm of multi-station cooperative passenger flow control in metro system under the background of epidemic prevention and control. China Railw. Sci. 2023, 44, 187–199. [Google Scholar]
- Li, C.L.; Qiu, W.Y.; Xu, X.F. Calculation Method of Peak Passenger Arrival Rate inside Subway Station Facilities. Urban. Mass. Transit. 2020, 23, 83–86. [Google Scholar] [CrossRef]
- Zhang, D.Z.; Luo, X.Y.; Li, X.; Wang, Y.K. Optimization of logistics network for railway construction waste slag recycling inmountainous areas under seasonal transportation fluctuations. J. Railw. Sci. Eng. 2025, 22, 89–101. [Google Scholar]


Disclaimer/Publisher’s Note: The statements, opinions and data contained in all publications are solely those of the individual author(s) and contributor(s) and not of MDPI and/or the editor(s). MDPI and/or the editor(s) disclaim responsibility for any injury to people or property resulting from any ideas, methods, instructions or products referred to in the content. |
© 2025 by the authors. Licensee MDPI, Basel, Switzerland. This article is an open access article distributed under the terms and conditions of the Creative Commons Attribution (CC BY) license (https://creativecommons.org/licenses/by/4.0/).