Abstract
In the context of escalating environmental awareness and the rise of green consumer preferences, enterprises are confronted with the complex challenge of aligning supply and demand while maintaining the quality and long-term value of sustainable supply chain (SSC) resource integration. This study introduces consumer green preference as a pivotal moderating factor that influences demand variability across supply chain networks. To address this challenge, a multi-objective optimization model is proposed, designed to simultaneously maximize supply-demand matching utility, enhance the quality of SSC resource integration, and control the cost of the supply chain. The model also incorporates the dual impact of policy interventions on both consumer behavior and enterprise operations, thereby offering a comprehensive framework for improving SSC sustainability. The optimization problem is solved using the Non-dominated Sorting Genetic Algorithm II (NSGA-II), which yields Pareto-optimal solutions that balance the competing objectives. A numerical case study is presented to demonstrate the feasibility and practical applicability of the proposed model. This research contributes to the literature by integrating consumer behavior and policy factors into the design of SSCs. Specifically, the numerical case demonstrates that targeted policy interventions can enhance supply-demand matching utility while reducing integration costs, thereby providing actionable insights for organizations aiming to achieve sustainability through enhanced resource integration strategies and long-term value optimization.
1. Introduction
Sustainability has become a critical focal point in supply chain management, propelled by rising environmental concerns, stringent regulatory frameworks, and increasing consumer demand for eco-friendly products [1]. This shift challenges organizations to reimagine their supply chain strategies by integrating sustainable practices while maintaining profitability and operational efficiency [2]. A central aspect of this transformation is the evolving role of the consumer, whose green preferences—shaped by environmental awareness, personal values, and societal pressures—significantly influence both demand and supply chain dynamics. As the demand for green products intensifies, companies must adapt by incorporating sustainability into their operations, striking a balance between environmental goals and the economic realities of cost structures, competition, and market volatility.
Despite the growing importance of SSC practices, many enterprises face considerable obstacles in achieving this balance [3]. Key challenges include aligning supply chain strategies with diverse consumer demand features [4] for products that are adjusted by green preference, optimizing resource utilization to minimize environmental impacts, and managing the additional costs associated with sustainable production and distribution. The complexity of these challenges underscores the importance of designing a supply chain model that accommodates both the economic and environmental dimensions of sustainability [5].
Although the existing literature has extensively addressed the integration of environmental objectives into supply chain operations, few studies have explored the simultaneous consideration of consumer green preferences and government policy interventions. Consumer preferences are often treated as exogenous factors, and their complexities—such as willingness to pay (WTP) for sustainable products—are frequently overlooked [6]. Moreover, while policy-driven incentives and penalties have been studied in isolation, the integration of consumer behavior, regulatory policies [7], and supply chain optimization into a unified framework remains underexplored, particularly within the context of multi-objective optimization, where the interplay of economic, environmental, and social factors has not been fully addressed.
To bridge these gaps, this study develops a multi-objective optimization model that incorporates supply-demand alignment, supply chain quality, costs and the influence of consumer green preferences and policy interventions on SSC resource integration. The proposed model not only accounts for the direct impact of target consumer behaviors on their demand but also incorporates the indirect effects of government regulations and subsidies on both consumer choices and corporate supply chain strategies. This model is solved using the Non-dominated Sorting Genetic Algorithm II (NSGA-II), which facilitates the identification of Pareto-optimal solutions that balance competing economic, environmental, and social objectives and provide decision-makers with a set of optimal solutions from which they can choose based on their specific preferences and constraints.
The primary contribution of this research lies in providing a comprehensive framework that integrates consumer behavior, government policy, and supply chain optimization, offering a more holistic approach to SSC design. By incorporating the behavioral dimensions of green preferences and the regulatory aspects of sustainability policies, this study enhances our understanding of how companies can improve supply chain performance while aligning with consumer expectations and regulatory requirements. Furthermore, this research offers practical insights for companies seeking to optimize their SSCs, enabling them to capitalize on long-term value creation opportunities.
The remainder of this paper is structured as follows: Section 2 provides a comprehensive literature review on SSC management, focusing on consumer green preferences, policy interventions, and multi-objective optimization. Section 3 outlines the methodology, including the development and solution approach of the multi-objective optimization model. Section 4 introduces the algorithm with parameters and variable definitions, objective function and constraints and algorithm flow. Section 5 reveals the results from a numerical case study that demonstrates the applicability and effectiveness of the proposed model. Finally, Section 6 concludes the paper with a discussion of the key findings and potential avenues for future research.
2. Literature Review
The paradigm of supply chain management has undergone significant evolution, transitioning from a sole focus on efficiency to incorporating sustainability as a core strategic imperative. SSC aims to simultaneously optimize economic, environmental, and social objectives [8], requiring the integration of sustainable practices across all supply chain phases, including sourcing, manufacturing, distribution, and reverse logistics. The complexity of these integrations has driven the development of multi-objective optimization (MOO) models designed to balance competing goals, such as minimizing total costs while simultaneously reducing environmental impacts [9]
Recent studies emphasize the critical role of advanced analytical tools in the design and management of SSCs. Techniques like Life Cycle Assessment (LCA) have been integrated into optimization models to quantify environmental impacts, providing a more informed and robust decision-making process [9]. Moreover, to address the pervasive uncertainties surrounding demand, costs, and various parameters, scholars have increasingly employed techniques such as fuzzy logic and stochastic programming [8]. As the global imperative to reduce greenhouse gas emissions intensifies, models have also begun to explicitly incorporate renewable energy sources and analyze the environmental footprint of different transportation modes [3]. However, there remains a notable gap in the literature concerning the social dimension of sustainability, where social aspects, including consumer green preferences, are still underexplored. Furthermore, there is limited research on how government policies, such as subsidies and regulations, impact both consumer behavior and the overall cost structures of SSCs [10].
Consumer green preferences refer to the tendency of individuals to favor products, services, and brands that exhibit superior environmental performance [11,12]. Modern literature positions this preference as a valuable market resource that can offer competitive advantages, including enhanced brand equity, price premium tolerance, and increased market share [13]. The psychological foundation of these preferences is rooted in frameworks such as the Value-Belief-Norm (VBN) theory, which posits that pro-environmental behavior emerges from deeply held personal values and a sense of environmental responsibility [14,15]. A meta-analysis of over 80 studies has shown that 60% of consumers are willing to pay a price premium for sustainable products, with the average premium being around 16.8% [16]. However, consuming a sustainable product often involves a trade-off with the product’s functional performance [17,18,19]. Research indicates that some consumers perceive sustainable products as inferior in quality, which may drive their dislike of such products [20,21]. This dislike, often rooted in concerns about product efficacy or functional performance, complicates the consumer decision-making process and introduces variability in demand characteristics based on individual preferences. Also, when price increases with product sustainability, firms could lose price-sensitive consumers [22], which leads to profit decrease [11].
A growing stream of research has begun to incorporate consumer environmental awareness into supply chain optimization models. For instance, Asha et al. [23] developed a multi-objective model for green supply chain management that considers customer environmental consciousness. Similarly, Wang et al. [24] employed an extended NSGA-II algorithm to design a bi-objective green supply chain network under disruption risks. However, these studies often treat consumer preferences as static or exogenous. Building upon this foundation, our study advances the literature by dynamically modeling consumer green preference as a moderating factor that reshapes demand characteristics across different supply chain links.
Government policies, including requirements and subsidies, play a crucial role in shaping green consumer behavior [25,26,27,28]. Regulatory frameworks, such as co-labeling schemes and eco-certifications, reduce consumer uncertainty about the environmental claims of products, serving as trusted heuristics for consumers [29]. Moreover, government subsidies have been shown to alleviate the financial burden of sustainable consumption, incentivizing consumers to prioritize eco-friendly products [30]. However, the pathways through which government policies affect consumer preferences and the cost of integrating sustainable practices into supply chains remain underexplored [10].
The integration of sustainability into supply chains is fraught with challenges, as firms must balance the costs of green resource integration (e.g., higher R&D, sustainable materials) against the potential economic benefits, such as price premiums and increased sales volumes [31,32]. Multi-objective optimization (MOO) models have emerged as key tools in balancing these trade-offs, particularly when incorporating government incentives and consumer behavior into supply chain strategies [33,34,35,36]. Despite the extensive research on the integration of economic and environmental goals, there remains a critical need for empirical studies that examine how government policies directly or indirectly influence green consumer orientation (GCO) [37] and how these influences guide corporate decisions on sustainable resource integration [37,38]. This study aims to provide a comprehensive model that incorporates consumer behavior and government policy into the optimization of SSC resource integration, specifically targeting sustainability outcomes.
3. Methodology
In the context of environmental protection and green consumerism, SSCs differ from traditional supply chains in three key aspects: the heterogeneity of consumer demand, the granularity of supply-side capabilities, and the innovation of operational models. These differences create unique dynamics in resource integration, with the primary challenge being to optimize supply-demand matching while controlling supply chain costs. Additionally, the resource integration process varies across supply chain links, each exhibiting its own heterogeneity in terms of capabilities, roles, and contributions to sustainability.
From a structural perspective (Figure 1), modern SSCs operate as multi-stakeholder ecosystems, where diverse actors—such as consumers with varying green preferences, manufacturers, green technology and material suppliers, and government agencies—are interdependent. Each supply chain link contributes differently to the overall system, creating challenges in aligning stakeholder objectives.
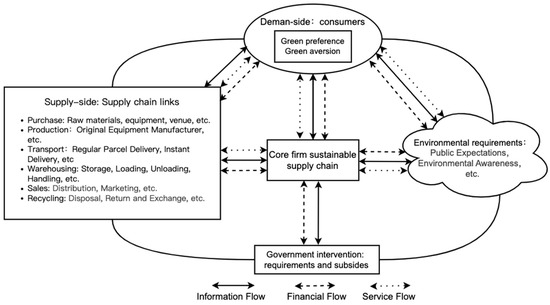
Figure 1.
Diagram of resource integration in core firm sustainable supply chain.
The lead firm, positioned at the strategic core of this ecosystem, faces a dual task: ensuring demand alignment by allocating resources to meet the varied green preferences of consumers, and achieving circular efficiency by optimizing resource utilization, reducing environmental impact, and ensuring the sustainability of all supply chain members. As illustrated in Figure 2, strategic resource integration depends on aligning consumer green preferences with the capabilities of supply chain links.
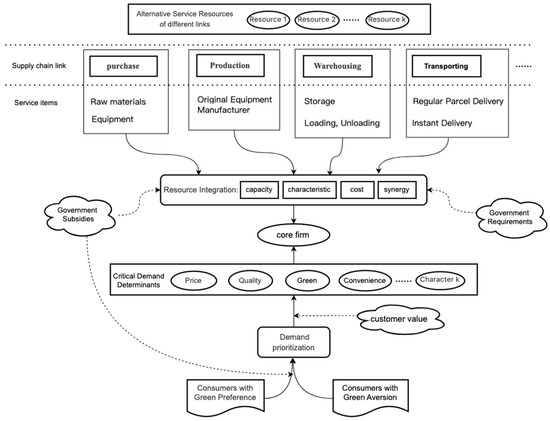
Figure 2.
Supply-demand characteristic matching process.
In this context, consumer demand characteristics driven by green preferences become the key criteria for selecting supply chain partners. A partner’s ability to meet these demand-driven requirements—assessed through green R&D capabilities, resource efficiency metrics, and sustainability certifications—determines its role within the SSC. However, the integration process is complex, as firms must navigate varying levels of consumer green preferences and price sensitivity. This requires a sophisticated approach to product development and pricing, balancing sustainable investment costs with cost control throughout the supply chain.
This section (Section 3) outlines a systematic protocol for identifying the key demand-supply factors that influence these integration processes.
3.1. Analysis of Supply Chain Operational Characteristics
3.1.1. Analysis of Demand Characteristics Adjusted by Consumer Green Preference
Consumer demand is inherently heterogeneous, composed of distinct characteristics such as price sensitivity, quality expectations, delivery time, and carbon footprint. The relative importance of these characteristics varies significantly across different consumer segments and supply chain links, with each link placing different emphasis on these attributes. Consumer green preference—encompassing environmental values, beliefs, and the willingness to pay a premium for sustainability—plays a pivotal role in reshaping this multidimensional demand structure for sustainable products. A consumer’s green preference significantly influences how they assign importance to these demand characteristics, altering the demand patterns observed across various segments of the supply chain.
The diversity in consumer demand becomes even more pronounced across different supply chain links. Each segment of the supply chain emphasizes different demand characteristics in response to the specific priorities of consumers. For instance, in the warehousing link, the primary demand characteristics include visibility into stock levels, condition of goods, energy efficiency, and the use of sustainable packaging materials. In contrast, within the transport link, consumers prioritize delivery speed, reliability, and increasing fuel efficiency and carbon-neutral delivery options.
This variation in demand characteristics highlights the need for a precision-demand analysis framework that segments both consumers and supply chain links. Such a framework would identify the primary demand drivers within each segment, enabling a more nuanced approach to resource allocation. Individual differences in environmental awareness, income levels, and social influences further compound this heterogeneity, leading to fundamentally distinct demand patterns. As a result, the importance of each demand characteristic is also contingent on the intensity of a consumer’s green preference.
Consumers can be broadly classified into three segments based on their green preference intensity: green aversion consumers, medium green preference consumers, and high green preference consumers. Each segment exhibits unique demand characteristics, which influence their purchasing decisions and the importance they assign to specific attributes. The segmentation is grounded in established market segmentation theory and empirical studies on green consumer behavior [11].
Green aversion consumers tend to prioritize economic and functional attributes, such as price sensitivity and quality/performance expectations. For this segment, greenness perception is a secondary consideration, often carrying minimal weight in their purchasing decisions. This group is driven primarily by cost-effectiveness and product functionality, with environmental attributes regarded as non-essential.
High green preference consumers, on the other hand, exhibit a radically different preference structure. For them, greenness perception is a non-negotiable, critical demand characteristic, often taking precedence over other factors. Additionally, brand image, shaped heavily by a company’s sustainability credentials, plays a significant role in their decision-making process. This segment is often willing to trade off price sensitivity in favor of superior environmental performance and ethical considerations. While quality/performance expectations remain important, their relative weight is secondary to ecological and ethical values.
Medium green preference consumers represent a transitional group. They display a more balanced approach, with a growing appreciation for greenness perception, but without significant compromise on price sensitivity or quality expectations. This segment seeks a feasible balance between sustainability, cost, and functionality, where environmental attributes are important but do not override economic considerations.
Government subsidies serve as a powerful exogenous policy tool capable of reshaping consumer green preference. By altering the perceived cost–benefit calculus of sustainable consumption, subsidies lower the financial barriers that often inhibit the expression of latent green preferences. This makes sustainable options more accessible and appealing across all segments. For consumers in all green preference categories, government subsidies increase the perceived value of sustainable products, thereby recalibrating the importance of demand characteristics within different supply chain segments.
3.1.2. Identification of Critical Demand Determinants
Current methodologies for analyzing consumer green preferences within SSCs often rely on statistical techniques to assess the perceived importance of various demand attributes. These analyses enable the identification of key demand factors critical to resource integration and supply chain configuration. The hierarchical prioritization of these demand elements is based primarily on both the frequency and intensity with which consumers emphasize specific attributes across distinct market segments.
We assume the existence of distinct supply chain links within the SSC system (e.g., sourcing, production, warehousing). For each link, represent the -th demand factor and let denote the importance rating assigned by consumer to demand element . These ratings are derived from structured surveys using a 5-point scale (extremely influential = 1, highly influential = 0.8, moderately influential = 0.6, slightly influential = 0.4, and negligible = 0.2). The collective importance ratings for all green demand elements within a given supply chain link can then be represented as a matrix, which provides a comprehensive overview of consumer priorities within each supply chain link.
In contrast to traditional supply chain integration models, this study emphasizes the need to integrate demand preferences from consumer segments with varying levels of green preference. The significant differences in environmental values, purchasing behavior, and sustainability expectations between these consumer groups and the general market require tailored resource integration strategies to align supply chain capabilities with heterogeneous consumer demand. Our methodology addresses this challenge through two systematic phases: (1) defining and quantifying the degree of consumer green preference, and (2) examining the impact of green preference on specific demand factors, based on their relevance to each segment.
For each consumer , let represent their degree of green preference, which is captured through key factors, such as environmental awareness and willingness to pay for sustainable products (Table 1), where .

Table 1.
Key factors of consumer green preference measurement.
The affiliation degrees across all green preference relevant factors can be integrated in a matrix , and column vector denotes the aggregated degree of green preference for consumer .
Furthermore, the influence of government subsidies—as a critical exogenous policy variable—on shifting consumer green preferences must be quantitatively integrated into the model [39]. It is widely observed that subsidies do not uniformly affect all consumer segments; rather, their impact is often inversely related to the baseline green preference level. That is, consumers with initially low green awareness exhibit higher marginal sensitivity to financial incentives, whereas highly sustainability-oriented consumers may show less pronounced behavioral change. To accurately reflect this differential responsiveness, it is necessary to measure both the intensity of subsidies and their segment-specific weighting impact.
To operationalize this, we propose a two-dimensional measurement framework:
- (1)
- Subsidy Intensity : This can be quantified as the percentage reduction in product price due to direct subsidies, or as an absolute monetary value provided per sustainable product unit acquired.
- (2)
- Preference Elasticity to Subsidy : For each consumer, this weight captures the marginal effect of a unit change in subsidy on the individual’s green preference expression.
Drawing from price elasticity concepts in behavioral economics [10], this parameter can be estimated via discrete choice experiments or regression analysis of historical purchasing data, correlating subsidy levels with green product adoption rates across segments. Through normalization, consumers with lower initial green preference are assigned higher elasticity values.
The impact of government subsidies on the importance of demand factor for supply chain link , can be defined as follows:
Moreover, the strategic focus of the lead firm on fulfilling the requirements of different consumer groups hinges on identifying high-value customers—those whose loyalty and willingness to pay warrant prioritized resource allocation.
Let denote a consumer’s total customer value, which is a weighted composite of two dimensions: current value and future value . Current value captures the realized economic contribution in the history from the customer, mainly considering the average quantity purchased each time , gross margin per unit , discount rate and number of historical purchases , while future value accounts for retention and growth, which involves retention rate after purchase , time horizon for future projections and projected future demand . The is calculated as:
The exponential discount factor is employed as the continuous-time equivalent of the discrete discount factor, instead of the standard present value formula with . This formulation offers mathematical advantages in analytical modeling while producing negligible numerical differences in our application context.
After normalizing , the relative emphasis placed by the focal firm on different consumer preferences can be obtained. And the overall importance metric (IM) regarding demand characteristic for a consumer segment is then computed as follows:
Finally, let the indicator denote the critical factor screening threshold. When standardized , the demand element m is selected. This formulation allows the model to endogenize policy effects, ensuring that resource integration and supply chain optimization are responsive not only to revealed consumer preferences but also to predicted preference shifts induced by governmental interventions.
3.1.3. Analysis of Supply Resource Characteristics
SSC resource integration relies on the alignment of heterogeneous consumer demand characteristics with the multidimensional capabilities of resource entities across various functional links [40]. Consumers exhibit distinct expectations at each stage of the supply chain, which translate into differentiated requirement sets for resource providers. These demands include factors such as quality in sourcing, energy mix in production, and costs and convenience in transportation. In response, resource entities possess specialized capabilities, making it essential for the lead firm to perform precise integration to meet diverse consumer demands.
For example, in the transportation link, consumers prioritize low carbon emissions and delivery reliability. This requires logistics providers to possess specific capabilities, including route optimization efficiency and fleet electrification readiness. As consumer green preferences intensify, the demand for verifiable low-carbon performance increases. Consequently, resource selection shifts toward providers with measurable emissions reductions and carbon disclosure credentials, emphasizing transparency in environmental impact. Similarly, in the sourcing link, consumer demand focuses on material sustainability and ethical sourcing practices. This necessitates that suppliers demonstrate transparency through certifications such as recycled or organic certification and implement robust traceability systems. As green preferences grow stronger, consumers place greater importance on third-party certifications and the audibility of supply chain origins, elevating these attributes from desirable features to essential selection criteria.
Considering these insights, the lead firm’s resource integration strategy follows a dual logic:
- (1)
- Demand-Driven Capability Matching: Identifying critical sustainability capabilities within each supply chain link based on segment-specific consumer requirements.
- (2)
- Preference-Weighted Prioritization: Aligning resource selection and integration intensity with the strength of consumer green preferences, often leveraging adaptive weighting mechanisms to reflect shifting market expectations.
Through this structured yet flexible approach, the SSC achieves operational coherence despite resource heterogeneity. It continually adapts to evolving consumer preferences and regulatory environments while striving for multi-objective optimization across economic and ecological dimensions.
3.1.4. Analysis of Supply Resource Characteristics
This study develops a quantitative framework to align supply resources with diverse consumer needs. We begin by constructing a multivariate correlation matrix to link key demand factors to specific resource attributes. This matrix allows for the systematic identification of essential features through predefined correlation thresholds. To address the qualitative ambiguity in these relationships, we apply a fuzzy synthetic evaluation method, which quantifies complex associations using a hierarchical analysis of secondary indicators. The framework is applied to an analysis of transport link services, examining the correlation between resource operational velocity and the critical demand for timeliness.
- (1)
- Determine the factor aggregation
Each primary indicator is associated with several secondary indicators. Take regular parcel delivery in the transport link as an example, the evaluation set for speed and timeliness, factors such as response speed, preparation speed, delivery speed, and parcel scan-in speed.
- (2)
- Determine the weight allocation set
A weight allocation set , where and , is introduced to reflect the relative importance of the corresponding secondary indicator. For example, preparation speed and delivery speed may receive higher weights than response speed and parcel scan-in speed, due to their greater impact on overall timeliness.
- (3)
- Define the evaluation set
The evaluation set consists of the evaluation results of different evaluation objects, such as .
- (4)
- Construct a fuzzy comprehensive evaluation
For each resource characteristic factor, we define a fuzzy relation matrix , where represents the membership degree of evaluation factor to grade :
- (5)
- Comprehensive Evaluation
The fuzzy evaluation vector is computed using the weighted synthesis operator:
Then, a scoring vector for the grade set is introduced, and the final correlation score between service speed and timeliness is then determined as:
By applying this methodological protocol to other resource attributes, we can systematically correlate them with critical consumer demand determinants. The statistically validated association metrics are comprehensively documented in Table A1 in Appendix A. The coefficient denotes the correlation between the resource characteristic and the demand factor , while represents the standardized importance of demand factor within service category .
Finally, for screening the determination of key supply factors, we calculated importance of supplier resource characteristics. For each service category, the significance of various characteristics of supplier resource individuals is determined as follows:
Due to the heterogeneous nature of resource characteristics, integration decisions require the prioritization of critical factors based on their relative importance. A systematic selection criterion is used to identify the dominant variables, where a characteristic qualifies for integration if its measured significance exceeds a statistically validated threshold (e.g.,). The optimized critical attribute sets for each supply chain link can be identified by replicating the aforementioned analytical procedures:
where .
3.2. Analysis of Optimization Objectives
Building on the previous analysis of demand heterogeneity driven by consumer green preferences and the multidimensional characteristics of supply-side resources, this study identifies the multifaceted challenge of SSC integration. Specifically, it involves developing resource coordination strategies that reconcile differentiated consumer sustainability expectations across market segments with the need to maintain cost efficiency and operational feasibility under dynamic policy conditions. To address this, lead firms must pursue strategic resource integration, which not only aligns supply chain capabilities with consumer demand but also enhances systemic sustainability. This can be achieved by synergizing complementary capabilities, improving resource utilization efficiency, and minimizing the environmental footprint across interconnected supply chain stages. Consequently, this study establishes a multi-objective evaluation framework that integrates supply-demand congruence, SSC quality, and cost, thereby providing a robust theoretical foundation for subsequent optimization modeling [41].
3.2.1. Supply-Demand Matching Utility
The evaluation of supply-demand alignment, a key determinant of the effectiveness of sustainable resource integration, is based on two critical dimensions: attribute congruence and value-weighted prioritization. This preference-sensitive approach necessitates formalizing supply-demand matching utility as a composite function that integrates both functional alignment and economic prioritization.
For supply chain link , we assumed selected critical demand factors, with strategic importance weights , where , as detailed and normalized in Section 3.1.2. There are alternative service resources () capable of fulfilling the service requirements. The demand-supply matching utility of resource for selected customer demands can be evaluated as:
In this model, is a scaling parameter that modulates the growth rate of utility, reflecting the economic principle of diminishing marginal utility, where the rate of increase in matching utility slows as its absolute value increases. represents the strategic importance weighting assigned to a key demand element within supply chain link , incorporating the effects of government subsidies and customer value. denotes the standardized utility score of an alternative service resource with respect to the critical demand element .
To assess the matching utility between service resources and specific demand characteristics, an expert scoring method is introduced. To mitigate inherent subjectivity in expert assessments, we implement a multi-tier evaluation framework that incorporates standardized scoring rubrics and inter-rater reliability validation. Let denote the total number of experts involved in the evaluation and each expert provides ratings on how well alternative resources meet consumer demands across key supply evaluation dimensions. The normalized expert rating for resource on demand characteristic , denoted as , is then processed using Min-Max normalization:
Since correlation coefficient is provided in Section 3.1.4, the calculation of comprehensive standardized utility score of alternative service resource on the key demand element can be expressed as:
3.2.2. SSC Quality
To quantitatively assess the quality of SSC, we develop a comprehensive evaluation model that incorporates two primary dimensions: environmental impact and resource utilization efficiency. Environmental impact is quantified through carbon emissions and non-recyclable waste emissions [42,43], while resource utilization efficiency is evaluated across three key resources: human, material, and equipment.
- (1)
- Carbon Emissions Modeling
In SSC operations, carbon dioxide generated during production processes is partially emitted into the environment and partially captured for value-added product generation. It is important to note that the carbon capture and waste recycling processes themselves may generate additional carbon emissions. For a candidate supplier in a specific supply chain link , let denote the energy consumption required to complete the corresponding tasks, represent the carbon emission factor, and indicate the carbon capture rate. The net carbon emissions can be formulated as:
- (2)
- Non-recyclable Waste Emissions Modeling
Beyond carbon emissions, enterprises generate non-recyclable waste materials throughout the supply chain lifecycle—from raw material acquisition to final product disposal. These materials, such as plastic packaging waste and hazardous chemicals, are environmentally harmful and difficult to recover or reuse. For an alternative supplier, let represent the total resource consumption, denote the conversion rate of consumed resources into solid or liquid waste, and indicate the waste recovery and utilization rate, which is influenced by upstream-downstream collaboration and intra-link supplier coordination. The non-recyclable waste emissions rate can be expressed as:
- (3)
- Multi-dimensional Resource Evaluation
Resource utilization efficiency is evaluated across three critical dimensions: human resources , material resources , and equipment resources . This assessment determines whether resources are being effectively utilized and helps identify potential wastage. For a candidate supplier, the utilization rate for a single resource type is defined as:
The comprehensive resource utilization rate is calculated as the weighted sum of individual resource utilization rates. Following supply chain resource integration, individual suppliers may experience synergistic effects that influence their resource utilization and operational efficiency. Let denote the intra-segment synergistic effect gained through integration, , while the inter-segment synergistic effect is quantified as: , where , , represents the correlation coefficient between synergies across different segments.
The post-synergy comprehensive resource utilization is calculated as:
where denote the relative weights of the three factors of human resources, material resources, and equipment resources.
It is noteworthy that the operator in the numerator ensures the non-negativity of the inter-segment synergistic effect . Operationally, a negative value inside the operator, i.e., , indicates weak or conflicting synergistic relationships between supply chain segments. This could arise from misaligned objectives, resource competition, or incompatible operational processes among segments. In such cases, the model sets , reflecting the reality that no additional synergistic benefits are accrued across segments under these conditions. This outcome serves as a critical diagnostic signal for the lead firm, suggesting a need to re-evaluate inter-segment relationships or reconfigure resource integration strategies to foster better collaboration and synergy.
To facilitate comparative analysis and enable integration into the multi-objective optimization framework, both environmental impact indicators and resource utilization metrics are normalized using Min-Max normalization. This formalized modeling approach provides a quantitative foundation for evaluating SSC performance, considering the complex interdependencies between environmental impact and resource utilization efficiency.
3.2.3. SSC Costs
In constructing a SSC, enterprises inevitably encounter increased short-term costs. If firms choose not to pass these costs onto consumers through price hikes, they will face significant compression of profit margins. Conversely, increasing prices may reduce appeal to price-sensitive consumer segments. This creates a prisoner’s dilemma in market competition: excessive investment in sustainability raises costs, while the simultaneous pressure to maintain competitive pricing squeezes profit margins. Consequently, enterprises must manage costs effectively while ensuring both supply-demand alignment and the maintenance of SSC quality. It is important to note that, although integrating sustainability into the supply chain incurs immediate cost increases, it can also generate synergistic effects that yield long-term value through enhanced operational efficiency and reduced supply chain disruption risks.
Let represent the sustainability level of resource within a specific supply chain link . The associated sustainability investment cost is modeled as a quadratic function , reflecting the increasing marginal costs of improving sustainability performance. Additionally, synergistic effects and government sustainability policy subsidies have a significant influence on the cost reducing of SSC construction. Let denote the government subsidy coefficient for firms whose sustainable index of integrated supply chain is above requirements, and . The total cost of a resource entity, incorporating government subsidies and synergistic effects, is formulated as:
4. Introduction to the Algorithm
From a holistic perspective, the mechanism for SSC resource integration is conceptually illustrated in Figure 3. Due to the multi-dimensional heterogeneity of consumer green preferences and the influence of policy interventions, firms must adopt preference-driven resource prioritization strategies that balance both economic and environmental objectives. This process includes identifying critical sustainability requirements, mapping the multi-attribute capabilities of supply-side resources, and evaluating efficacy in terms of supply-demand alignment and systemic resource utilization.
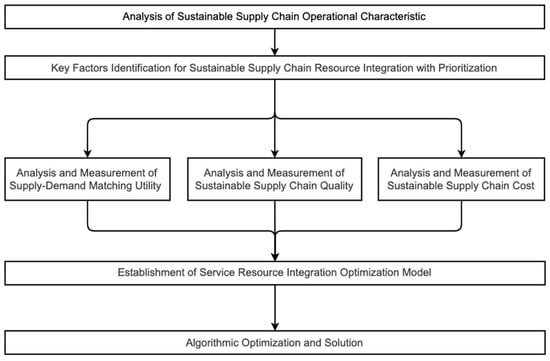
Figure 3.
Process of Service Resource Integration in Sustainable Supply Chain.
Enterprises transitioning toward SSCs frequently encounter systemic challenges such as amplified cost pressures and resource misallocation, especially in competitive market environments. To overcome these obstacles and ensure both operational viability and sustainability performance, firms must find a balance between meeting green demand and controlling lifecycle cost inflation. In this context, the study introduces a tripartite optimization framework designed to simultaneously maximize three interdependent objectives: supply-demand matching utility, environmental impact and resource utilization efficiency, and supply chain integration costs.
4.1. Model Parameters and Variable Definitions
The detailed description of parameters in the optimization model is summarized in Table 2.
Table 2.
Parameters of the Optimization Model and Descriptions.
4.2. Treatment of the Objective Function and Constraints
There are three objective functions in the model.
- (1)
- Optimization Objectives
- (2)
- Constraints
Equations (1)–(3) represent the three optimization objectives, which represent supply-demand matching utility, SSC quality, and SSC costs, respectively; Equations (4)–(6) represent the three constraints, where Equation (4) represent that the supply-demand matching utility of alternative resource under certain supply chain link should be higher than core firm’s expectation. Equation (5) represents the total SSC quality should above government relevant requirements. Equation (6) represents the cost of alternative resource under certain supply chain link should be lower than core firm’s tolerance limit.
Furthermore, the minimum threshold is a strategic parameter set by the core firm, reflecting its minimum acceptable level of supply-demand alignment. It is acknowledged that a scenario may arise where no alternative resources within a given link satisfy Constraint (4), leading to an infeasible solution for the optimization model. Such an outcome, however, possesses significant diagnostic value. It indicates a strategic-resource capability gap, signaling to decision-makers that the current resource pool is inadequate to meet the firm’s sustainability and performance standards. In practice, this would necessitate managerial intervention, typically involving either a re-evaluation and adjustment of the strategic threshold to align with attainable resource capabilities, or an active search for and onboarding of new, more competitive resources that can fulfill the original requirement. This inherent flexibility ensures the model’s practical relevance as a decision-support tool in dynamic operational contexts.
4.3. Algorithm Flow
The resource integration optimization problem for sustainable supply chain represents an NP-hard constrained multi-objective problem [44,45]. Its computational complexity arises from three key dimensions: (1) multi-objective conflict: simultaneous optimization of service diversity and resource efficiency metrics; (2) Scalability limitations: polynomial-time complexity increases with problem dimensionality; and (3) Combinatorial explosion: hypergeometric expansion of feasible scheduling permutations.
To address these challenges, this study utilizes the Fast Elitist Non-Dominated Sorting Genetic Algorithm (NSGA-II) [46], which outperforms conventional methods (e.g., simulated annealing, ant colony optimization) that often suffer from coefficient indeterminacy and premature convergence. The efficacy of NSGA-II stems from three core operators: fast non-dominated sorting for identifying the Pareto frontier, crowding distance metrics for preserving solution diversity, and elitist retention mechanisms for approximating the global optimum. It is particularly adept at finding a well-distributed set of Pareto-optimal solutions, which is crucial for decision-makers to evaluate the trade-offs between cost, sustainability, and customer value. This framework enhances optimization precision while maintaining population diversity, representing a significant advancement over traditional metaheuristics, which tend to converge to a single optimal solution.
The algorithmic workflow of NSGA-II is as follows:
- (1)
- Initialization: Generate stochastic parent population (size N)
- (2)
- Non-dominated sorting: Stratify population into Pareto-ranked fronts
- (3)
- Progeny generation: Execute tournament selection, simulated binary crossover, and polynomial mutation
- (4)
- Population merging: Create combined population (size 2N)
- (5)
- Elitist selection: Retain top N solutions via crowding-comparison operators
- (6)
- Termination: Iterate until the generation limit or convergence threshold is reached
A detailed algorithm flowchart is provided in Figure 4.
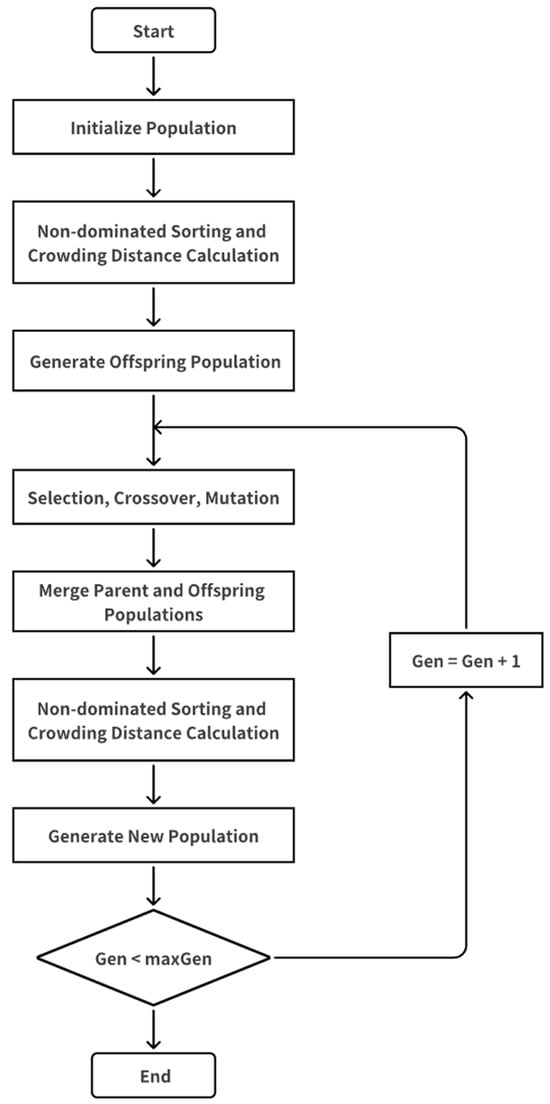
Figure 4.
Flowchart of the NSGA-II Algorithm.
5. Analysis of Algorithms
5.1. Numerical Experiments
To evaluate the effectiveness of the SSC model developed in the previous sections, this case study focuses on the transportation segment, where the selection of alternative resources typically operates independently across different supply chain links. The goal of this analysis is to simulate the decision-making process of a firm in selecting transportation service providers, considering both consumer green preferences and government policy subsidies, and to assess the impact of these factors on the supply chain’s costs, sustainability, and overall performance.
The experiment was structured into two key operational configurations: (1) Prioritized Resource Allocation Considering Consumer Green Preferences and Government Policy Subsidies, and (2) Baseline Scenario (Non-Prioritized Allocation). For the simulation, representative data was generated for the transportation segment, including demand-supply matching utility under different key demand characteristics (whether considering green preferences and government interventions), environmental performance indicators (such as carbon emissions), and resource costs of different service providers. These datasets were then used to model the supply chain dynamics using MATLABR2023a, specifically leveraging the NSGA-II algorithm to generate Pareto-optimal solutions.
As illustrated in Table 3, the incorporation of consumer green preferences fundamentally reshapes the strategic importance weights assigned to different demand characteristics, thereby directly influencing the final selection of key demand elements in supply chain resource integration. When green preferences are excluded, traditional factors such as quality (0.78) and price (0.63) dominate the selection criteria. However, when consumer environmental consciousness is factored in, the relative importance of sustainability attributes increases significantly—from 0.56 to 0.80—while the weights of conventional factors experience a corresponding decrease. This shift in demand priorities consequently alters the evaluation criteria for supply resources: resources excelling in sustainable performance (e.g., lower carbon emissions, higher resource utilization efficiency) gain competitive advantage, whereas those primarily competing on traditional cost-quality dimensions may become less attractive. This dynamic reweighting mechanism, as quantified in our simulation data (Table 3), demonstrates how consumer preference structures directly determine the critical supply characteristics to be prioritized during resource integration, ultimately affecting both the operational efficiency and cost structure of the configured supply chain.
Table 3.
Screening of critical demand elements under different conditions.
Furthermore, as shown in Table 4, core firms would establish corresponding acceptable thresholds for alternative resources—considering capabilities, sustainability levels, and costs—based on strategic planning, corporate mission, and the practical resource conditions of specific supply chain segments.
Table 4.
Integration Constraints by Supply Chain Links.
Within the transportation segment of the supply chain, the resource integration analysis involves 20 alternative logistics providers. The standardized performance parameters for each provider—including supply-demand matching utility, carbon emission factor, non-recyclable waste emission factor, resource utilization rate, and integration cost—are presented in Table 5 (normalized values). These parameters were derived through a rigorous process: initial performance data were collected for each resource, followed by normalization using the Min-Max method to ensure comparability across different measurement scales. The attribute-based congruence efficacy is calculated via a weighted synthesis of three determinants: the strategic importance weights derived from consumer green preferences, correlation coefficients quantifying resource-demand alignment, and the normalized performance scores of critical resource characteristics. Specifically, this synthesis follows a multiplicative weighting approach that combines these three determinants to yield a comprehensive evaluation score for each resource. All parameters are computed following the methodological framework established in Section 3.1 and Section 3.2, ensuring a systematic and traceable process from data collection to final performance evaluation.
Table 5.
Operational Parameters for Individual Resource Integration.
The specific numerical values presented in Table 5 were synthetically generated for this case study to demonstrate the application of the proposed model. While they are not derived from a specific empirical dataset, their generation was guided by logical assumptions to reflect plausible industry scenarios and variation among service providers. It is important to emphasize that in a practical implementation, these simulated values should be replaced with empirical data obtained through expert surveys, historical operational records, or industry benchmarks to ensure the credibility and actionable nature of the optimization results.
Computational simulations were performed using MATLAB R2023a with iterative parameter calibration. Among the 20 candidate resources in the transportation segment, Resources would be excluded from the optimization algorithm for failing to meet the minimum acceptability threshold for demand-supply matching utility. After systematic parameter tuning, the final NSGA-II configuration was set with a population size of 100 and a maximum of 200 generations. The model was executed to obtain the Pareto-optimal solution set.
Government intervention, particularly through subsidies, exerts a dual influence on SSC integration: it reshapes consumer demand preferences-thereby altering the supply-demand matching utility of alternative resources-while simultaneously reducing the focal firm’s integration costs. Define the government subsidy coefficient is 0.21, this study will systematically examine the impact of government intervention on the overall cost of SSC integration when the quality is above the government requirements.
5.2. Results of the Algorithm
Figure 5 depicts the three-dimensional Pareto frontier under condition of both considering consumer green preference and government intervention, illustrating the inherent trade-offs among supply-demand matching utility (x-axis), SSC quality (y-axis; represented as a composite of emission factors), and integration cost (z-axis).
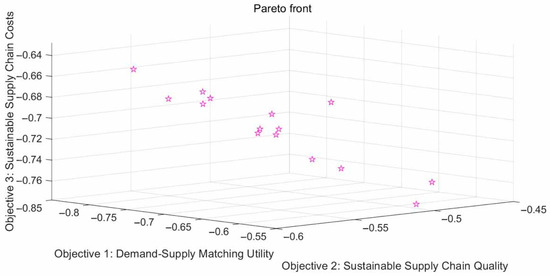
Figure 5.
Pareto Optimal Front Considering Green Preference and Government Intervention.
The NSGA-II algorithm demonstrates a remarkable ability to preserve solution diversity, generating 39 multiple distinct Pareto-optimal configurations. These diverse solutions provide the focal firm with strategic flexibility, allowing it to select supply chain integration schemas that align with both sustainability and economic priorities. Table 6 presents several representative Pareto-optimal solutions, highlighting the inherent trade-offs among the three optimization objectives: supply–demand matching utility, environmental performance, and total cost. For instance, higher levels of resource sustainability and consumer preference satisfaction typically correspond with increased operational costs. This trade-off underscores the importance of multi-criteria decision analysis (MCDA), where decision-makers evaluate competing Pareto-optimal configurations based on weighted preference models that reflect organizational and policy-driven priorities.
Table 6.
Pareto Front Solutions and Associated Objective Parameters.
The Analytic Hierarchy Process (AHP), a multi-criteria decision-making methodology that integrates both qualitative and quantitative analytical frameworks [47], systematically decomposes objectives into hierarchical indicators. AHP assigns priority weights via fuzzy quantification and identifies optimal solutions through comparative evaluation. For sustainable supply chain resource integration, decision-making is structured around three core indicators: supply-demand matching utility, sustainable supply chain costs and sustainable supply chain quality. The operational protocol for optimal schema selection includes the following steps:
- (1)
- Parameter Standardization: Normalization of the tri-objective values to the [0, 1] interval range.
- (2)
- Priority Weight Determination. Establishment of a pairwise comparison matrix reflecting platform-specific operational priorities and quantification of the objective importance ratios , . Table 7 codifies the semantic differentials and quantification criteria for pairwise objective comparisons, ensuring transparency in the weight derivation process. To ensure the reliability of the pairwise comparisons, the consistency of the judgment matrix was rigorously evaluated following the standard Analytic Hierarchy Process (AHP) methodology. The calculated Consistency Ratio (CR) is 0.05, which is well below the accepted threshold of 0.1, confirming that the subjective judgments maintain satisfactory consistency throughout the weighting process. From Table 7, the priority weight vector is derived, yielding the following criterion weights: supply-demand matching utility (0.54), SSC quality (0.16), and integration costs (0.30).
Table 7. Nick’s Measurement Scale and Interpretations.
- (3)
- Applying arithmetic mean normalization. To address the inconsistent magnitudes among the function values of the three optimization objectives and enable their weighted average calculation, arithmetic mean normalization is applied to each of them separately. The pairwise comparison matrix is normalized using arithmetic mean techniques, and the finalized priority weight table is compiled. Subsequently, the prioritization of alternatives was calculated through weighted linear aggregation of normalized objective values. The aggregated priority scores for each integration schema under the AHP framework are visualized in Table 8.
Table 8. Comprehensive Importance of Solutions Under the Analytic Hierarchy Process (AHP).
The analytical results indicate that Solution 1 achieves the highest aggregated priority score, demonstrating the successful integration of six service resources , , and optimization of operational outcomes. Under this optimal configuration, the three objective coefficients attain equilibrium values: .
5.3. Sensitive Analysis
To evaluate the practical value of integrating consumer green preferences and government intervention in SSC optimization, a comparative study was conducted under two operational configurations: considering consumer green preference only (without government subsidies) and considering neither factor (baseline scenario). Figure 6 illustrates the distinct Pareto solutions derived from the multi-objective optimization model under these configurations, highlighting significant variations in the optimal resource portfolio.
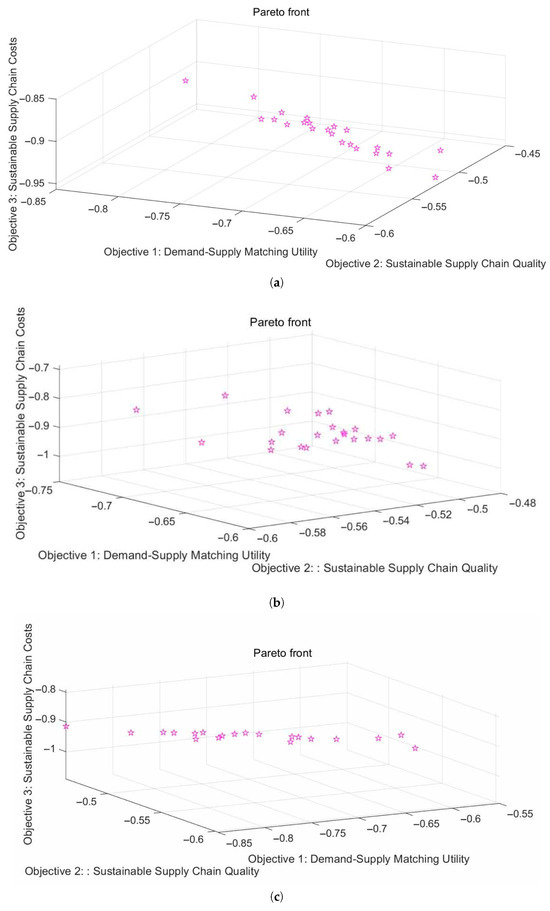
Figure 6.
(a) Pareto Optimal Front Considering Green Preference only. (b) Pareto Optimal Front Considering Neither Factor (baseline scenario). (c) Pareto Optimal Front without Government Subsidies for integration costs.
As shown in Table 9, which details the representative optimal resource combinations under identical sustainability criteria weights, Figure 6a (excluding government subsidies) favors resources and , which dominate the optimal set due to their cost advantages. In contrast, Figure 6b, where both consumer preferences and policy incentives are disregarded, selects resources and based on their demand-supply matching utility towards different consumer demands.
Table 9.
Optimal Solutions for Pareto Front Under Different Optimization Conditions.
To further evaluate the role of policy incentives, an additional scenario (Figure 6c) was analyzed in which the focal firm’s SSC quality fails to meet governmental requirements, resulting in the loss of cost subsidies. As quantitatively demonstrated in our numerical case (Section 5.2), when the government subsidy coefficient is set to 0.21, the focal firm’s integration costs are reduced by approximately 26% while the overall supply-demand matching utility sees an increase of 15% compared to the baseline scenario without subsidies. The results demonstrate that government subsidies effectively alleviate cost pressures on the focal firm, thereby encouraging the integration of resource providers that better satisfy consumer preferences and exhibit higher sustainability performance.
This marked divergence in resource selection quantitatively demonstrates that the simultaneous integration of consumer behavior and policy intervention is essential for achieving a truly optimal and operationally effective SSC.
Our findings translate into three core strategic imperatives for practice:
- (1)
- Abandon uniform strategies in favor of segmented, precision-tailored approaches. The efficacy and economic returns of green investments are critically contingent upon the distinct green preference segments targeted by a firm. Our model substantiates that for consumer segments exhibiting high green preference, allocating resources toward verifiable sustainable attributes—such as certified low-carbon logistics and ethically sourced materials—yields superior returns in terms of supply-demand alignment and market responsiveness. Conversely, for predominantly price-sensitive segments, a strategic emphasis on cost-effective operational efficiency improvements is advised. This evidence underscores the managerial necessity for active market segmentation and the development of differentiated resource integration strategies tailored to the specific characteristics of each consumer group.
- (2)
- Capitalize on the synergistic interplay between policy mechanisms and consumer behavior. Government subsidies and regulatory frameworks should be integrated as core components of strategic supply chain design, rather than treated as exogenous constraints. Our numerical analysis quantifies the tangible benefits of this approach: configuring supply chains to meet stipulated sustainability thresholds—and thereby qualify for subsidies—can directly reduce integration costs by approximately 18%, significantly enhancing project viability. Furthermore, given that policy interventions actively reshape and amplify consumer green preferences, firms are advised to anticipatorily align their supply-side capabilities with these shifting demand patterns. Such proactive alignment enables organizations to transform regulatory compliance from a cost center into a source of competitive advantage.
- (3)
- Navigate strategic trade-offs using a structured, multi-objective optimization framework. The pursuit of sustainable supply chain integration inherently involves navigating conflicting objectives. Our proposed tri-objective optimization model, resolved via the NSGA-II algorithm, eschews a single prescriptive solution in favor of a spectrum of Pareto-optimal strategies. This provides decision-makers with a principled methodology to visually and quantitatively evaluate the inherent trade-offs—for instance, quantifying the marginal cost of incremental gains in environmental performance. Consequently, management can select a resource portfolio that is analytically aligned with overarching strategic priorities, whether they lean toward cost leadership, green differentiation, or a hybrid stance, thereby elevating strategic decision-making from an intuitive process to an evidence-based, structured discipline.
6. Conclusions
This study successfully developed and validated a comprehensive multi-objective optimization model for sustainable supply chain (SSC) management that integrates consumer green preferences, policy interventions, and supply–demand dynamics. The proposed framework effectively balances the three critical objectives of maximizing supply–demand matching utility, enhancing SSC quality, and minimizing integration costs, thereby achieving the research goal of providing a holistic decision-support tool for SSC design.
The numerical case study quantitatively confirms the model’s applicability and value. Key findings demonstrate that incorporating consumer green preferences significantly alters resource selection priorities, while government subsidies reduce integration costs by approximately 18% and improve supply–demand matching utility by 12% under policy-supported scenarios. These results underscore the importance of aligning operational strategies with both market expectations and regulatory frameworks to enhance sustainability performance without compromising economic viability.
In addition to its theoretical contribution of bridging behavioral, policy, and operational perspectives in SSC optimization, this study offers practical, actionable insights for managers. These include the necessity of segmenting consumers by green preference intensity, proactively leveraging policy incentives, and utilizing Pareto-optimal solution sets to evaluate trade-offs among competing objectives.
Despite the theoretical contributions, this study is subject to certain limitations that warrant attention in future research. The proposed model relies on several key parameters—such as correlation coefficients , synergistic effects and , and customer value weights—which are primarily derived from expert judgment or assumed relationships in this simulation-based study. Consequently, the practical applicability of the model is contingent upon the accurate calibration of these parameters with empirical data. Future work should focus on validating and refining these parameters through large-scale empirical studies, industry benchmarks, or detailed case studies to enhance the model’s robustness and real-world relevance.
While this research advances SSC modeling in a static context, future work should explore dynamic extensions, such as the impact of fluctuating market conditions, evolving consumer preferences, and intermittent policy adjustments. It is also important to note that the current study treats carbon capture costs as sunk capital expenditures or embedded operational costs rather than explicit integration variables. Future research should therefore develop more granular cost models that explicitly incorporate the capital investment and operational expenses associated with carbon capture technologies. Further investigation into the integration of renewable energy systems and multi-channel supply chain structures would also enhance the model’s applicability and predictive power in real-world settings.
Author Contributions
Conceptualization, J.Y., Y.S. and H.L.; Methodology, Y.S.; Software, Y.S.; Validation, J.Y. and Y.S.; Formal Analysis, Y.S.; Investigation, Y.S. and H.L.; Resources, J.Y. and H.L.; Data Curation, Y.S.; Writing—Original Draft Preparation, Y.S.; Writing—Review and Editing, J.Y. and H.L.; Visualization, Y.S.; Supervision, J.Y. and H.L.; Project Administration, J.Y. and H.L.; Funding Acquisition, J.Y. All authors have read and agreed to the published version of the manuscript.
Funding
This research was funded by National Natural Science Foundation of China, grant number 7187217.
Institutional Review Board Statement
Not applicable.
Informed Consent Statement
Not applicable.
Data Availability Statement
Data are contained within the article.
Conflicts of Interest
The authors declare no conflicts of interest.
Appendix A
Table A1.
Relationship between key demand elements and dominant resource integration factors in a service category.
Table A1.
Relationship between key demand elements and dominant resource integration factors in a service category.
| Feature of Key Demand Elements | |||||||
|---|---|---|---|---|---|---|---|
| Service Type | Demand Element | Strategic Importance | Feature1 | Feature2 | Feature3 | … | |
| Emergency Medical | … | ||||||
| … | |||||||
| … | … | … | … | … | … | … | |
| … | |||||||
| Resource Feature Importance | … | ||||||
| Key Factor Screening Rule | |||||||
| Key Resource Feature Set | |||||||
References
- Dekker, R.; Bloemhof, J.; Mallidis, I. Operations Research for green logistics–An overview of aspects, issues, contributions and challenges. Eur. J. Oper. Res. 2012, 219, 671–679. [Google Scholar] [CrossRef]
- Garrido, S.; Muniz, J., Jr.; Ribeiro, V.B. Operations management, sustainability & industry 5.0: A critical analysis and future agenda. Clean. Logist. Supply Chain 2024, 10, 100141. [Google Scholar] [CrossRef]
- Safaei, M.; Al Dawsari, S.; Yahya, K. Optimizing Multi-Channel Green Supply Chain Dynamics with Renewable Energy Integration and Emissions Reduction. Sustainability 2024, 16, 9710. [Google Scholar] [CrossRef]
- Yao, J.; Shi, H.; Liu, C. Optimising the configuration of green supply chains under mass personalisation. Int. J. Prod. Res. 2020, 58, 7420–7438. [Google Scholar] [CrossRef]
- Porkar, S.; Mahdavi, I.; Maleki Vishkaei, B.; Hematian, M. Green supply chain flow analysis with multi-attribute demand in a multi-period product development environment. Oper. Res. Int. J. 2020, 20, 1405–1435. [Google Scholar] [CrossRef]
- Ghali-Zinoubi, Z.; Toukabri, M. The antecedents of the consumer purchase intention: Sensitivity to price and involvement in organic product: Moderating role of product regional identity. Trends Food Sci. Technol. 2019, 90, 175–179. [Google Scholar] [CrossRef]
- Li, Z.; Pan, Y.; Yang, W.; Ma, J.; Zhou, M. Effects of government subsidies on green technology investment and green marketing coordination of supply chain under the cap-and-trade mechanism. Energy Econ. 2021, 101, 105426. [Google Scholar] [CrossRef]
- Jayarathna, C.P.; Agdas, D.; Dawes, L.; Yigitcanlar, T. Multi-Objective Optimization for SSC and Logistics: A Review. Sustainability 2021, 13, 13617. [Google Scholar] [CrossRef]
- Flores-Siguenza, P.; Lopez-Sanchez, V.; Mosquera-Gutierres, J.; Llivisaca-Villazhañay, J.; Moscoso-Martínez, M.; Guamán, R. Fuzzy Optimization and Life Cycle Assessment for SSC Design: Applications in the Dairy Industry. Sustainability 2025, 17, 5634. [Google Scholar] [CrossRef]
- Wang, J.; Wan, Q. A multi-period multi-product green supply network design problem with price and greenness dependent demands under uncertainty. Appl. Soft Comput. 2022, 114, 108078. [Google Scholar] [CrossRef]
- Amaldoss, W.; Prusty, S. Sustainable Consumption: A Strategic Analysis. Mark. Sci. 2025, 44, 975–1215. [Google Scholar] [CrossRef]
- Lim, W.M.; Das, M.; Sharma, W.; Verma, A.; Kumra, R. Gamification for sustainable consumption: A state-of-the-art overview and future agenda. Bus. Strategy Environ. 2025, 34, 1510–1549. [Google Scholar] [CrossRef]
- Wang, Y.; Hou, G. A duopoly game with heterogeneous green supply chains in optimal price and market stability with consumer green preference. J. Clean. Prod. 2020, 255, 120161. [Google Scholar] [CrossRef]
- Feng, Y.; Feng, Y.; Liu, Z. The Impact Mechanism of Government Environmental Regulation and Green Consumer Orientation (GCO) on Green Purchase Intention: A Case Study of Zespri. Sustainability 2025, 17, 2575. [Google Scholar] [CrossRef]
- Ghosh, D.; Shah, J. Supply chain analysis under green sensitive consumer demand and cost sharing contract. Int. J. Prod. Econ. 2015, 164, 319–329. [Google Scholar] [CrossRef]
- Tully, S.M.; Winer, R.S. The role of the beneficiary in willingness to pay for socially responsible products: A meta-analysis. J. Retail. 2014, 90, 255–274. [Google Scholar] [CrossRef]
- Chen, Y.-S.; Lin, C.-Y.; Weng, C.-S. The Influence of Environmental Friendliness on Green Trust: The Mediation Effects of Green Satisfaction and Green Perceived Quality. Sustainability 2015, 7, 10135–10152. [Google Scholar] [CrossRef]
- Bi, G.; Jin, M.; Ling, L.; Yang, F. Environmental subsidy and the choice of green technology in the presence of green consumers. Ann. Oper. Res. 2017, 255, 547–568. [Google Scholar] [CrossRef]
- Yi, Y.; Yang, M.; Fu, C.; Li, Y. Gaming strategies within a green supply chain considering consumers’ concern about the greenness and conformance quality of products. Environ. Sci. Pollut. Res. 2017, 29, 69082–69100. [Google Scholar] [CrossRef]
- Luchs, M.G.; Naylor, R.W.; Irwin, J.R.; Raghunathan, R. The sustainability liability: Potential negative effects of ethicality on product preference. J. Mark. 2010, 74, 18–31. [Google Scholar] [CrossRef]
- Lin, P.C.; Huang, Y.H. The influence factors on choice behavior regarding green products based on the theory of consumption values. J. Clean. Prod. 2010, 22, 11–18. [Google Scholar] [CrossRef]
- Yue, B.; Sheng, G.; She, S.; Xu, J. Impact of Consumer Environmental Responsibility on Green Consumption Behavior in China: The Role of Environmental Concern and Price Sensitivity. Sustainability 2020, 12, 2074. [Google Scholar] [CrossRef]
- Asha, L.N.; Dey, A.; Yodo, N.; Aragon, L.G. Optimization approaches for multiple conflicting objectives in sustainable green supply chain management. Sustainability 2022, 14, 12790. [Google Scholar] [CrossRef]
- Wang, X.; Chen, G.; Xu, S. Bi-objective green supply chain network design under disruption risk through an extended NSGA-II algorithm. Clean. Logist. Supply Chain. 2022, 3, 100025. [Google Scholar] [CrossRef]
- Tan, K.; Huang, C. The influence of government support on green purchase intention. EUrASEANs J. Glob. Socio-Econ. Dyn. 2023, 5, 117–127. [Google Scholar] [CrossRef]
- Yang, M.; Chen, H.; Long, R.; Yang, J. How does government regulation shape residents’ green consumption behavior? A multi-agent simulation considering environmental values and social interaction. J. Environ. Manag. 2023, 331, 117231. [Google Scholar] [CrossRef] [PubMed]
- Bian, J.; Zhang, G.; Zhou, G. Manufacturer vs. consumer subsidy with green technology investment and environmental concern. Eur. J. Oper. Res. 2020, 287, 832–843. [Google Scholar] [CrossRef]
- Han, Y.; Zheng, H.; Huang, Y.; Li, X. Considering Consumers’ Green Preferences and Government Subsidies in the Decision Making of the Construction and Demolition Waste Recycling Supply Chain: A Stackelberg Game Approach. Buildings 2022, 12, 832. [Google Scholar] [CrossRef]
- Zhou, J.; Jin, Z.; Liu, Z. The Impact of Green Information Disclosure on Green Consumption Intention: Evidence from New Energy Vehicle Consumers in China Based on the Theory of Planned Behavior. Sustainability 2025, 17, 7983. [Google Scholar] [CrossRef]
- Chen, C.; Zhang, D.; Zhu, L.; Zhang, F. Promoting green choices: How price premium displays influence consumer preference for green products. Resour. Conserv. Recycl. 2024, 207, 107682. [Google Scholar] [CrossRef]
- Wu, H.; Hu, S. The impact of synergy effect between government subsidies and slack resources on green technology innovation. J. Clean. Prod. 2020, 274, 122682. [Google Scholar] [CrossRef]
- Sinayi, M.; Rasti-Barzoki, M. A game theoretic approach for pricing, greening, and social welfare policies in a supply chain with government intervention. J. Clean. Prod. 2018, 196, 1443–1458. [Google Scholar] [CrossRef]
- Nasr, A.K.; Tavana, M.; Alavi, B.; Mina, H. A novel fuzzy multi-objective circular supplier selection and order allocation model for sustainable closed-loop supply chains. J. Clean. Prod. 2021, 287, 124994. [Google Scholar] [CrossRef]
- Jassim, S.; Al-Mubarak, M.; Hamdan, A. The impact of green supply chain management on firm’s performance. J. Inf. Knowl. Manag. 2020, 19, 2040026. [Google Scholar] [CrossRef]
- Hassna, B.; Namany, S.; Alherbawi, M.; Elomri, A.; Al-Ansari, T. Multi-Objective Optimization for Food Availability under Economic and Environmental Risk Constraints. Sustainability 2024, 16, 4336. [Google Scholar] [CrossRef]
- Kayani, S.A.; Warsi, S.S.; Liaqait, R.A. A Smart Decision Support Framework for Sustainable and Resilient Supplier Selection and Order Allocation in the Pharmaceutical Industry. Sustainability 2023, 15, 5962. [Google Scholar] [CrossRef]
- Hafezi, M.; Zolfagharinia, H. Green product development and environmental performance: Investigating the role of government regulations. Int. J. Prod. Econ. 2018, 204, 395–410. [Google Scholar] [CrossRef]
- Mu, Z.; Li, Q.; Dai, G.; Li, K.; Zhang, G.; Zhang, F. Government Subsidy Policy and Online Selling Strategy in a Platform Supply Chain with Green R&D and DDM Activities. Sustainability 2022, 14, 9658. [Google Scholar] [CrossRef]
- Yu, X.H.; Zhang, Z.Q.; Yu, Y.N. Research on Subsidy Performance of Green Supply Chain Considering Consumer Preference. J. Syst. Sci. Math. Sci. 2022, 42, 818–831. [Google Scholar] [CrossRef]
- Yao, J.M. Supply chain resources integration optimization in B2C online shopping. Int. J. Prod. Res. 2015, 55, 5079–5094. [Google Scholar] [CrossRef]
- Zhang, Y.; Xie, D.; Zhen, T.; Zhou, Z.; Guo, B.; Dai, Z. Decoding Strategies in Green Building Supply Chain Implementation: A System Dynamics-Augmented Tripartite Evolutionary Game Analysis Considering Consumer Green Preferences. Buildings 2025, 15, 840. [Google Scholar] [CrossRef]
- Kumar, A.; Kumar, K. An uncertain SSC network design for regulating greenhouse gas emission and supply chain cost. Clean. Logist. Supply Chain 2024, 10, 100142. [Google Scholar] [CrossRef]
- Liu, Z.; Qian, Q.; Hu, B.; Shang, W.; Li, L.; Zhao, Y.; Zhao, Z.; Han, C. Government regulation to promote coordinated emission reduction among enterprises in the green supply chain based on evolutionary game analysis. Resour. Conserv. Recycl. 2022, 182, 106290. [Google Scholar] [CrossRef]
- Hansen, P.; Jaumard, B.; Savard, G. New branch-and-bound rules for linear bilevel programming. SIAM J. Sci. Stat. Comput. 1992, 13, 1194–1217. [Google Scholar] [CrossRef]
- Kheiri, F. A review on optimization methods applied in energy-efficient building geometry and envelope design. Renew. Sustain. Energy Rev. 2018, 92, 897–920. [Google Scholar] [CrossRef]
- Ayhan, M.B. A fuzzy AHP approach for supplier selection problem: A case study in a Gear motor company. arXiv 2013, arXiv:1311.2886. [Google Scholar] [CrossRef]
- Tatarczak, A. Mapping the landscape of artificial intelligence in supply chain management: A bibliometric analysis. Mod. Manag. Rev. 2024, 29, 43–57. [Google Scholar] [CrossRef]


Disclaimer/Publisher’s Note: The statements, opinions and data contained in all publications are solely those of the individual author(s) and contributor(s) and not of MDPI and/or the editor(s). MDPI and/or the editor(s) disclaim responsibility for any injury to people or property resulting from any ideas, methods, instructions or products referred to in the content. |
© 2025 by the authors. Licensee MDPI, Basel, Switzerland. This article is an open access article distributed under the terms and conditions of the Creative Commons Attribution (CC BY) license (https://creativecommons.org/licenses/by/4.0/).