Abstract
The industrialization of using crop straw as energy is currently hindered by systemic bottlenecks, including high collection and storage costs, a poorly coordinated industrial chain, and underdeveloped market mechanism. This study takes Guangdong province as a case study to construct a tripartite evolutionary game model on the transition of straw to energy among the government, enterprises, and farmers. Different from previous studies that focused on the strategy of penalizing the open burning of straw by farmers, this work investigated the cooperation of farmers for straw removal from field, the operational strategies of enterprises for straw utilization as energy, and the selection of government-guided incentive policies. It analyzes the behavioral evolution of these stakeholders under various incentive policies and cooperative scenarios. Numerical simulations were performed to identify the system’s evolutionary stable strategies and assess the potential of expanding straw for energy utilization. It indicated that mild government intervention could lead to a stable equilibrium through facilitating the removal of straw from fields and the utilization of straw as energy by enterprises. Farmers were sensitive to the fluctuation of acquisition price, and their willingness to cooperate would be negatively impacted by a large-scale price reduction. Enterprise expansion was exposed to significant risk under intensive policy intervention. The feasible pathway to increase the proportion of straw utilization as energy in Guangdong began at a small scale. Under mild incentive policies, a scenario targeting a 20% increase was more likely to achieve a market equilibrium for large-scale production than that targeting a 55% increase. The government should draw up positive incentive policies to promote the utilization of straw as energy. By guiding farmers in straw removal from the field and improving the energy enterprises’ competitiveness, the government should curb irrational industry expansion and corporate speculation, and shift from investment support to incentive policies. Meanwhile, the ecological construction of industry and supply chains should be enhanced, and the scale should be used to reduce the high supply-side costs of the straw. It would overcome the central barrier to the commercialization of straw utilization as energy. This work sets an example for conducting dynamic analysis of multi-stakeholder interactions for straw utilization.
1. Introduction
In recent years, due to the dual imperatives of energy security and the transition to a low-carbon economy, the promotion of straw for energy utilization has emerged as a key strategy to replace fossil fuels and reduce carbon emissions [1]. For Guangdong province, which has relatively scarce primary energy resources but abundant agricultural and forestry residues, straw-to-energy utilization has become a strategic focus. With relatively mature biomass combustion power generation technology [2], the installed capacity of Guangdong’s biomass power generation is the highest in China. However, the commercialization of biomass energy in China is beset by numerous challenges, notably including poor economic returns [3] and prohibitive costs for straw procurement and transportation [4]. Consequently, governments are actively developing policies to overcome the barriers to scale the straw-to-energy industry [5].
Due to China’s ban on open burning, the combustion of straw is no longer a legal option for farmers [6]. While Guangdong has achieved continuous improvement in its overall straw utilization, the advancing high-value and low-carbon applications like straw-to-energy conversion still require significant enhancements in efficiency, economic viability, and market conditions [7,8]. Nationally, the utilization rate of straw as energy is only around 10%, far below the proportion used for soil carbon sequestration (field return) or as animal feed [9,10]. The viability of the straw-to-energy sector is highly dependent on effective straw removal from fields and supportive government policies. Yet, it faces persistent challenges, including illicit open burning, low collection efficiency, and an inadequate incentive mechanism [11]. On one hand, farmers lack sufficient incentive for straw removal and exhibit a low willingness to sell it [12]. On the other hand, enterprises face an underdeveloped market and a lack of compelling commercial incentive. The government’s regulatory and incentive policies incur high enforcement cost with limited effect [13]. A complex interaction among the three parties has been formed. Under the dual objectives of high-quality straw utilization and low-carbon development, it is necessary to introduce a tripartite game theory perspective from a systemic viewpoint and quantitatively analyze the strategic interaction among the government, enterprises, and farmers. This will provide theoretical support for decision-makers to overcome institutional dilemmas in promoting the utilization of straw as energy.
Based on tripartite game theory, extensive research has been conducted on the utilization of straw as energy. Straw utilization as energy falls under the research scope of biomass energy supply chain [14,15], where scholars have modeled and simulated different policy tools [16,17] to find better strategies using game theory. Their aims are to provide rational prediction and reason for government, enterprises (power plants), and farmers to make more scientific decisions [18]. Generally, the three parties initially cannot choose the optimal strategy [19,20] and need to optimize through game simulation. The strategic choices of the government, enterprises, and farmers are dynamic, interactive, and continuous in the evolutionary process [21]. Related results have demonstrated that effective policy tools [22] significantly influence the scale of power plants and the income of farmers in the biomass energy supply chain. For instance, He et al. [23] studied government regulation in a straw-based energy supply chain via establishing a penalty model for open burning and subsidies, and found that the penalty policies encouraged power plants to use biomass energy and farmers to collect biomass. Bai et al. [24] used game model to study the strategic factors and influencing mechanisms among stakeholders in the straw industrialization process, and pointed out that implementing strategies such as subsidy, establishment of procurement warehouse, and recognition incentive are beneficial to industrial development. Additionally, government subsidies for technological innovation also positively advance the decisions of straw utilization stakeholders (enterprises and farmers) [25,26].
Another key focus is the design of cooperative models. Wen and Zhou [27] established non-cooperative and cooperative models for these three parties to explore the impact of straw price incentives on farmers. They also researched the cooperative game relationship of stakeholders from the straw supply chain perspective [28,29,30]. Moreover, the game model can help in selecting policy implementation target, which is one of the advantages of game theory methods. For example, the best target for penalty and subsidy can be proved for enterprises or farmers, and more effective subsidy can be determined when farmers are more sensitive to monetary incentive [27]. In the analysis of PPP (Public–private partnership) model for the resource utilization of agricultural wastes, Yin et al. [31] found that the intensive reward and penalty of local government for social capital (enterprise controllers) can enhance the stability of the tripartite evolutionary game.
In summary, game theory offers a robust toolkit for designing policy solutions in the straw utilization. While previous studies provide a solid foundation, they often focus on the initial problem of preventing open burning. The dynamic cooperative interactions among farmers, enterprises, and government are often overlooked. Moreover, most research evaluates policies’ effects but lacks an economic equilibrium analysis between production scale and marketization degree. Furthermore, in regions like Guangdong province that have already achieved a high overall straw utilization, the central challenge has evolved. The focus of the tripartite game is no longer on preventing open burning but on optimizing the allocation of collected straw, specifically toward high-value energy conversion. Under the situation of high straw utilization, this work shifts game issue from non-use of straw to off-field straw utilization as energy, and aims at the formation of market-based equilibrated cooperation. It improves the efficiency and economic viability of straw-to-energy conversion within a low-carbon paradigm where policies are primarily focused on guidance and incentive, rather than penalty. Through a three-party evolutionary game model, the ways to coordinate the cooperative strategic choices of farmers, enterprises, and government are explored to promote the market-oriented straw utilization as energy.
The next sections are organized as follows. Section 2 presents the evolutionary game model. The system dynamics analysis is given in Section 3. Numerical simulations are discussed in Section 4, including an analysis of different equilibrium stability points and scenario analysis of energy utilization ratio improvement. Section 5 shows the conclusions.
2. Research Methodology
The tripartite evolutionary game system requires a defined scenario to construct a payoff matrix based on the behaviors of the three stakeholders. The process of straw utilization as energy involves deep interaction among the government, enterprises, and farmers. The government aims for environmental benefit maximization, enterprises must balance economies of scale with investment risk, and farmers are concerned with short-term profit and labor cost. Therefore, this research uses evolutionary game theory to build a tripartite evolutionary game system consisting of farmers, straw utilization enterprises, and local government.
2.1. Model Assumptions
Practically, the interaction among farmer choice, government regulatory implementation, and enterprise-scale decision are complicated. For example, administrative efficiency and regulatory cost may result in imperfect enforcement. When policy implementation is incomplete and government oversight of farmer is weak, the expected sanction for open-field burning is reduced, which in turn lowers the likelihood of off-field cooperation. Similarly, if the efforts of government guiding enterprise are inadequate, enterprises are less likely to adopt large-scale production. In order to build up a clear relation among farmer, government, and enterprise for the utilization of crops’ straw as energy, the assumptions were constructed as follows. Probabilities were given to farmer cooperation, government intervention, and enterprise-scale decision, respectively, and various scenarios were analyzed at different probabilities to maximally approach the reality. The model parameters are shown in Table 1.

Table 1.
Parameter definitions of the model.
Assumption 1.
The strategy sets of farmers, enterprises, and government are M = { Cooperation, Non-cooperation}, N = { Large-scale production, Small-scale production}, and O = { Intensive intervention, Weak intervention}, respectively. The probabilities of cooperation, large-scale production, and intensive intervention are defined as x, y, and z, respectively, while those of non-cooperation, small-scale production, and weak intervention are noted as 1−x, 1−y, and 1−z, respectively. The values of x, y, and z are in the range from 0 to 1.
Assumption 2.
The government is assumed to have perfect policy enforcement capabilities. Therefore, under an intensive intervention strategy, it can effectively identify burning behavior under farmers’ non-cooperative strategies and respond quickly to punish farmers, thus preventing large negative social impacts and environmental benefit losses. Additionally, to guide biomass enterprises, the government can actively provide subsidies to them. Under a weak intervention policy, there are no fines or subsidies, and only relevant information is disseminated.
Assumption 3.
Biomass enterprises are assumed to have sufficient capacity to process all procured straw at their chosen production scale without straw underutilization.
Assumption 4.
Under an intensive intervention strategy, the government will receive additional environmental benefits gSiQk, where g is the reduction coefficient, Si is the reduction gain coefficient, is the amount of straw procured by the biomass enterprises, and k ∈ {1, 2}. The direct costs for human resources, material resources, and regulation formulation are denoted as The subsidy for biomass enterprises based on electricity generation is denoted as , where a is the subsidy coefficient, d is the electricity generation coefficient of straw, and is the same as the above. If farmers choose a non-cooperative strategy and burn straw, the fine imposed on farmers by the government is denoted as. The cost of the government taking a weak intervention strategy is denoted as, and no environmental benefits are received.
Assumption 5.
Biomass enterprises require more resources when choosing large-scale production. The procured straw quantity for large-scale production is , and the straw price is . The production cost excluding straw procurement is denoted as , which mainly includes equipment purchase, personnel management, straw preprocessing, and transportation cost. The electricity revenue generated from this production is denoted as R1. When biomass enterprises choose small-scale production, the straw procurement quantity is (<), and the straw price is (>). The production cost excluding straw procurement is denoted as (<), and the resulting electricity revenue is denoted as . Biomass enterprises generate carbon reduction during electricity production, and they receive carbon trading income, denoted as gPQk, where P is the carbon trading price, and g and Qk are the same as the above.
Assumption 6.
When farmers choose the cooperative strategy, they will receive revenue from straw selling (, k ∈ {1, 2}). When farmers choose the non-cooperative strategy, the probability of burning straw is denoted as b, and the fertilizer savings from burning or returning the straw to the field is denoted as . The labor cost for farmers when processing straw independently is denoted as .
2.2. Model Interaction and Payment Matrix
The flows of primary cost and benefit under the interaction among farmers, enterprises, and government are shown in Figure 1. It presents the mutual effects among farmers’ cooperation, enterprises’ production scale, and government intervention.
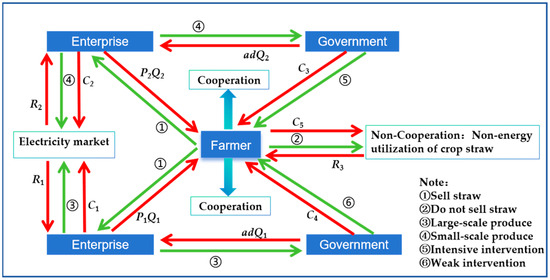
Figure 1.
Flows of primary cost and benefit under the interaction among farmers, enterprises, and government.
Based on the above six assumptions, it constructs a payment matrix of strategic choices among farmers, enterprises, and government. Table 2 shows eight strategy combinations.
Table 2.
Parameter setting of profit and loss variables for eight strategy combinations.
3. Evolutionary Game Analysis
3.1. Replicated Dynamic Equations and Evolutionary Game Path
The replicated dynamic equation is a differential equation that represents the probability of a strategy being adopted by a game participant.
- (1)
- Farmers
The payoff for farmers with cooperation strategy is, and that with non-cooperation strategy is. The average payoff for farmers is. The replicated dynamic equation for farmers is expressed as follows:
- (2)
- Biomass Enterprises
The reward for biomass enterprises choosing large-scale production strategy is, and that choosing small-scale production strategy is . The average reward for biomass enterprises is. The replicated dynamic equation for biomass enterprises is shown as the following:
- (3)
- Government
The payment for the government implementing intensive intervention strategy is, and that implementing weak intervention strategy is. The average payment for government is . The replicated dynamic equation for government is calculated as follows.
3.2. Stability Analysis of Equilibrium Points
Based on Friedman’s methodology, the evolutionary stable strategies of the differential equation systems can be derived by analyzing the local stability of the system’s Jacobian matrix. The following are the Jacobian matrices for the three replicated dynamic equations in the evolutionary game system:
In the formula
However, in the game system formed by the government, biomass enterprises, and farmers, the equilibrium point that the system will ultimately approach must rely on the Lyapunov First Criterion. Specifically, a necessary and sufficient condition for an equilibrium point to be recognized as an evolutionarily stable strategy (ESS) is that all eigenvalues of its Jacobian matrix are negative. On the contrary, if at least one positive or zero eigenvalue exists in the Jacobian matrix, the equilibrium point is considered as an unstable point in the evolution. The equilibrium solutions discussed in this paper include eight pure strategy equilibrium solutions and six mixed strategy equilibrium solutions. According to Friedman’s evolutionary game theory, the stability principle of differential equations, and the stable points derived from the replicated dynamic equations are pure strategy Nash equilibria. Thus, only the stability of pure strategy equilibrium solutions needs to be analyzed. The stability analysis of the eight pure strategy equilibrium points after substituting them into the Jacobian matrix is shown in Table 3.
Table 3.
Stability analysis of pure strategy equilibrium points.
The ESS for the government, biomass enterprises, and farmers are summarized as follows.
Scenario 1. When and the system’s evolutionary strategy is E2 (1, 0, 0), where farmers choose cooperation, biomass enterprises adopt small-scale production, and the government conducts weak intervention.
In scenario 1, when farmers’ revenue from straw selling (P2Q2) is significantly higher than the self-handling fee, and the electricity and carbon trading revenue increments generated by enterprises expansion are insufficient, the government exits regulation due to high intervention cost. The system presents the characteristics of small-scale market operation, with a fragile balance formed by the three parties at low energy conversion from straw.
Scenario 2. When , and , the system’s evolutionary strategy is E5 (1, 1, 0), where farmers selects cooperation, biomass enterprises switch to large-scale production, and the government maintains weak intervention.
In scenario 2, when the net benefit of farmer cooperation is significantly higher than non-cooperation, biomass enterprises strengthen their bargaining power by expanding large-scale production, reducing procurement prices, and forming structural advantage on the cost side. The expansion of procurement leads to a higher increase in electricity and carbon trading revenues than cost increment. The government maintains the status quo due to low weak intervention cost. The system presents the characteristics of large-scale market operation, achieving equilibrium under high straw-to-energy utilization.
Scenario 3. When , the system’s evolutionary strategy is , where farmers choose cooperation, biomass enterprises maintain small-scale production, and the government performs intensive intervention.
In scenario 3, while the fines mechanism can increase the cost for farmers’ self-handling and maintain cooperation, enterprises are limited by insufficient procurement scale () and higher procurement prices (), and are unable to activate economies of scale. Even if government provides subsidy (), the incremental revenue cannot cover the cost increments to sustain small-scale production. The government chooses intensive intervention because the regulatory costs and the environmental revenue are insufficient to be offset by subsidy. The system presents a policy-dependent feature, with a fragile equilibrium at low straw-to-energy utilization.
Scenario 4. When , the system’s evolutionary strategy is E8 (1, 1, 1), where farmers take cooperation, biomass enterprises adopt large-scale production, and the government continues intensive intervention.
In scenario 4, farmers select cooperation due to price benefits and the deterrence of fines . Enterprises receive subsidies from large-scale production and cover cost increment with electricity and carbon trading revenues. The government compensates the high cost of intensive intervention with environmental revenue. The system presents the characteristics of subsidy-distorted pseudo-scale economies, which forms an equilibrium under high utilization of straw as energy.
4. Numerical Simulations
4.1. Simulation Results of Parameter Changes
To discuss the distinguishing characteristics of different equilibria and focus on classifications of marketization in economics, an analytical framework based on “production scale” and “degree of marketization” is introduced. “Small-scale” and “large-scale” characterize industry production scale. “Market-oriented” and “non-market-oriented equilibrium points” denote two distinct states in which stability is achieved primarily through market mechanisms or non-market factors, respectively. As shown in Figure 2, the purpose of the evolutionary simulation is to advance the energy utilization of straw and to establish a mature and scaled market. This framework facilitates assessment of the potential industry scale and degree of marketization under different policy instruments and thereby gives policy implications.
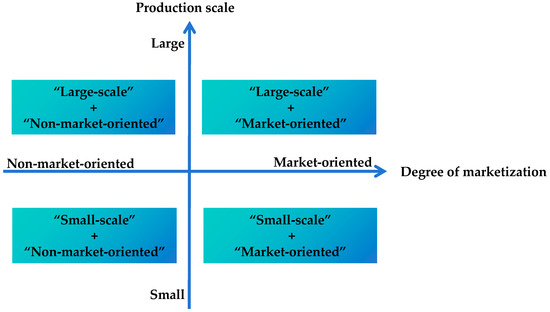
Figure 2.
Analysis framework for the equantequation.
For numerical simulation, the specific parameters for each equilibrium are set as follows, E2: = 220, = 120, = 20, = 90, = 120, = 30, = 15, = 50, = 50, = 5, = 20, = 10, = 20, = 0.8, = 0.2, = 10, = 5, = 3, = 5; E5: = 220, = 50, = 3, = 90, = 120, = 40, = 10, = 50, = 50, = 5, = 20, = 10, = 20, = 0.8, = 2, = 8, = 5, = 3, = 5; E6: = 120, = 90, = 18, = 80, = 80, = 30, = 20, = 30, = 40, = 30, = 15, = 5, = 20, = 0.8, = 0.7, = 8, = 0.5, = 0.3, = 50; E8: = 120, = 60, = 3, = 40, = 60, = 20, = 6, = 30, = 40, = 30, = 15, = 5, = 12, = 0.8, = 0.7, = 20, = 6, = 0.3, = 50. The strategy choices of the tripartite game participants are obtained. The only stable points of each equilibrium in the game system are E2 (1, 0, 0), E5 (1, 1, 0), E6 (1, 0, 1), and E8 (1, 1, 1), respectively. Regardless of the initial willingness values of the participants, the ultimate evolution of systems for equilibrium E2 (1, 0, 0) will be towards the “cooperation”, “small-scale production”, and “weak intervention”, E5 (1, 1, 0) to the “cooperation”, “large-scale production”, and “weak intervention”, E6 (1, 0, 1) towards the “cooperation”, “small-scale production”, and “intensive intervention”’cooperation’, and E8 (1, 1, 1) to the “cooperation”, “large-scale production”, and “intensive intervention”.
4.1.1. Small-Scale Market-Oriented Equilibrium E2 (1, 0, 0)
In this phase (Figure 3), the straw procurement amount is relatively low, and farmers’ cooperation behavior largely relies on maintaining a specific price level, which significantly deviates from the market equilibrium benchmark in large-scale production scenarios. As the core players in resource allocation, biomass enterprises and the government face the common challenge of breakthrough the threshold for scale economy. Due to limited procurement scale, enterprises struggle to activate cost-saving effect. The government is forced to withdraw from regulation due to the imbalance between cost and benefit. It would result in a fragile equilibrium that is highly sensitive to external conditions. In this state, straw utilization as energy is at a low level, and any market supply and demand fluctuation will disrupt the foundation of cooperation. The system will become unstable. The equilibrium E2 (cooperation of farmers, small-scale production of enterprises, and weak intervention of government) reflects the “market failure” at the early stage of straw utilization as energy. To propel biomass energy projects, enterprises set relatively high purchasing price of straw, which results in short-term unprofitable trial operation. More intensive initial policy guidance is needed to steer the planned development of the emerging biomass energy industry for gradual scale-up.
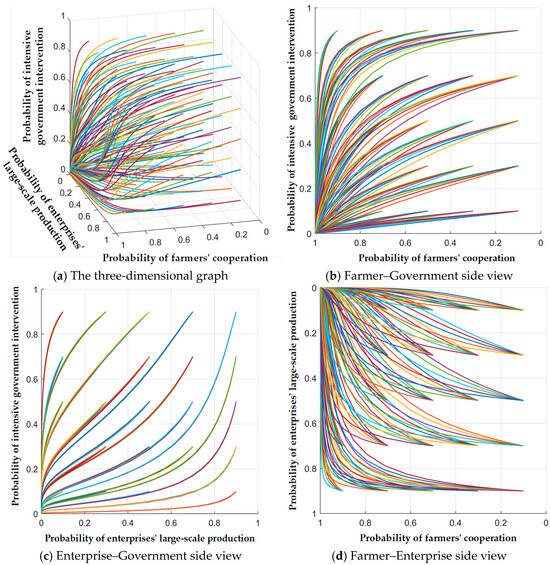
Figure 3.
Evolution of strategy behavior of equilibrium E2 (1, 0, 0) under different initial conditions. Lines with different colors display the evolutionary pathways of game theory at initial probabilities from 0.2 to 1 among farmers, enterprises, and government.
4.1.2. Large-Scale Market-Oriented Equilibrium E5 (1, 1, 0)
At this stage (Figure 4), the breakthrough of scale economy triggers a qualitative change in the system. The production structure shifts towards increasing scale benefits, which leads to systemic cost reduction. It drives the market into a positive feedback loop. Ultimately, a sustainably competitive advantage is formed without relying on policy subsidies, achieving the optimal equilibrium of the system’s evolution. When the enterprise’s procurement scale expands significantly, the bargaining power generated by centralized procurement forces the unit procurement price to decrease systematically. The absolute cost savings become the endogenous driving force for resource allocation. In this mode, the unit straw production cost decreases, and electricity revenue increases as output rises. The combined increase in carbon trading revenue further builds a profit pool for scale economy. Importantly, although large-scale procurement increases the total amount of straw, the price drop is large enough to reduce the increase in total procurement costs. The equilibrium E5 (cooperation of farmers, large-scale production of enterprises, and weak intervention of government) presents the optimal utilization of straw as energy. Farmers cooperate with enterprises to achieve large-scale production, and market-driven development emerges spontaneously rather than as a short-term effect of government intervention or guidance. Although the government maintains weak intervention, market mechanism has fully supplanted policy subsidies to autonomously realize resource optimization. The government should therefore focus on providing a long-term, sustainable environment and institutional framework to preserve stable industrial development, rather than relying on short-term incentive policies.
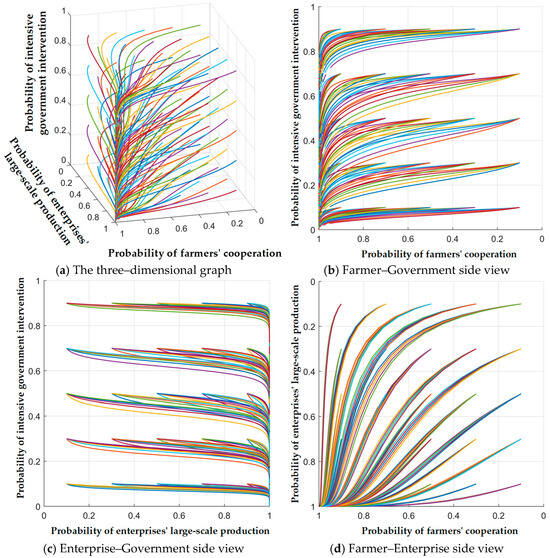
Figure 4.
Evolution of strategy behavior of equilibrium E5 (1, 1, 0) under different initial conditions. Lines with different colors display the evolutionary pathways of game theory at initial probabilities from 0.2 to 1 among farmers, enterprises, and government.
4.1.3. Small-Scale and Non-Market-Oriented Equilibrium E6 (1, 0, 1)
At this stage (Figure 5), the system is at a small-scale and non-market-oriented equilibrium steady state. Farmers’ cooperation behavior is mainly constrained by the fines mechanism, and their decision logic shifts from proactive revenue generation to risk avoidance. Biomass enterprises face a bottleneck in scaling up, and the incremental production cost cannot be covered by existing revenue. Even with policy subsidy, they are still unable to break through the threshold for scale economy. The government maintains the rationality of intervention through environmental value assessment, which forms a closed-loop logic of ‘regulatory input-subsidy expenditure-environmental benefit’. In this model, the system relies on the strength of fines to ensure the minimum cooperation from farmers. The subsidies fill the revenue gap for enterprises, and overestimated environmental benefits balance fiscal revenue and expenditure. In the long term, structural risk will exist. Straw utilization remains at a low level, enterprises lack motivation for technological upgrades, and the market’s self-regulation function is gradually weakened. Under this mechanism, intensive intervention weakens enterprises’ cost control incentive, and the small-scale operating mode is solidified. It creates risk of technological stagnation. The equilibrium E6 (cooperation of farmers, small-scale production of enterprises, and intensive intervention of government) shows a government-initiated non-market scenario. Farmers cooperate with enterprises to achieve small-scale production, but this market activity is not spontaneous. It is a short-term equilibrium effect induced by intensive government intervention. Under this situation, subsidies and incentive policies have become ineffective and do not promote healthy market development. The adjustment of industrial policies and incentive mechanisms is required.
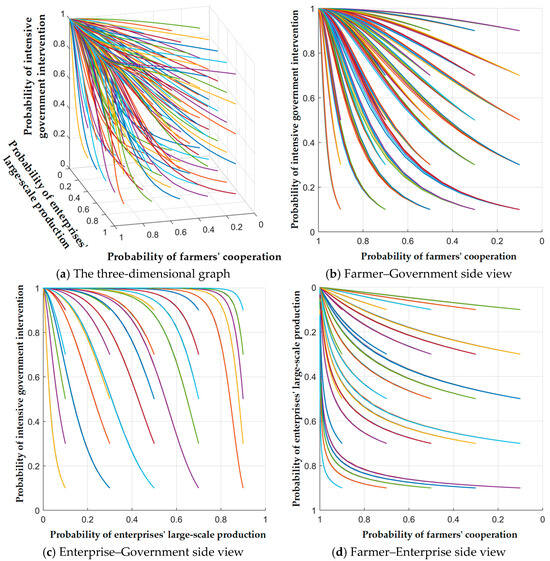
Figure 5.
Evolution of strategy behavior of equilibrium E6 (1, 0, 1)under different initial conditions. Lines with different colors display the evolutionary pathways of game theory at initial probabilities from 0.2 to 1 among farmers, enterprises, and government.
4.1.4. Large-Scale and Non-Market-Oriented Equilibrium E8 (1, 1, 1)
At this stage (Figure 6), after the straw-to-energy utilization surpasses the threshold, the system presents a ‘false prosperity’ and enters a high-risk steady state. This equilibrium forces scale expansion through policy subsidy. As procurement increases and surpasses the threshold, the expansion of the transport radius causes non-linear cost surge, which diminishes the cost-saving advantage of large-scale enterprises. Government subsidies are needed to sustain large-scale production. Farmers’ behavior is bound by both large-scale procurement and high fines, leading to passive compliance. To maintain the high straw-to-energy utilization, the government forms a positive feedback loop of ‘intensive intervention-expansion-revenue’, which results in continuous high-intensity regulation and bears the combined pressure of regulatory cost and subsidy expenditure. The strategies of the three parties converge synchronously, reflecting the forced coordination under high intervention, but exposing the system’s fragility. In the long term, there are two main risks. One is the growing fiscal burden, and the other is that the environmental benefit valuation bias may cause resource allocation misalignment. When fiscal pressure forces the decline of subsidy, the bursting of the scale bubble will trigger systemic regression. The essence of this issue is the shift from technological insufficiency to institutional cost, which ultimately leads to a systemic backlash. The equilibrium E8 (cooperation of farmers, large-scale production of enterprises, and intensive intervention of government) presents a brisk market driven by intensive government intervention. Policy reform is urgently required to the transition of intensive toward weak intervention to realize the sustainability of long-term market prosperity and the promotion of enterprises’ self-development.
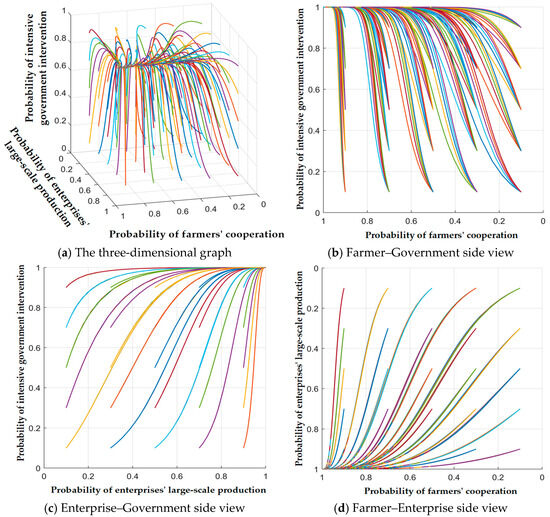
Figure 6.
Evolution of strategy behavior of equilibrium E8 (1, 1, 1) under different initial conditions. Lines with different colors display the evolutionary pathways of game theory at initial probabilities from 0.2 to 1 among farmers, enterprises, and government.
In summary, based on the analytical framework constructed in Figure 2, the comparison analysis of the four equilibrium outcomes is presented in Table 4. It is evident that farmers predominantly adopt the cooperative strategy to obtain greater benefits than from on-farm straw use under government guidance. The strategy choices of enterprises and government exhibit no regular patterns. The intensive intervention does not necessarily induce large-scale production of enterprises. Equilibria E5 and E8 feature large-scale industrial production, but the latter is sustained by policy subsidies. E5 represents the optimal equilibrium, which requires the lowest level of policy intervention and subsidies. Although E2 reflects market-driven behavior, enterprises lack sustained profitability, and the market is unlikely to develop healthily. E6 illustrates the ineffectiveness of subsidies, where intensive government intervention incurs substantial losses.
Table 4.
Comparison of four equilibria (E2, E5, E6, E8).
4.2. Simulation Results of Straw Energy Utilization Improvement Scenarios in Guangdong Province
4.2.1. Survey Data and Parameter Selection
Based on the current market environment, the carbon trading price is CNY 73.66 per ton of CO2 (referring to the “Guangdong Carbon Emission Trading Market 2023 annual average price”), and the carbon reduction coefficient for straw-to-energy utilization is 0.3 tons of CO2 per ton of straw. In terms of government intervention cost, the cost of an intensive intervention strategy is CNY 10,000,000, which is mainly used for grid-based patrols, remote sensing monitoring, and regulation revision. The subsidy provided by the government to enterprises is CNY 0.25 per kWh (citing from the “Guangdong Provincial Agricultural Waste Utilization Report (2023)”). Each unit of carbon emission reduction generates an additional environmental benefit of CNY 120. The fines for straw burning throughout the year total CNY 1,000,000. The weak intervention strategy only requires an investment of CNY 2,000,000 for publicity and education. Social cost calculation results show that if farmers do not choose to cooperate, they could save approximately CNY 5,000,000 in the purchased cost of fertilizer, but they would incur additional costs of up to CNY 4,500,000 towards labor, fire risk, and potential compensation. Historical data shows that the probability of straw burning is 6.45%. The total amount of collected straw in the study area that year is approximately 20 million tons, with a transition rate of 5.24% to energy. It corresponds to a straw procurement quantity of about 10,480,000 tons at a price of CNY 500 per ton (citing from the “Guangdong Provincial Agricultural Waste Utilization Report (2023)”). The sale revenue of biomass enterprises’ annual electricity is approximately CNY 379,795,200, with a production cost of CNY 189,897,600.
Two energy utilization improvement scenarios are set according to the average (20%) and maximum (50%) growth rates of straw utilization as energy in Guangdong. The 20% scenario refers to the average growth rate of straw utilization as energy, and is in line with the actual situation of underdeveloped regions in Guangdong. The 55% scenario refers to the maximum growth rate of straw utilization as energy in regions where the energy industry is developing rapidly, and is consistent with the participation rate of developed regions such as Guangzhou and Shenzhen.
Scenario 1. The straw-to-energy utilization increases by 20% to achieve 6.288%, with the straw procurement rising to 1,257,600 tons and its price decreasing to CNY 425 per ton. The sale revenue of enterprises’ electricity is CNY 455,752,400 with production cost of CNY 195,974,300.
Scenario 2. The straw-to-energy utilization increases by 55% to attain 8.12%, with the straw procurement going up to 1,624,400 tons and its price reducing to CNY 420 per ton. The sale revenue of enterprises’ electricity increases to CNY 588,682,600 at a production cost of CNY 412,077,800.
In order to validate the effectiveness of the evolutionary stability analysis, this study adjusted and assigned values to the model parameters in Table 5 and Table 6 under the consideration that the specific values of the variables in the model do not substantially affect the results.
Table 5.
Model parameter assignment (Scenario 1: Energy utilization increased by 20%).
Table 6.
Model parameter assignment (Scenario 2: Energy utilization increased by 55%).
4.2.2. Case Simulation
Currently, Guangdong’s straw-to-energy utilization rate is 5.24%. Scenario 1 increases the utilization rate to a moderate level (e.g., 6.288%). After substituting the relevant data into the game parameters, the initial values of the model are simulated as shown in Figure 7. Regardless of the initial willingness values of the participants, the game system will ultimately evolve toward the “cooperation,” “large-scale production,” and “weak intervention” market equilibrium strategy. This state marks the successful threshold breakthrough of scale economy, where the increase in straw-to-energy utilization drives an increase in straw procurement quantity. Enterprises form structural cost advantage through centralized procurement, and the compound increase in electricity and carbon trading revenues covers the expansion cost. The endogenous driving force replaces administrative coercion as the core engine of system evolution. The government actively withdraws as environmental benefit and regulatory cost tend to balance. This validates the practical necessity to increase the current utilization rate of 5.24%. The moderate growth can activate the market’s self-optimization mechanism, achieving a synergistic leap in resource efficiency and regulatory burden reduction. By observing the changing trends in Figure 7e–h, it is found that under different initial willingness values, all three parties can reach a stable state quickly, and the differences in evolutionary paths are minimal. It indicates the little influence of initial willingness. Biomass enterprises with higher initial willingness reach a stable state slightly faster than those with lower initial willingness.
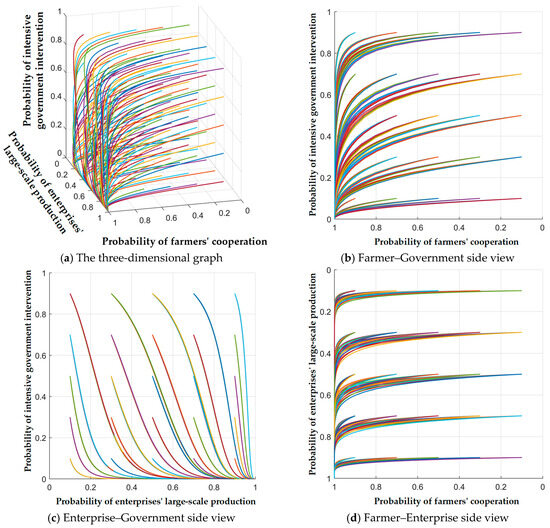
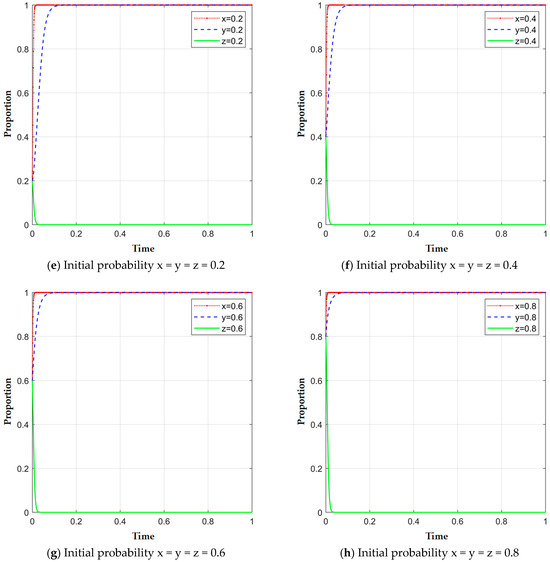
Figure 7.
Initial strategy evolution diagram for scenario 1. Lines with different colors in sub-figures of (a–d) display the evolutionary pathways of game theory at initial probabilities from 0.2 to 1 among farmers, enterprises, and government.
Scenario 2 forces the straw-to-energy utilization rate to an overcritical level (e.g., 8.12%). After substituting the relevant data into the game parameters for Scenario 2, the initial values of the model are simulated as shown in Figure 8. Regardless of the initial willingness values of the participants, the game system will ultimately evolve toward the “cooperation,” “small-scale production,” and “weak intervention” equilibrium strategy. The system presents reversely logical degeneration, where the high nominal target does not translate into substantial operational efficiency, instead stabilizing the system at a low straw-to-energy utilization equilibrium of “cooperation,” “small-scale production,” and “weak intervention”.
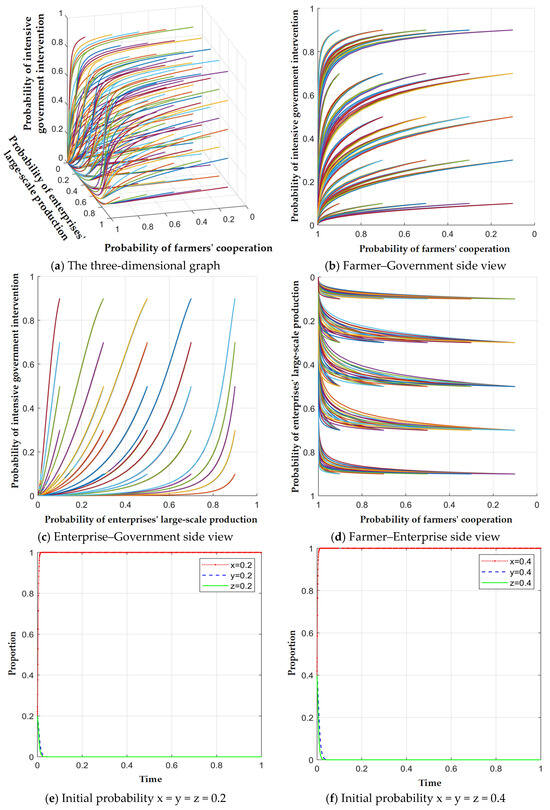
Figure 8.
Initial strategy evolution diagram for scenario 2. Lines with different colors in sub-figures of (a–d) display the evolutionary pathways of game theory at initial probabilities from 0.2 to 1 among farmers, enterprises, and government.
The inherent collapse mechanism is that excessive straw-to-energy utilization causes a non-linear expansion of transport radius. The increase in preprocessing and logistics cost far outpaces the revenue increase, forcing enterprises to shrink production capacity to avoid marginal loss. The government’s subsidies to fill the environmental revenue gap grow exponentially, and fiscal unsustainability forces regulatory withdrawal. This path proves that high-level goal disconnected from economic laws trigger systemic regression. Nominally high straw-to-energy utilization figures clash with actual consumption capacity, and the diseconomy of scale completely dismantles the effectiveness of the policy. By observing the changing trends in Figure 8e–h, it is found that under different initial willingness values, all three parties can reach a stable state quickly, and the differences in evolutionary paths are minimal. It also indicates the little impact of initial willingness.
The robustness of the simulation results was tested by sensitivity analysis in Figure 9. Effect of three key parameters of straw price, subsidy level and carbon trading price on the equilibrium outcomes was evaluated via adjustment of each parameter at the levels of ±20% and ±40%.
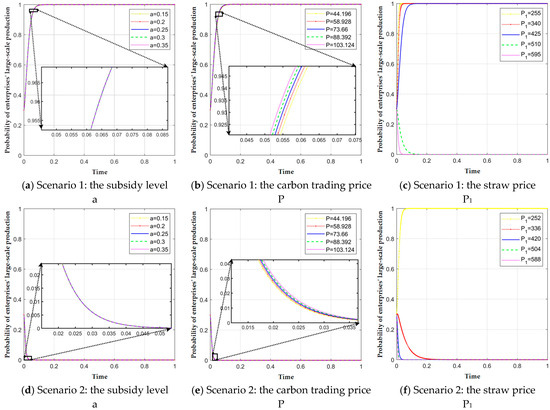
Figure 9.
Sensitivity analysis of the equilibrium outcomes in scenario 1 and 2.
For scenario 1, the equilibrium corresponds to farmers cooperation, large-scale production of enterprises, and weak government intervention. The sensitivity of subsidy level a is shown in Figure 9a. The evolution trajectories essentially coincide with different a values, indicating that changes in subsidy level have a negligible effect on convergence of the game and do not alter enterprises’ strategic choices. This finding is consistent with the equilibrium resulting from the spontaneous market operation and weak government intervention in scenario 1. The carbon trading price P varies over [44.196, 103.124]. Its effect is slightly more pronounced than that of a. As P increases, the system convergence time shortens marginally. It implies that P increase brings gains for enterprises but has limited influence on the acceleration of convergence. The carbon trading price exerts a limited impact on enterprises’ profitability (Figure 9b). Figure 9c shows that the straw price has a significant impact on the evolutionary game. As straw price (P1) rises, the time for enterprises to converge to the large-scale production strategy lengthens and the convergence speed slows. When P1 increases to more than 20%, enterprises shift to the small-scale production strategy, and the larger the P1, the faster the convergence toward small-scale production.
For scenario 2, the equilibrium corresponds to farmers’ cooperation, small-scale production of enterprises, and weak government intervention. Figure 9d indicates that variations in subsidy level a have a very limited effect on convergence speed, which verifies the government opts for weak intervention in scenario 2. It indicates that regardless of subsidy changes, enterprises continue to choose the small-scale production strategy. The effect of carbon trading price P is opposite to that in scenario 1. The system convergence time is somewhat prolonged as P increases. Although P promotion slows convergence, its overall effect remains small (Figure 9e). This implies that even if an increase in carbon trading price can stimulate enterprises’ willingness to expand production and thus decelerate convergence toward small-scale production, it does not alter the final strategic choice. For straw price P1 in the range from CNY252 to CNY588], its impact on the evolutionary game is shown in Figure 9f. The straw price remains a major determinant of the game outcome. As P1 decreases, convergence speed gradually declines, and the enterprises’ strategy shifts from small-scale to large-scale production when P1 falls by 40%. In sum, subsidy level a and carbon trading price P cannot change the equilibrium state, but straw price reaching a certain threshold can directly alter enterprises’ production strategies. The straw cost is a persistent issue in the industrialization of biomass energy.
5. Conclusions
To promote the industrial development of crop straw utilization in Guangdong province, an evolutionary game model is constructed to analyze the interaction mechanisms among farmers, enterprises, and government. Four stable equilibrium strategies are derived, and based on the simulation results, the feasibility and scope of increasing the energy utilization rate of straw in Guangdong province are analyzed. The main conclusions are as follows:
With mild government intervention, proactive guidance, and effective incentives—such as unit-cost subsidies or tax reductions during the pre-scale-up phase and recognizing carbon trading revenues for low-carbon products—the development of large-scale markets for enterprises can be facilitated. At an optimal large-scale market equilibrium, the fundamental solution is to maintain energy utilization within a sustainable range, reframe the policy approach from intensive intervention to rational guidance, and steer enterprises toward large-scale, market-oriented operations.
When rising utilization rates of straw to energy cause the elasticity of transport costs to exceed revenue growth, a pivot to technological innovation is necessary. This includes adopting straw compression technology to lower unit-volume transport costs or forming cross-regional collection and storage alliances to optimize logistics radii, thereby expanding the effective range of economies of scale. Fundamentally, aligning the growth of energy utilization with the boundaries of economic principles is the only way to unify a higher utilization rate with the system’s sustainable development.
In light of the emerging trend toward high comprehensive utilization of straw, this paper constructs a three-party evolutionary game model that shifts the core issue from whether straw is utilized to whether off-field straw utilization as energy is undertaken. The framework and findings can be extended to other regions with similar demand for the development of agricultural-waste for biomass energy or other resources. It can provide reference to advance the high-quality development of the biomass energy industry.
Based on the above findings, the following policies are recommended.
To promote the straw-to-energy utilization in Guangdong province, the top-level design should be strengthened, and the layout of the biomass energy industry should be scientifically planned. It is not recommended to greatly increase the straw-to-energy utilization ratio from the farmers’ end because the industry is not mature, and large-scale promotion may lead to investment risk, repeated construction, and vicious competition. Large-scale demonstration projects of straw-to-energy utilization should be established to explore reasonable business models and improve the economic efficiency through technological innovation. On the technological side, the focus should be enhanced on emerging technologies for straw utilization as energy, such as cellulose ethanol and bio-hydrogen production, to tap into the economic added value of low-carbon and hydrogen energy markets.
To address the sector’s challenges of small scale and high production cost, a performance-based reward mechanism should be established for both farmers and enterprises. Enterprises would receive rewards based on their output of energy products, ensuring incentives to directly promote production and prevent reckless expansion or over-reliance on subsidies. The reward intensity should be sufficient to offset or reduce the high cost associated with straw harvesting, collection, baling, transport, and storage during the industry’s early stages. Farmers should also be rewarded based on the quantity of their straw converted to energy. It allows them a share in the revenue and enhances the competitiveness of straw for energy against others.
A key recommendation is to develop a comprehensive ecosystem for straw-to-energy utilization by integrating smart technologies and digitalization throughout the industry. It involves fostering a collaborative environment among stakeholders to build an integrated value chain covering agriculture, transportation, and manufacturing. The government should encourage private investment in the collaborative development of the biomass energy supply chain, aiming to reduce costs across the entire value chain through scale economy and sustainable practices. Furthermore, it is crucial to advance digitalization by establishing a management platform for straw utilization and enabling digital oversight across the entire supply chain from crop planting to energy conversion. Leveraging data resources will be essential, particularly for advancing carbon asset management and preparing for future carbon trading. It will significantly enhance the market competitiveness of the straw-to-energy sector.
Nevertheless, this study has some limitations. It assumes constant straw and carbon trading prices and does not account for the impacts of price volatility. In addition, the model does not differentiate regional heterogeneity within Guangdong province. Future research could incorporate price volatility into the model to analyze market risk effects, conduct regional comparative studies to propose region-specific policies and introduce a fourth intermediary party (e.g., logistics or straw-collection firms) to expand the multi-stakeholder game framework.
Author Contributions
L.Z.: Data curation, Formal analysis, Methodology, Writing—original draft, Writing—review and editing. Y.Y.: Datacuration, Formal analysis, Writing—original draft. J.R.: Datacuration, Formal analysis, Writing—original draft. W.W.: Writing—original draft, Writing—review and editing. X.S.: Project administration, Supervision, Writing—review and editing. All authors have read and agreed to the published version of the manuscript.
Funding
This research was funded by the Fundamental Research Funds for the Central Universities, China University of Mining & Technology (Beijing) (2023SKPYGL03).
Institutional Review Board Statement
This study is waived for ethical review by China University of Mining and Technology, as the enquiry information in the manuscript is about the factors influencing the willingness of farmers for the utilization of straw as energy. There is no personal information involved in the manuscript.
Informed Consent Statement
Informed consent for publication was obtained from all identifiable human participants.
Data Availability Statement
The data that support the findings of this study are available upon request.
Conflicts of Interest
The authors declare no conflicts of interest.
References
- Zhang, Q.; Zhou, D.; Fang, X. Analysis on the Policies of Biomass Power Generation in China. Renew. Sustain. Energy Rev. 2014, 32, 926–935. [Google Scholar] [CrossRef]
- Malek, A.; Hasanuzzaman, M.; Rahim, N.A.; Turki, Y.A.A. Techno-Economic Analysis and Environmental Impact Assessment of a 10 MW Biomass-Based Power Plant in Malaysia. J. Clean. Prod. 2017, 141, 502–513. [Google Scholar] [CrossRef]
- Qiu, H.; Sun, L.; Xue, X.; Bai, J. Potentials of Crop Residues for Commercial Energy Production in China: A Geographic and Economic Analysis. Biomass Bioenerg. 2014, 64, 110–123. [Google Scholar] [CrossRef]
- Qian, B.; Shao, C.; Yang, F. Spatial Suitability Evaluation of the Conversion and Utilization of Crop Straw Resources in China. Environ. Impact Assess. Rev. 2024, 105, 107438. [Google Scholar] [CrossRef]
- Jia, Y. The Development Status and Future Measures of Agricultural Circular Economy in China. Macroecon. Manag. 2022, 50–56+81. [Google Scholar] [CrossRef]
- Wu, Y.; Li, L.; Xu, R.; Chen, K.; Hu, Y.; Lin, X. Risk Assessment in Straw-Based Power Generation Public-Private Partnership Projects in China: A Fuzzy Synthetic Evaluation Analysis. J. Clean. Prod. 2017, 161, 977–990. [Google Scholar] [CrossRef]
- Zeng, Y.; Cao, Y.; Qiao, X.; Seyler, B.C.; Tang, Y. Air Pollution Reduction in China: Recent Success but Great Challenge for the Future. Sci. Total Environ. 2019, 663, 329–337. [Google Scholar] [CrossRef] [PubMed]
- Yu, H.; Yang, Y.; Dong, S. A System Dynamics Model to Assess the Effectiveness of Governmental Support Policies for Renewable Electricity. Sustainabilty 2019, 11, 3426. [Google Scholar] [CrossRef]
- Yu, Y. Low-Carbon Technology Calls for Comprehensive Electricity-Market Redesign. Front. Eng. Manag. 2019, 6, 128–130. [Google Scholar] [CrossRef]
- Liu, P.; Li, A.; Wang, Y.; Cai, Q.; Yu, H.; Li, Y.; Peng, H.; Li, Q.; Wang, Y.; Wei, X.; et al. Distinct Miscanthus Lignocellulose Improves Fungus Secreting Cellulases and Xylanases for Consistently Enhanced Biomass Saccharification of Diverse Bioenergy Crops. Renew. Energy 2021, 174, 799–809. [Google Scholar] [CrossRef]
- DeYong, G.D.; Pun, H. Is Dishonesty the Best Policy? Supplier Behavior in a Multi-Tier Supply Chain. Int. J. Prod. Econ. 2015, 170, 1–13. [Google Scholar] [CrossRef]
- Fang, Y.; Zhang, S.; Zhou, Z.; Shi, W.; Xie, G. Sustainable Development in China: Valuation of Bioenergy Potential and CO2 Reduction from Crop Straw. Appl. Energy 2022, 322, 119439. [Google Scholar] [CrossRef]
- Liu, W.; Long, S.; Wei, S.; Xie, D.; Wang, J.; Liu, X. Smart Logistics Ecological Cooperation with Data Sharingand Platform Empowerment: An Examination with Evolutionary Game Model. Int. J. Prod. Res. 2021, 60, 4295–4315. [Google Scholar] [CrossRef]
- Guajardo, M.; Ronngvist, M.; Flisberg, P.; Frisk, M. Collaborative Transportation with Overlapping Coalitions. Eur. J. Oper. Res. 2018, 271, 238–249. [Google Scholar] [CrossRef]
- Bernier-Oviedo, D.J.; Duarte, A.E.; Sánchez, O.J. Evaluation and Design of Supply Chains for Bioenergy Production. Energies 2025, 18, 1958. [Google Scholar] [CrossRef]
- Zhang, L.; Wu, B. Farmer Innovation System and Government Intervention: An Empirical Study of Straw Utilisation Technology Development and Diffusion in China. J. Clean. Prod. 2018, 188, 698–707. [Google Scholar] [CrossRef]
- Zhang, L.; Guo, Q. Air Polutant Emision Mechanism, Spatio-Temporal Patterns and Emission Reduction Strategies of Resource-Oriented Utilization of Crop Straw: A Literature Review. Southwest Univ. (Nat. Sci. Ed.) 2020, 42, 143–153. [Google Scholar]
- Allameh, G.; Saidi-Mehrabad, M. A Game Theory Approach in Long-Term Strategy Selection in Biofuel Supply Chain. Environ. Prog. Sustain. Energy 2019, 38, 13122. [Google Scholar] [CrossRef]
- Friedman, D. Evolutionary Games in Economics. Econometrica 1991, 59, 637–666. [Google Scholar] [CrossRef]
- Su, X. Bounded Rationality in Newsstand Models. Manuf. Serv. Oper. Manag. 2008, 10, 563–691. [Google Scholar] [CrossRef]
- Chen, H.; Wang, J.; Miao, Y. Evolutionary Game Analysis on the Selection of Green and Low Carbon Innovation Between Manufacturing Enterprises. Alex. Eng. J. 2021, 60, 2139–2147. [Google Scholar] [CrossRef]
- Jiang, Z.Z.; Kong, G.; Zhang, Y. Making the Most of Your Regret: Workers’Relocation Decisions in On-Demand Platforms. Manuf. Serv. Oper. Manag. 2021, 23, 695–713. [Google Scholar] [CrossRef]
- He, N.; Jiang, Z.Z.; Huang, S.; Li, K. Evolutionary Game Analysis for Government Regulations in a Straw-based Bioenergy Supply Chain. Int. J. Prod. Res. 2023, 61, 6093–6114. [Google Scholar] [CrossRef]
- Bai, W.; Zhang, L.; Zhou, Z.; Yan, L. Exploring the Dilemma of Straw Economy in China: An Analysis Based on Tripartite Evolutionary Game Model. Energy Econ. 2024, 139, 107913. [Google Scholar] [CrossRef]
- Wang, L.; Wang, Z.; Tahir, N.; Wang, H.; Li, J.; Xu, G. Study of Synergetic Development in Straw Power Supply Chain: Straw Price and Government Subsidy as Incentive. Energy Policy 2020, 146, 111788. [Google Scholar] [CrossRef]
- Zhang, X.; Luo, K.; Tan, Q. A Game Theory Analysis of China’s Agri-Biomass-Based Power Generation Supply Chain: A Co-opetition Strategy. Energy Procedia 2017, 105, 168–173. [Google Scholar] [CrossRef]
- Wen, W.; Zhou, P. Impacts of Regional Governmental Incentives on the Straw Power Industry in China: A Game-Theoretic Analysis. J. Clean. Prod. 2018, 203, 1095–1105. [Google Scholar] [CrossRef]
- Wen, W.; Zhang, Q. A Design of Straw Acquisition Mode for China’s Straw Power Plant Based on Supply Chain Coordination. Renew. Energy 2015, 76, 369–374. [Google Scholar] [CrossRef]
- Wang, L.; Watanabe, T. A Stackelberg Game Theoretic Analysis of Incentive Effects under Perceived Risk for China’s Straw-Based Power Plant Supply Chain. Energies 2016, 9, 455. [Google Scholar] [CrossRef]
- Wang, Z.; Hou, T.; Wang, Z. Revenue Coordination of Straw Powergeneration Supply Chain under Carbon Trading Environment. Waste Biomass Valor. 2023, 14, 1769–1785. [Google Scholar] [CrossRef]
- Yin, Q.; Wang, Q.; Du, M.; Wang, F.; Sun, W.; Chen, L.; Hong, T. Promoting the Resource Utilization of Agricultural Wastes in China with Public-Private-Partnership Mode: An Evolutionary Game Perspective. J. Clean. Prod. 2024, 434, 140206. [Google Scholar] [CrossRef]


Disclaimer/Publisher’s Note: The statements, opinions and data contained in all publications are solely those of the individual author(s) and contributor(s) and not of MDPI and/or the editor(s). MDPI and/or the editor(s) disclaim responsibility for any injury to people or property resulting from any ideas, methods, instructions or products referred to in the content. |
© 2025 by the authors. Licensee MDPI, Basel, Switzerland. This article is an open access article distributed under the terms and conditions of the Creative Commons Attribution (CC BY) license (https://creativecommons.org/licenses/by/4.0/).