Abstract
The construction sector is a major contributor to global solid waste generation, with demolition waste posing substantial environmental and economic challenges. The present study introduces a demolition waste estimation tool and applies it to a rapidly transforming city: Astana, the capital of Kazakhstan. The approach is also readily applicable to cities in transformation with similar characteristics, e.g., those in the Commonwealth of Independent States region and beyond. The key materials of interest were identified as those that can be efficiently extracted from buildings slated for demolition. A comprehensive analysis of current building stocks and demolition plans (2023–2029) was then conducted. Based on the height, purpose, and main material of the building, the main types and subtypes of the building stock in Astana were created. The results for Astana showed that 67.52% or 1736.5 thousand tons of all demolition waste could be recovered. Concrete had the highest recovery potential by mass (162.42 thousand tons annually) and by percent (91%). The economic analysis of construction and demolition waste illustrated a financial potential from construction and demolition waste recovery in Astana at USD 4600 million per year, with concrete having the highest potential among fractions (56% of total).
1. Introduction
Demolition waste (DW), the predominant part of construction and demolition waste (CDW), is a topic of interest in solid waste management research, as the construction industry is generally the largest resource consumer and contributor to solid waste generation worldwide [1]. It is important to distinguish between the terms DW and CDW. While CDW is a broad category encompassing waste streams derived from both construction activities (excavation, renovation, and infrastructure development) and demolition processes, within this spectrum, DW accounts for the overwhelming majority, commonly estimated at around 90% of the total CDW stream [2]. DW can be present in the form of solid and liquid in different proportions, with solid waste being the predominant type. As an example, in the United States, the amount of DW generated annually is approximately 534 million tons [3], and in Australia, 19 million tons [4].
Waste recovery is a term that encompasses various reuse practices as well as primary, secondary, and tertiary recycling. Buildings are often disposed of at the end of their life-cycle without any significant possibility of material recovery (i.e., reuse or recycling). Approximately 50% of the waste generated by the construction industry is directly deposited in landfills, and in some countries, it can be even more. Increasing amounts of DW generated are becoming a more significant burden on the environment, economy, and society [5].
Despite the construction industry being one of the drivers of contemporary civilization and its economy, it comes at the cost of high consumption of natural resources, unwanted air emissions, and, at times, wasteful consumption of resources. The environmental impact of DW may be deemed unbearable [6]. Among several types of adverse impacts, high CO2 emissions are an example of a particular topic of concern. Concrete industry and DW generation are among the main contributors to atmospheric CO2 emissions [7]. Cement production alone results in 7% of the world’s total CO2 emissions [8]. The two largest producers of cement in the world are China and India, with China producing 2.5 million kilotons and India producing 290 thousand kilotons [9]. These adverse impacts of the construction industry highlight the importance of resource recovery from DW.
The literature reports some evidence that materials recovered from DW can retain useful properties. For concrete and brick, recycled concrete aggregate (RCA) usually yields somewhat lower strength than virgin aggregate; however, treatments such as accelerated CO2 carbonation of RCA have shown improved compressive and tensile strengths by roughly 30–42% over untreated RCA [10,11,12,13]. Likewise, using recycled masonry in mortar can increase strength [14]. Steel scrap from demolished structures can be recycled or reused with little loss of quality. For example, adding 1.5% of recycled steel fibers to a concrete mix increased beam bending capacity and tensile strength by approximately 10 to 55% compared to a non-fiber control [15,16]. Another example is composite panels made from 10 to 30% recycled wood, which are shown to improve mechanical behavior, enhanced strength, dimensional stability, and lower moisture uptake [17].
The generation and management of DW is also a large issue from an economic viewpoint. There is significant environmental and resource potential in enhancing recycling and reuse processes, which can, in turn, increase the economic value of DW [18]. However, current rates of reuse and recycling in the construction industry are low [19]. More specifically, compared to other industries, recycling and remanufacturing in the construction industry are still in their infancy and face significant issues such as a lack of supporting regulations and policies, and unstable supply and demand of materials, putting operating companies in difficult situations [19]. During demolition, acquired DW is composed of various materials, with the most common ones being concrete, metal, asphalt, wood, drywall, soil, and brick [20,21]. Generally, the material flow is in the form of mixed DW: according to [22], approximately 75% of all DW falls into the category of ‘mixed DW’, while another 14% is considered as ‘soils and stones’, which means that around only 10% of all DW is sorted either on-site or off-site.
DW generation and management is a particularly important issue in rapidly developing economies of the world. This is particularly because these countries have large levels of construction activity in terms of transforming older buildings, neighborhoods, and commercial/industrial zones to newer ones, initiated by the demolition of older works. Furthermore, such developing economies often have less than stellar waste management systems, mostly or fully relying on direct land disposal. These rapidly expanding economies are commonly found around Asia, including, but not limited to, parts of China, India, and Central Asia.
Particularly in Kazakhstan, DW management, including recycling and remanufacturing, faces significant issues in supply–demand, legislative support, and robust research on the economic recovery potential of DW [23]. As a country that is similar to Kazakhstan in terms of rapid development and legislative structure, China is expected to have a current recovery rate of around 5% [19]. Therefore, although the values for Kazakhstan are currently unknown, RRs could be expected to be comparable to those of China. In comparison, in Japan as well as in some EU countries, RR has exceeded 90% [24], indicating the achievable potential for resource recovery from DW.
Some quantitative approaches have been proposed to estimate how much DW can be recovered (i.e., reused/recycled) rather than landfilled, each with methodological limitations as well as applicability issues to specific contexts or countries. Often, project-level waste audits and surveys are used to estimate recoverable DW. Specialists inspect buildings before demolition for inventory materials such as wood and metal to estimate salvageable fractions. EU guidelines explicitly mandate pre-demolition waste audits to maximize recovery [25]. Such auditing is based on architectural records and intuition and may be capable of producing highly accurate yields for a given building; however, it is labor-intensive, applicable to that specific project only (i.e., not scalable), and requires detailed architectural records that are often unavailable for older building stock. Another method, material flow analysis (MFA) uses top-down or bottom-up mass-balance modeling of materials. Top-down MFA tracks inflows of raw materials into the economy and outflows as waste, while bottom-up MFA aggregates waste from many projects or sectors [26]. MFA can integrate the stock of demolition (retired buildings) to generate DW forecasts. The use of MFA at city and country levels has been carried out through the synthesis of material consumption, building stock, and lifespan data [26,27]. MFA, while powerful for capturing trends, depends on comprehensive and reliable material flow and stock data, which are often unavailable at the desired resolution. Life-Cycle Assessment (LCA) is an environmental impact tool that can incorporate DW scenarios. LCA models capable of comparing the methods used in demolition by simulating various material recovery rates. Practically, an LCA requires detailed information on the quantities and processes of materials; it may be applicable for calculating the environmental benefits of increased rates of recovery. However, LCA is data-intensive and is typically performed for case studies or policy analysis rather than routine estimates [28,29,30,31]. Finally, Building Information Modeling (BIM) gives digital 3D models of buildings with quantities and properties of materials. These data can be extracted into BIM-based tools to predict demolition waste [32,33,34,35]. BIM has the potential to provide accurate waste quantities for modern buildings with detailed digital models, but these models are uncommon or unavailable for older building stock, and most building stock to be demolished are pre-BIM and pre-digital twin infrastructure.
The calculation of MOI composition or ‘material intensity’ can be performed in several ways. For example, in Germany, the calculation of material intensity for domestic buildings was performed based on documented official reports on the amount of each material used in the construction of specific buildings [36]. The same approach was undertaken in the analysis of material intensity in Italy [37]. For non-domestic buildings, in Germany, which did not have records of materials used, records on floor area, wall size, and wall materials were used [38]. The same approach for specific buildings was undertaken in Vienna, Austria [39]. Another method, based on literature reviews and case studies in Austria, assigned specific material intensities to buildings depending on their utilization and construction period [39,40]. A similar approach was undertaken in Japan [41]. The present research uses an approach similar to that in [39,41].
The expected low recovery rate for Kazakhstan and the Commonwealth of Independent States (CIS) is accompanied by unquantified amounts of DW generated. Recovery potential and financial value estimates may contribute to incentives for achieving higher recovery rates in Kazakhstan and the CIS region. Overall, while the existing methods (as previously described above: waste audits, MFA, LCA, and BIM-based tools) provide useful conceptual and empirical foundations, each brings limitations (e.g., labor intensiveness, scalability issues, detailed/intense data requests, and data availability issues for older buildings) that constrain their application to certain cases, including those in Kazakhstan. These reduce the reliability and scalability of approaches when applied to heterogeneous building stocks such as those in Kazakhstan. The availability of governmental reports and reference field studies in various regions suggests that approximate estimations should be possible. To our knowledge, there are no studies in the CIS region that focus on the estimation of recoverable DW based on government-reported building stocks and demolition plans. In this context, the novelty of the present research lies in introducing a methodology that presents an approach for estimating the stock of materials in each building type. We hypothesize that by using government demolition plans, building floorplan data from digital maps, material data from building types and subtypes, and recovery rates information from the literature, the potential for DW recovery could be effectively demonstrated. Based on that, we propose a methodology to estimate the recoverable amount of DW for Astana, Kazakhstan, based on the governmental demolition plan between the years 2023–2029, which is further applicable to other similar developing cities around the globe, including numerous ones in the CIS region. The results from the suggested tool would then help estimate capacity gaps in handling and processing DW for recovery purposes, identify particular policy tools required for effective implementation of recovery methods, and select specific recovery technologies to prioritize research areas and optimize sustainability in the construction sector.
2. Materials and Methods
2.1. Study Area
Astana (51°10′ N latitude, 71°26′ E longitude) is the capital of Kazakhstan (Figure 1), which is located on the Eurasian steppe. It has a metropolitan area of 722 km2 and is 347 m above sea level. Astana is a city with a population of 1.5 million, which illustrates the highest annual population growth rate of 6.34% [42]. Additionally, the city illustrates a high rate of construction and renovation activities. Unlike some cities in rapidly developing Asian countries, buildings planned for demolition in Astana are not clustered but are spread across the city rather evenly. As such, the city is a typical example of a rapidly growing city in the CIS region.
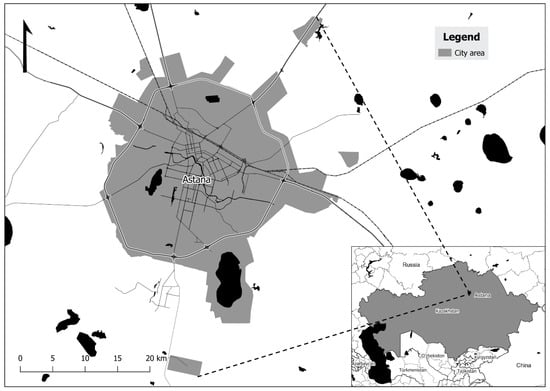
Figure 1.
Location of the study: Astana, Kazakhstan.
2.2. Building Classification Based on Structure and Materials
The material composition and recovery potential from demolition activities largely depend on the building type and age. Older buildings, particularly private residences, often yield a wide range of materials with varying quality, making the recovery process less predictable. Some demolition materials are less prone to reuse or recycling, compared to others. One example is wood: a large portion of aging private housing in Kazakhstan and other CIS countries consists of woodblock housing. In this type of construction, blocks (used to construct the houses) contain various layers of insulating materials embedded between layers of wooden sheets and chipboards, making them harder to properly recover and meet regulatory standards. Such nuances make these materials useful only for non-structural components and low-value use [43]. Based on these nuances in material extraction during demolition, a list of materials of interest (MOI) was created, focusing on those that can be realistically extracted from CDW and, after processing, applied in major construction projects.
As a basis for the present research, a list of buildings planned for demolition was obtained from the city administration’s report on the demolition and renovation of housing in the years 2023–2029 [44]. More detailed information about floor area was retrieved from the official decree of the Prime Minister on the renovation plan for Astana 2028 [45]. Based on that dataset, buildings that are planned to be demolished were characterized into the following four types: Type 1 (N = 44): stone block private buildings; Type 2 (N = 107): woodblock private buildings; Type 3 (N = 31): brick condominiums; and Type 4 (N = 24): concrete block condominiums.
The types and subtypes exhibited similar compositions in terms of material percentages, with certain differentiating characteristics. For example, Type 2 buildings tend to have a higher percentage of wood compared to other types, while Type 4 buildings being larger and having more floors, tend to have a higher percentage of steel.
2.2.1. Type 1: Stone Block Private Buildings
Due to a lack of standardization and documentation, among all types, Type 1 buildings are the most difficult to classify. Buildings in Type 1 were split into two subtypes: Type 1-1 (N = 26) buildings consisting of mostly private residential buildings, and Type 1-2 (N = 18) buildings comprising commercial buildings.
2.2.2. Type 2: Woodblock Private Buildings
Type 2 buildings are relatively low-density, woodblock panel buildings. Based on the floor area and building height, they were classified into three subtypes: Type 2-1 (N = 83) for private housing, Type 2-2 (N = 6) for commercial buildings, and Type 2-3 (N = 18) for warehouses. Type 2-1 buildings are not as numerous as other types, such buildings are part of aging housing constructed both legally and illegally from the 1950s to 1970s. Most buildings tend to be 1-story, with an average floor area of 282 m2. Type 2-2 buildings are 1–2-story commercial buildings that are more standardized and easier to identify. Some include sections or full roofs composed of metal sheeting; however, the exact proportions are not available. Type 2-3 buildings are 1-story warehouses with a large floor area. Some buildings include metal sheet roofing and facade covering; however, similar to Type 2-2 buildings, the exact proportions are not available.
2.2.3. Type 3: Brick Condominiums
Type 3 buildings (n = 45) are communal buildings constructed during the 1950s and 1960s, usually 2- or 3-story housing with limited floor areas. They came in many different variations; however, all were built from red bricks and mortar. Most of these types of buildings are planned for demolition for the rebuilding of the city.
2.2.4. Type 4: Concrete Block Condominiums
Type 4 buildings include Soviet panel buildings, ranging from three to six floors, respectively. Such buildings come in seven different variations, built in various locations during different periods: (1) K-7 type panel block building (1958–1970), which, according to general urban renovation plans, are all planned to be demolished; (2) 1-335 type panel block building (1956–1969), a unique type because of its structural combination of reinforced concrete frame and load-carrying panels; (3) 1-480 (1958); (4) 1-464 panel block building (1959–1974), one of the most widespread among ex-Soviet countries; (5) 1-438 block building (1958), built by a combination of reinforced concrete and bricks; (6) 1-447 block building (1957–1972), consisting of a combination of reinforced concrete and red bricks (modified versions built up until 1988); and (7) 1-467 (1959–1980), designed with reinforced concrete blocks of various sizes.
As variations 1-480 and 1-438 were rare, they were not considered in the calculations of the present study. Moreover, region-specific variations in Type 4 buildings were not considered due to the relative rarity of such variations, with the main differences being insulating and facade materials. Variations K-7 and 1-335 were not considered in the calculations since most of the buildings have already been demolished. The most recent and widespread variations (1-464, 1-467) were considered for calculations. Due to drastic structural differences between the two variations, they were classified into two subcategories: Type 4-1 (N = 6) for 1-464 and Type 4-2 (N = 18) for 1-467, respectively. Type 4-1 buildings mostly consist of concrete panels on reinforced concrete frames. Type 4-2 buildings mostly consist of reinforced concrete blocks of various sizes. The most abundant materials in both are steel and concrete.
2.3. Composition of Materials of Interest
According to Astana’s city demolition plan for 2023–2029, each building planned for demolition was given an external material type. These include (1) block, (2) timber, (3) brick, (4) large-block, (5) panel, (6) adobe, (7) slag-tile, (8) slag-block, and (9) panel-board. Considering the wide range of DW materials, it was decided to combine this official material classification into four main categories: (1) concrete, (2) steel, (3) bricks, and (4) wood. Certain materials such as panel-board and timber from DW were combined under (1) wood; metal sheeting, structural components, and rebars from concrete buildings under (2) steel; adobe and brick under (3) bricks, and materials from other types under (4) concrete.
The exact percentages of the abovementioned materials in DW are different based on the type of building demolished. As it was not possible to obtain percentage distributions of materials via observation, percentages based on a detailed literature review were chosen and used. Some of the types of buildings in specific literature can be appropriately classified into one of the types used in the present research. Overall, several papers were reviewed [20,46,47,48,49,50,51,52,53,54], and the average percentages of materials were retrieved. For the present research, five major MOIs from DW were classified based on this literature analysis and they were as follows: (1) steel, (2) concrete, (3) bricks, (4) wood, and (5) miscellaneous. Concrete and steel are responsible for a significant portion of the environmental impact of housing construction [55]. Cement and steel can be responsible for up to 50% of all construction CO2 emissions [56]. Concrete is one of the most abundant materials during construction and demolition processes, accounting for ~61% in the private housing sector [57]. Wood is also one of the largest contributors to DW, accounting anywhere between 9 and 26% of total DW [58]. Bricks are an abundant material that is widely used in the construction of exterior and interior walls, and are usually used as facades, insulation materials, and decorative facing [59]. Finally, the rest of the materials were grouped into the miscellaneous group, which includes materials such as insulation, glass, aluminum, plastics, and ceramics.
2.4. Material Weight Estimation Based on Building Dimensions
The calculation of the weight of MOI was performed in three main steps: (1) calculation of the weight percentage of each MOI in a building type (see Section 2.3); (2) calculation of the volume of each building; (3) calculation of the tentative volume of each MOI, summarizing, and calculating the real estimated weight of each MOI. The general methodology can be seen in Figure 2.
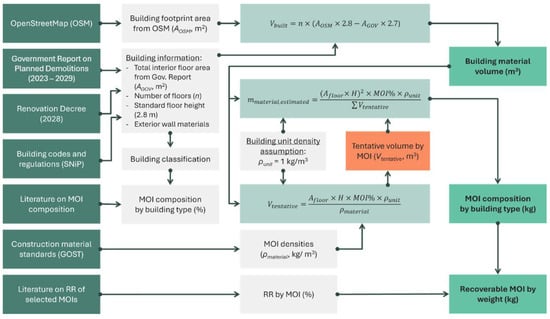
Figure 2.
Flowchart of the proposed methodology.
The second step is to estimate the total volume of the building. Although the floor areas of buildings were retrieved from governmental demolition reports, as previously mentioned, the reported floor areas of the buildings were not reliable because they reported a combined floor area of all apartments in the building instead of the physical footprint of the building (i.e., reports representing open space inside the building that may not lead to proper estimates). Therefore, for better identification of the real floor area, OpenStreetMap (OSM) floor areas were used instead, unlike government reports, the OSM floor area represents the entire building floor area. Consequently, the real building floor area could be obtained by subtracting the government-reported area from the OSM-derived area, i.e., by performing so, the area of the exterior and interior walls can be calculated. The obtained area was finally multiplied by the average height of the building. The height of the building was obtained by multiplying the number of floors from the government report by the height of the floor. As a final step, slab volumes were added. Due to a lack of information about the height of each floor in each building, a standard value of 2.7 m from SNiP 2.08.01-89 was used [60]. Additionally, an assumption of 100 mm was taken for floor slabs.
The third step is the conversion of volume data into the weight data. The obtained MOI percentages are weight-based rather than volume-based. It can be expected that weight percentages might not be translated into volume percentages due to vastly different densities of materials. For the conversion of data, an assumption of building unit density was made. First, by assuming that the building has a unit density of 1 kg/m3, the volume of the building could be converted into weight. After that, the following equations were introduced:
where is the tentative volume of the given MOI, is the volume of the building, is the unit density of the building (1 kg/m3), is the percentage of the given material MOI in the given building type, is the sum of all tentative MOI volumes for the given building, is the material-specific density (kg/m3), and is an estimated MOI weight for the given building, respectively. For densities of materials, reference values from SNiPs and [61,62,63] other standards [64] were used. Overall, the selected average densities for materials were as follows: (all in kg/m3): 7850 for steel, 2350 for concrete, 1600 for brick, 700 for wood, and 400 for miscellaneous materials.
2.5. Recoverable Percentage of Materials of Interest
The exact quantity of available materials in housing scheduled to be demolished is complex to estimate. Depending on the efficiency of demolition and overall wear of the building, recoverable rates (RR) of materials might be different from project to project. Usually, RR is calculated based on the current state of recycling and recovery of DW in a given location. It is worth noting that while the term recycling rate is the proportion of DW recycled into secondary raw materials which are re-introduced into production processes, RR is a more encompassing term which includes recycling and direct reuse. However, in the case of Kazakhstan, it is difficult to estimate the exact RR due to a lack of information on the recycling of DW or its reuse cases. Therefore, for a recoverability rate estimation, a literature review tool was implemented. For that purpose, several papers were reviewed [6,21,65,66,67,68,69,70,71,72,73,74,75,76].
An important part of the research focused on the RR of DW in general [6,72,75]. Values for RR fell into a wide range between 37% and 98%, depending on the region where the case study was performed. However, the given range includes a limited number of countries (the data available were mostly from European Union (EU) member countries and general data from other countries were not available). Material-specific values for RR were more difficult to find. In general, RRs were reported by governmental reports and legislative plans (similar to the EU plan to recycle DW by 70% up until 2021) [71,72,76], whereas material-specific RRs were reported by individual research [21,67] based on case studies on different buildings. Most of these studies covered MOIs also used in the present research.
2.6. Financial Assessment of Demolition Waste (DW)
The economic quantification of DW can be related to construction activities occurring in a country, as shown in the example of Hong Kong, where waste quantities started to decrease with the drop in the percentage of GDP contributed by the construction sector [77]. Similar conclusions were drawn by [78,79]. In the present research, a methodology developed by [78] was adopted. The paper investigates the relationship between GDP and CDW generation by employing ratios that correlate economic indicators with waste production. Specifically, it calculates CDW per construction GDP, expressed in metrics like tons per million USD. This approach provides a comparative framework to analyze CDW generation across countries with varying economic scales. Additionally, it considers other factors like construction turnover and capita to identify trends and disparities in CDW output. By linking economic activity with waste production, this methodology facilitates regional and international benchmarking, highlighting how economic growth and construction intensity influence waste generation.
2.7. Processing Capacity Assessment for DW
To compare the capacity of the crushing complex in Astana with the DW estimates, the following calculations were made. For comparison, only wood, brick, and concrete estimates were chosen, as these materials can be accepted at the facility. Then, the calculated estimates for these DW types for years 2023–2029 were converted to mass per year, by dividing the estimated values by the number of years. Then, using the values of density presented in Section 2.4, the average volumes of wood, brick, and concrete generated per year were calculated.
3. Results and Discussion
3.1. Percentages of MOI
The application of the proposed methodology yielded the overall results presented in Table 1 for five major MOIs from DW that were previously classified: (1) steel, (2) concrete, (3) bricks, (4) wood, and (5) miscellaneous.

Table 1.
Final percent values (by weight) for each material and building type.
3.2. Recovery Rate
Based on the literature review, two tables for recoverable percentages were created. Table 2 shows recoverable percentages for each MOI and demonstrates that different materials may have a wide range of RRs. Moreover, there is a difference in percentages for the same material, which seems to be influenced by the location of each study. As presented, most studies have been performed in the EU countries, along with some others from the United Kingdom (UK) and Japan. It can be clearly observed that overall, across EU, RR tends to be relatively high (68–98%). The UK tends to lag behind with only 6–30% RR. Japan is somewhere in between, producing higher RR for certain materials such as concrete (96%) and lower for others, such as wood and wooden structures (38%). Overall, such dispersion in values could be related to stronger legislative control in the EU zone than in non-EU countries.
Table 2.
Recovery rate (RR) percentages of materials of interest from demolition waste.
Table 3 presents the overall potential RRs percentages for DW from the literature. These rates are variable based on the location. Overall, the average of the values in Table 2 is 59%, indicating a similar general RR to the average of the values in Table 3, which is 57%. It has been observed that in the EU zone, values of RR tend to differ notably. Countries with higher reputation in waste management, such as Germany and Belgium, illustrate the highest RR values, whereas others, such as Spain and Portugal, demonstrate much lower RR values, possibly due to less strict implementation of regulations, unequal distribution of infrastructure, and relatively lower investments in recycling technologies and facilities.
Table 3.
Potential RRs for construction and demolition waste from the literature.
For the remainder of the calculations, for the MOI with available average RR values (i.e., steel, concrete, wood, bricks), the values indicated in Table 2 were used (22%, 91%, 37%, and 46%, respectively). For the ‘miscellaneous’ group, the average of the values in Table 3 (57%) was used as the recovery percentage.
3.3. Total Amount of DW Between 2023–2029
The total amount of DW produced between 2023 and 2029 in the city of Astana was estimated to be 2571 thousand tons, of which 2.32% is steel, 41.67% is concrete, 11.25% are bricks, 5.43% is wood, and 39.33% are miscellaneous materials. Of the total weight, 67.52% or 1736 thousand tons are estimated to be recoverable. Among the selected MOIs, concrete comprised more than half of all recoverable material (Figure 3). The total weight of each MOI before and after the recovery rate can be observed in Figure 4. Recoverable weights of materials were as follows: 13.17 thousand tons for steel, 975.13 thousand tons for concrete, 107.01 thousand tons for bricks, 64.62 thousand tons for wood, and 576.54 thousand tons for miscellaneous. On average, it can be expected that, per year, 289.41 thousand tons of DW could be recovered.
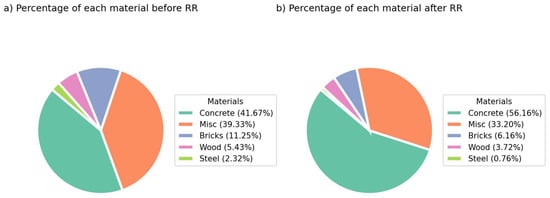
Figure 3.
Percentages of each MOI for (a) before recovery rate and (b) after recovery rate.
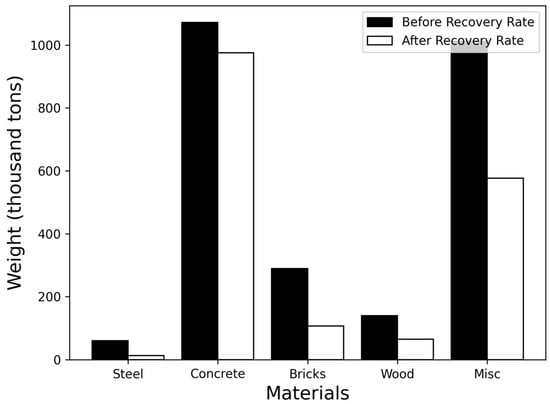
Figure 4.
Weight of each MOI in thousand tons before and after recovery rate in Astana, Kazakhstan for 2023–2029.
3.4. Financial Value of DW
The financial aspect of DW is one of the most important and challenging aspects of DW management. Generally, recycled DW materials face a main barrier in the form of competition with raw materials of high availability and low cost [73]. Thus, for proper implementation of the recovery of DW materials, it may be necessary to undertake proper legislative support for recycled materials. For recycled materials to be competitive, prices for raw materials should be noticeably higher than those of recycled ones. However, as an example, it has been reported that on average, recycled aggregate concrete is 10% more expensive compared to natural aggregate concrete [80]. Due to the apparent financial disadvantages related to some recycled materials, for a proper financial assessment of DW, it is necessary to assume the existence of legislative backup for recycled DW materials in financial terms.
Kazakhstan’s construction sector made up approximately 15 billion USD to the total GDP in the second quarter of 2023, which makes up approximately 7.6% of the entire economy in the country [81]. In the same year, it was reported that the total amount of waste from the construction sector in Kazakhstan reached 634 thousand tons [82].
Given that DW constitutes the predominant share of CDW [2], analyses of CDW generation are, in practice, largely reflective of DW trends. In this respect, discussions of the relationship between CDW and construction sector GDP can be interpreted as implicitly referring to DW. The annual CDW generated vs. the annual construction sector GDP of Kazakhstan compared to other countries can be seen in Figure S1 in Supplementary Material [81,83]. As can be seen, Kazakhstan has one of the highest ratios in terms of the amount of CDW and the economic contribution of the construction sector. On average, in Kazakhstan, the value of each ton of CDW is approximately USD 16,204.
To summarize, Kazakhstan has a relatively high value of DW compared to several developed countries. The cost of DW might illustrate a potential area of interest for the stakeholders, which could potentially turn into a lucrative enterprise if the necessary conditions are met.
3.5. Capacity to Deal with DW Within Current Waste Management Context
Overall, the current capacity of the national system to handle the expected quantities of DW seems insufficient. In 2023, “Severnaya Gryada”, the first quarry for accepting, processing, and burying DW opened in Astana for a fee of KZT 1300 (approx. USD 3 as of 2023) per ton [84]. The company ‘Astana Recycling Development’, that manages this facility, stated that common CDW accepted included littered soil, asphalt, stone materials, brick, concrete, reinforced concrete, ceramic tiles, and wood [85]. A crushing complex with a capacity of 96,000 m3 per year processes this waste, although information on further applications or operations regarding the crushed waste remains unspecified.
The average volumes of wood, brick, and concrete generated per year are shown in Table 4.
Table 4.
The average volume of DW per year from wood, brick, and concrete in m3.
The final DW volume for wood, brick, and concrete is calculated to be 139,348 m3 per year, while the capacity of the crushing complex is 96,000 m3. This indicates that the crushing complex alone is not sufficient to deal with the generated DW in Astana—at least one more unit of the same crushing complex is required.
CIS countries, in general, have important limitations in both regulatory frameworks and the presence and state of existing recovery facilities [86]. It seems that in Kazakhstan, in terms of rules and regulations regarding the handling of DW, there is a lack of effective DW management measures. To the authors’ knowledge, one clear requirement is the Environmental Code of Kazakhstan [87], which requires separation of CDW at the site or a special place (Article 376) and the registration of all waste types and locations in a governmental waste cadastre (Article 382). In March 2024, the Prime Minister of Kazakhstan announced the launch of 37 new municipal solid waste processing facilities across major cities, supplementing the existing eight facilities, but did not mention any specific DW processing facilities [88]. Finally, a key factor in DW reuse/recycling is the attitude of construction companies. Most companies in Kazakhstan choose landfill disposal over reuse or recycling as the costs are lower and there is a lack of information on waste management options [89]. Encouragement of reuse/recycling options via subsidies may help shift this attitude while providing large benefits to the environment and the economy via the conservation of natural resources, limiting imports, and reducing emissions.
3.6. Options for Reuse and Recycling
In general, cement-based waste is crushed and used as recycled aggregates as a substitute for natural aggregates. For example, coarse recycled aggregates from concrete and bricks produce strength-bearing concrete [90], fine recycled aggregates produce non-strength-bearing concrete [91], and recycled aggregates produce filling materials [92] and for backfilling with additional property-enhancing methods [10].
One study explored the optimum CDW aggregate-to-natural sand content in mortar coatings. Although an increase in recycled aggregate content in mortar increases mechanical strength, one study suggested that a 25% substitution is optimal due to the higher porosity and water absorption of the mortar at higher substitution rates [93]. The mechanical strength at 25% substitution was lower than Kazakhstan’s minimum requirement of 4 MPa for mortar coatings, which may have been a consequence of a chosen mix of proportions in the study. Also, the properties of recycled aggregates from mixed DW with natural sand were compared, and the results revealed a similar size distribution, higher density in recycled sand, and higher water absorption, which is undesirable for sand behavior [94]. The recycled sand met Kazakhstan’s natural sand standards regarding grain size and density; however, water absorption is not mentioned. Concrete made of recycled coarse aggregates with regular concrete, where a 30% substitution rate of natural coarse aggregates with DW aggregates results in optimal mechanical and physical properties [95]. The mechanical performance of the given material is found to be equivalent to the mechanical properties of type M100 concrete, and is therefore acceptable for curbs, walkways, and parking lots. In regard to geotechnical applications, it was found that high-strength concrete waste performed better as filling material, while for pavement layers recycled aggregates caused susceptibility to frost in pavement layers [92], making them unsuitable for application in Astana’s extreme weather conditions.
In terms of reusing CDW for geotechnical purposes in Astana, there is a potential difficulty in separating low-strength and high-strength concrete for filling purposes. Due to the lack of CDW processing facilities, it would be difficult to separate the two types of concrete, considering that the waste is mixed on-site. For pavement layers, due to susceptibility to frost, further studies are required to examine the behavior of recycled aggregates under extreme climate conditions in Astana.
The summary of reference values for RR (Table 5) reveals some information on the variability and uncertainty of the dataset associated with the analyzed material categories. Concrete has relatively consistent RR, explained by low relative standard deviation (RSD); while wood has a bit higher RR, and thus, variability (may be associated with the naturally varying properties of the material). The data for the remaining material categories (brick, steel, miscellaneous) exhibit more uncertainty. For brick and steel, this is mainly due to the limited number of data sources, whereas for miscellaneous category, considerable uncertainty (as well as variability) seems to exist despite the large number of data sources, due to the diverse material types grouped under this category, which may differ across each reference source.
Table 5.
Summary of reference values for recovery rates used in the present study.
3.7. Study Limitations
The present study has the following limitations: Firstly, the proposed method is based on several assumptions. To the authors’ best judgment, these hold true at the time of the study. However, future applications should clearly state all assumptions and then verify these assumptions for their specific case. Secondly, we have not performed a case study of material composition percentages due to scope and resource limitations. In particular, the material category ‘miscellaneous’ is large, and our application of a single recovery rate to this category is an oversimplification that potentially negatively affects the results. It is thus recommended to perform a separate study to investigate the actual compositions, and then to verify and further fine-tune waste quantities and compositions based on site data. Thirdly, the accuracy and consistency of OSM data have not been validated everywhere. OSM managed to provide data for Astana for every building in the government reports of demolition; however, future applications of the proposed method would require data availability and validation based on the location. Verifying OSM data would also increase confidence in the results. Lastly, as previously mentioned, CIS countries tend to have limitations in terms of waste recovery capability and regulatory framework. Such limitations may also exist in future applications of the proposed methodology, based on the location. Therefore, while recovery is technically feasible, the findings may not fully translate into practical outcomes under current conditions.
4. Conclusions
The present study underscores the critical need for a more systematic approach to managing demolition waste (DW) in rapidly transforming urban zones, such as in the case application of the proposed methodology: Astana, Kazakhstan. The proposed estimation tool quantified recoverable materials and is applicable to other cities with similar characteristics. For Astana, between 2023 and 2029, about 2571 thousand tons of DW is projected, of which 67.5% (1737 thousand tons) are recoverable. Key fractions include concrete (162.4 thousand tons annually), wood (10.8 thousand tons), steel (2.2 thousand tons), and bricks (17.8 thousand tons). Concrete, with a 91% recovery rate, offers the highest economic potential (USD 2631 million annually). However, Kazakhstan’s infrastructure and regulatory frameworks currently remain insufficient, with existing facilities unable to meet projected volumes. At least two additional processing units, alongside stronger regulations and incentives, seem needed to bridge the gap and promote recovery (i.e., reuse/recycle) over landfilling.
Overall, the estimates provided in the present work, along with the financial analysis, underscore the untapped potential of DW as an economic resource in Astana, Kazakhstan, and as well as in other similar urban zones under rapid transformation. For these zones, the economic value of DW is likely high and thus highlights an opportunity to monetize recovered materials while reducing dependency on raw resources.
With minor methodological adjustments, the proposed tool can be readily applied to other countries or regions undergoing similar rapid development, including the CIS region. The key steps include obtaining governmental reports on buildings planned for demolition, establishing building types based on year of construction or class of building, and estimating the percentage composition of materials of interest for each building type. Recovery rate values could be directly transferred in cases of comparable building types, and if not, new recovery rate percentages could be recalculated to match local conditions.
Supplementary Materials
The following supporting information can be downloaded at: https://www.mdpi.com/article/10.3390/su17219686/s1, Figure S1: Scatter plot of annual CDW (thousand tons) vs. annual construction sector GDP (USD million).
Author Contributions
Conceptualization, A.N. and M.G.; Funding Acquisition, J.R.K. and M.G.; Methodology, A.N., M.G., and A.K.; Data Curation, A.N. and A.A.; Writing—Original Draft Preparation, A.N. and A.A.; Writing—Review and Editing, A.N., M.G., A.K., and J.R.K.; Visualization, A.N. and A.K.; Supervision, M.G. and A.K. All authors have read and agreed to the published version of the manuscript.
Funding
We acknowledge the financial support provided by Nazarbayev University Research Fund under Grant No. 20122022FD4108.
Institutional Review Board Statement
Not applicable.
Informed Consent Statement
Not applicable.
Data Availability Statement
The original contributions presented in this study are included in the article/Supplementary Materials. Further inquiries can be directed to the corresponding author.
Conflicts of Interest
The authors have no competing interests to declare that are relevant to the content of this article.
References
- Zhao, X. Stakeholder-Associated Factors Influencing Construction and Demolition Waste Management: A Systematic Review. Buildings 2021, 11, 149. [Google Scholar] [CrossRef]
- U.S. Environmental Protection Agency. Sustainable Management of Construction and Demolition Materials; 2025. Available online: https://www.epa.gov/smm/sustainable-management-construction-and-demolition-materials (accessed on 29 September 2025).
- George, M.; Simpeh, E.; Smallwood, J. Sustainable Waste Management Practices During Construction Projects. In Smart and Sustainable Cities and Buildings; Springer: Cham, Switzerland, 2020; pp. 551–570. [Google Scholar] [CrossRef]
- Department of Climate Change, Energy, the Environment and Water (DCCEEW). Construction and Demolition Waste Status Report—Management of Construction and Demolition Waste in Australia. 2022. Available online: https://www.dcceew.gov.au/environment/protection/waste/publications/construction-and-demolition-waste-status-report (accessed on 3 April 2024).
- Nagapan, S.; Rahman, I.A.; Asmi, A.; Memon, A.H.; Latif, I. Issues on construction waste: The need for sustainable waste management. In Proceedings of the 2012 IEEE Colloquium on Humanities, Science and Engineering (CHUSER), Kota Kinabalu, Malaysia, 3–4 December 2012. [Google Scholar] [CrossRef]
- Ginga, C.P.; Ongpeng, J.M.; Daly, M.K. Circular economy on construction and demolition waste: A literature review on material recovery and production. Materials 2020, 13, 2970. [Google Scholar] [CrossRef] [PubMed]
- Akhtar, A.; Sarmah, A.K. Construction and demolition waste generation and properties of recycled aggregate concrete: A global perspective. J. Clean. Prod. 2018, 186, 262–281. [Google Scholar] [CrossRef]
- Oh, D.-Y.; Noguchi, T.; Kitagaki, R.; Park, W.-J. CO2 emission reduction by reuse of building material waste in the Japanese cement industry. Renew. Sustain. Energy Rev. 2014, 38, 796–810. [Google Scholar] [CrossRef]
- USGS. Cement statistics and information. U.S. Geological Survey. 2017. Available online: https://www.usgs.gov/centers/national-minerals-information-center/cement-statistics-and-information (accessed on 10 April 2024).
- Shi, C.; Li, Y.; Zhang, J.; Li, W.; Chong, L.; Xie, Z. Performance enhancement of recycled concrete aggregate—A review. J. Clean. Prod. 2015, 112, 466–472. [Google Scholar] [CrossRef]
- Contreras, M.; Teixeira, S.; Lucas, M.; Lima, L.; Cardoso, D.; Da Silva, G.; Gregório, G.; De Souza, A.; Santos, A.D. Recycling of construction and demolition waste for producing new construction material (Brazil case-study). Constr. Build. Mater. 2016, 123, 594–600. [Google Scholar] [CrossRef]
- Jamil, S.; Idrees, M.; Akbar, A.; Ahmed, W. Investigating the Mechanical and Durability Properties of Carbonated Recycled Aggregate Concrete and Its Performance with SCMs. Buildings 2025, 15, 201. [Google Scholar] [CrossRef]
- Junior, G.A.F.; Leite, J.C.T.; Mendez, G.d.P.; Haddad, A.N.; Silva, J.A.F.; da Costa, B.B.F. A Review of the Characteristics of Recycled Aggregates and the Mechanical Properties of Concrete Produced by Replacing Natural Coarse Aggregates with Recycled Ones—Fostering Resilient and Sustainable Infrastructures. Infrastructures 2025, 10, 213. [Google Scholar] [CrossRef]
- Grigorjev, V.; Azenha, M.; De Belie, N. Towards Sustainable Masonry Construction Through Natural Aggregate Replacement by Fine Recycled Aggregates in Cement–Lime Mortars. Sustainability 2025, 17, 1269. [Google Scholar] [CrossRef]
- Yan, J.; Gao, Y.; Fan, T.; Xu, Q.; Yuan, W.; Zhao, X. Experimental study on flexural performance of recycled steel fiber concrete beams. Buildings 2023, 13, 3046. [Google Scholar] [CrossRef]
- Kong, X.; Yao, Y.; Wu, B.; Zhang, W.; He, W.; Fu, Y. The impact resistance and mechanical properties of recycled aggregate concrete with hooked-end and crimped steel fiber. Materials 2022, 15, 7029. [Google Scholar] [CrossRef] [PubMed]
- Amarasinghe, I.T.; Qian, Y.; Gunawardena, T.; Mendis, P.; Belleville, B. Composite Panels from Wood Waste: A Detailed Review of Processes, Standards, and Applications. J. Compos. Sci. 2024, 8, 417. [Google Scholar] [CrossRef]
- Silva, R.V.; de Brito, J.; Dhir, R.K. Availability and processing of recycled aggregates within the construction and demolition supply chain: A review. J. Clean. Prod. 2017, 143, 598–614. [Google Scholar] [CrossRef]
- Li, X.; Huang, R.; Dai, J.; Li, J.; Shen, Q. Research on the evolutionary game of construction and demolition waste (CDW) recycling units’ green behavior, considering remanufacturing capability. Int. J. Environ. Res. Public Health 2021, 18, 9268. [Google Scholar] [CrossRef]
- Cochran, K.; Townsend, T.; Reinhart, D.; Heck, H. Estimation of regional building-related C&D debris generation and composition: Case study for Florida, US. Waste Manag. 2007, 27, 921–931. [Google Scholar] [CrossRef]
- Christensen, T.B.; Johansen, M.R.; Buchard, M.V.; Glarborg, C.N. Closing the material loops for construction and demolition waste: The circular economy on the island Bornholm, Denmark. Resour. Conserv. Recycl. Adv. 2022, 15, 200104. [Google Scholar] [CrossRef]
- Coelho, A.; de Brito, J. Distribution of materials in construction and demolition waste in Portugal. Waste Manag. Res. J. A Sustain. Circ. Econ. 2010, 29, 843–853. [Google Scholar] [CrossRef]
- Tokazhanov, G.; Galiyev, O.; Lukyanenko, A.; Nauyryzbay, A.; Ismagulov, R.; Durdyev, S.; Turkyilmaz, A. Circularity assessment tool development for construction projects in emerging economies. J. Clean. Prod. 2022, 362, 132293. [Google Scholar] [CrossRef]
- Li, D.; Peng, Y.; Guo, C.; Tan, R. Pricing Strategy of Construction and Demolition Waste Considering Retailer Fairness Concerns under a Governmental Regulation Environment. Int. J. Environ. Res. Public Health 2019, 16, 3896. [Google Scholar] [CrossRef]
- European Commission. Guidelines for the Waste Audits before Demolition and Renovation Works of Buildings; EU Construction and Demolition Waste Management: Brussels, Belgium, 2018. [Google Scholar]
- Petrović, E.K.; Thomas, C.A. Global Patterns in Construction and Demolition Waste (C&DW) Research: A Bibliometric Analysis Using VOSviewer. Sustainability 2024, 16, 1561. [Google Scholar] [CrossRef]
- Marcellus-Zamora, K.A.; Gallagher, P.M.; Spatari, S. Can Public Construction and Demolition Data Describe Trends in Building Material Recycling? Observations From Philadelphia. Front. Built Environ. 2020, 6, 131. [Google Scholar] [CrossRef]
- Butera, S.; Christensen, T.H.; Astrup, T.F. Life cycle assessment of construction and demolition waste management. Waste Manag. 2015, 44, 196–205. [Google Scholar] [CrossRef] [PubMed]
- Barbhuiya, S.; Das, B.B. Life cycle assessment of construction materials: Methodologies, applications and future directions for sustainable decision-making. Case Stud. Constr. Mater. 2023, 19, e02326. [Google Scholar] [CrossRef]
- Younis, A.; Dodoo, A. Cross-laminated timber for building construction: A life-cycle-assessment overview. J. Build. Eng. 2022, 52, 104482. [Google Scholar] [CrossRef]
- Duan, Z.; Huang, Q.; Zhang, Q. Life cycle assessment of mass timber construction: A review. Build. Environ. 2022, 221, 109320. [Google Scholar] [CrossRef]
- Kim, Y.-C.; Hong, W.-H.; Park, J.-W.; Cha, G.-W. An estimation framework for building information modeling (BIM)-based demolition waste by type. Waste Manag. Res. 2017, 35, 1289–1300. [Google Scholar] [CrossRef]
- Han, D.; Kalantari, M.; Rajabifard, A. Building Information Modeling (BIM) for Construction and Demolition Waste Management in Australia: A Research Agenda. Sustainability 2021, 13, 12983. [Google Scholar] [CrossRef]
- Eadie, R.; Browne, M.; Odeyinka, H.; McKeown, C.; McNiff, S. BIM implementation throughout the UK construction project lifecycle: An analysis. Autom. Constr. 2013, 36, 145–151. [Google Scholar] [CrossRef]
- Kaewunruen, S.; Lin, Y.-H.; Guo, Y. BIM-driven digital twin for demolition waste management of existing residential buildings. Sci. Rep. 2025, 15, 28989. [Google Scholar] [CrossRef]
- Ortlepp, R.; Gruhler, K.; Schiller, G. Materials in Germany’s domestic building stock: Calculation model and uncertainties. Build. Res. Inf. 2016, 46, 164–178. [Google Scholar] [CrossRef]
- Blengini, G.A. Life cycle of buildings, demolition and recycling potential: A case study in Turin, Italy. Build. Environ. 2009, 44, 319–330. [Google Scholar] [CrossRef]
- Ortlepp, R.; Gruhler, K.; Schiller, G. Material stocks in Germany’s non-domestic buildings: A new quantification method. Build. Res. Inf. 2015, 44, 840–862. [Google Scholar] [CrossRef]
- Kleemann, F.; Lederer, J.; Aschenbrenner, P.; Rechberger, H.; Fellner, J. A method for determining buildings’ material composition prior to demolition. Build. Res. Inf. 2014, 44, 51–62. [Google Scholar] [CrossRef]
- Kleemann, F.; Lederer, J.; Rechberger, H.; Fellner, J. GIS-based analysis of Vienna’s material stock in buildings. Res. Anal. 2016, 21, 368–380. [Google Scholar] [CrossRef]
- Tanikawa, H.; Managi, S.; Lwin, C.M. Estimates of lost material stock of buildings and roads due to the Great East Japan Earthquake and Tsunami. J. Ind. Ecol. 2014, 18, 421–431. [Google Scholar] [CrossRef]
- Bureau of National Statistics. Demography. 2025. Available online: https://stat.gov.kz/en/industries/social-statistics/demography/ (accessed on 22 January 2025).
- Akanbi, L.A.; Oyedele, L.O.; Akinade, O.O.; Ajayi, A.O.; Delgado, M.D.; Bilal, M.; Bello, S.A. Salvaging building materials in a circular economy: A BIM-based whole-life performance estimator. Resour. Conserv. Recycl. 2017, 129, 175–186. [Google Scholar] [CrossRef]
- Department of Housing and Housing Inspection of the City of Astana. List of Dilapidated Houses in the City of Astana Subject to Demolition as Part of the Implementation of the Housing Renovation Project for 2023–2029. 2023. Available online: https://www.gov.kz/memleket/entities/astana-uzh/press/news/details/586289?lang=ru (accessed on 3 July 2024).
- Smailov, A. On Approval of the State Renovation Program and Modernization of the Housing Stock of the City of Astana Until 2028. 2023. Available online: https://legalacts.egov.kz/npa/view?id=14706114 (accessed on 12 June 2024).
- Wu, H.; Duan, H.; Zheng, L.; Wang, J.; Niu, Y.; Zhang, G. Demolition waste generation and recycling potentials in a rapidly developing flagship megacity of South China: Prospective scenarios and implications. Constr. Build. Mater. 2016, 113, 1007–1016. [Google Scholar] [CrossRef]
- Yu, B.; Wang, J.; Li, J.; Zhang, J.; Lai, Y.; Xu, X. Prediction of large-scale demolition waste generation during urban renewal: A hybrid trilogy method. Waste Manag. 2019, 89, 1–9. [Google Scholar] [CrossRef]
- Li, J.; Ding, Z.; Mi, X.; Wang, J. A model for estimating construction waste generation index for building projects in China. Resour. Conserv. Recycl. 2013, 74, 20–26. [Google Scholar] [CrossRef]
- Llatas, C. A model for quantifying construction waste in projects according to the European Waste List. Waste Manag. 2011, 31, 1261–1276. [Google Scholar] [CrossRef]
- Reixach, F.M.; Gonzàlez, J.M.; Sagrera, A.; Casado, I. Plan de Gestión de Residuos en las Obras de Construcción y Demolición: Proyecto LIFE 98/351, Programa de Acciones Técnicas Para Fomentar la Valorización, Minimización y Selección de Residuos Originados en las Obras de Construcción y Demolición; Institut de Tecnologia de la Construcció de Catalunya (ITeC): Barcelona, Spain, 2000; ISBN 84-7853-393-1. [Google Scholar]
- Villoria Sáez, P.; Porras-Amores, C.; del Río Merino, M. New quantification proposal for construction waste generation in new residential constructions. J. Clean. Prod. 2015, 102, 58–65. [Google Scholar] [CrossRef]
- Coelho, A.; de Brito, J. Generation of construction and demolition waste in Portugal. Waste Manag. Res. J. A Sustain. Circ. Econ. 2011, 29, 739–750. [Google Scholar] [CrossRef]
- Cochran, K.M.; Townsend, T.G. Estimating construction and demolition debris generation using a materials flow analysis approach. Waste Manag. 2010, 30, 2247–2254. [Google Scholar] [CrossRef]
- General Secretariat of the Environment. Plan Nacional de Residuos de Construcción y Demolición (PNRCD) 2001–2006. Boletín Of. Estado (BOE) 2001, 145, 21855–21863. [Google Scholar]
- Carpio, M.; Roldán-Fontana, J.; Pacheco-Torres, R.; Ordóñez, J. Construction waste estimation depending on urban planning options in the design stage of residential buildings. Constr. Build. Mater. 2016, 113, 561–570. [Google Scholar] [CrossRef]
- Pacheco-Torres, R.; Jadraque, E.; Roldán-Fontana, J.; Ordóñez, J. Analysis of CO2 emissions in the construction phase of single-family detached houses. Sustain. Cities Soc. 2014, 12, 63–68. [Google Scholar] [CrossRef]
- Asif, M.; Muneer, T.; Kelley, R. Life cycle assessment: A case study of a dwelling home in Scotland. Build. Environ. 2007, 42, 1391–1394. [Google Scholar] [CrossRef]
- Villoria Sáez, P.; Santa Cruz Astorqui, J.; del Río Merino, M.; del Pilar Mercader Moyano, M.; Rodríguez Sánchez, A. Estimation of construction and demolition waste in building energy efficiency retrofitting works of the vertical envelope. J. Clean. Prod. 2018, 172, 2978–2985. [Google Scholar] [CrossRef]
- Hollberg, A.; Tschetwertak, J.; Schneider, S.; Habert, G. Design-integrated LCA using early BIM. Des. Sustain. Technol. Prod. Policies 2018, 269–279. [Google Scholar] [CrossRef]
- SNiP 2.08.01-89; Жилые Здания (Residential Buildings). Gosstroy Rossii: Moscow, Russia, 1999.
- NTP RK 02-01-1.1-2011; Design of Concrete and Reinforced Concrete Structures from Heavy Concrete Without Pre-Stressing Reinforcement. KazNIISA: Almaty, Kazakhstan, 2011.
- GOST 530-2012; Ceramic Brick And Stone. General Specifications. Interstate Standard: Moscow, Russia, 2012.
- GOST 2140-81; Visible Defects in Wood Classification, Terms and Definitions, Methods of Measurement. Interstate standard: Moscow, Russia, 2006.
- STB 1704-2012; Non-Prestressed Reinforcement for Reinforced Concrete Structures. Gosstandart of the Republic of Belarus: Minsk, Belarus, 2012.
- Waste & Resources Action Programme. WRAP Reclaimed Building Products Guide; Waste & Resources Action Programme: Banbury, UK; Oxon, UK, 2008; pp. 1–80. [Google Scholar]
- Cooper, D.R.; Allwood, J.M. Reusing steel and aluminum components at end of product life. Environ. Sci. Technol. 2012, 46, 10334–10340. [Google Scholar] [CrossRef]
- Schultmann, F. Sustainable Deconstruction of Buildings. In Smart & Sustainable Built Environments; Yang, J., Brandon, P.S., Sidwell, A.C., Eds.; Blackwell Publishing: Oxford, UK, 2005; pp. 148–160. [Google Scholar]
- Nakajima, S.; Arikawa, S.; Koga, J. The State of Deconstruction in Japan. In Deconstruction and Materials Reuse: An International Overview; Chini, A.R., Ed.; Building Research Establishment (BRE): Watford, UK, 2005; CIB Publication 300; pp. 100–140. [Google Scholar]
- Eunomia Research & Consulting Ltd. Study to Identify Member States at Risk of Non-Compliance with the 2020 Target of the Waste Framework Directive and to Follow-Up Phase 1 and 2 of the Compliance Promotion Exercise—Final Report; European Commission, DG Environment: Brussels, Belgium, 2018; Contract No. 070201/2017/766886/SER/ENV.B.3; Available online: https://eedsa.gr/site/wp-content/uploads/2019/01/Early-Warning-System_Final_Report.pdf (accessed on 3 April 2024).
- Eurostat. The Recovery Rate of Construction and Demolition Waste. 2023. Available online: https://data.europa.eu/data/datasets/uczdo4z1o5qcllbdtbkhq?locale=en (accessed on 3 April 2024).
- Deloitte. Resource Efficient Use of Mixed Wastes: Improving Management of Construction and Demolition Waste—Final Report; European Commission, DG ENV: Brussels, Belgium, 2017; Specific Contract No. 07.027727/2014/S12.697004 IETUJENV.A2; Available online: https://op.europa.eu/en/publication-detail/-/publication/78e42e6c-d8a6-11e7-a506-01aa75ed71a1/language-en (accessed on 3 April 2024).
- Galán, B.; Viguri, J.R.; Cifrian, E.; Dosal, E.; Andres, A. Influence of input streams on the construction and demolition waste (CDW) recycling performance of basic and advanced treatment plants. J. Clean. Prod. 2019, 236, 117523. [Google Scholar] [CrossRef]
- Dahlbo, H.; Bachér, J.; Lähtinen, K.; Jouttijärvi, T.; Suoheimo, P.; Mattila, T.; Sironen, S.; Myllymaa, T.; Saramäki, K. Construction and demolition waste management—A holistic evaluation of environmental performance. J. Clean. Prod. 2015, 107, 333–341. [Google Scholar] [CrossRef]
- Hurley, J.; Hobbs, G. Deconstruction and Materials Reuse: An International Overview. In Deconstruction and Materials Reuse: An International Overview; Chini, A.R., Ed.; Building Research Establishment (BRE): Watford, UK, 2005; CIB Publication 300; pp. 1–413. [Google Scholar]
- Moschen-Schimek, J.; Kasper, T.; Huber-Humer, M. Critical review of the recovery rates of construction and demolition waste in the European Union—An analysis of influencing factors in selected EU countries. Waste Manag. 2023, 167, 150–164. [Google Scholar] [CrossRef] [PubMed]
- BIO Service Contract on Management of Construction and Demolition Waste—SR1. 2011. Available online: https://www.btbab.com/wp-content/uploads/documentos/legislacion/UE-BIO_Construction_and_demolition_waste_final_report_09022011.pdf (accessed on 3 April 2024).
- Lu, W.; Tam, V.W.Y. Construction waste management policies and their effectiveness in Hong Kong: A longitudinal review. Renew. Sustain. Energy Rev. 2013, 23, 214–223. [Google Scholar] [CrossRef]
- Villoria Sáez, P.; Porras-Amores, C.; del Río Merino, M. Estimation of construction and demolition waste. In Construction and Demolition Waste; Elsevier: Amsterdam, The Netherlands, 2020; pp. 13–30. [Google Scholar] [CrossRef]
- Tam, V.; Lu, W. Construction waste management profiles, practices, and performance: A cross-jurisdictional analysis in four countries. Sustainability 2016, 8, 190. [Google Scholar] [CrossRef]
- Wijayasundara, M.; Mendis, P.; Zhang, L.; Sofi, M. Financial assessment of manufacturing recycled aggregate concrete in ready-mix concrete plants. Resour. Conserv. Recycl. 2016, 109, 187–201. [Google Scholar] [CrossRef]
- Trading Economics. Kazakhstan GDP from Construction. 2024. Available online: https://tradingeconomics.com/kazakhstan/gdp-from-construction (accessed on 3 April 2024).
- Bureau of National Statistics. Environmental Protection in the Republic of Kazakhstan. 2023. Available online: https://stat.gov.kz/en/ (accessed on 2 April 2024).
- Eurostat. Generation of Waste by Waste Category, Hazardousness, and NACE Rev. 2 Activity. 2024. Available online: https://ec.europa.eu/eurostat/databrowser/view/env_wasgen__custom_15055430/default/table?lang=en (accessed on 19 January 2025).
- Akimat of the City of Astana. Construction Collection Site Launched in Astana. 2023. Available online: https://www.gov.kz/memleket/entities/astana/press/news/details/526466?lang=ru (accessed on 21 July 2024).
- Astana Recycling Development. The First Sanctioned Place in the Republic of Kazakhstan—Site for Storing and Processing Construction Waste in Astana. 2023. Available online: https://astanard.kz/ (accessed on 20 June 2024).
- Turkyilmaz, A.; Guney, M.; Karaca, F.; Bagdatkyzy, Z.; Sandybayeva, A.; Sirenova, G. A Comprehensive Construction and Demolition Waste Management Model using PESTEL and 3R for Construction Companies Operating in Central Asia. Sustainability 2019, 11, 1593. [Google Scholar] [CrossRef]
- № 400-VI; Ecological Code of the Republic of Kazakhstan. Parliament of the Republic of Kazakhstan: Astana, Kazakhstan, 2021. Available online: https://adilet.zan.kz/rus/docs/K2100000400 (accessed on 26 June 2024).
- Official Information Source of the Prime Minister of the Republic of Kazakhstan. 37 New Solid Waste Treatment Plants to be Launched in Kazakhstan. 2024. Available online: https://primeminister.kz/en/news/37-new-solid-waste-treatment-plants-to-be-launched-in-kazakhstan-27502 (accessed on 20 June 2024).
- Nadeem, A.; Khamatova, A.; Hossain, M.A.; Leung, H.Y. Construction and demolition waste management on construction sites in Kazakhstan. In Advances in Science, Technology & Innovation/Advances in Science, Technology & Innovation; Springer: Cham, Switzerland, 2020; pp. 57–62. [Google Scholar] [CrossRef]
- Ajdukiewicz, A.; Kliszczewicz, A. Influence of recycled aggregates on mechanical properties of HS/HPC. Cem. Concr. Compos. 2002, 24, 269–279. [Google Scholar] [CrossRef]
- Evangelista, L.; Brito, J. Mechanical behaviour of concrete made with fine recycled concrete aggregates. Cem. Concr. Compos. 2007, 29, 397–401. [Google Scholar] [CrossRef]
- Cardoso, R.; Silva, R.V.; de Brito, J.; Dhir, R. Use of recycled aggregates from construction and demolition waste in geotechnical applications: A literature review. Waste Manag. 2016, 49, 131–145. [Google Scholar] [CrossRef]
- Azevedo, A.R.G.; Cecchin, D.; Carmo, D.F.; Silva, F.C.; Campos, C.M.O.; Shtrucka, T.G.; Marvila, M.T.; Monteiro, S.N. Analysis of the compactness and properties of the hardened state of mortars with recycling of construction and demolition waste (CDW). J. Mater. Res. Technol. 2020, 9, 5942–5952. [Google Scholar] [CrossRef]
- Ulsen, C.; Antoniassi, J.L.; Martins, I.M.; Henrique, K. High quality recycled sand from mixed CDW: Is that possible? J. Mater. Res. Technol. 2021, 12, 29–42. [Google Scholar] [CrossRef]
- Zhao, Z.; Courard, L.; Groslambert, S.; Jehin, T.; Leonard, A.; Xiao, J. Use of recycled concrete aggregates from precast block for the production of new building blocks: An industrial scale study. Resour. Conserv. Recycl. 2020, 157, 104786. [Google Scholar] [CrossRef]


Disclaimer/Publisher’s Note: The statements, opinions and data contained in all publications are solely those of the individual author(s) and contributor(s) and not of MDPI and/or the editor(s). MDPI and/or the editor(s) disclaim responsibility for any injury to people or property resulting from any ideas, methods, instructions or products referred to in the content. |
© 2025 by the authors. Licensee MDPI, Basel, Switzerland. This article is an open access article distributed under the terms and conditions of the Creative Commons Attribution (CC BY) license (https://creativecommons.org/licenses/by/4.0/).