Abstract
The usability of the natural environment for settlement can be analysed based on geoenvironmental conditions: groundwater levels, terrain elevations, subsoil construction suitability. They are all important elements of urban development planning. Developing a method for selecting areas with favourable construction conditions and determining future urban development trends based on geoenvironmental conditions is essential for proper formation of space for construction purposes. This article presents a proprietary approach to determining geoenvironmental indicators and the ongoing correlational changes in these indicators, which are the basis for choosing optimal areas for construction. The selected geoenvironmental factors influence the development and spatial growth of cities. The research area is located within a small agglomeration inhabited by up to 20,000 residents. Direct results concerning geoenvironmental data and urban development were obtained from an area of 9 km2. Within this area, data were collected on subsoil conditions, terrain elevations, groundwater levels, and the spatial pattern of development throughout the historical evolution of the agglomeration up to the present day. The analysis also identified the points in the city’s development history when local flooding or other environmental hazards occurred, which may have resulted from improper urban growth tendencies. Interpretation of the resulting graphs, particularly the interactions between geoenvironmental conditions (indicators) and development during the studied periods, can support urban planning processes.
1. Introduction
In the development of agglomerations, humans depend on nature by transforming, enriching, or destroying it. Since ancient times, many architects have worked on the most appropriate location of cities within the natural environment. When creating urban space, they have situated buildings in areas considered healthy, with access to potable water, sufficient protection from weather anomalies, fertile soils, and also well connected to neighbouring areas. The environment has dynamic characteristics. The history of civilization is a story of its constant transformation as a result of processes occurring in nature, both independently of and under the influence of human actions. Changes occurring in nature without human load might be very slow; however, they can have a profound impact on the growth of development. Climate change has driven the sprawl of settlements in places considered “more favourable”. Due to an ever-increasing demand for new investment areas, there has been an obvious need to develop methods for determining the suitability of urban areas for further development. Selecting areas favourable for construction purposes prevents the occurrence of disasters in buildings and structures due to environmental loads.
The research problem concerns determining the influence of selected geoenvironmental factors (geotechnical parameters, groundwater, and terrain morphology) on the spatial development of the city and their mutual correlations. The research hypothesis assumes that geoenvironmental conditions have a significant impact on shaping the spatial development of the agglomeration.
The selection of geoenvironmental and infrastructural factors should be related to their parameters, which are described by parameterized indicators. It is considered impossible to strictly distinguish the influence of these factors from other subjective “soft” triggers, such as social relations, trends in preferred residential locations, or access to employment opportunities [1]. Sometimes, the “irresistible urge” to live in a certain place can disrupt the city model being currently implemented and constructed. All actions aimed at developing such a model must be socially acceptable. In extreme situations, however, even a relatively correct urban development model may become depopulated over time due to population outflow to areas seen as “more favourable”. The “soft” criteria used in selecting areas for development indicated the need to establish “hard” rules based on the mathematical formalization of the research problem. Therefore, the process of systematizing environmental data, i.e., topographic, hydrological, geological, and hydrogeological, and its further availability to potential investors is promoted and highly appreciated by decision-making bodies [2]. By indicating the appropriate methodology for selecting areas for construction purposes, identifying the risks associated with developing areas with uncertain, low-bearing soils, and applying the principles of conduct, the investment process can be error-free [3,4]. An example of environmental hazard mapping is provided by the Flood Hazard Maps and Flood Risk Maps of Poland. This example highlights environmental threats resulting from the exceedance of alert levels in natural watercourses [5].
Access to new construction technologies has made it possible to implement plans in even the most technically unfriendly environments.
It can be assumed that the entire area will be a single compact development, although such a model may not be socially acceptable. A balance between a built-up area and a biologically active terrain is a fundamental premise for the attractiveness of places designated for living and working. The essence of these considerations is finding the apogee—the maximum, or sometimes the minimum, of the tolerable development rate.
In all of the complexity of the urban development model, including multiple infrastructure factors, transportation is assumed to be an indispensable basis for the city’s growth.
Attempts to systematize optimal methods for selecting areas for construction purposes may be limited to places that are geologically unstable, particularly prone to landslides. Identifying landslide-prone areas in the process of spatial planning poses a certain challenge [6,7]. Furthermore, diagnosing the causes of damage occurring to buildings in relation to their location in landslide-prone areas and identifying them in hazard maps is also important in the process of forming urban development [8]. Another scientific problem may be to assess the impact of existing environmentally hazardous facilities on areas designated for potential development in the future. A large number of multi-criteria decision support methods [4,9], which can be beneficial in many cases requiring assistance in decision-making situations, is also a helpful element in various investment processes. To illustrate geological phenomena, we often use mathematical methods [10]. Different mathematical models for biological, logical, and ecological processes were applied by researchers already at the beginning of the 20th century [11]. Modelling of urban development to achieve a “sustainable city” is a complex process. Authors point out the essence of a “sustainable city” by emphasizing its independence to “sustain itself over time, to preserve its identity, its collective meaning and long-term dynamism. To project itself into the future, the city needs its entire past, a critical distance from the present, its memory, its heritage, its internal cultural diversity and multidimensional projects” [12]. These components can be cultivated provided that natural and man-induced hazards are eliminated. How sophisticated an analysis of the dynamics of population growth and formation might be with the use of applied mathematics can be illustrated by examples found in the available literature on describing and predicting the phenomena that change over time [13,14]. Analysis of historical phenomena and experiences in the development of agglomerations can be helpful in planning the formation of urban space. Cultural, economic, political, and social development, combined with population growth, often fosters urban consolidation. However, the rapid growth of cities in recent decades contrasts with the slowness with which municipalities are responding to this new reality [15]. The area of subsoil with water resources, which forms the basis for the development—in accordance with the principles regulating construction—can also be subject to mathematical modelling processes for the purpose of studying phenomena occurring in groundwater [16,17]. The creation of urban space and its development as a construction of spatial syntax has also been undertaken in mathematical cause-and-effect analyses [18]. Modelling of water runoff from agglomeration areas is an important element in the process of formation of urban development, which also affects its safety [19]. The importance of geological reconnaissance information in urban areas was already understood in the 1960s, particularly given the rapid growth of cities and the challenges of planning their reconstruction and the development of suburban regions [20]. Data from seismic, geological, morphological, hydrogeological, and disaster conditions studies are crucial in implementing the principles of sustainable urban planning [21]. The basis for the reconstruction of densely built-up urban areas is detailed information about complex geological conditions. The methodology for modelling the processes of reconstruction of existing infrastructure and its impact on the development is often sophisticated and, as such, requires a multi-criteria approach to problem solving [22]. By defining criteria related to the set goals and mapping attribute and geographic data at the municipal level, it is often necessary to prioritize identified indicators, quantitatively assess the phenomenon, and compare different development scenarios for the studied areas [23]. In the development planning process, mathematical modelling is indispensable for sustainable growth, predicting ongoing processes, as well as controlling their development. Modelling of the development of urban areas leads to the optimisation of land use and reduces urban sprawl [24]. Modelling of urban processes and their connection with urban and rural environments and geographical systems is a dynamic, chaotic, and complex interaction [25]. Studying various geological elements that influence human activity in engineering in urban areas is important for mitigating the effects of natural disasters and eliminating natural hazards. Technical data on land also plays an important role in selecting locations, designing and implementing infrastructure, managing water resources, planning land use and environmental protection at the stage of planning cities and their further development [26]. The analysis of a small agglomeration model, which has a historical record of independent growth over several centuries and well-established development in the decade of systemic planning, may be an optimal example.
In this model, socioeconomic factors influenced investors and/or residents in selecting optimal settlement locations.
When analysed in a very complex natural environment, this model may be more reproducible. This is facilitated by the complexity of included geoenvironmental factors.
The selection of factors influencing the growth of the city in this analysis will be limited to soil and hydrological conditions. Their selection has a theoretical basis in the assumptions of creating a database for a map of geological and engineering conditions.
The geological-engineering module for the map would be based on a set of information layers related to underlying soils, including:
- −
- Morphology of the surface;
- −
- Subsurface soils (depth 1.0 m above ground level);
- −
- Construction subsoils (lithogenetic units) for investment areas at depths of 2.0 and 4.0 m;
- −
- Groundwater level or depth;
- −
- Geological hazards;
- −
- Floodplains;
- −
- Marshy areas;
- −
- Indicators of subsoil load-bearing capacity.
Current trends in the management of serviced lands aim to maximize space. It would seem that the only limitation is their accessibility—transportation.
In this sense, social acceptability of the development would be its main limitation. Psychological factors inhibiting the complete development of an area may stem from the “desire” to commune with nature, i.e., biologically active areas.
2. Materials and Methods
The paper presents the methodology of a proprietary method for assessing the impact of geoenvironmental factors on built-up areas and their formation throughout the history of the development of agglomeration. The approach can be helpful in evaluating historical geoenvironmental hazards and their impact on further urban sprawl.
The research method is based on the analysis of changes occurring over time during the formation of built-up areas under specific geoenvironmental conditions. The scope of analyses is assigned to particular stages of the study:
- −
- Identification of a research area characteristic of the historical development of the agglomeration, along with its geoenvironmental conditions;
- −
- Creation of archival source data concerning changes in building density and location within the research area;
- −
- Development of a geoenvironmental database including terrain elevation, groundwater level, and geotechnical soil parameters;
- −
- Examination of the correlation between development and geoenvironmental conditions using a proprietary research method.
The acquisition of source data was based on archival information obtained from the National Geological Data Repository, historical archival maps, and the authors’ own investigations conducted within the research area. The research area comprises a designated section of the locality situated at the geographical coordinates 52°07′ N (latitude) and 16°08′ E (longitude), the topographic map of which is presented in Figure 1.
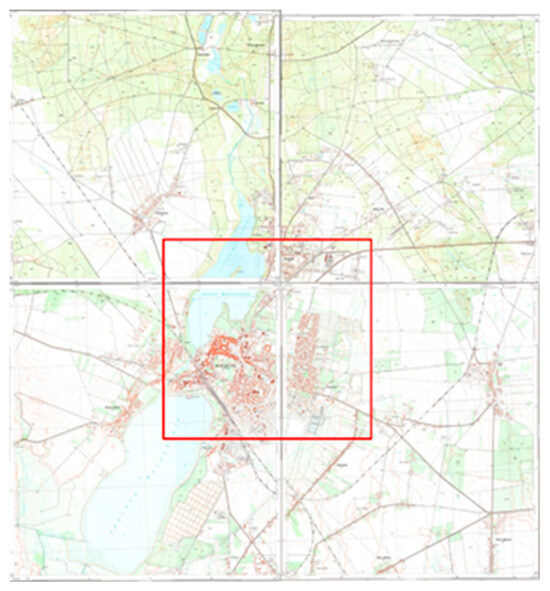
Figure 1.
Topographic map of the study area.
During the preliminary phase of the study, the research area was assumed to be an agglomeration with its buildings originating from characteristic historical periods of its growth.
Within the area covered by historic buildings, there were identified particular areas significant for the growth of the development.
For each area, source data was provided, constituting a database during characteristic historical periods.
The scope of data includes:
- −
- Development density;
- −
- Terrain elevation;
- −
- Drilled groundwater level;
- −
- Soil type and parameters in the previously adopted classification.
The research method was based on a proprietary approach to parameterizing geoenvironmental indicators that may influence the development during the growth of the agglomeration. The scope of the analysis, conducted within the built-up area, which was the research area, considered the usability of the results for development planning purposes.
The research area covered by the reconnaissance was parameterized for the range of geoenvironmental factors included in the study:
- −
- Terrain elevation;
- −
- Groundwater level;
- −
- Subsoil construction suitability.
The research program aims to find the relationship between terrain elevation, groundwater level, soil parameters, and development density in the period of the city’s growth.
Based on a proprietary research method, the project aims to identify trends in formation of urban development and the impact of selected geoenvironmental factors on its changes.
The scope of the study has been divided into two main directions:
- −
- Changes in geoenvironmental factors during the growth and formation of urban development;
- −
- The impact of geoenvironmental factors on the development.
During the research periods, the scope of analysis for the research area will be divided into:
- −
- Analyses conducted for the built-up area only and exclusively for a specific time period;
- −
- Analyses conducted for the entire area of the agglomeration in a specific time period.
Within the agglomeration area a separate research area was designated. There were selected data samples that were most characteristic of both the development and geoenvironmental factors. The dataset was based on information obtained from archival documentation and own study. It was assumed that the set was representative of the study, both in terms of the size of the area, development density, and the diversity of geoenvironmental conditions. Furthermore, the study included data on the timing of the development within the designated area, location in zones with specific soil and water conditions, as well as changes in landform features. The significant area was delineated in accordance with the city’s administrative boundaries. What is more, areas where the city’s development might potentially impact adjacent areas subject to the development were excluded. For these areas a separate analysis can be undertaken, which will provide the basis for identifying potential problems related to the impact of geoenvironmental factors on developments undergoing densification or developments in areas designated for further growth of the city.
Characteristic periods (time intervals) in the city’s growth were identified and subject to analysis.
The identification of characteristic periods reflects the history of the city’s growth and the creation of development plans, which had the greatest impact on its urban development.
In the conducted analyses, the city’s administrative area was divided and covered by a geometric database grid for computational analysis.
The analysis was carried out for a geometric grid of 25.0 × 25.0 m. The individual data contained in this computational area precisely illustrates the changes occurring in the research sample. It was assumed that the area was optimal for the map scale and the overall analysed area.
The proprietary method was applied to identify formulas used in the analysis of development intensity within the city’s research area.
The development density index for the area under consideration :
where
—Development area in the area under consideration ij;
—Surface area of the area under consideration ij within the research area.
The matrix of development density index for the city area:
The volume of space called the global indicator of development density in the considered time interval is expressed by the formula:
where
—Considered time period in the history of the city’s growth;
D—Considered research area within the city;
—Function created from development density indicators .
The identification of time periods characteristic of the research area is related to the history of the city’s growth and the implementation of spatial development plans that had the greatest impact on its development.
To characterize the research area in terms of terrain configuration, the terrain elevation index was introduced, which is a constant representing the terrain elevation for the area under consideration .
The matrix of terrain elevation index for the city area (Figure 1):
The volume of space called the global indicator of the terrain elevation within in the city area in the considered time interval is expressed by the formula:
where
—Considered time period in the history of the city’s growth;
D—Considered research area within the city;
—Function created from terrain elevation indicators .
The testing of groundwater level was based on determining the groundwater level indicator , which is a constant representing the groundwater level in the area in [m] above sea level for the considered area .
The assignment of = 0.0 and = 0.0 will result from the adoption of an initial reference value related to the historical water level in the natural reservoir adjacent to the agglomeration. To illustrate the creation of the centre of gravity of the terrain elevation and groundwater level indicators, we based the analysis on real data, not linearly scaled. This approach to the analysis allowed for better real-like mapping and greater accuracy of the research results.
The matrix of groundwater level indicator for the city area (Figure 2):
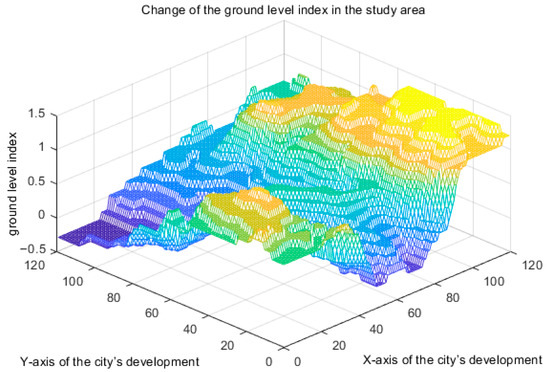
Figure 2.
Change in the indictor of terrain elevation within the research area.
The volume of space called the global indicator of groundwater level within the city area in the considered time interval is expressed by the formula:
where
—Considered time period in the history of the city’s growth;
D—Considered research area within the city;
—function created from groundwater level indicators .
In the proposed proprietary research method, the necessary data for analysing subsoil suitability for founding and constructing buildings was assigned to particular research areas.
The indications included in the “Modular Map Content System”—Geological and Engineering Module identify the following on the subsoil construction suitability map:
- −
- Areas unfavourable for construction;
- −
- Areas of limited suitability for construction;
- −
- Areas with average construction conditions;
- −
- Areas with good construction conditions.
Due to the specificity of the study in terms of groundwater levels, the proposed analysis method adopted a modification of the subsoil division, limiting itself at this point to soil types and proposing a division taking into account the subsoil criterion:
A. Areas with very good construction conditions;
B. Areas with good construction conditions;
C. Areas with average construction conditions;
D. Areas with limited construction suitability;
E. Areas with unfavourable construction suitability.
In a similar way, additional parameters were distinguished as the basis for the research method.
For the scope of geoenvironmental data in the considered area ij an indicator of the subsoil construction suitability for foundations distinguished.
Data related to the subsoil construction suitability for foundations were also linearly rescaled in the range (0.0, 1.0). Studies of archival source materials and the current database confirmed the presence of significant variability in the arrangement of soil layers and their properties in the research area. Assuming that the boundaries separating layers and the values of their thicknesses are highly random, a tolerance of in the range D = was adopted for the input data rescale. This tolerance is sufficient for establishing the trend line. The indicators of subsoil construction suitability for foundations should be treated as expert estimates.
The indicator is a characteristic that, through weighting assigned to soil parameters, directly determines the areas of terrain in terms of their suitability for foundations.
The following assumption was made: 0.0 ˂ ˂ 1.00
The matrix of subsoil construction suitability for foundations (Figure 3) in the city area:
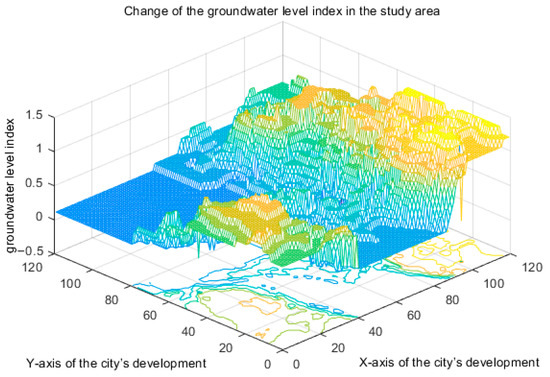
Figure 3.
Change in the indicator of groundwater level within the research area.
The volume of space called the global indicator of the degree of subsoil construction suitability for foundations at the considered time w is expressed by the formula:
where
—Considered time period in the history of the city’s growth;
D—Considered research area within the city;
—Function created from global indicators of the degree of subsoil construction suitability for foundations .
3. Results
The scope of the conducted research concerns the planned analyses, which assume the assessment of the impact of global geoenvironmental indicators on the global development index:
- −
- Global indicator of terrain elevation within the city area;
- −
- Global indicator of groundwater level within the city area,
- −
- Global indicator of the degree of subsoil construction suitability for foundations within the city area;
- −
- Global indicator of groundwater table deposition within the city area.
Time intervals were identified within the period of the city’s development:
where represents a characteristic point in time in the history of the city’s growth. The identification of characteristic periods is related to the historical process of urban development and the creation of spatial development plans that exerted the greatest influence on the city’s growth.
In the analysed research sample:
- −
- ⊂< 0; 1810>,
- −
- ⊂< 1811; 1912>,
- −
- ⊂< 1813; 1921>,
- −
- ⊂< 1922; 1948>,
- −
- ⊂< 1949; 1970>,
- −
- ⊂< 1971; 1988>,
- −
- ⊂< 1989; 2000>,
- −
- ⊂< 2000; 2010>.
The change in geoenvironmental indicators in the research area, as the initial data for the study, adopted as the space of the agglomeration, is illustrated in Figure 2, Figure 3 and Figure 4. The X and Y axes of the charts represent a geometric grid with research fields of 25.0 × 25.0 m within the 3000 × 3000 m study area. The Z axes show the indicators of terrain elevation, groundwater level, and soil construction suitability, linearly rescaled according to the data presented in Table 1 and Table 2.
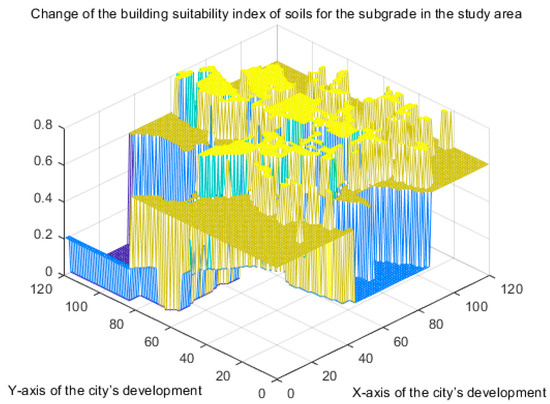
Figure 4.
Change in the indicator of the degree of soil construction suitability for foundations within the research area.

Table 1.
Indicators of Terrain Elevation and Groundwater Table Level.
Table 2.
Indicator of subsoil construction suitability for foundations.
The assignment of soil parameters and soil types to the areas classified according to the data adopted in the applied research method is presented in Table 2.
The map of soil suitability for construction was developed using soil parameter criteria. The classification of the subsoil was based on the degree of compaction, plasticity index, modulus of compressibility, and internal friction angle. The boundaries between the criteria are expert-defined. The correlation of geoenvironmental indicators presented in a combined chart illustrates their relative variations throughout the history of the agglomeration’s development. Translating these elements into historical environmental phenomena allows for an assessment of the correctness of the city’s development directions. In an analogous manner, future spatial development changes can be—or will be—simulated. The summary of the global indicators is presented in Table 3.
Table 3.
Global geoenvironmental indicators during urban development.
In addition, an analysis was carried out using the introduced proprietary global indicator of the degree of subsoil construction suitability for foundations in the agglomeration, , for the research area developed within the time interval , i.e., from the beginning of the agglomeration’s formation to the calculation period. The parametric range of indicators in this case will also be analysed in relation to groundwater level and terrain elevation, namely:
- −
- Global indicator of terrain elevation for the agglomeration ;
- −
- Global indicator of groundwater level for the agglomeration .
The summary of the research results is presented in Table 4.
Table 4.
Global geoenvironmental indicators for the agglomeration during urban development.
4. Discussion
The obtained analytical results confirm the significant influence of geoenvironmental factors—in particular, terrain elevation, groundwater level, and subsoil construction suitability—on the directions and intensity of urban development.
In the study area, it was observed that zones with less favourable subsoil and groundwater conditions were developed more intensively than areas located at higher terrain elevations. At the same time, within the study area, in the vicinity of watercourses, local flooding events were recorded in the history of the agglomeration’s development during periods of intensive rainfall. By introducing subsequent analysis periods in Table 3 and Table 4, together with increasing development density illustrated by the indicators , , and others, it is possible to analyse the occurring changes, i.e., to approximate the resulting functions and their mutual displacements. The mutual trends in the formation of these functions, combined with the identification of environmental hazards in the periods ti and the modelling of future development, may help eliminate unfavourable tendencies in urban planning within areas designated for construction based on the phenomena observed throughout the agglomeration’s historical development.
At the same time, areas with limited soil bearing capacity or exposed to periodic flooding showed lower development intensity, confirming the consistency of these observations with previous studies [6,7,8]. The process of land development, in the analysis of groundwater table deposition, showed no dominant trend for a specific time interval of the agglomeration’s development.
The introduction of own global indicators enabled not only a quantitative assessment of these relationships, but also the creation of a forecasting tool for simulating potential development scenarios of the agglomeration.
This approach is consistent with current trends in spatial planning, which increasingly emphasize the integrated use of geological, hydrological, and morphological data [20,21]. This indicates the possibility of adapting the proposed method to other agglomerations, particularly where there is a significant variation in subsoil conditions.
The analysis also confirmed that, in the long term, environmental factors influence development patterns in a nonlinear manner. Periodic changes in water conditions or local depressions can cause shifts in the city’s growth axis, even if these areas were initially perceived as attractive for investment. The phenomenon is essentially important in the context of climate change, which can intensify extreme weather events and thus alter the suitability of areas for construction purposes [17].
It is worth emphasizing that the proposed model is based on archival data and contemporary measurements, enabling both historical analysis and forecasting. However, the accuracy of forecasts depends on the quality and resolution of input data. In the absence of detailed information, particularly about deeper subsurface layers, the precision of the model may be limited. Therefore, it is recommended to supplement the database with the results of geotechnical studies and hydrological monitoring.
The methodology used can provide a basis for developing interactive maps of geoenvironmental hazards, supporting the decision-making process in spatial planning. Combined with multi-criteria decision support methods [4,9], this enables the creation of variant development scenarios that minimize the risk of locating investments in areas considered problematic.
In order to illustrate the correlation of geoenvironmental indicators and the development, it is planned to carry out studies on the basis of a research field within a geometric grid of 50.0 × 50.0 m.
The proprietary research method analyses the history of the agglomeration’s development based on actual geoenvironmental conditions. This approach makes it possible to trace the spatial development of urban areas over centuries during the city’s growth period and simultaneously analyse historically occurring environmental hazards and identify their causes. Other methods based on decision-making processes can also assist in selecting areas for construction based on criteria related to current and future land-use planning. Such methods include the Analytic Hierarchy Process (AHP) and GIS-MCDA methods, which combine Geographic Information Systems (GIS) with Multi-Criteria Decision Analysis (MCDA).
Furthermore, there is an intention to conduct studies based on previously defined geoenvironmental indicators using a sample of data that will most likely simulate future events within the previously defined development research area. By selecting areas for construction purposes, it is possible to simulate the environment most likely to appeal to future investors.
Geoenvironmental indicators processed for the analysis will form the basis for comparative analyses with the collected actual data, historically shaped.
In summary, the presented approach allows not only for the recognition of hazards related to soil and water conditions, but also for identifying areas with the highest long-term development potential. Its implementation in urban planning practice could contribute to formation of urban space in a more sustainable manner and resilient to environmental changes.
5. Conclusions
The initial tasks consisted of developing a model of the geological and engineering environment that would be as close to reality as possible in the adopted research area, characteristic of and representative of the research sample, which was completed. To prepare the set of data, it was necessary to systematize existing studies on soil and water conditions in the area under analysis. Additionally, through analysing the settlement history of the research area, the intersection of geoenvironmental, urban planning, and construction issues was explored.
Based on the established criteria, satisfactory results will be the ones that confirm the thesis that, for the adopted research method, there is a correlation between selected geoenvironmental factors represented by soil type, groundwater level, terrain elevation, and the development and spatial growth of the city. The developed research method intends to identify changes occurring in the development while simultaneously shaping geoenvironmental factors in the research area, and to identify hazards related to formation of urban development in areas that are geologically unstable or subject to flooding during weather anomalies.
The analyses conducted allowed for the integration of archival and contemporary data into a coherent model, enabling the assessment of the relationship between soil and water conditions and spatial development in different historical periods. The introduction of proprietary global indicators allowed for the quantitative presentation of these relationships and the creation of a forecasting tool for simulating potential urbanisation scenarios. The results revealed that areas with applicable soil conditions, stable groundwater levels, and favourable terrain morphology have historically been preferred in investment processes, while areas with weak subsoil or those at risk of periodic flooding have remained less urbanised.
The analyses conducted on the trends in the functional relationships between geoenvironmental indicators and the development index, as well as the analysis of their mutual displacements, may indicate research periods consistent with historical data in which environmental hazards occurred. Field observations of extreme phenomena within the study area confirmed the occurrence of local flooding in 2013, i.e., for the research period tki > 20.
The elaborated methodology has significant practical implications. It can support spatial planning processes and be used for updating local development plans by identifying optimal areas for construction purposes, as well as areas requiring detailed geotechnical investigations. Its implementation helps reduce investment and environmental risks, enables the creation of geoenvironmental hazard maps, and allows for the adaptation of urban planning strategies to the potential impacts of climate change, including extreme weather phenomena.
The proposed approach supports the implementation of sustainable urban development through optimal use of investment areas, maintaining a balance between development and biologically active areas, and increasing the resilience of urban structures to changing environmental and anthropogenic conditions. Thanks to its adaptability to various types of agglomerations with diverse soil conditions, this method makes a universal tool that can be applied to a wide range of planning and engineering activities.
Author Contributions
Conceptualization, G.W., B.K. and A.S.-G.; methodology, G.W., B.K. and A.S.-G.; software, G.W.; validation, B.K. and A.S.-G.; formal analysis, A.S.-G.; investigation, G.W., B.K. and A.S.-G.; resources, G.W.; data curation, G.W.; writing—original draft preparation, G.W.; writing—review and editing, B.K. and A.S.-G.; visualization, G.W.; supervision, B.K. and A.S.-G.; project administration, A.S.-G.; funding acquisition, A.S.-G. All authors have read and agreed to the published version of the manuscript.
Funding
This research received no external funding.
Institutional Review Board Statement
Not applicable.
Informed Consent Statement
Not applicable.
Data Availability Statement
Data is contained within the article.
Conflicts of Interest
Author Grzegorz Wysocki was employed by the company Pracownia Projektowa AGA. The remaining authors declare that the research was conducted in the absence of any commercial or financial relationships that could be construed as a potential conflict of interest.
References
- Siewczyńska, M.; Siewczyński, B.; Grzelczak, A.; Szymczak-Graczyk, A.; Ksit, B. Modular Buildings as a Potential for Small Trade Development in a Sustainable City. Sustainability 2025, 17, 5958. [Google Scholar] [CrossRef]
- Guide de Caractérisation des Terrains, Ministere de la Transistion Ecologique. France. 2024. Available online: https://www.environnement.gouv.qc.ca/sol/terrains/guide/guidecaracterisation.pdf (accessed on 23 August 2025).
- Plan Lokal d’Urbanisme; Ministere de I’Interieur. France. 2024. Available online: https://data.geopf.fr/annexes/gpu/documents/DU_77058/553a9b715e067fb4862312c3c0cd4d6a/77058_2c_ARGILE_20240523.pdf (accessed on 23 August 2025).
- Walczak, Z.; Ksit, B.; Szymczak-Graczyk, A. Decision-support tools for diagnosing and selecting the optimal method of repairing buildings. Bull. Pol. Acad. Sci. Tech. Sci. 2024, 72, e151382. [Google Scholar] [CrossRef]
- Available online: https://wody.isok.gov.pl/hydroportal.html (accessed on 23 August 2025).
- Ochab, P.; Skrzypczak, I.; Duda, A.; Sikora, A.; Błazik-Borowa, A.; Nepelski, K.; Lal, A.; Sulewska, M. Zastosowanie indeksowej metody statystycznej do analizy podatności osuwiskowej wybranego obszaru z terenu województwa podkarpackiego [Application of the index statistical method to the analysis of landslide susceptibility of a selected area in the Podkarpackie Voivodeship]. Mater. Bud. 2023, 616, 57–61. [Google Scholar]
- Wierzbicki, J.; Pilch, R.; Radaszewski, R.; Stefaniak, K.; Wierzbicki, M.; Ksit, B.; Szymczak-Graczyk, A. Water Level Rise and Bank Erosion in the Case of Large Reservoirs. Water 2025, 17, 1576. [Google Scholar] [CrossRef]
- Gwóźdź-Lasoń, M. Inwestycje budowlane na terenach osuwiskowych—Analiza przyczynowo-skutkowa powstawania uszkodzeń w budynkach podczas wykonywania prac związanych z modernizacją sąsiedniej inwestycji [Construction investments in landslide areas—Cause-and-effect analysis of damage to buildings during modernisation works on a neighbouring investment]. Przegląd Bud. 2016, 9, 25–32. [Google Scholar]
- Trzaskalik, T. Wielokryterialne wspomaganie decyzji. Przegląd Metod i zastosowań [Multi-criteria decision support. Review of methods and applications]. Zesz. Nauk. Politech. Śląskiej 2014, 74, 239–263. [Google Scholar]
- Chupin, L. Elements de Mathematiques Pour la Geologie-L2, Version du 16 Janvier 2017. Available online: https://lmbp.uca.fr/~chupin/FICHIERS-ENSEIGNEMENT/GeologieL2-2017.pdf (accessed on 23 August 2025).
- Chazottes, J.-R. Modelisation Mathematique Pour L’Ecologie, Version du 22 Octobre 2016. Available online: https://www.cpht.polytechnique.fr/sites/default/files/livre_0.pdf (accessed on 23 August 2025).
- Bouchareb, A. Cours Urbanisme et Environnement, Annee Universitaire: 2006/2007. Available online: https://www.academia.edu/12222540/URBANISME_ET_ENVIRONNEMENT (accessed on 23 August 2025).
- Peltier, G. Analyse Mathematique de Modeles Non-Locaux en Ecologie Evolutive, Universite de Montpellier. 2021. Available online: https://www.gwenaelpeltier.fr/content/These_Gwenael_Peltier.pdf (accessed on 23 August 2025).
- Direction Générale de l’Urbanisme, de l’Habitat et de la Construction, du Ministère de l’Ecologie, du Développement et de l’Aménagement Durables, et la Fédération Nationale des Agences d’Urbanisme. Urbanisme et Environnement: 20 Cas Practique. 2008. Available online: https://www.fnau.org/wp-content/uploads/2016/03/premiere_partie.pdf (accessed on 23 August 2025).
- Barguerio, D.R.; Salomon, V.A.P.; Marins, F.A.S.; Palominos, P.; Marrone, L.A. State of the Art Review on the Analytic Hierarchy Process and Urban Mobility. Mathematics 2021, 9, 3179. [Google Scholar] [CrossRef]
- Dassargues, A. Modeles Mathematiques en Hydrogeologie et Parametrisation, Annales Dela Societe Geologique de Belgiques. 1991. Available online: https://orbi.uliege.be/bitstream/2268/1851/1/publi13-1991.pdf (accessed on 23 August 2025).
- Ksit, B.; Szymczak-Graczyk, A. Diagnostics and multi-criteria analysis of methods for drying buildings after flooding. Case study. Civ. Environ. Eng. Rep. 2024, 34, 246–260. [Google Scholar] [CrossRef]
- van Nes, A. Applied Mathematics on Urban Space. In The Mathematics of Urban Morphology: Modeling and Simulation in Science, Engineering and Technology; Springer International Publishing: Cham, Switzerland, 2019; pp. 253–270. [Google Scholar]
- Dawdy, D. Considerations Involved in Evaluating Mathematical Modeling of Urban Hydrologic Systems; United States Government Printing Office: Washington, DC, USA, 1969. [Google Scholar]
- McGill, J.T. Growing Importance Of Urban Geology; United States Department of the Interior, Geological Survey: Reston, VA, USA, 1964; p. 487. [Google Scholar]
- Gocmez, B.D.; Cerirge, N.; Vardar, M. Effects of Geological Factors on Urban Planning: An Example from the Termal Settlement, Turkey; The Geological Society of London, IAEG: London, UK, 2006; p. 749. [Google Scholar]
- Prusov, D. Principles of reconstruction the urban territory in dense building and complex geology conditions. Space FORM 2017, 3, 189–202. [Google Scholar] [CrossRef]
- Houbib, H.; Kalla, M. Analysis of Constraints to Urban Expansion in the City of M’Sila Using the Analytic Hierarchy Process (AHP) and Geographic Information Systems (GIS). Geomat. Landmanagement Landsc. 2024, 4, 123–135. [Google Scholar] [CrossRef]
- Kaur, G. Sustainable Urban Development Through Mathematics. IJFMR 2024, 6, 6. [Google Scholar]
- Chen, Y.; Xu, F. Modeling Complex Spatial Dynamics of Two-Population Interaction in Urbanization Process. J. Geogr. Geol. 2010, 2, 1. [Google Scholar] [CrossRef][Green Version]
- Yıldız, U. Urban planning and development in harmony with the geosciences. Sci. Rep. 2024, 56, 145–154. [Google Scholar] [CrossRef]


Disclaimer/Publisher’s Note: The statements, opinions and data contained in all publications are solely those of the individual author(s) and contributor(s) and not of MDPI and/or the editor(s). MDPI and/or the editor(s) disclaim responsibility for any injury to people or property resulting from any ideas, methods, instructions or products referred to in the content. |
© 2025 by the authors. Licensee MDPI, Basel, Switzerland. This article is an open access article distributed under the terms and conditions of the Creative Commons Attribution (CC BY) license (https://creativecommons.org/licenses/by/4.0/).