Abstract
With the deepening of power market reform and the large-scale integration of bidirectional systems such as energy storage and electric vehicles, achieving sustainable carbon management has become increasingly urgent. Traditional carbon emission accounting methods face challenges, including insufficient dynamics and unclear responsibility boundaries. To address these issues, this paper proposes a sustainability-oriented accounting method for indirect carbon emissions from electricity in the context of bidirectional system integration in the power market environment. First, the dynamic carbon emission characteristics of bidirectional systems such as energy storage and vehicle-to-grid (V2G) systems are analyzed, and a carbon emission accounting model is constructed to address the fairness issue of emission responsibility allocation during charging and discharging. Second, on the basis of the theory of carbon emission flows and incorporating electricity trading contract data, an accounting method for indirect carbon emissions from electricity in green electricity trading, coal-fired electricity trading, and hybrid scenarios under bidirectional system integration is developed. Finally, the case study demonstrates that the proposed method accurately captures the temporal variation of carbon emission factors, ensures conservation of total emissions, and fairly redistributes carbon responsibility among users under different market scenarios, while revealing how bidirectional systems and green electricity trading reshape nodal carbon intensities and spatial emission distributions without causing double counting.
1. Introduction
1.1. Research Background and Significance
Driven by the dual forces of global climate change challenges and the goals of “carbon peak and carbon neutrality” [1], the power industry, as the core sector of carbon emissions (accounting for approximately 43% of total energy-related carbon emissions in China [2]), has become a critical pathway for achieving climate governance objectives. Accurate carbon emission accounting methods not only serve as the core basis for carbon responsibility allocation but also form the scientific foundation for guiding low-carbon power dispatch, activating carbon trading markets, and optimizing power-grid planning [3].
In the context of building a new power system, the increasing share of intermittent energy sources, such as wind and solar power, presents significant challenges to the power balance of the system [4]. “Ensuring supply,” “ensuring safety,” and “ensuring absorption” have become core issues throughout the development stages of the new power system. As flexible resources, energy storage, electric vehicles, and other systems can provide bidirectional regulation in coordination with the output characteristics of intermittent energy sources [5,6,7], thereby enhancing system stability. Their large-scale integration is an inevitable choice for constructing a new power system; thus, they must be further incorporated into the indirect carbon emission accounting system of electricity.
The motivation of this study is closely aligned with the global decarbonization agenda defined under the United Nations COP26 framework. At COP26, participating countries reaffirmed the commitment to achieving net-zero carbon emissions in the power sector by mid-century through large-scale integration of renewable energy and flexible resources [8,9,10]. Renewable energy plays a dual role in this process: it serves as the foundation for low-carbon electricity generation and, when coupled with bidirectional systems such as energy storage and vehicle-to-grid (V2G), it enables temporal balancing between renewable output and demand.
However, as renewable penetration increases, the carbon responsibility associated with charging and discharging electricity becomes less straightforward, particularly when storage draws power from a mixed or partially renewable grid. Addressing this issue is essential for ensuring that the emission reduction benefits of renewable energy are accurately represented in carbon accounting. Therefore, this study contributes to the post-COP26 research agenda by proposing a transparent and dynamic framework that links renewable energy utilization, market transactions, and bidirectional operation to achieve traceable and verifiable carbon emission accounting in the power market.
1.2. Literature Review
Currently, research on bidirectional systems (such as energy storage and electric vehicles as bidirectional loads) focuses mainly on low-carbon economic dispatch [11,12] and low-carbon planning [13,14], emphasizing their roles in system flexibility and emission reduction potential. However, few studies have explored the systematic accounting of carbon emissions associated with such bidirectional systems, especially under dynamic operation and market interaction conditions. The bidirectional power characteristics of these systems, coupled with energy losses during charging and discharging, introduce complexity to emission attribution and temporal coupling across operating periods.
Reference [15] quantified that energy storage can either reduce or increase system-wide emissions depending on marginal generation conditions, highlighting the importance of dynamic accounting. Reference [16] proposed a carbon emission measurement model considering storage losses and introduced a method for allocating charging and discharging losses to the electricity consumption side. Reference [17] developed a carbon emission flow model for bidirectional systems based on the theory of carbon emission flows and proposed a carbon emission accounting method based on policy-driven carbon responsibility allocation, analyzing its compatibility with existing carbon emission flow theories. Reference [18] established a V2G carbon accounting and revenue allocation model that tracks emission transfers during charging and discharging. These studies extended traditional carbon emission accounting to bidirectional systems and proposed different models for carbon-responsibility allocation.
In recent years, carbon emission flow theory [19,20] has provided new insights for refined carbon accounting and measurement. This method distributes source-side carbon emissions to load buses by constructing a power flow distribution matrix and a carbon flow rate mapping model, achieving topological tracing of the “carbon footprint”. Reference [20] developed the first system-level model for tracing generator-to-load carbon flows. Reference [21] further applied flow tracing to dynamically track life-cycle carbon emissions in power grids, demonstrating its applicability in large-scale systems.
However, the average carbon emission factor method currently used in China [22] does not consider the transfer of carbon emission responsibility during electricity transactions in the power market, leading to a lack of linkage between carbon emission accounting results and power market transaction data. This makes it difficult to adapt carbon responsibility allocation to market rules such as green electricity trading and carbon quota distribution. The Greenhouse Gas Protocol (GHG Protocol) Scope 2 Guidance [23] provides an internationally recognized dual-framework approach—location-based and market-based—that aligns emission accounting with electricity trading contracts and renewable certificates, laying a policy basis for transaction-linked indirect carbon accounting. Reference [24] proposed a carbon measurement technology for electricity consumption, considering electricity transaction information. It splits the measured power flow data into transaction behavior flow and nontrading behavior natural distribution flow to account for indirect carbon emissions on the user side. Reference [25] further refined users on the basis of the type of transaction counterparty and developed a carbon emission accounting model for different types of users. Reference [26] proposed a dynamic carbon-accounting model combining emission-flow theory and quasi-input–output analysis to capture temporal variations in nodal carbon factors. Reference [27] comprehensively reviewed consumption-based and flow-based accounting approaches, emphasizing that contract-based and dynamic methods better reflect market behavior.
With respect to green electricity trading, the GHG Protocol, which was published jointly by the World Resources Institute (WRI) and the World Business Council for Sustainable Development (WBCSD), clearly states that enterprises can directly offset carbon emissions by using green electricity [28]. Reference [29] established an indirect carbon emission accounting method considering the green electricity trading emission reduction benefits, incorporating the bilateral trading traceability of user green electricity. Reference [30] proposed a real-time electricity carbon accounting method considering the effects of green electricity and green certificate trading, effectively linking green electricity, green certificates, and carbon emissions. Reference [31] investigated the carbon-reduction effects of green-electricity market mechanisms in China and confirmed that contract-based renewable power trading can significantly lower user-side indirect emissions. Reference [32] emphasized that harmonizing carbon-accounting rules for grid electricity and green certificates is essential to avoid double counting and ensure credible emission claims. These studies provide important support for incorporating green electricity trading into carbon emission accounting frameworks. However, the existing carbon emission accounting methods for conventional electricity users may not be applicable to bidirectional systems. These methods lack consideration of the bidirectional system’s dual role as both a power source and an electricity user, necessitating further research.
In summary, this paper examines the impact of the large-scale integration of bidirectional systems, such as energy storage and electric vehicles, on indirect carbon emission accounting in the power market. First, the dynamic carbon emission characteristics of bidirectional systems (e.g., energy storage and V2G) are analyzed, and a carbon emission accounting model is developed. Afterward, on the basis of the theory of carbon emission flows and incorporating electricity trading contract data, an indirect carbon emission accounting method under bidirectional system integration is established. Finally, the feasibility and fairness of the proposed method are verified through simulation results from typical case studies.
The main contributions are:
- (1)
- The proposed method decomposes the power flows corresponding to trading and nontrading segments, enabling independent accounting of carbon responsibility for trading and nontrading electricity.
- (2)
- The carbon accounting method, which incorporates green electricity consumption tracking, can accurately quantify the indirect carbon emissions of different users, including bidirectional systems.
- (3)
- The developed carbon accounting model for bidirectional systems captures their dynamic carbon emission characteristics and addresses the fairness of carbon responsibility allocation during charging and discharging.
2. Methodology
2.1. Carbon Emission Characteristics and Accounting Methods of Bidirectional Systems
2.1.1. Dynamic Carbon Emission Characteristics of Bidirectional Systems
In the absence of bidirectional system integration, the distribution of carbon emissions in the system depends solely on factors such as the carbon emission intensity of power generation at the current moment, the power flow distribution in the network, and the network topology. However, bidirectional systems, which have the ability to store and release electrical energy, can be considered systems with memory. When the bidirectional system charges, the “carbon content” of the stored electricity is determined by the carbon emission factor at the current moment (it is primarily determined by the emission factors of different generation types (which are generally constant), together with the real-time generation mix and power flow distribution in the system and refers to the instantaneous average carbon intensity of the generation portfolio connected to a given system node at time t) and the charging amount. Therefore, when the bidirectional system discharges, the “carbon content” of the released electricity should be related to the historical charging data. Furthermore, taking energy storage as an example, charging and discharging involve losses; therefore, the carbon emission accounting during discharge also needs to account for these losses. A schematic diagram of the dynamic carbon emission characteristics of bidirectional systems is shown in Figure 1.
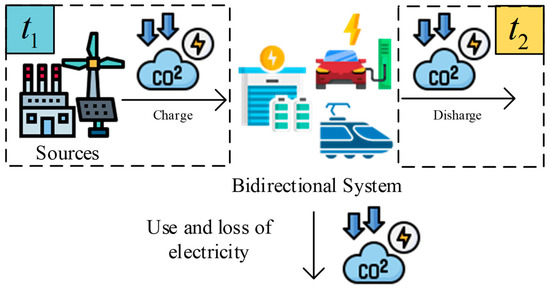
Figure 1.
Schematic diagram of the dynamic carbon emission characteristics of bidirectional systems.
Therefore, the calculation of system carbon emission flow under bidirectional system integration should consider not only the carbon emission intensity of power generation, power flow distribution, and network topology at the current moment but also historical charging data, including charging amount, carbon emissions, and charging/discharging losses.
2.1.2. Carbon Emission Accounting Methods for Bidirectional Systems
Currently, carbon emission accounting for bidirectional systems is conducted through methods such as the measurement method and the policy method.
The measurement method relies mainly on power flow monitoring, metering, and user-side energy metering systems to achieve real-time power measurement across the source-grid-load linkage. However, owing to inherent losses (e.g., energy storage) or energy consumption by the system (e.g., electric vehicles), bidirectional systems often have energy that is difficult to meter but still corresponds to carbon emissions. Therefore, the practical application of the measurement method is more challenging.
Policy methods can be divided into the following two categories:
- Bidirectional systems assume full carbon emission responsibility
This policy stipulates that all carbon emission responsibilities associated with power transfer during charging are borne by the bidirectional system, whereas the discharged electricity is considered green electricity. This method allows for focusing solely on charging, with the carbon emissions determined by the external grid. However, this approach increases the operational cost of the bidirectional system, which is typically accompanied by compensation measures, such as installation subsidies or discharge price subsidies.
Furthermore, in the context of a diversified power market, considering that the electricity discharged from the bidirectional system is viewed as green electricity, it can be sold through market transactions to obtain the environmental value of green electricity. Users who purchase and utilize electricity from the bidirectional system can also reduce their indirect carbon emissions.
- 2.
- Bidirectional systems do not assume carbon emission responsibility
This policy stipulates that all carbon responsibility associated with power transfer during charging is transferred to the external grid during discharge. Under this method, considering the losses or energy consumption of the bidirectional system, the discharged electricity will always be less than the charged electricity, and the carbon emissions from this difference need to be accounted for. This method effectively reduces the operational costs of the bidirectional system, typically applied to entities such as electrochemical energy storage stations or pumped-storage facilities that specialize in providing grid-side energy storage services.
Similarly, in a power market environment, the carbon emission responsibility for this part is transferred to the users who purchase this electricity through transactions.
2.1.3. Carbon Emission Accounting Model for Bidirectional Systems
On the basis of the analysis in Section 2.1.2, practical application of the measurement method is challenging during the phase when metering devices (such as state-of-energy (SOE) monitoring devices) are not widely deployed. Additionally, the dynamic characteristics of bidirectional systems can easily lead to disputes regarding the retroactive allocation of carbon emission responsibilities. On the other hand, the policy method only requires consideration of data such as the carbon emission factors from the grid side or power source side. Pre-agreeing on the division of carbon emission responsibilities (e.g., setting the discharge as zero carbon under the scenario where the bidirectional system assumes full carbon emission responsibility) can facilitate coordination with green electricity and carbon markets. Therefore, the policy method is considered for the carbon emission accounting of bidirectional systems.
- Bidirectional systems assume full carbon emission responsibility
Under the scenario where the bidirectional system assumes full carbon emission responsibility, the carbon emission factor during discharge is set to zero. Therefore, there is no need to account for discharge losses or electricity consumption. Carbon emissions are based on the carbon emission factor at the connection point between the bidirectional system and the external grid.
where denotes the carbon emission factor during discharging when the bidirectional system assumes full carbon emission responsibility; denotes the corresponding carbon emissions under this setting; denotes the carbon emission factor at the grid connection point of the bidirectional system at time t; denotes the charging amount of the bidirectional system at time t; denotes the i-th charging cycle; and denotes the cumulative charging duration of the bidirectional system.
- 2.
- Bidirectional systems do not assume carbon emission responsibility
Under the setting where the bidirectional system does not assume carbon emission responsibility, assuming that the system is charging during the interval [0, t1] and switches to discharging during the interval [t1, t2], the calculation formulas for the carbon emission factor and carbon emissions are as follows [17]:
where denotes the carbon emission factor of the bidirectional system during discharge when it does not assume carbon emission responsibility; denotes the maximum dischargeable energy of the bidirectional system within the interval [t1, t2]; denotes the efficiency of the bidirectional system; and denotes the carbon emissions of the bidirectional system when it does not assume carbon emission responsibility.
Notably, incorporates the efficiency losses during charging and discharging, which can be determined with reference to relevant standards or obtained through offline testing.
2.1.4. The Typical Range of Bidirectional System Efficiency and Its Impact on Carbon Accounting
The parameter denotes the round-trip energy efficiency of a bidirectional system (e.g., energy storage or vehicle-to-grid, V2G), representing the ratio of discharged energy to charged energy. Mathematically, if the system charges an energy quantity at time and subsequently discharges at time , then:
From a carbon accounting perspective, when , energy losses during the round-trip process increase the carbon intensity (i.e., carbon emission factor) of discharged electricity, as the same carbon content is distributed over a smaller amount of output energy. Assuming the carbon emission associated with charging is (tCO2), the carbon intensity during discharge can be expressed as:
where denotes the carbon intensity at the charging stage. This shows that the discharged carbon intensity is amplified by a factor of relative to that during charging.
Typical round-trip efficiencies vary across technologies and operating conditions. For reference, typical ranges are as follows:
- Lithium-ion electrochemical storage [33]: ;
- Pumped hydro storage [34]: ;
- V2G systems (depending on inverter losses and battery cycling) [35]: .
Specific values can be obtained from manufacturer specifications or field measurements, and are influenced by temperature, depth of discharge, charge/discharge rate, and equipment aging.
Uncertainty in η stems from measurement error, environmental dependence, system degradation, and operational strategy. According to Formula (7), the discharged carbon intensity increases approximately in proportion to . For example, reducing η from 0.90 to 0.85 increases by about 5.9%. In practice, a 5–10% change in η typically leads to less than 3% variation in user-level indirect emissions, indicating a moderate but non-negligible sensitivity.
2.2. Carbon Emission Accounting Model for Users in the Power Market Environment
2.2.1. Indirect Carbon Emission Accounting Method for Users Considering Electricity Trading Contract Data
In the power market environment, bilateral electricity purchase and sale contracts often occur between power generator nodes and load nodes. Under the constraints of these electricity contracts, users are not only concerned with the carbon emissions corresponding to the electricity flowing through the power system but also with the source of each kilowatt-hour and the destination user. In the context of the power market and low-carbon development, each bilateral electricity contract inherently involves the transfer of carbon emissions.
- Decomposition of the Transaction and Nontrading Components
According to power flow calculation theory, each load theoretically receives energy from all generation units in the system, but with different proportional contributions determined by the network topology and power flow distribution. In contrast, electricity obtained through market transactions has explicit counterparties, which means the transaction clearly identifies the generation unit supplying the electricity. Consequently, the carbon emission responsibility associated with the traded electricity is directly transferred from the generator to the purchasing load according to the bilateral contract.
For the nontrading portion, where no explicit trading counterpart exists, the allocation of carbon responsibility is determined based on the carbon emission flow theory, which will be further discussed in the following section.
In the power market environment, a user’s electricity can come from two sources:
- Market participation: The user acquires electricity through signed contracts in the power market;
- Nonmarket participation: The user acquires electricity through the transmission and distribution network, such as residential electricity purchased via a grid company agent, where no contract is signed with the power generator and thus does not participate in the market.
To highlight the impact of different user electricity consumption behaviors on carbon flow and considering that network losses are relatively small to avoid the complex matrix operations caused by reactive power, the method used here is based on matrix-form carbon emission flow calculations [24]. In this method, the power flow corresponding to the transaction and nontrading components is decomposed to further calculate the user’s indirect carbon emissions. A schematic diagram is shown in Figure 2.
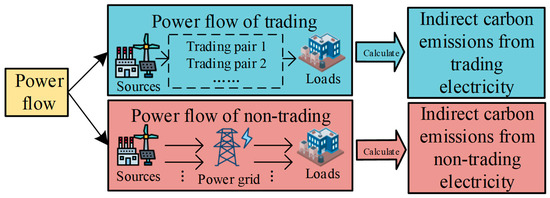
Figure 2.
Schematic diagram for calculating indirect carbon emissions from trading and nontrading electricity.
The calculation formulas are as follows [22]:
where denotes the actual generation injection matrix, representing the connection relationships between all generation units and the power system, as well as their actual injection power; denotes the generation injection matrix for the trading segment, representing the connections between contracted generation units and the power system, along with their trading power; denotes the generation injection matrix for the nontrading segment, representing the output of generation units without trading contracts; denotes the actual branch power flow distribution matrix, representing the actual active power flow distribution of the system; denotes the branch power flow distribution matrix for the trading segment, representing the flow distribution induced by bilateral electricity trading contracts; denotes the branch power flow distribution matrix for the nontrading segment, representing the flow distribution induced by nontrading electricity; denotes the actual load distribution matrix, representing the load distribution at each system node; denotes the load distribution matrix for the trading segment, representing the load distribution of users with bilateral electricity trading contracts; denotes the load distribution matrix for the nontrading segment, representing the load distribution of users without bilateral electricity trading contracts; and S denotes the set of trading node pairs in the system.
On the basis of the information of trading node pairs, the distribution of power flows induced by electricity trading can be further clarified. The power transfer distribution factor (PTDF) method [36] is adopted to quantify the changes in system power distribution caused by variations in bilateral contracts between generator nodes and load nodes. The branch power flow variation induced by a trading contract s can be expressed as follows:
where denotes the power transfer distribution factor matrix and denotes the nodal injection power column vector of trading contract s at time t. Assuming the contracted electricity of contract s at time t, the corresponding element at the generator node is , the element at the load node is , and all other elements are zero.
By combining (7), the branch power flow distribution of the nontrading segment can be decomposed as follows:
- 2.
- Calculation of Carbon Emission Flows for Trading and Nontraveling Segments
For the trading segment, the carbon emission flow embedded in the transactions is considered. For any trading pair s, all electricity-related carbon emissions originate entirely from the corresponding generating units involved in the transaction. Assuming that the electricity trading contract s involves generation unit i and load j, the carbon emission factor at the node is calculated as follows:
where represents the electricity-related carbon emission factor of node j under trading contract s and denotes the generation carbon emission factor of unit i under the same contract.
The indirect carbon emissions associated with the electricity consumption of the user under trading contract s can then be calculated as follows:
where denotes the indirect carbon emissions associated with the electricity consumption of user j under trading contract s.
For the nontrading segment, the embedded carbon emission flows can be calculated on the basis of the decomposed generation injection matrix, branch power flow distribution matrix, and load distribution matrix corresponding to the nontrading segment.
In accordance with the physical interpretation of nodal carbon potential in [37], the carbon potential at a given node is determined jointly by the carbon emission flows from the generators connected to that node and the carbon flows entering the node from other nodes. The nodal carbon potential thus represents the indirect carbon emission factor of the node, typically expressed in units of kgCO2/kWh.
The formula for calculating the carbon emission factor of the nontrading segment at each node is as follows [19]:
where represents the carbon emission factor of node j for the nontrading segment at time t; is an N-dimensional row vector with the i-th element equal to 1; denotes the vector of nodal carbon emission factors for the nontrading segment; represents the vector of carbon emission factors of the generating units in the nontrading segment; and is the nontrading segment nodal active power flux matrix, whose diagonal elements are equal to the sum of the outputs of the nontrading generation units connected to the node and the nontrading active power flowing into the node, whereas all off-diagonal elements are zero. That is,
where denotes an (N + M)-dimensional row vector in which all the elements are equal to 1.
It can be further derived as follows:
Since is a diagonal matrix, it can be further derived as follows:
Finally, it can be consolidated as follows:
The indirect carbon emissions associated with the electricity consumption of the user for the nontrading segment are given by the following equation:
where denotes the indirect carbon emissions associated with the electricity consumption of user j in the nontrading segment at time t and represents the element of matrix , corresponding to the carbon emission factor of the nontrading segment at the node where user j is located at time t.
2.2.2. Consideration of the Method for Accounting User Indirect Carbon Emissions in a Bidirectional System
For a bidirectional system participating in the power market, its charging is treated as a user. The charged energy must also be distinguished between the trading and nontrading segments, and the carbon emissions corresponding to the charged energy are calculated using the method described in Section 2.2.1. However, the accounting of carbon emissions differs depending on whether the system assumes responsibility for the associated emissions.
During discharging, the bidirectional system can be considered a power source. Under the scenario where the system assumes full carbon emission responsibility, its discharged electricity can be considered green power. Additionally, a portion of the electricity charged into the bidirectional system may be green power. Therefore, further development of a carbon accounting method that tracks green electricity consumption is necessary.
Green electricity trading involves bilateral contracts in which electricity-consuming enterprises purchase a predetermined quantity of green power from renewable energy generators or bidirectional systems at a set price. Users can thus obtain corresponding reductions in their indirect carbon emissions. On the basis of the separation of trading and nontrading segments, the trading segment can be further decomposed into green electricity transactions and nongreen electricity transactions.
where denotes the electricity quantity of load j at time t corresponding to green electricity trading contract x; denotes the electricity quantity of load j at time t corresponding to nongreen electricity trading contract y; X represents the set of green electricity contracts; and Y represents the set of nongreen electricity contracts.
Combining Formulas (13) and (14), the carbon emissions associated with the trading segment of the user can be calculated as follows:
where denotes the generation carbon emission factor of the unit under green electricity trading contract x, which is generally equal to 0, and denotes the generation carbon emission factor of the unit under nongreen electricity trading contract y.
Finally, by combining Formula (20), the total carbon emissions of the user can be calculated as follows:
In the setting where the bidirectional system does not assume full carbon emission responsibility, its discharge is not considered green power. The carbon emission factor for its discharged electricity is calculated using Formula (3) and can be directly applied to the formulas in Section 2.2.1 to determine the user’s indirect carbon emissions.
2.3. Research Algorithm
2.3.1. Algorithm Flow
The overall research algorithm of the proposed carbon emission accounting method is illustrated in Figure 3. This flowchart presents the logical structure of data processing, model execution, and result generation. It provides a clear overview of how carbon emission factors, power flows, and bidirectional system operations are integrated into a unified analytical framework.
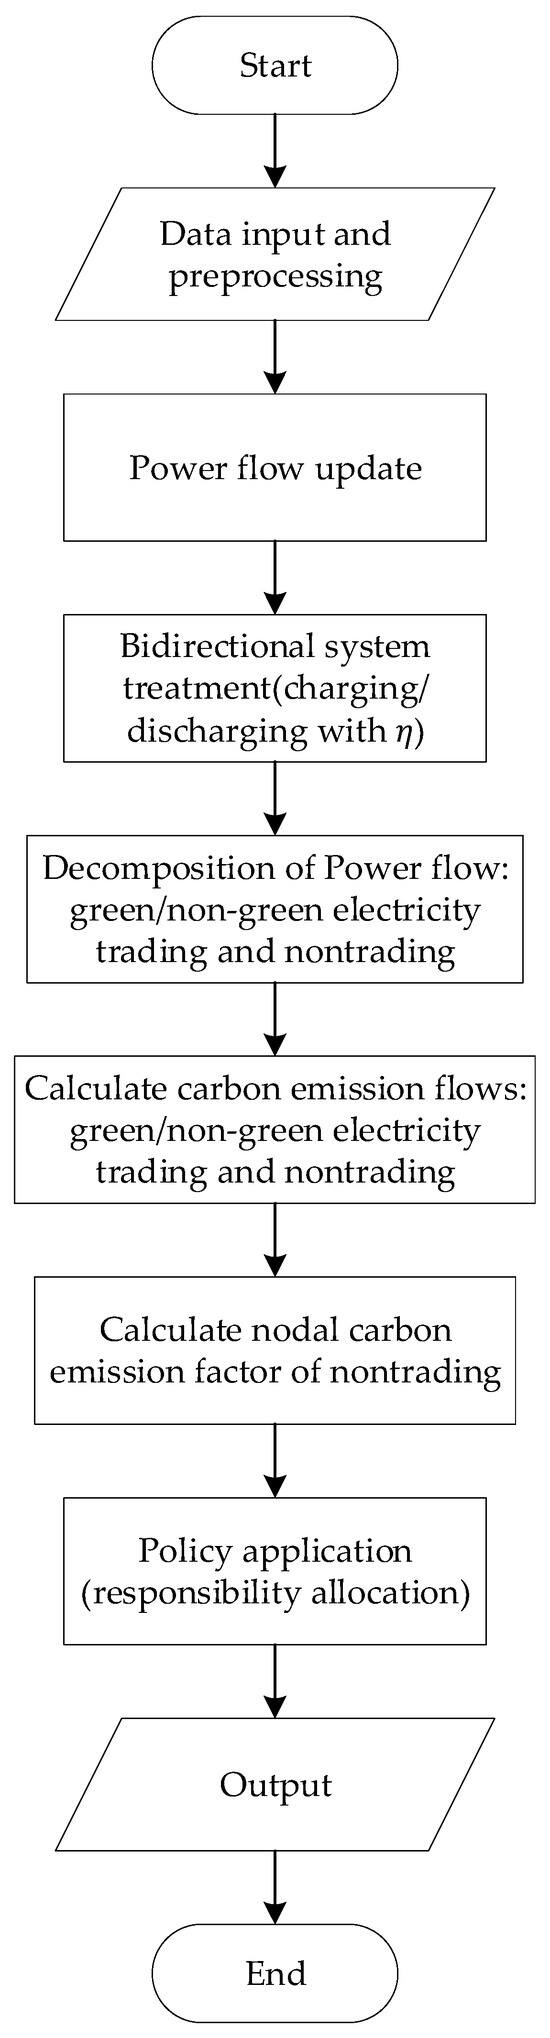
Figure 3.
Flowchart of the research algorithm for carbon emission accounting under bidirectional system integration.
- 1.
- Data input and preprocessing:
- Network topology and line parameters;
- Generator set and their carbon emission factors;
- Time-series of load and renewable generation, market trading records (counterparties, volumes) if applicable;
- Bidirectional system parameters: location, charging/discharging schedule (decision or given), and round-trip efficiency;
- The PTDF matrix is precomputed based on the network structure.
- 2.
- Power flow update: Using net injections (generation, loads, and bidirectional injections), solve DC power flow and obtain line flows and nodal balances.
- 3.
- Bidirectional system treatment (charging/discharging with η):
- Charging: add charging demand at the storage/V2G node; assign carbon according to the policy.
- Discharging: inject ; propagate its carbon intensity (which reflects charging provenance and losses) to downstream nodes via PTDF.
- 4.
- Decomposition of power flow: green/non-green electricity trading and nontrading:
- Trading electricity: allocate carbon responsibility directly from the seller’s generation portfolio to the buyer according to the contract volume and time stamp (transaction-aware attribution).
- Non-trading electricity: apply PTDF-based carbon flow tracing to apportion the remaining supply to each load/node proportionally to physical flow paths.
- 5.
- Calculate carbon emission flows: green/non-green electricity trading and nontrading:
- Carbon emission flows are computed using the power flow decomposition results together with the carbon emission factors and generation outputs of units located at each node.
- 6.
- Calculate nodal carbon emission factor of nontrading:
- Non-trading carbon emission factors are derived from the decomposed carbon emission flows results.
- 7.
- Policy application (responsibility allocation):
- Full responsibility: all emissions associated with charged electricity are assigned to the bidirectional system; discharged electricity is treated as carbon-free at the point of delivery, avoiding double counting.
- No responsibility: emissions remain with generators; discharged electricity inherits the charging-time system carbon content and is traced physically to receiving nodes; storage/V2G does not carry net responsibility.
- 8.
- Output:
- Nodal carbon emission factors and total carbon emissions;
- Scenario comparisons (Full vs. No responsibility; Trading vs. Nontrading);
- Carbon emission responsibility by node/user/contract;
- Bidirectional system’s carbon emissions data.
2.3.2. Handling of the Spatiotemporal Variability of Carbon Emission Factors
The proposed method can incorporate dynamic updates of carbon emission factors through real-time generation data. In the present study, for clarity, we used static emission factors corresponding to the generation mix at a given time. However, the model structure allows emission factors to be updated at each time step, enabling time-varying carbon intensity tracking once real-time data are available.
2.3.3. Computational Requirements and Scalability
The proposed accounting framework involves matrix operations and power transfer distribution factor (PTDF)-based decomposition to trace carbon emission flows. These computations are linear in the number of buses and transactions, and the primary computational burden lies in solving the power flow distribution matrix and performing matrix multiplications. For the test systems used in this study, all simulations can be completed within seconds on a standard desktop computer.
In large-scale, real-world power systems with thousands of nodes and contracts, the computational complexity remains tractable because PTDF matrices are sparse and structured, allowing efficient implementation through sparse-matrix algebra or parallel processing. Furthermore, since the PTDF matrix depends only on network topology and line parameters, it can be precomputed and reused, which significantly reduces computational cost in iterative simulations or real-time applications.
Overall, the method scales efficiently with system size and can be extended to regional or national power systems with minimal additional computational burden when combined with modern data-processing tools and parallel computing techniques.
2.3.4. Temporal Resolution and Real-Time Applicability
The temporal resolution of the proposed model can be flexibly adjusted according to data availability and application objectives. In this study, simulations are conducted on an hourly basis, which balances computational efficiency and temporal accuracy. However, the underlying formulation—particularly the power flow and emission factor updating mechanisms—can operate at finer resolutions, such as 15 min or 5 min intervals, when high-frequency data are available.
Because the model structure relies primarily on algebraic operations and precomputed PTDF matrices, its computational efficiency enables near–real-time carbon accounting. When integrated with real-time dispatch and metering systems, the approach can provide dynamic feedback on carbon intensity for grid operators and market participants. This makes it suitable for applications such as real-time carbon labeling, carbon-aware dispatch optimization, and low-carbon market settlement in future power markets.
3. Results
In this study, case analyses based on both the PJM 5-bus system and the IEEE 30-bus system are conducted.
3.1. PJM 5-Bus System
The generation unit information for the PJM 5-bus system is presented in Table 1.

Table 1.
Information on the generator in the PJM-5 bus system.
The carbon emission factor of the bidirectional system differs depending on whether it assumes carbon emission responsibility, and this will be analyzed in detail below.
3.1.1. Analysis of Power Flow Decomposition and Carbon Flow Results Considering Power Market Trading Contracts
Taking the power flow distribution at a given moment as an example, a carbon flow analysis is carried out, as shown in Figure 4.
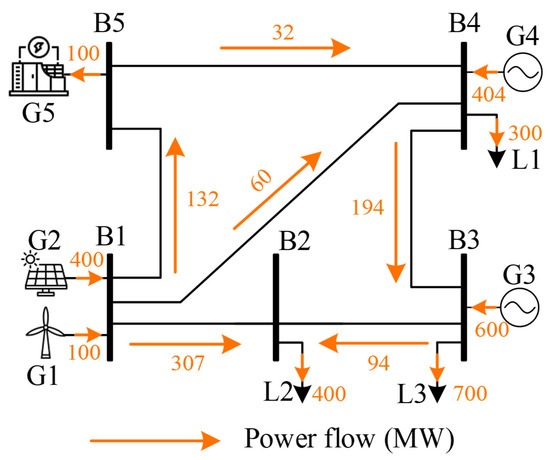
Figure 4.
Power flow information of the PJM-5 bus system at some time.
Assume that load L2 has electricity trading contracts of 100 MWh each with generators G2 and G3. Since G2 is a photovoltaic unit, the contract between L2 and G2 is categorized as a green electricity trading contract. The trading power flow is first decomposed into a green electricity trading segment and a nongreen electricity trading segment, as shown in Figure 5.
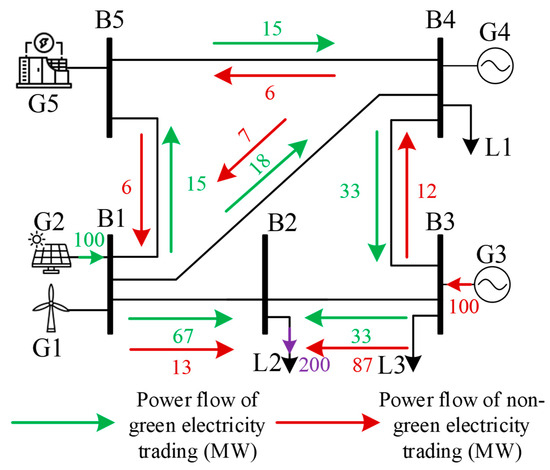
Figure 5.
Carbon flow results under trading distribution. The purple arrow represents the total electricity flow to L2, including both green and non-green electricity.
Furthermore, on the basis of the actual power flow information and the trading power flow information, the nontrading segment of the power flow can be decomposed as shown in Figure 6.
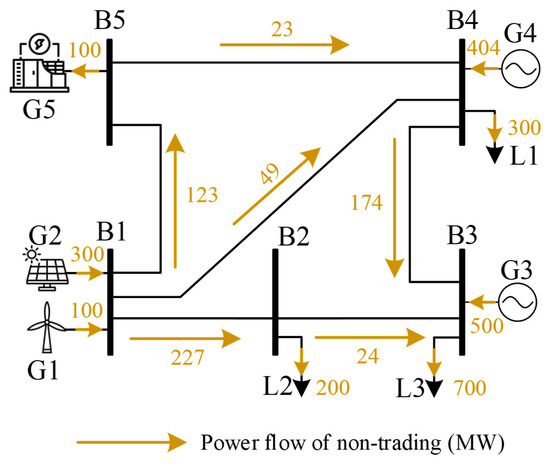
Figure 6.
Carbon flow results under nontrading distribution.
On the basis of the trading and nontrading power flows, the carbon emission factors of system nodes can be calculated. The indirect carbon emissions of each load are subsequently obtained according to their electricity consumption, as shown in Table 2.
Table 2.
Indirect carbon emissions of loads.
The indirect carbon emissions of L2 increase after it participates in market transactions. Although L2 signs a 100 MWh green electricity trading contract with G2, it also signs a 100 MWh contract with G3 (a coal-fired unit). Under natural power flows, the electricity actually received from G3 is less than 100 MWh, and the introduction of trading reallocates additional carbon responsibility to L2, thereby increasing its indirect emissions. In contrast, the electricity consumption of L3 is supplied mainly by G3; however, because of the bilateral contract between L2 and G3, the corresponding carbon responsibility is shifted to L2, resulting in a decrease in L3’s indirect carbon emissions.
When only green electricity trading is considered, the indirect carbon emissions of L2 decrease significantly, as the emission reduction benefits of contracted green electricity are exclusively attributed to L2. For other loads, however, carbon emissions increase. In the absence of market transactions, the green electricity from G2 is shared among loads according to natural power flows. Once green electricity trading is introduced, part of G2’s output is explicitly allocated to L2, whereas the remaining nontrading segment is redistributed to L1 and L3. This reassignment increases the carbon emission responsibility of loads L1 and L3.
This phenomenon is also reflected in the carbon emission factors of the nontrading segment. A comparison of the nodal nontrading carbon emission factors before and after market transactions is presented in Table 3.
Table 3.
Indirect carbon emission factor of loads of non-trading part.
Calculating the carbon emission factors of the nontrading segment helps clarify the electricity-related carbon responsibilities of users under market conditions. Notably, the carbon accounting for loads is performed by multiplying the carbon emission factors of both the trading and nontrading segments by the corresponding electricity quantities. The table above presents only the carbon emission factors of the nontrading segment, which are primarily calculated on the basis of the decomposed natural power flow distribution. For L2, the nontrading electricity is supplied mainly by green generation units; thus, under scenarios considering electricity trading, the nontrading carbon emission factor of L2 is relatively low.
The method proposed in this study enables an effective accounting of carbon emissions that considers market trading behavior. It can guide users in formulating market participation strategies to achieve low-carbon electricity consumption.
3.1.2. Analysis of Indirect Electricity Carbon Emissions Based on Different Accounting Methods for Bidirectional Systems
Assume that the bidirectional system charges at time t1 and discharges at time t2 (t1 and t2 are not necessarily consecutive). Indirect electricity carbon emissions are analyzed under scenarios where the system either assumes full carbon emission responsibility or does not.
The charging and discharging states, as well as the trading behaviors of the bidirectional system, are defined as follows:
- At time t1, the bidirectional system is in a charging state. We assume that 50 MWh of the charged electricity is purchased through a bilateral contract with G4, whereas the remaining segment is nontrading. The trading arrangements between other generators and loads are consistent with the settings in Section 3.1.1.
- At time t2, the bidirectional system is in a discharging state. Assume it discharges fully with an efficiency of 0.9, delivering 90 MWh entirely to L1 through bilateral trading. For analytical simplicity, other generators and loads are assumed not to participate in trading, and the load demand is the same as that at t1.
- 1.
- Bidirectional System Assuming Full Carbon Emission Responsibility
At time t1, when the bidirectional system is charging, it can be treated as a load. The carbon emissions and carbon emission factors of each load are presented in Table 4.
Table 4.
Carbon emissions of each load and indirect carbon emission factors of the nontrading segment with a bidirectional system connected at time t1.
Compared with the results in Table 2 and Table 3, the carbon emissions and the nontrading carbon emission factor of L1 decrease. This is because the bilateral contract between the bidirectional system and G4 (a gas-fired unit) directs the carbon responsibility of the corresponding 50 MWh to the bidirectional system, reducing the proportion of electricity that L1 receives from G2. At time t2, when the bidirectional system discharges, it can be treated as a generation source. The carbon emissions and carbon emission factors of each load are presented in Table 5.
Table 5.
Carbon emissions of each load and indirect carbon emission factors of the nontrading segment with a bidirectional system connected at time t2.
The results indicate that under unchanged load demand, L1 can effectively reduce its carbon emissions by engaging in transactions with the bidirectional system.
- 2.
- Bidirectional System Not Assuming Carbon Emission Responsibility
At time t1, when the bidirectional system is charging, its carbon emissions are zero under the assumption that it does not assume carbon emission responsibility. On the basis of the results in Table 3 and using Formulas (3) and (4), the carbon emission factor of the bidirectional system during discharging at time t2 is calculated to be 0.2112 tCO2/MWh. The carbon emissions of each load are presented in Table 6.
Table 6.
Carbon emissions of each load and indirect carbon emission factors of the nontrading segment with a bidirectional system connected at time t2 under the setting of bidirectional system not assuming carbon emission responsibility.
The carbon responsibility of the bidirectional system is directed toward L1. If the discharged electricity of the bidirectional system is not entirely sold through market transactions, the remaining portion would be allocated to other users according to the natural power flows.
3.2. IEEE 30-Bus System
To further validate the applicability of the proposed method in a larger-scale power network, simulations are conducted using the IEEE 30-bus system. The system topology is shown in Figure 7.
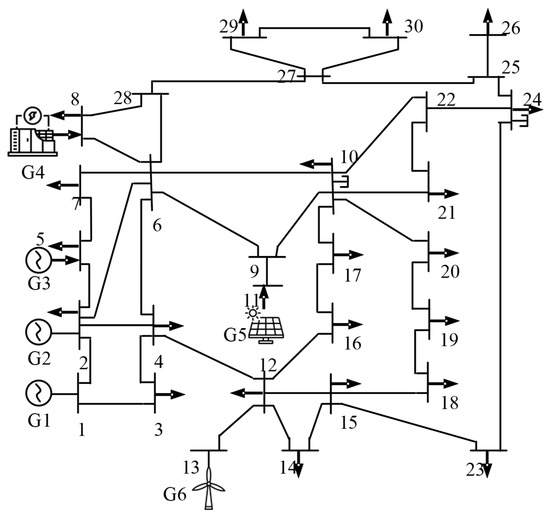
Figure 7.
IEEE-30 bus system.
The information regarding each generation unit is presented in Table 7.
Table 7.
Information of generator in IEEE-30 bus system.
For analytical purposes, four time periods from 12:00 to 16:00 on a typical day are selected for carbon flow calculations, denoted as t1 to t4. Assume that the load at bus 30 (denoted as L30) participates in market trading. The trading counterparts and electricity quantities for each time period are presented in Table 8.
Table 8.
Trading situation.
During the [t1, t2] periods, the bidirectional system charges and is treated as a load, with charging quantities of 60 MWh and 40 MWh for the two periods, respectively. During the [t3, t4] periods, the bidirectional system discharges and is treated as a generation source, with discharging quantities of 20 MWh and 70 MWh for the two periods, respectively.
Multiple scenarios are constructed for analysis, as shown in Table 9:
Table 9.
Multi-scenario setting information.
The carbon emission factors of each load node under the different scenarios are shown in Figure 8:
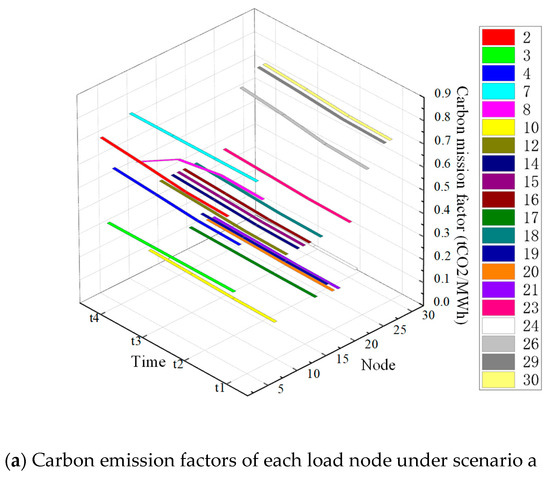
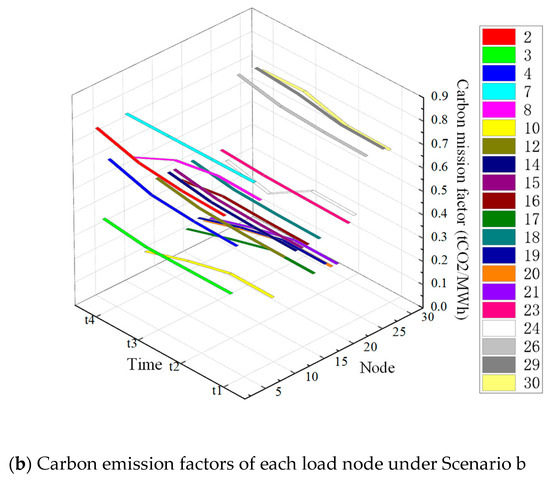
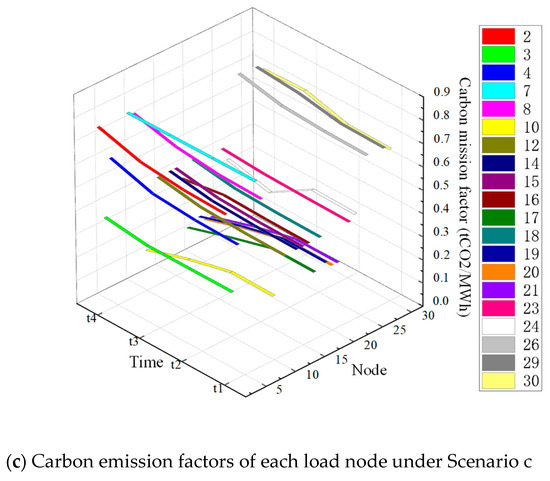
Figure 8.
Carbon emission factors of each load node under the different scenarios.
Comparing Scenario a and Scenario b, from t1 to t3, L30 purchases green electricity. The green attribute of this electricity is used by L30 to offset its carbon emission responsibility. As a result, compared with Scenario a, the carbon emission factors of the other loads generally increase in Scenario b. At t4, L30 purchases electricity from fossil generation, and the corresponding carbon responsibility is directly borne by L30. Therefore, relative to Scenario a, the carbon emission factors of the other loads generally decrease in Scenario b.
Comparing Scenario b and Scenario c, in Scenario b, the bidirectional system assumes carbon emission responsibility, and its discharge releases green electricity. Consequently, compared with those in Scenario b, the carbon emission factors of all the loads are generally greater in Scenario c.
Moreover, the figure shows that nodal carbon emission factors vary significantly across different time periods, indicating that the proposed method can dynamically calculate the carbon emission factors of each node on the basis of trading information and power flow data.
Next, the indirect carbon emissions of the loads are analyzed. First, under the assumption that the bidirectional system does not assume carbon emission responsibility, the carbon emission factor of its discharging is calculated on the basis of the nodal carbon emission factors during the preceding charging periods, resulting in 0.7967 tCO2/MWh.
Table 10 summarizes the charging and discharging amounts of the bidirectional system and the corresponding carbon emissions across four time periods.
Table 10.
Charging/discharging power and carbon emissions of the bidirectional system.
In Table 10, t1 and t2 represent the charging periods. Under the setting where the bidirectional system assumes full carbon emission responsibility, the amount of carbon emissions it bears is determined by the carbon emission factor of the corresponding node at that moment (see Figure 7). Therefore, the carbon emissions released during t3 and t4 are zero. In contrast, under the setting where the bidirectional system does not assume carbon emission responsibility, the carbon emissions during t1 and t2 are only “temporarily stored” by the system without actual responsibility, and are released back to the power grid during the discharging periods t3 and t4.
This table enables a clearer comparison of how carbon emissions vary with bidirectional power exchange over time and highlights the dynamic relationship between the system’s operational state and its carbon characteristics.
For further analysis, the indirect carbon emissions of node 8 (where the bidirectional system is located) and node 30 (where the market-participating load is located) are examined. The indirect carbon emissions of node 8 under the three scenarios are shown in Figure 9.
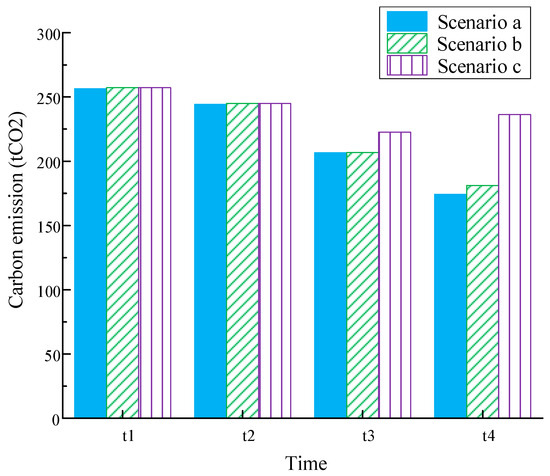
Figure 9.
Indirect carbon emissions of node 8 under the three scenarios.
As shown in the figure, under Scenario c, the carbon emissions during [t3, t4] are significantly higher than those in Scenarios a and b because, in Scenario c, the bidirectional system does not assume carbon emission responsibility, and node 8 has a local load in addition to the bidirectional system. As a result, the discharged electricity from the bidirectional system is primarily consumed locally. In Scenario b, however, the bidirectional system releases green electricity, resulting in lower carbon emissions at node 8.
The indirect carbon emissions of node 30 under the three scenarios are shown in Figure 10.
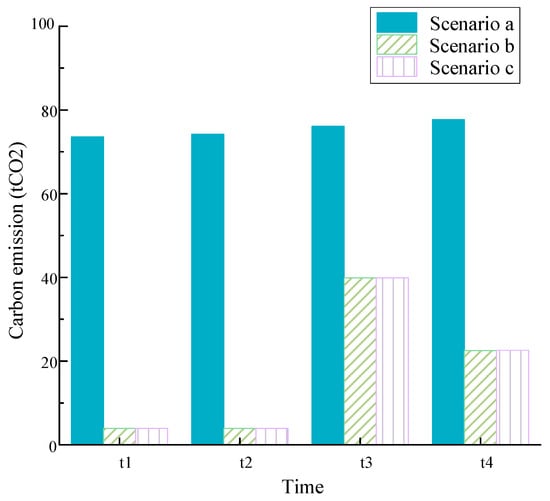
Figure 10.
Indirect carbon emissions of node 30 under the three scenarios.
As shown in Figure 9, L30 can significantly reduce its indirect carbon emissions through green electricity trading. The increase at t3 is due to a reduction in its green electricity purchases, whereas at t4, L30 purchases 100 MWh of gas-fired electricity. Compared with the pre-trading carbon emissions, this still represents a reduction, since under natural power flows, L30’s main electricity source would otherwise be coal-fired generation, which has a higher carbon emission factor.
Although the allocation of carbon responsibility among users varies under different scenarios, the total carbon emissions borne by the user side remain unchanged. In other words, different settings merely transfer carbon responsibility among users without affecting the unbiasedness of the accounting method proposed in this study. This finding demonstrates that the method can effectively avoid the double counting of carbon emissions.
4. Discussion
4.1. Practical Alignment and Challenges of Carbon Responsibility Allocation Policies
The two carbon responsibility allocation policies—full responsibility and no responsibility—represent alternative regulatory perspectives regarding the treatment of bidirectional systems in low-carbon power markets.
Under the full responsibility policy, all carbon emissions associated with the electricity used for charging are fully borne by the bidirectional system itself, while the electricity discharged is regarded as green electricity with a zero emission factor. This approach aligns with emerging market mechanisms, such as green electricity trading, voluntary carbon offsetting, and contract-for-difference (CfD)–based renewable procurement frameworks, which emphasize traceability and clear ownership of carbon attributes. It enables transparent accounting of emission reduction benefits and facilitates the integration of bidirectional systems into green certificate or carbon credit markets. However, this approach also increases operational costs for storage operators and may require compensatory mechanisms (e.g., discharge price premiums or installation subsidies) to maintain economic viability.
Conversely, under the no responsibility policy, the bidirectional system transfers all carbon responsibilities associated with charging to the external grid, and its discharged electricity inherits the average carbon intensity of the system during the charging period. This approach reflects current practices in ancillary service and grid-side energy storage operations, where emission responsibility remains with the system operator rather than the storage entity. It reduces the administrative complexity of emission tracing and aligns with the existing settlement structure of centralized markets. Nevertheless, it may lead to lower transparency in tracking green electricity and potential inconsistency with market-based carbon pricing schemes.
In practice, the adoption of either policy depends on the maturity of market mechanisms and regulatory frameworks in different regions. Systems with advanced carbon metering infrastructure (e.g., smart metering or digital twin models) are more suitable for the full-responsibility approach, whereas early-stage markets may initially adopt the no-responsibility approach to simplify implementation. In this context, the proposed model provides a flexible accounting framework that can accommodate both policy settings and support gradual transition as market rules evolve.
4.2. Incorporation of Renewable Energy Certificates and Green Attributes
The proposed carbon accounting method can be further extended to incorporate renewable energy certificates (RECs) or other market-based green attribute mechanisms. In current power markets, RECs are widely used to represent the ownership of renewable generation and to facilitate the separation between physical electricity delivery and environmental benefits. Within the framework developed in this study, RECs can be modeled as an additional layer of carbon responsibility transfer, where the carbon-free attribute of renewable generation is explicitly linked to the purchaser through contractual data.
Specifically, when renewable energy output is associated with REC issuance, the zero-carbon attribute can be allocated to the corresponding load nodes or market participants by adjusting the emission responsibility matrix. This allows the model to distinguish between physical carbon flow tracing and market-based carbon attribute trading, thereby ensuring consistency with existing carbon trading and green certificate systems. Such an extension enhances the applicability of the proposed method in policy and market environments where environmental attributes are tradable and verifiable.
From a regulatory perspective, coupling the proposed accounting approach with carbon trading platforms would enhance market transparency and encourage low-carbon dispatch behavior. The same mechanism can also facilitate the tracking of renewable attributes across transactions, improving consistency between physical electricity flows and market-based environmental claims. However, practical implementation may require additional data-sharing protocols and verification standards to ensure traceability and prevent double counting. These issues are identified as promising directions for future research on the institutional design of carbon-responsibility markets.
4.3. Fairness Considerations Under the “No Responsibility” Policy
Under the “no carbon responsibility” policy, the bidirectional system transfers the carbon responsibility of charging electricity to the grid, while its discharged electricity inherits the system’s average carbon intensity at the time of charging. This may raise fairness concerns, particularly when discharged energy is consumed locally by nearby loads, potentially leading to underestimation of localized emissions. In the proposed framework, this issue is addressed through node-level carbon flow tracing, which ensures that any discharged energy still carries the corresponding upstream emission intensity determined by power flow paths. Consequently, even under the no-responsibility setting, the spatial distribution of carbon responsibility remains physically consistent.
Nevertheless, the authors acknowledge that this policy may underrepresent the incentive for emission reduction at the local scale. Future work will further explore hybrid allocation mechanisms, where partial carbon responsibility is retained by bidirectional systems to balance fairness, accuracy, and policy feasibility.
4.4. Applicability to Other Bidirectional Systems
Although this study focuses on energy storage and vehicle-to-grid (V2G) systems, the proposed carbon accounting framework is universally applicable to other bidirectional resources, such as demand response (DR), distributed generation (DG) with export capability, and hybrid microgrids. The essential feature of these systems—both importing and exporting electricity at different times—can be readily represented within the same modeling structure by treating their power exchanges as time-varying bidirectional injections at corresponding nodes.
In such extensions, the same carbon flow tracing and responsibility allocation logic applies: when the resource consumes electricity (import phase), it inherits the upstream carbon intensity of the grid, and when it supplies electricity (export phase), it redistributes carbon responsibility downstream according to the nodal emission factor. Therefore, the proposed method provides a unified analytical framework for quantifying indirect carbon emissions across diverse bidirectional technologies and can support comprehensive low-carbon management of future integrated energy systems.
4.5. Behavioral and Investment Implications
The proposed carbon accounting framework not only quantifies indirect carbon emissions but also provides behavioral and economic signals that can influence the operation and investment decisions of bidirectional system owners. By revealing the temporal and locational variations in carbon intensity, the method allows users to optimize operational strategies to minimize their carbon footprint.
In the long term, such transparent accounting can guide investment in storage, V2G, and renewable integration, as investors can better assess the carbon-reduction value of different technologies and siting options. When combined with carbon pricing or green certificate mechanisms, these insights can enhance the economic attractiveness of cleaner and more flexible resources. Thus, the proposed model not only supports accurate emission tracking but also contributes to behavioral change and investment reallocation toward a more decarbonized and efficient power system.
5. Conclusions
This study addresses the new challenges in accounting for indirect electricity carbon emissions posed by the integration of large-scale bidirectional systems (such as energy storage and V2G) under power market reforms. A carbon accounting model was developed that incorporates the dynamic carbon characteristics of bidirectional systems and electricity market contract data, and case studies were conducted. The main findings are as follows:
- Market trading significantly reshapes the allocation of carbon emission responsibility
The proposed method separates the power flows corresponding to trading and non-trading electricity, enabling independent carbon accounting for each portion. In the PJM 5-bus system, when L2 signed 100 MWh bilateral contracts with PV and coal-fired units, its indirect carbon emissions increased from 65.0 tCO2 (without trading) to 80.8 tCO2, while L3’s emissions decreased from 478.6 tCO2 to 459.4 tCO2. When only green electricity trading was considered, L2’s emissions dropped to 43.7 tCO2, whereas the emissions of other loads rose accordingly. These results indicate that market transactions can directly transfer carbon responsibility to buyers, while the non-trading portion is allocated based on the nodal carbon emission factors, demonstrating that market trading profoundly alters the distribution of carbon responsibility.
- 2.
- The proposed method captures the temporal variability of nodal carbon emission factors
In the IEEE 30-bus system, nodal carbon emission factors vary notably across time periods t1–t4 and three scenarios (a–c). Under Scenario b, L30’s purchases of green electricity during t1–t3 reduced its own carbon emissions, while the corresponding non-trading nodal factors shifted with both trading volume and system power flow, slightly increasing other users’ emission intensities. When L30 purchased gas-fired electricity at t4, the nodal carbon factors of other loads decreased accordingly. These results confirm that the proposed approach effectively reflects the time-varying characteristics of nodal carbon intensity and accurately quantifies how trading behavior reshapes the distribution of carbon flows within the system.
- 3.
- Fairness of carbon responsibility allocation for bidirectional systems
In the IEEE 30-bus case, under the full-responsibility setting, the bidirectional system bore all charging-related emissions—47.802 tCO2 and 31.868 tCO2 at t1 and t2, respectively. Under the no-responsibility setting, the charging-stage emissions were only “temporarily stored” and released during discharging periods at t3 and t4, amounting to 15.934 tCO2 and 55.769 tCO2. The total system emissions remained unchanged under both settings, indicating that the proposed method successfully captures the dynamic carbon flow of bidirectional systems and provides a fair and consistent allocation of charging–discharging carbon responsibility.
- 4.
- Contribution to sustainable carbon management
By distinguishing between carbon responsibility transferred through trading and that allocated via physical power flow, the proposed framework enables traceable and transparent carbon accounting at the user, contract, and node levels. Case results demonstrate that green electricity trading and bidirectional system responsibility policies can reshape nodal carbon factors without double counting, thereby facilitating more proactive and informed carbon management among market participants.
This study primarily employs standard test systems to ensure transparency and reproducibility of the proposed method. Although real market data are not included at this stage, the model’s structure and data requirements are fully compatible with actual power market operation data, including metered generation, transaction records, and bidirectional system logs. Future work will focus on empirical validation using real-world datasets from regional power markets to verify model robustness under practical operating conditions. Such extensions will enable further assessment of policy impacts and enhance the applicability of the proposed carbon accounting framework to real market environments.
Author Contributions
Conceptualization, L.X. and G.L.; methodology, L.X. and X.D.; software, Z.G. and N.P.; validation, L.X., G.L. and X.D.; formal analysis, L.X. and X.D.; investigation, Y.C. and Z.G.; resources, G.L. and N.P.; data curation, Y.C. and Z.G.; writing—original draft preparation, L.X. and Z.G.; writing—review and editing, Z.G. and N.P.; supervision, L.X. and Y.C.; project administration, L.X., Y.C. and Z.G. All authors have read and agreed to the published version of the manuscript.
Funding
This research was funded by Science and Technology Project of Beijing Power Exchange Center Co., Ltd. (Grant No. SGJY0000YJJS2400052).
Institutional Review Board Statement
Not applicable.
Informed Consent Statement
Not applicable.
Data Availability Statement
The original contributions presented in this study are included in the article. Further inquiries can be directed to the corresponding author.
Conflicts of Interest
Authors Liye Xie, Guodong Li and Xiaoliang Dong were employed by the company Beijing Power Exchange Center Co., Ltd. The remaining authors declare that the research was conducted in the absence of any commercial or financial relationships that could be construed as a potential conflict of interest. The authors declare that this study received funding from Beijing Electric Power Trading Center Co., Ltd. The funder had the following involvement with the study: Sustainability-oriented Indirect Carbon Emission Accounting for Electricity Considering Bidirectional System Integration in the Power Market Environment.
Nomenclature
| Symbol | Definition | Unit |
| Carbon emission factor during discharging when the bidirectional system assumes full carbon emission responsibility | tCO2/MWh | |
| Corresponding carbon emissions under this setting | tCO2 | |
| Carbon emission factor at the grid connection point of the bidirectional system at time t | tCO2/MWh | |
| Charging amount of the bidirectional system at time t | MW | |
| The i-th charging cycle | h | |
| Cumulative charging duration of the bidirectional system | h | |
| Carbon emission factor of the bidirectional system during discharge when it does not assume carbon emission responsibility | tCO2/MWh | |
| Maximum dischargeable energy of the bidirectional system within the interval [t1, t2] | MWh | |
| Carbon emissions of the bidirectional system when it does not assume carbon emission responsibility | tCO2 | |
| Efficiency of the bidirectional system | % | |
| Actual generation injection matrix | MW | |
| Generation injection matrix for the trading segment | MW | |
| Generation injection matrix for the nontrading segment | MW | |
| Actual branch power flow distribution matrix | MW | |
| Branch power flow distribution matrix for the trading segment | MW | |
| Branch power flow distribution matrix for the nontrading segment | MW | |
| Actual load distribution matrix | MW | |
| Load distribution matrix for the trading segment | MW | |
| Load distribution matrix for the nontrading segment | MW | |
| Power transfer distribution factor matrix | / | |
| Nodal injection power column vector of trading contract s at time t | MW | |
| Electricity-related carbon emission factor of node j under trading contract s | tCO2/MWh | |
| Generation carbon emission factor of unit i under the contract s | tCO2/MWh | |
| Indirect carbon emissions associated with the electricity consumption of user j under trading contract s | tCO2 | |
| Carbon emission factor of node j for the nontrading segment at time t | tCO2/MWh | |
| N-dimensional row vector with the i-th element equal to 1 | / | |
| Vector of nodal carbon emission factors for the nontrading segment | tCO2/MWh | |
| Vector of carbon emission factors of the generating units in the nontrading segment | tCO2/MWh | |
| Nontrading segment nodal active power flux matrix | MW | |
| (N + M)-dimensional row vector in which all the elements are equal to 1 | / | |
| Indirect carbon emissions associated with the electricity consumption of user j in the nontrading segment at time t | tCO2 | |
| tCO2/MWh | ||
| Electricity quantity of load j at time t corresponding to green electricity trading contract x | MWh | |
| Electricity quantity of load j at time t corresponding to nongreen electricity trading contract y | MWh | |
| Generation carbon emission factor of the unit under green electricity trading contract x | tCO2/MWh | |
| Generation carbon emission factor of the unit under nongreen electricity trading contract y | tCO2/MWh |
Abbreviations
The following abbreviations are used in this manuscript:
| V2G | Vehicle-to-grid |
| Greenhouse Gas | GHG |
| World Resources Institute | WRI |
| World Business Council for Sustainable Development | WBCSD |
| SOE | State-of-energy |
| PTDF | Power transfer distribution factor |
| CfD | Contract-for-difference |
| REC | Renewable energy certificate |
| DR | Demand response |
| DG | Distributed generation |
References
- Central People’s Government of the People’s Republic of China. Speech at the General Debate of the 75th Session of the United Nations General Assembly. Available online: https://www.gov.cn/gongbao/content/2020/content_5549875.htm (accessed on 12 August 2024).
- China Energy News. Low Carbon Transformation of Electric Power Starts Acceleration Mode. Available online: https://paper.people.com.cn/zgnybwap/html/2024-08/12/content_26075491.htm (accessed on 12 August 2024).
- Li, Q.; Zhao, F.; Zhang, L.; Zhang, X.; Liu, J.; Chen, Y.; Li, X. Dynamic Carbon Emission Measurement and Optimal Dispatching of Power Systems Considering Dual-Carbon Targets. IEEE Access. 2025, 13, 91200–91214. [Google Scholar] [CrossRef]
- Kang, C.; Du, E.; Li, Y.; Zhang, N.; Chen, Q.; Guo, H.; Wang, P. Key Scientific Problems and Research Framework for Carbon Perspective Research of New Power Systems. Power Syst. Technol. 2022, 46, 821–833. [Google Scholar]
- Wang, C.; Shi, Z.; Liang, Z.; Li, Q.; Hong, B.; Huang, B.; Jiang, L. Key Technologies and Prospects of Demand-Side Resource Utilization for Power Systems Dominated by Renewable Energy. Autom. Electr. Power Syst. 2021, 45, 37–48. [Google Scholar]
- Lupu, Ș.A.; Floricău, D. Bidirectional Energy Transfer Between Electric Vehicle, Home, and Critical Load. Energies 2025, 18, 2167. [Google Scholar] [CrossRef]
- Reddy, S.B.; Madhulikha, V.; Venkatasai, C.; Mohiddin, S.S.; Ramya, B.; Tarun, K. Bidirectional Power Flow Control for Electric Vehicle Charging System with Integration of Grid. IOP Conf. Ser. Earth Environ. Sci. 2025, 1529, 012025. [Google Scholar] [CrossRef]
- United Nations Framework Convention on Climate Change (UNFCCC). Glasgow Climate Pact (Decision 1/CP.26); UNFCCC: Glasgow, UK, 2021. [Google Scholar]
- United Nations Framework Convention on Climate Change (UNFCCC). UNFCCC Conference of the Parties Serving as the Meeting of the Parties to the Paris Agreement (CMA); Guidance on Cooperative Approaches Referred to in Article 6, Paragraph 2 (Decision 2/CMA.3); UNFCCC: Glasgow, UK, 2021. [Google Scholar]
- United Nations Framework Convention on Climate Change (UNFCCC). Rules, Modalities and Procedures for the Mechanism Established by Article 6, Paragraph 4 (Decision 3/CMA.3); UNFCCC: Glasgow, UK, 2021. [Google Scholar]
- Hu, H.; Qian, B.; Xiao, Y.; Tang, J.; Ou, J.; Lin, X.; He, P.; Zhang, F. Low-Carbon Scheduling Strategy for Electric Vehicles Considering Carbon Emission Flow and Dynamic Electricity Prices. Front. Energy Res. 2024, 12, 1519963. [Google Scholar] [CrossRef]
- Cheng, M.; Zhang, X.; Wang, Z.; Wang, X. Low Carbon Economic Dispatch of Virtual Power Plant Considering Access to Electric Vehicle Charging Station. Sci. Technol. Eng. 2024, 24, 8115–8126. [Google Scholar]
- Feng, J.; Hao, Z. Bi-Level Optimal Capacity Planning of Load-Side Electric Energy Storage Using an Emission-Considered Carbon Incentive Mechanism. Energies 2022, 15, 4592. [Google Scholar]
- Chen, L.; Tang, W.; Wang, Z.; Zhang, L.; Xie, F. Low-Carbon Oriented Planning of Shared Photovoltaics and Energy Storage Systems in Distribution Networks via Carbon Emission Flow Tracing. Int. J. Electr. Power Energy Syst. 2024, 160, 110126. [Google Scholar] [CrossRef]
- Arbabzadeh, M.; Sioshansi, R.; Johnson, J.X.; Keoleian, G.A. The role of energy storage in deep decarbonization of electricity production. Nat. Commun. 2019, 10, 3413. [Google Scholar] [CrossRef]
- Long, C.; Han, Y.; Wang, X.; Ye, S.; Yang, X.; Lu, Z. Analysis for Node Carbon Emission Characteristics of Distribution Network with Hydro-PV-EV-ESS Considering Energy Loss of ESS. Acta Energiae. Solaris Sin. 2025, 46, 235–244. [Google Scholar]
- Bao, W.; Li, Y.; Ji, J.; Zhang, N.; Li, F.; Zhou, T.; Ling, Y. Carbon Emission Accounting Method for Energy Storage System and Bidirectional Power Load. Power Syst. Technol. 2023, 47, 3049–3058. [Google Scholar]
- Yu, B.; Lei, X.; Shao, Z.; Jian, L. V2G Carbon Accounting and Revenue Allocation: Balancing EV Contributions in Distribution Systems. Electronics 2024, 13, 1063. [Google Scholar] [CrossRef]
- Zhou, T.; Kang, C.; Xu, Q.; Chen, Q. Preliminary Theoretical Investigation on Power System Carbon Emission Flow. Autom. Electr. Power Syst. 2012, 36, 38–43. [Google Scholar]
- Kang, C.; Zhou, T.; Chen, Q.; Wang, J. Carbon Emission Flow from Generation to Demand: A Network-Based Model. IEEE Trans. Smart Grid. 2015, 6, 2386–2394. [Google Scholar] [CrossRef]
- Wang, C.; Li, P.; Yang, Z.; Wang, H. Dynamic tracking of life cycle carbon emissions in power grids based on a flow network model. Sci. Rep. 2025, 15, 26990. [Google Scholar]
- Liu, Y.; Li, Y.; Zhou, C.; Song, J.; Deng, H.; Du, E.; Zhang, N.; Kang, C. Overview of Carbon Measurement and Analysis Methods in Power Systems. Proc. CSEE. 2024, 44, 2220–2236. [Google Scholar]
- World Resources Institute and WBCSD. GHG Protocol Scope 2 Guidance: An Amendment to the GHG Protocol Corporate Standard; World Resources Institute: Washington, DC, USA, 2015. [Google Scholar]
- Li, Y.; Liu, Y.; Yang, X.; He, W.; Fang, Y.; Du, E.; Zhang, N.; Li, J. Electricity Carbon Metering Method Considering Electricity Transaction Information. Proc. CSEE. 2024, 44, 439–451. [Google Scholar]
- Yang, W.; Zhang, N.; Kang, C. Research on Accounting for Enterprise Electricity Carbon Emissions Based on Electricity Market Contracts. Power Syst. Technol. 2024, 48, 4115–4125. [Google Scholar]
- He, H.; Zhou, S.; Zhang, L.; Zhao, W.; Xiao, X. Dynamic Accounting Model and Method for Carbon Emissions on the Power Grid Side. Energies 2023, 16, 5016. [Google Scholar] [CrossRef]
- Ling, C.; Yang, Q.; Wang, Q.; Bartocci, P.; Jiang, L.; Xu, Z.; Wang, L. A Comprehensive Consumption-Based Carbon Accounting framework for Power Systems towards low-carbon transition. Renew. Sustain. Energy Rev. 2024, 206, 114866. [Google Scholar] [CrossRef]
- International Carbon Action Partnership; World Bank. Emission Trading in Practice: Handbook on Design and Implementation, 2nd ed.; World Bank: Washington, DC, USA, 2022. [Google Scholar]
- Wang, J.; Wang, Y.; Zhou, M.; Wu, S.; Yu, T.; Shi, Z. Accounting Method of Users’ Indirect Carbon Emissions Considering Green Electricity Trading. Power Syst. Technol. 2024, 48, 29–39. [Google Scholar]
- Li, Y.; Zhang, S.; Yang, C.; Liu, Y.; Du, E.; Fan, L.; Zhang, N. Real-Time Carbon Accounting Method Considering Green Electricity and Green Certificate Transactions. Proc. CSEE. 2025, 45, 4543–4556. [Google Scholar]
- Zhao, W.; Lin, Y.; Pan, H. What Is the Effect of China’s Renewable Energy Market-Based Coupling Policy?—A System Dynamics Analysis Based on the Coupling of Electricity Market, Green Certificate Market and Carbon Market. Systems 2024, 12, 545. [Google Scholar] [CrossRef]
- Kemper, M.; Styles, A.; Mundt, J.; Werner, R. Harmonizing the application of carbon accounting for emissions from purchased electricity in the context of green claims. Carbon Manag. 2025, 16. [Google Scholar] [CrossRef]
- Kebede, A.A.; Kalogiannis, T.; Van Mierlo, J.; Berecibar, M. A comprehensive review of stationary energy storage devices for large scale renewable energy sources grid integration. Renew. Sustain. Energy Rev. 2022, 159, 112227. [Google Scholar] [CrossRef]
- Hoffstaedt, J.P.; Truijen, D.P.K.; Fahlbeck, J.; Gans, L.H.A.; Qudaih, M.; Laguna, A.J.; De Kooning, J.D.M.; Stockman, K.; Nilsson, H.; Storli, P.-T.; et al. Low-head pumped hydro storage: A review of applicable technologies for design, grid integration, control and modelling. Renew. Sustain. Energy Rev. 2022, 158, 112119. [Google Scholar] [CrossRef]
- Schram, W.; Brinkel, N.; Smink, G.; van Wijk, T.; van Sark, W. Empirical evaluation of V2G round-trip efficiency. In Proceedings of the 2020 International Conference on Smart Energy Systems and Technologies (SEST), Istanbul, Turkey, 7–9 September 2020; pp. 1–6. [Google Scholar]
- Zhang, B. Advanced Power Network Analysis. Master’s Thesis, Tsinghua University, Beijing, China, 2007. [Google Scholar]
- Zhou, T.; Kang, C.; Xu, Q.; Chen, Q. Preliminary Investigation on a Method for Carbon Emission Flow Calculation of Power System. Autom. Autom. Electr. Power Systems. 2012, 36, 44–49. [Google Scholar]


Disclaimer/Publisher’s Note: The statements, opinions and data contained in all publications are solely those of the individual author(s) and contributor(s) and not of MDPI and/or the editor(s). MDPI and/or the editor(s) disclaim responsibility for any injury to people or property resulting from any ideas, methods, instructions or products referred to in the content. |
© 2025 by the authors. Licensee MDPI, Basel, Switzerland. This article is an open access article distributed under the terms and conditions of the Creative Commons Attribution (CC BY) license (https://creativecommons.org/licenses/by/4.0/).