Abstract
The dynamic development of autonomous vehicle (AV) technologies has intensified the need to understand the factors influencing their acceptance. This study aims to develop user profiles reflecting different levels of enthusiasm toward autonomous buses in Warsaw. A quantitative research design was employed, using a survey of 385 residents collected via CAPI, CATI, and CAWI methods. Cluster analysis (k-means method) identified distinct user profiles based on attitudes toward autonomous buses and general trust in technology: Cluster 1—Enthusiastic Adopters, Cluster 2—Sceptical Opponents, and Cluster 3—Cautious Optimists. The study confirmed that demographic characteristics (age, gender, education level, occupational status) significantly influence the level of enthusiasm for autonomous buses. Younger, highly educated, and professionally active individuals showed highest levels of acceptance. Furthermore, a higher level of general trust in technology was positively associated with greater acceptance of autonomous buses. The research highlights important implications and recommends focusing on districts with a higher concentration of Enthusiastic Adopters and targeted communication strategies for Sceptical Opponents and Cautious Optimists. However, study limitations include the geographic restriction to Warsaw and the absence of data capturing changes in attitudes over time. Future research should be expanded to other cities, exploring ongoing dynamics of trust and acceptance. Despite limiting the research to one specific city, the research tool used and the research itself can be applied to similar cities regardless of their geographical location or size.
1. Introduction
The dynamic development of autonomous technologies in urban transport systems causes both opportunities and challenges for cities aiming to enhance mobility, sustainability, and quality of life. As autonomous buses emerge as an innovative solution to address issues such as traffic congestion, environmental pollution, and accessibility barriers, it becomes increasingly important to understand the social acceptance of these technologies among potential users [1,2]. Public acceptance will be a decisive factor for the successful implementation and scalability of autonomous bus systems in urban environments [3,4,5].
Previous studies confirm that users’ demographic characteristics (age, gender, education level, and occupational status) are significant factors influencing the acceptance of autonomous solutions in urban spaces [6,7]; however, each settlement unit, due to its specific characteristics, requires separate and context-specific studies. Despite the growing number of research on autonomous vehicle (AV) adoption, there remains a lack of detailed knowledge about how different user groups perceive and accept autonomous buses, particularly in the context of specific cities such as Warsaw. Socio-demographic characteristics, psychological factors such as trust in technology, and individual mobility needs are known to influence users’ attitudes towards AVs, yet empirical evidence addressing these factors in a structured, profile-based manner is still limited.
The adoption of autonomous vehicles (AVs) in Poland, and Warsaw in particular, is influenced by a unique combination of regulatory, infrastructural, socio-cultural, and perceptual factors. AVs are currently not legal for general use, with testing limited to research purposes on designated tracks, creating a regulatory lag relative to countries such as Germany, the US, or the UK [8]. Warsaw’s road infrastructure requires significant upgrades to support AV technologies, particularly Vehicle-to-Infrastructure (V2I) communication, while ongoing national initiatives aim to improve legislative and technological readiness. Public attitudes exhibit high theoretical acceptance but practical scepticism, shaped by concerns regarding cost, safety, legal liability, cybersecurity, and a strong attachment to conventional vehicles, particularly among older and rural populations [9,10]. In this context, trust in technology emerges as a critical determinant of acceptance, given limited direct experience with AVs and the novelty of the systems. Addressing these gaps, the present study develops empirically derived user profiles—Enthusiastic Adopters, Sceptical Opponents, and Cautious Optimists—integrating demographic characteristics, attitudes toward autonomous buses, and general trust in technology. By situating the analysis within Warsaw’s sociocultural environment, linking psychological factors to AV-specific acceptance, and highlighting heterogeneity in user attitudes, the study provides a foundation for user-centered design and targeted communication strategies, contributing to the emerging discourse on culturally grounded, personalized approaches to AV adoption.
The objective of the present study was to develop user profiles reflecting different levels of enthusiasm for the use of autonomous buses in urban spaces. In particular, the research focused on answering the following questions:
- What users’ profiles can be identified for the potential application of autonomous vehicles?
- How does the main AVs adaptation user profile differ in terms of sociodemographic characteristics?
- To what extent does overall trust in technology determine the social acceptance of autonomous buses?
- Which population groups are more likely to use AVs in the future?
The article is structured as follows. The next section presents a review of the relevant literature on urban mobility challenges, the potential role of autonomous buses, and factors influencing their acceptance. Furthermore, the research methodology is described, including details of the study sample, data collection procedures, and analytical techniques used. The subsequent section discusses the empirical results, highlighting the identified user profiles and the relationships between demographic factors, trust in technology, and acceptance of autonomous buses. Finally, the article concludes with a discussion of the practical implications, limitations of the study, and directions for future research.
2. Literature Review
Nowadays, 4.4 billion people live in cities, but this amount is expected to double by 2050 [11]. Reflecting this global trend, in Poland, 59.45% of the population resided in urban areas in 2023 [12]. Due to increased urbanization [13], more and more people move by road transport, which generates variety of problems in urban mobility [14,15]. Urban mobility is a form of mobility that relates to plan public transport [16,17]. It includes diversified modes of movement of people within cities [18], including public transport [19], walking [20], cycling [21], as well as the use of private and shared vehicles [22]. Currently, urban mobility faces a number of complex issues related to urbanisation, infrastructure, social behaviour and financial constraints [23].
The most significant problem in large cities is traffic congestion [24], which generates high economic costs—estimated at around €270 billion per year in the EU [25]. This issue not only affects economic efficiency by slowing down the flow of goods and services but also contributes to environmental degradation through increased carbon emissions [26]. According to the European Commission, road transport is responsible for approximately one fifth of emissions in the European Union and only passenger cars account for 60.6% of all CO2 emissions caused by road transport in Europe [27]. Moreover, according to World Health Organisation data, almost the entire world population (99%) breathes air that exceeds guideline limits for pollutants [28]. The high level of air pollution can cause acute and chronic diseases in humans [29]. The other significant problem is also the high level of noise in cities. According to the EEA report, road traffic is the main source of noise pollution in Europe [30]. Another research carried out by the Barcelona Institute for Global Health also indicates that 60 million people are exposed to noise due to road traffic [31]. In order to decrease the growing problems of air pollution, noise and traffic congestion, it is necessary to create appropriate transportation modes that are safe and sustainable [32].
Most large and medium-sized cities have public transportation systems, but they generally do not solve local traffic problems [33]. Current infrastructure and transport systems are overburdened and generate high maintenance and modernisation costs [34]. In many cities lack a network of cycle paths [35,36], pedestrian pathways [37] and adequate infrastructure for alternative forms of transport such as scooters and electric bikes [38,39]. This may cause people to choose a more convenient form of transportation, such as their own car, because they do not have the proper conditions to use other forms of transportation. Over by the decade 2012–2022 average number of passenger cars increased by 14.3% [40].
A lack of knowledge is also important social problem in urban mobility [41]. Many people, especially the elderly, are unaware of the benefits that can be derived from the use of innovative solutions [42], such as autonomous vehicles, which can be safer, more comfortable and efficient than traditional modes of transportation [43].
Autonomous vehicle technology is constantly evolving. Autonomous vehicles, which are means of transportation that can move without human intervention [44], are equipped with a range of advanced technologies, including sensors, cameras, on-board computers, GPS systems, receivers and radars [45]. According to CNBC, this technology can account for up to 50% of vehicles on the road by 2040 [46]. In urban space, autonomous vehicles can be used in various areas such as: trains [47,48,49]; buses [50,51,52] or shuttle buses [50,53]; mobility on demand like private vehicles [54], car-sharing [55,56], cabs [57,58,59] or flying cabs [45,60,61]; urban logistics and delivery by courier robots [62,63] and autonomous delivery vehicles [64,65]; and emergency and municipal services like patrol or monitoring vehicles [66]. Referring to public transportation, autonomous buses have already been used in several cities in Europe like Stavanger, Norway; Tampere, Finland; Göteborg, Sweden; and around the world like in Sentosa, Singapore, Seoul, South Korea; or Cambridgeshire, United Kingdom. The use of autonomous buses is becoming more popular both in Europe and around the world. Autonomous buses are increasingly seen as alternative to traditional means of public transport and as part of future transport solutions.
The implementation of autonomous vehicles can bring many benefits including mainly reducing human error and increasing road safety [67]. Autonomous vehicles do not speed and make risky manoeuvres. According to the European Commission, up to 95% of all traffic accidents are caused by human error [68]. Autonomous systems may react faster than humans, significantly reducing the risk of collisions and their consequences. Another advantage is the improvement of mobility because AVs enable independent travel for elderly, disabled people which improves their access to services and social activities [69,70]. In addition, autonomous vehicles may optimize energy consumption [71] and reduce emissions by driving smoother and avoiding unnecessary stops [72]. Furthermore, by communicating between vehicles and road infrastructure, AVs can better coordinate traffic [73] and reduce congestion [74], travel time [75] and trip costs [76].
The acceptance of autonomous vehicles (AVs) represents a complex socio-technological phenomenon requiring advanced theoretical modeling to predict adoption behavior. Scholars have increasingly adapted established acceptance frameworks—most notably Technology Acceptance Model (TAM) and the Unified Theory of Acceptance and Use of Technology (UTAUT)—to the unique context of automation, uncertainty, and trust in artificial intelligence systems. The synthesis presented below, highlights key theoretical modifications and model innovations found across the AV acceptance literature. Choi and Ji [77] expanded TAM by integrating trust theory, emphasizing the role of perceived system reliability, transparency, and competence. Their results demonstrated that trust and perceived risk significantly influence perceived usefulness and behavioral intention. Wang et al. [78] proposed an integrated TAM that includes trust and perceived risk as mediating variables, showing that user confidence in system safety and reliability critically shapes adoption intention in smart transportation contexts. Other scholars have moved beyond traditional models, developing frameworks tailored to the specific characteristics of autonomous vehicle (AV) technology. Seuwou et al. [79] introduced the Autonomous Vehicles Technology Acceptance Model (AVTAM), incorporating constructs such as self-efficacy, anxiety, legal regulation, and trust in manufacturers. Golbabaei et al. [80] conducted a systematic review and proposed a conceptual framework summarizing key predictors—demographics, psychological variables, mobility behavior, and prior experience—highlighting the multidimensional nature of AV acceptance.
A distinct line of research has focused on trust, perceived risk, and perceived control as central constructs. Nordhoff et al. [81] identified major acceptance dimensions—including usefulness, ease of use, and trust—through cross-national factor analysis. Brell et al. [82] demonstrated that experience with automation mitigates perceived risks related to data privacy, safety, and technical reliability. Hegner et al. [83] explored how trust and perceived control interact with personality traits and motivational factors, finding that perceived loss of control negatively affects adoption intention.
Comprehensive reviews have synthesized findings across theoretical traditions. Rahman and Thill [84] organized predictors of AV acceptance into internal (psychological, socioeconomic, and experiential) and external (contextual, infrastructural, and regulatory) categories, forming an Internal and External Factors Framework. Theoretical research on AV acceptance reveals a shift from adapting general technology acceptance theories to developing integrated and domain-specific models. Central across all frameworks are the constructs of trust, risk perception, and control, which mediate users’ perceptions of usefulness and safety. Future research should aim for longitudinal and cross-cultural validation of these models to improve predictive power and policy relevance in autonomous mobility adoption.
Although autonomous buses have many benefits, their effective implementation depends on the level of community acceptance and involvement. Research on autonomous vehicle acceptance reveals a complex interplay of factors influencing public attitudes. Key determinants of AV adoption include perceived usefulness, ease of use, safety, and trust [81,85], as well as system transparency, technical competence, and situation management [84]. Optimism and ease of use positively predict intention to use and overall acceptance [86]. Moreover, domain-specific attitudes and psychological factors play a more significant role [80,85]. Internal factors like psychological attributes and external factors like transportation and technology infrastructure influence people’s willingness to adopt AVs [84]. Contextual factors such as road conditions and national characteristics also determine AV acceptance [81,85].
Barriers to AV acceptance include privacy and data protection concerns [82], scepticism about computer-controlled vehicles, and the desire for manual control [81,85]. To promote AV acceptance, researchers suggest addressing challenges such as safety assurance and verification [87] and providing direct experiences with AVs through targeted education [80,86].
Trust in technology plays a crucial role in determining the acceptance of smart and sustainable mobility technologies in cities. Multiple studies have found that trust significantly influences citizens’ intention to use smart city services [88,89,90]. Factors such as perceived security, privacy, and usefulness contribute to building trust [89]. Perceived trust is a significant determinant of acceptance for IoT-based and sustainability-oriented smart city services [91]. Acceptance of using mobile phone data for smart city technologies is higher among individuals with stronger technological trust [92]. As far as autonomous vehicles are concerned, trust plays a critical role in their acceptance. Previous studies have shown that trust in technology is a major determinant of intention to use AVs [77,83,93]. Trust consistently emerges as a critical factor influencing public acceptance, alongside concerns such as safety and performance [79], sustainability [94], perceived benefits [95], and perceived loss of control [83]. Key elements shaping trust include system transparency, technical competence, and effective situation management [77], while institution-based trust—particularly perceptions of technical safeguards and situational normality—also plays a significant role [93].
Previous research has explored user profiles and their relation to AV acceptance. Sociodemographic characteristics, while relevant, have relatively small correlations with AV acceptance [81]. However, other studies identify demographic factors—such as age, gender, and education level—as key predictors [96]. Golbabaei et al. confirmed that demographic characteristics play a significant role in the development of models explaining AV adoption [80]. According to Thomas et al. [96], respondents with higher education are less concerned about liability and system failure, while middle-aged individuals tend to be more sceptical of AVs than younger or older users. Personalized driving styles based on user preferences may enhance comfort and adoption [97].
Latent profile analyses have identified personality-based segments, showing that lower anxiety, higher self-confidence, and technology affinity correlate with greater openness to AVs [98]. Rahimi et al. [99] identified distinct user classes—auto-dependent, all-mode, and non-drivers—demonstrating that pro-technology attitudes positively influence adoption and willingness to pay, whereas privacy concerns and perceived loss of driving enjoyment act as barriers. User profiles across ages also differ: engineering students are most willing to adopt AVs, while seniors show greater hesitation and desire for manual control options [100]. Efficient management of distributed user profiles in connected cars can support personalization and safety applications through adaptive real-time modeling [101]. Although autonomous buses have many benefits, their effective implementation depends on the level of community acceptance and involvement.
Previous research has explored user profiles and the acceptance of autonomous vehicles. Research on autonomous vehicle acceptance reveals a complex interplay of factors influencing public attitudes. Key determinants of AVs adoption include perceived usefulness, ease of use, safety, and trust in AVs [77,78], as well as perceived usefulness, system transparency, technical competence, and situation management [79]. Optimism and ease of use positively predict intention to use and overall acceptance [80]. Moreover, domain-specific attitudes and psychological factors play a more significant role [78,81]. Moreover, internal factors like psychological attributes and external factors like transportation and technology influence people’s willingness to adopt autonomous vehicles [79]. Similarly, contextual factors such as road conditions and national characteristics also determine AVs acceptance [77,78]. Barriers to AVs acceptance include privacy and data protection [82], scepticism about computer-controlled vehicles and the desire for manual control [77,78]. To promote AV acceptance, researchers suggest addressing challenges like safety, assurance, and verification [83], providing direct experiences with AVs and targeted education [80,81].
Overall, promoting AV adoption involves addressing diverse user needs, offering control options, and leveraging technology affinity to create personalized, user-friendly experiences. The current research primarily focuses on certain geographic and demographic populations. Despite the rapidly expanding body of literature on autonomous vehicle (AV) acceptance, most existing studies have concentrated on technologically advanced regions (e.g., Western Europe, North America, or East Asia) and have predominantly examined generalized user attitudes rather than localized behavioral patterns. This has left a geographical and cultural gap in understanding AV acceptance in Central and Eastern Europe—particularly in Poland, where autonomous mobility initiatives are still emerging. A broader exploration of how cultural differences influence attitudes toward AVs—such as perceptions of safety, trust in technology, and privacy concerns—could provide valuable insights into global adoption strategies. Research has shown that psychological factors like trust, anxiety, self-confidence, as well as sociodemographic features play a significant role in AV acceptance. However, there is limited exploration into how these factors can be specifically integrated into AV systems to create a personalized experience. Moreover, there is scarce research on AV user profiles in Poland and the correlations between their acceptance of AVs and trust in technology. Further investigation into the potential for dynamic, user-specific interface adjustments could contribute to improve comfort and trust in AV technology. This study aims to fill this research gaps. The present study contributes novelty by providing one of the first empirically grounded analyses of public attitudes toward autonomous buses in Warsaw, capturing how trust in technology, demographic characteristics, and psychological factors interact to shape acceptance levels. While prior research has emphasized these factors individually, limited attention has been given to their integration into distinct user profiles reflecting different combinations of enthusiasm, scepticism, and cautious optimism.
3. Research Method
3.1. Case Study Description
The city of Warsaw is the capital of Poland and the largest city in the country with a population of over 1.8 million, area of 517 km2 and a population density of 3599.4 inhabitants per km2 [102]. The city of Warsaw has many urban mobility solutions and offers a diverse and constantly evolving transport infrastructure that includes both traditional modes of transport and modern, environmentally friendly alternatives. Warsaw has a well-developed public transport network consisting of buses, trams, underground and SKM (Rapid Urban Rail) trains. The two metro sections currently in operation (M1 and M2) significantly speed up travel between key points in the city. The city is also investing in environmentally friendly solutions such as electric buses, electric vehicle charging stations and the Veturilo system—the urban bicycle rental network. Electric scooters and scooters can also be rented by the minute, allowing quick and flexible travel over short distances.
In the capital city of Warsaw, despite the dynamic development of infrastructure and measures for sustainable transport, there are still a number of significant mobility problems. One of the most serious challenges is the high level of annual average daily traffic on national and provincial roads—21% higher than the national average—which leads to infrastructure overload and an increase in the risk of accidents. Figure 1 shows network with indicating street traffic intensity in Warsaw. Traffic analysis indicates heavy congestion on many sections of the network, which limits the flow of traffic. Autonomous buses can improve the situation by optimizing routes in real time, reduces congestion and increases the punctuality of public transport.
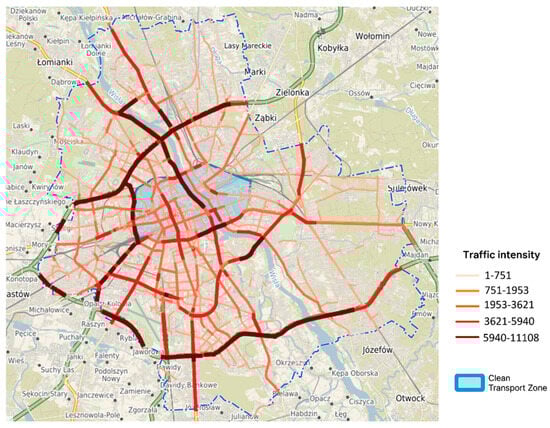
Figure 1.
Road network map of the City of Warsaw with street traffic intensity [103].
Although the overall rate of fatalities per 100,000 inhabitants is lower than in the rest of the Mazowieckie Voivodeship and the country, alarmingly high values persist in some local government units, particularly in the eastern municipalities of the metropolis. An underdeveloped and coherent network of bicycle paths and pedestrian and bicycle routes, as well as the low standard of maintenance of the already existing infrastructure, is also a significant problem, which causes a decrease in comfort and discourages the use of alternative forms of transport [103].
Another challenge is the low awareness among residents of the principles and benefits of sustainable mobility, which combined with the lack of efficient and accessible alternatives to individual transport in many municipalities in the metropolis, results in residents’ strong attachment to the car as the main mode of transportation. At the same time, there is a noticeable lack of a coherent metropolitan system of road safety education, especially targeted at the most vulnerable road users—pedestrians, cyclists and the elderly. There is also a problem with cooperation of local administration with the private sector in the development of mobility policy, which limits the potential of innovative solutions and partnerships for modern transport [103]. All these factors indicate the need to intensify actions towards improving safety, increasing accessibility of public transport and promoting active and sustainable forms of mobility.
3.2. Research Data and Sample
The research was carried out between November and December 2024 on a total sample of 385 residents of Warsaw. The sample size of 385 respondents results from the following statistical assumptions: the population of Warsaw is 1,650,000 residents, the confidence level is 95%, and the maximum margin of error is assumed. Based on these parameters, the calculated minimum sample size is 68 individuals.
The study employed a random sampling method, with the sample structure designed to reflect the key characteristics of the general population of Warsaw residents. The selection of respondents was based on random procedures, while major demographic variables—such as gender, age, and level of education—were controlled to ensure that their proportions corresponded to those observed in the city’s population. This approach enabled the creation of a sample with a high degree of representativeness, allowing for a reliable generalization of the findings to the broader population. Consequently, the obtained results can be considered robust and reflective of the actual opinions and attitudes of Warsaw residents, consistent with the city’s demographic structure.
Women accounted for 53.8% of the sample (207 participants), while men represented 46.2% (178 participants). The gender structure of respondents accurately reflects the demographic structure of Warsaw’s population, in which women account for 53.8%.
In terms of age distribution, the largest segment comprised individuals aged 29–44 years (35.1%, 135 respondents), followed by those aged 60 and above (29.4%, 113 respondents) and individuals aged 45–59 years (22.1%, 85 respondents). The structure of respondents by age is presented in Figure 2. The age structure of respondents corresponds to that of the general population, in which the 24–44 age group accounts for 34.0%, for example, and the 45–59 age group accounts for 20.0%.
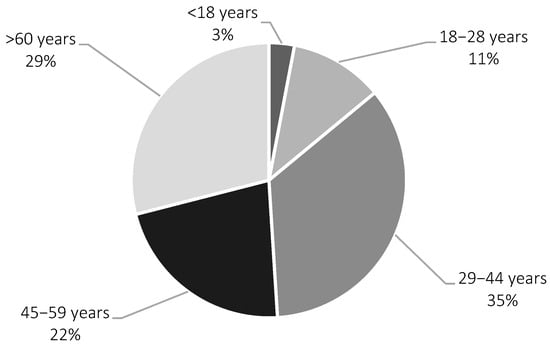
Figure 2.
Structure of respondents by age.
The age structure of respondents presented on Figure 2 corresponds to that of the general population, in which the 24–44 age group accounts for 34.0%, for example, and the 45–59 age group accounts for 20.0%.
Considering education level, the most represented group consisted of individuals with higher education degrees (47.8%, 184 respondents), followed by those with secondary education (31.7%, 122 respondents). Respondents with vocational education formed a smaller proportion of the sample (15.1%, 58 respondents), while participants with primary education accounted for 5.5% (21 respondents).
Data collection was conducted using a mixed-method approach, primarily employing CAPI (Computer-Assisted Personal Interviewing), supplemented by CATI (Computer-Assisted Telephone Interviewing) and CAWI (Computer-Assisted Web Interviewing) techniques.
The use of a mixed-method approach combining CAPI (Computer-Assisted Personal Interviewing), CATI (Computer-Assisted Telephone Interviewing), and CAWI (Computer-Assisted Web Interviewing) was intended to enhance the reliability and comprehensiveness of the data collected. CAPI ensured high data quality through direct interaction with respondents, allowing for clarification of questions and minimizing nonresponse errors. CATI complemented this method by reaching individuals less available for face-to-face interviews, thereby improving coverage and representativeness. Meanwhile, CAWI provided additional flexibility and cost efficiency, enabling participation among respondents more comfortable with online communication. The integration of these techniques allowed for the inclusion of diverse respondent groups and reduced potential sampling bias. The survey was conducted by an experienced external research institution, which ensured methodological rigor, standardized procedures, and adherence to ethical research standards.
3.3. Measurement
Based on a review of the existing literature, nine statements (S1–S9) were developed to assess the level of social enthusiasm for autonomous bus. Participants evaluated each statement using a five-point Likert scale, where 1 indicated “strongly disagree” and 5 indicated “strongly agree”. An additional variable incorporated into the construction of user profiles was general trust in technology. Trust was measured using three items, each assessed on the same five-point Likert scale. The sources of all measurement statements are presented in Table 1.

Table 1.
Measurement statements.
The internal consistency of the nine-item scale measuring the acceptance of autonomous buses (S1–S9) was assessed using Cronbach’s alpha, which reached a satisfactory value of α = 0.80, indicating strong internal reliability, while the three-item trust in technology scale (T1–T3) also demonstrated satisfactory consistency, with a Cronbach’s alpha of α = 0.76, confirming acceptable internal reliability.
4. Research Results
To identify profiles of potential users of autonomous buses, a cluster analysis was performed using IBM SPSS Statistics 31 software. The k-means clustering method was applied, in which the number of clusters is predetermined, and the algorithm assigns individual observations to groups in order to minimize within-cluster variability and maximize between-cluster differences. The optimal number of clusters was determined using the elbow method, which identified a clear inflection point at k = 3, indicating that further increasing the number of clusters did not significantly improve model fit. To verify whether the identified clusters differ significantly in terms of the analyzed variables, an analysis of variance (ANOVA) was performed. The results confirmed statistically significant differences among the clusters, indicating the validity of the segmentation
The clustering procedure, based on the average ratings of nine evaluative statements, led to the identification of three clearly differentiated user segments. Each segment represents a distinct users profile characterized by varying levels of enthusiasm for autonomous bus (Table 2). According to the assumptions of cluster analysis, the condition for identifying clusters is the significance of individual variables for the structure of clusters, which was confirmed by the p-value. Additional pairwise comparison tests post hoc of differences between clusters at the level of individual statements showed statistically significant differences for all analyzed variables S1–S9 and for all cluster combinations (1–2, 1–3, 2–3).
Table 2.
Mean scores for statements related to autonomous buses across clusters.
The mean scores for variables S1–S8 are the highest within Cluster 1, consistently exceeding 4.0. The variable S9, referring to the perceived road hazards associated with the use of autonomous buses, received the lowest evaluation (mean = 2.38) among respondents in Cluster 1. An opposite pattern is observed within Cluster 2, where the evaluations of variables S1–S8 are the lowest, while the assessment of road hazard perception (S9) is the highest. Cluster 3 reflects an intermediate attitude among respondents. The analysis of the mean ratings of individual statements within three identified clusters enabled to define three distinct user profiles:
Cluster 1: Enthusiastic Adopters (The Future-First).
Cluster 2: Sceptical Opponents (Technology Sceptics).
Cluster 3: Cautious Optimists (Open-Minded Sceptics).
Subsequently, the demographic characteristics of potential users within each identified cluster were analysed. The distribution results of demographic characteristics (gender, age, education level, and occupational status) within the clusters are presented in Table 3, Table 4, Table 5 and Table 6.
Table 3.
Age distribution of respondents across clusters.
Table 4.
Gender distribution of respondents across clusters.
Table 5.
Educational level distribution of respondents across clusters.
Table 6.
Employment status distribution of respondents across clusters.
The predominance of respondents with higher education across all three clusters may be explained by the fact that individuals with higher educational attainment are generally more exposed to technological innovations and digital services in their daily and professional lives. As confirmed by numerous studies, higher education is positively associated with greater technological literacy, openness to innovation, and the ability to critically evaluate the risks and benefits of emerging technologies. Even in the case of the Sceptical Opponents group, scepticism does not necessarily arise from a lack of knowledge, but rather from greater awareness of potential risks, ethical dilemmas, or systemic implications, which is also more common among highly educated individuals. Therefore, the overrepresentation of people with higher education in all clusters does not signify homogeneity in attitudes, but rather reflects different cognitive interpretations of autonomous mobility, from enthusiasm, through cautious optimism, to informed scepticism.
Cluster 1, Enthusiastic Adopters (The Future-First) predominantly consists of women aged 29–44 and 18–28 years, with higher education and active employment status. Cluster 2, Sceptical Opponents (Technology Sceptics) includes mainly men aged over 60 and 45–59 years, with higher or secondary education levels, and predominantly employed or retired individuals. Cluster 3, Cautious Optimists (Open-Minded Sceptics) mainly consists of women aged over 29 years, with higher or secondary education levels and active employment status. A summary of the demographic characteristics of representatives of the three clusters is presented in Table 7.
Table 7.
Demographic characteristics across clusters.
The predominance of women in Cluster 1 (Enthusiastic Adopters) may be explained by the fact that women, more frequently than men, rely on public transport for their daily mobility needs, which is confirmed by numerous European mobility studies. As regular users of bus-based systems, women may therefore perceive the potential benefits of autonomous buses more directly, particularly in terms of improved punctuality, safety, and reliability, which are highly valued in everyday mobility.
Regarding Cluster 2 (Sceptical Opponents), the predominance of men aged over 60 years may be attributed to a stronger attachment to conventional mobility solutions. This group is more likely to perceive autonomous transport as risky, unfamiliar, and potentially disempowering. Interestingly, individuals aged 29–44 years with secondary education are also present in this cluster. This may be explained by economic self-protection concerns, as workers with secondary education are often employed in sectors directly exposed to automation (e.g., drivers, operators, logistics). Their scepticism may therefore be driven less by technological conservatism and more by perceived threats to job security and professional stability.
Cluster 3 (Cautious Optimists) is predominantly composed of women aged 29–44 and over 60 years, most of whom hold secondary or higher education and are actively employed. This structure reflects a segment of users who are neither early adopters nor resistant, but instead open to innovation under the condition of proven reliability and safety. Their educational background suggests sufficient technological awareness to understand the potential benefits, while their age and life experience contribute to a more pragmatic and risk-aware mindset. Rather than rejecting autonomous buses, they wait for concrete evidence and reassurance, signalling conditional acceptance rather than scepticism or enthusiasm.
An additional variable included in the analysis was overall trust in technology, measured by three items (T1–T3). Initially, two clusters reflecting respondents’ levels of trust in technology were identified: Cluster 1. Tech-Optimists and Cluster 2. Tech-Sceptics (Table 8).
Table 8.
Result of cluster analysis of trust in technology.
To analyse statistically the relationship between trust in technology and cluster membership related to the acceptance of autonomous buses, the non-parametric Kruskal–Wallis test was applied. The results confirmed the existence of statistically significant differences (p < 0.001) in the level of trust in technology across the three user profiles of autonomous bus users. An additional analysis and Duna post hoc test enabling pairwise comparisons confirmed that there are statistically significant differences in trust in technology between Clusters 1 and 2 (p < 0.001) and 3-2 (p < 0.001), and that there is no statistically significant difference between clusters 1–3 (p = 0.063). Cluster 1. Enthusiastic Adopters and Cluster 3. Cautious Optimists were more likely to include individuals identified as Tech-Optimists (Cluster 1), whereas Cluster 2: Sceptical Opponents was more frequently composed of individuals categorized as Tech-Sceptics (Cluster 2).
A cross-tabulation table was constructed to explore the relationship between trust in technology and acceptance of autonomous buses (Table 9).
Table 9.
Relationship between trust in technology and acceptance of autonomous buses.
The relationship between the levels of AV acceptance and trust in technology is presented graphically in Figure 3. The figure shows that respondents belonging to Cluster 1 (Enthusiastic Adopters) are characterized by the highest level of trust in technology. In contrast, respondents in Cluster 2 (Sceptical Opponents) exhibit the lowest level of trust. The third cluster, Cautious Optimists, includes respondents with a moderate level of trust in technology. Overall trust in technology clearly influences the level of acceptance of technologies such as autonomous vehicles (AVs) (Figure 3).
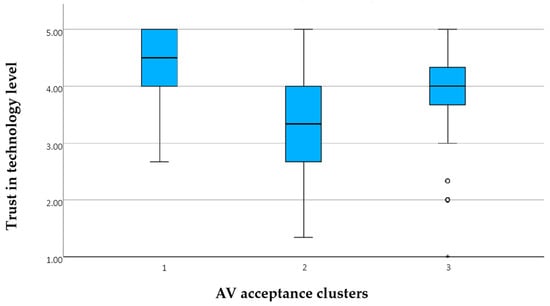
Figure 3.
Distribution of trust in technology across user profiles.
5. Discussion
The conducted study confirmed that the defined profiles of potential autonomous bus users are determined by users’ demographic characteristics and their overall trust in technology. Individuals classified as Enthusiastic Adopters of Autonomous Vehicles (Cluster 1) are more often women, aged 29–44 and 18–28 years, with higher education and active employment status. Moreover, these individuals are characterized by a high level of general trust in technology. The obtained results, indicating that in the studied city women are more likely to express enthusiastic attitudes toward autonomous vehicles (AVs), do not correspond with the findings of other researchers. The results of research based on a systematic literature review conducted by Greifenstein based on 77 publications, indicate that it was reported that significantly more men than women would be willing to use shared autonomous vehicles (SAVs) in 25.8% of the analysed studies [111]. Moreover, studies conducted by Charness et al. confirmed that men are more likely than women to be enthusiasts of autonomous vehicles [112]. Similar findings were reported by Xiao and Goulias, who confirmed that young, well-educated men tend to perceive the usefulness of autonomous vehicles more positively [113]. Also, studies conducted by Weighl et al. reported that women tend to have lower acceptance and enthusiasm for AVs compared to men [114]. On the other hand, studies conducted in the city of Malaga confirmed a higher level of satisfaction among women with the use of autonomous buses [3]. Additionally, studies conducted on over 2000 respondents from Germany confirmed that women rated their intentions to use autonomous buses higher than men [115]. In seeking explanations for the differing results observed among Warsaw residents, it can be inferred that women, who are more frequent users of public transportation (particularly buses), tend to be greater enthusiasts of public transport development in general. In 2024, public transport in the Warsaw metropolitan area was used by over 956 million passengers, including 447,075,312 individuals who travelled by bus [116]. They would probably accept autonomous vehicles, as the advancement of such technologies could contribute to improved punctuality of bus services and enhanced passenger safety. The results confirm the need for further research to identify the reasons for women’s enthusiasm for using autonomous buses.
The age of potential users of autonomous vehicles has also been studied by many authors. The findings reported by various researchers indicate that younger individuals (aged 18–28 and 29–44 years) were more likely to be enthusiasts of autonomous vehicle solutions. Similar results were obtained by other scholars [2,112,114]. Based on a literature review of 77 scientific articles, Greifenstein found that in every third article, the authors indicated that the tendency to accept autonomous bus solutions decreases with age [111]. According to Li et al. (2024) research, younger users show greater enthusiasm for using autonomous demand responsive transit buses [19]. This may be attributed to their preference for more flexible services and a lower level of concern regarding safety issues [19].
The obtained results also indicate that individuals with higher education levels are more frequently enthusiasts of autonomous buses. Regarding the factor of educational level, Greifenstein (2024) found that individuals with higher education demonstrated a greater intention to use SAVs, as shown in 30.8% of all analysed studies [111]. However, this finding is not always supported by the results of other researchers. Studies conducted by Jaszberenyi et al. (2024) did not confirm a statistically significant relationship between the level of education and the intention to use autonomous vehicles [2]. On the other hand, many studies confirmed that there are statistically significant differences between the level of education and the social acceptance of autonomous public transport, indicating that a higher level of education is associated with greater enthusiasm for and acceptance of autonomous vehicles [19]. The authors indicate that individuals with higher education levels are more confident and more convinced about the safety of AV solutions, and therefore, express a higher level of enthusiasm.
Employment status appears to have a slightly positive and significant influence on the intention to use SAVs, as indicated in 25.8% of the Greifenstein’s studies [111]. The obtained results, indicating that employed individuals are more often enthusiasts of autonomous vehicles compared to those who are unemployed or retired, are also supported by the findings of other authors. However, the majority of studies reported no significant effect [117], while a significant negative relationship was also identified rarely [118]. Overall, there is a slight tendency for employed individuals to exhibit a higher likelihood of adopting SAVs compared to those who are unemployed or retired [111].
The theoretical findings of this study provide actionable guidance for public transport authorities, policymakers, and technology providers. By identifying distinct user profiles based on enthusiasm and trust toward autonomous buses, the research enables the design of segment-specific implementation and communication strategies rather than a one-size-fits-all approach. The clear link between trust in technology and acceptance of autonomous mobility solutions highlights the need to prioritise trust-building interventions, such as awareness campaigns and real-life demonstrations. Moreover, the study supports more evidence-based decision-making on where and with whom pilot projects should be initiated, helping to optimise resource allocation and increase the chances of successful adoption
6. Conclusions
The dynamic development of autonomous solutions in urban spaces creates a constant need for research, on the one hand to understand the needs of users, and on the other to build public awareness of the possibilities offered by modern technologies. Only a convinced and informed user will consistently adopt these solutions and encourage others to do the same.
This research is among the first to explore public attitudes toward autonomous buses in Poland, offering an empirically based typology of users that integrates demographic, psychological, and trust-related factors. By localizing AV acceptance analysis within Warsaw’s sociocultural context, the study adds a new regional perspective to the global discourse on autonomous mobility adoption. Moreover, this study extends existing models of autonomous vehicle (AV) acceptance by situating the analysis within Warsaw’s sociocultural context, thereby providing insights into how cultural perceptions of safety, control, and technological trust manifest in a post-transition economy. It identifies empirically derived user clusters—Enthusiastic Adopters, Sceptical Opponents, and Cautious Optimists—which reflects heterogeneity in AV acceptance, moving beyond the conventional treatment of the public as a homogeneous group. Additionally, the study links general trust in technology to AV-specific acceptance, bridging psychological constructs with applied urban mobility research. By doing so, it offers a foundation for developing user-centered design and targeted communication strategies for autonomous public transport in Poland. In addressing the lack of contextualized, culturally grounded, and user-specific investigations, this research contributes to the broader discourse on how dynamic, personalized interface designs and localized outreach strategies can enhance user comfort, trust, and adoption in the context of smart urban mobility.
The results obtained from the study conducted in Warsaw, the capital of Poland, confirmed that demographic characteristics significantly influence the level of enthusiasm among potential users of autonomous buses. It is not surprising that the findings proved that younger and more highly educated individuals are more enthusiastic about the implementation of autonomous buses in Warsaw. Therefore, it would be reasonable to prioritize the introduction of these solutions in districts with a high concentration of such demographic groups, for example, university campuses.
Confirming that a higher level of overall trust in technology positively affects the perception of autonomous vehicles in city, it further underscores the necessity for continuous education and the promotion of modern technological solutions, broadly related to socio-economic development. Regular exposure to new technologies, both at home and at work, enhances technological literacy and thus reduces apprehension toward their use. Such initiatives should be undertaken from an early age, through both formal education and informal activities, such as community-wide urban campaigns.
The results of the study may be utilized to develop strategies targeted at specific stakeholder groups to promote modern solutions based on autonomous buses within urban environments. Moreover, the conducted research represents the first study focused specifically on the residents of Warsaw, and undoubtedly, it also fulfilled the important function of building public awareness regarding autonomous transport solutions.
Practical implications and recommendations for public transport authorities includes:
- Pilot deployments should be prioritized in districts with a high concentration of enthusiastic adopters (e.g., university campuses, cemeteries, business districts), where acceptance and willingness to test autonomous buses are already strong; examples of areas for consideration include The Warsaw University of Life Sciences, Powąski Cemetery in Warsaw or North Municipal Cemetery. For example, the campus of The Warsaw University of Life Sciences covers an area of 70 hectares, and the distance between its furthest points is 1300 m. The Powąski Cemetery covers an area of 43 hectares, and the distance between its furthest points is 2 km. North Municipal Cemetery covers area 143 hectares.
- Communication and educational strategies should be tailored specifically to sceptical opponents.
- Cautious optimists require transparent, evidence-based messaging; it is recommended to present real pilot data (e.g., number of incident-free kilometers, punctuality rates, congestion reduction) to strengthen trust through facts rather than promises.
- In parallel with pilot projects, public transport authorities should invest in trust-building initiatives, such as interactive demonstrations, supervised test rides, or temporary human operator presence, helping to mitigate concerns related to loss of control and unfamiliarity with the technology.
Further investigation into users’ preferred areas, routes, and segments for deploying autonomous buses—such as first- or last-mile connections between residences and metro stations, or longer journeys like travel from home to an airport—would undoubtedly contribute to expanding the current knowledge base.
Future research should expand to other cities, explore the dynamics of trust and acceptance, and investigate behavioral differences between experienced and non-experienced users of autonomous solutions. This study is limited to residents of Warsaw, which may restrict the generalizability of the findings to other urban contexts with different socio-cultural and infrastructural conditions. Moreover, the research captures attitudes at a single point in time and does not account for potential changes in user perceptions as exposure to autonomous technologies evolves.
Author Contributions
Conceptualization J.E.; literature review, A.G. and K.B.; methodology, J.E., formal analysis, J.E. writing, J.E., A.G., K.B. and J.E.; conclusions and discussion, J.E., A.G. and K.B. All authors have read and agreed to the published version of the manuscript.
Funding
This research was funded in part by the National Science Centre [2022/45/B/HS4/01414]. This publication was funded by the project No. W/WIZ-INZ/3/2025 at Bialystok University of Technology and funded by the research subsidy provided by the Minister of Science and Higher Education.
Institutional Review Board Statement
Ethical review and approval were waived for this study by Institution Committee due to Legal Regulations. The research was conducted in accordance with the law. Authors complied with the principles of the Code of Ethics for Research Workers—Annex to Resolution No. 2/2020 of the General Assembly of the Polish Academy of Sciences of 25 June 2020.
Informed Consent Statement
Informed consent for participation was obtained from all subjects involved in the study.
Data Availability Statement
The original contributions presented in this study are included in the article. Further inquiries can be directed to the corresponding author.
Conflicts of Interest
The authors declare no conflicts of interest.
Correction Statement
This article has been republished with a minor correction to the Funding statement. This change does not affect the scientific content of the article.
Abbreviations
The following abbreviations are used in this manuscript:
| AV | Autonomous vehicle |
| AVTAM | Autonomous Vehicles Technology Acceptance Model |
| CAWI | Computer-Assisted Web Interviewing |
| CAPI | Computer-Assisted Personal Interviewing |
| CATI | Computer-Assisted Telephone Interviewing |
| CNBC | Consumer News and Business Channel |
| CO2 | Carbon Dioxide |
| EEA | European Environment Agency |
| IoT | Internet of Things |
| SAVs | Shared Autonomous Vehicles |
| TAM | Technology Acceptance Model |
| UTAUT | Unified Theory of Acceptance and Use of Technology |
| V2I | Vehicle-to-Infrastructure Communication |
References
- Hieber, N.; Fischer-Pressler, D.; Pröbster, M.; Kutz, J.; Marsden, N. Beyond Acceptance Models: The Role of Social Perceptions in Autonomous Public Transportation Acceptance. In HCI in Mobility, Transport, and Automotive Systems; Krömker, H., Ed.; Springer Nature Switzerland: Cham, Switzerland, 2024; pp. 26–39. [Google Scholar]
- Jaszberenyi, M.; Asvanyi, K.; Csiszar, C.; Kokeny, L. Demographic and social differences in autonomous vehicle technology acceptance in Hungary. J. Eng. Technol. Manag. 2024, 72, 101813. [Google Scholar] [CrossRef]
- Ariza-Álvarez, A.M.; Eugenia, L.L.; Soria-Lara, J.A. Analysing the acceptance of autonomous buses in real-life traffic environments: Pilot project with tourists in Malaga, Spain. Transp. Plan. Technol. 2023, 46, 71–92. [Google Scholar] [CrossRef]
- Li, Z.; Tang, J.; Feng, T.; Liu, B.; Cao, J.; Yu, T.; Ji, Y. Investigating urban mobility through multi-source public transportation data: A multiplex network perspective. Appl. Geogr. 2024, 169, 103337. [Google Scholar] [CrossRef]
- Quinones, M.; Romero, J.; Schmitz, A.; Díaz-Martín, A.M. What factors determine the intention to use and recommend public autonomous shuttles in a real-life setting? Eur. J. Manag. Bus. Econ. 2024; ahead-of-print. [Google Scholar]
- Huang, G.; Hung, Y.H.; Proctor, R.W.; Pitts, B.J. Age is more than just a number: The relationship among age, non-chronological age factors, self-perceived driving abilities, and autonomous vehicle acceptance. Accid. Anal. Prev. 2022, 178, 106850. [Google Scholar] [CrossRef]
- Wang, S.; Li, Z.; Wang, Y.; Aaron Wyatt, D. How do age and gender influence the acceptance of automated vehicles?—Revealing the hidden mediating effects from the built environment and personal factors. Transp. Res. Part A Policy Pract. 2022, 165, 376–394. [Google Scholar] [CrossRef]
- Bęczkowska, S.; Czerepicki, A.; Grabarek, I.; Kozłowski, M.; Zysk, Z. Autonomous Vehicles as Viewed by Future Users in Poland. Sustainability 2023, 15, 16627. [Google Scholar] [CrossRef]
- Dudziak, A.; Stoma, M.; Kuranc, A.; Caban, J. Assessment of Social Acceptance for Autonomous Vehicles in Southeastern Poland. Energies 2021, 14, 5778. [Google Scholar] [CrossRef]
- Stoma, M.; Dudziak, A.; Caban, J.; Droździel, P. The Future of Autonomous Vehicles in the Opinion of Automotive Market Users. Energies 2021, 14, 6477. [Google Scholar] [CrossRef]
- WorldBank. Urban Development. Available online: https://www.worldbank.org/en/topic/urbandevelopment/overview (accessed on 29 September 2025).
- Central Statistical Office. Available online: https://bdl.stat.gov.pl/bdl/start (accessed on 29 September 2025).
- Szpilko, D.; Budna, K.; Drmeyan, H.; Remiszewska, A. Sustainable and smart mobility—Research directions. A systematic literature review. Econ. Environ. 2023, 86, 31–61. [Google Scholar] [CrossRef]
- Tomaszewska, E.J.; Florea, A. Urban smart mobility in the scientific literature—Bibliometric analysis. Eng. Manag. Prod. Serv. 2018, 10, 41–56. [Google Scholar] [CrossRef]
- Winkowska, J.; Szpilko, D.; Pejić, S. Smart city concept in the light of the literature review. Eng. Manag. Prod. Serv. 2019, 11, 70–86. [Google Scholar] [CrossRef]
- Semanjski, I.C. Introduction to smart mobility. In Smart Urban Mobility; Elsevier: Amsterdam, The Netherlands, 2023; pp. 9–23. [Google Scholar]
- Szpilko, D.; Naharro, F.J.; Lăzăroiu, G.; Nica, E.; de la Torre Gallegos, A. Artificial intelligence in the smart city—A literature review. Eng. Manag. Prod. Serv. 2023, 15, 53–75. [Google Scholar] [CrossRef]
- Gulc, A.; Budna, K. Classification of Smart and Sustainable Urban Mobility. Energies 2024, 17, 2148. [Google Scholar] [CrossRef]
- Li, H.; Jin, Z.; Cui, H.; Tu, H. An exploration of the preferences and mode choice behavior between autonomous demand-responsive transit and traditional buses. Int. J. Transp. Sci. Technol. 2024, 15, 81–101. [Google Scholar] [CrossRef]
- Distefano, N.; Leonardi, S. Fostering Urban Walking: Strategies Focused on Pedestrian Satisfaction. Sustainability 2023, 15, 16649. [Google Scholar] [CrossRef]
- Monteagudo, M.J.; Villatoro, F.; San Salvador del Valle, R.; Aranbarri, N. Use and Promotion of Bicycles for Sustainable Urban Mobility: The Case of Bizkaia. Sustainability 2025, 17, 1147. [Google Scholar] [CrossRef]
- Aguilera-García, Á.; Gomez, J.; Rangel, T.; Baeza, M.d.L.Á.; Vassallo, J.M. Which factors influence the use of shared and privately-owned e-scooters in the city of Madrid? Implications for urban mobility. Cities 2024, 147, 104785. [Google Scholar] [CrossRef]
- Gulc, A.; Budna, K. Czynniki determinujące wdrożenie rozwiązań z zakresu zrównoważonej i inteligentnej mobilności miejskiej. Przegląd Organ. 2023, 3, 24–36. [Google Scholar] [CrossRef]
- Munkácsy, A.; Földes, D.; Miskolczi, M.; Jászberényi, M. Urban mobility in the future: Text analysis of mobility plans. Eur. Transp. Res. Rev. 2024, 16, 29. [Google Scholar] [CrossRef]
- European Court of Auditors. Sustainable urban mobility in the EU—Without commitment from Member States, no significant improvement will be possible. 2020. Available online: https://op.europa.eu/webpub/eca/special-reports/urban-mobility-6-2020/pl/ (accessed on 28 September 2025).
- Hanusik, A. Charakterystyka kongestii transportowej w Katowicach. Inst. Rozw. Miast I Reg. 2017, 3, 11–16. [Google Scholar]
- European Parliament. Emisje CO2 z Samochodów: Fakty i Liczby. 2019. Available online: https://www.europarl.europa.eu/topics/pl/article/20190313STO31218/emisje-co2-z-samochodow-fakty-i-liczby-infografiki (accessed on 15 September 2025).
- World Health Organization. Air Pollution. 2025. Available online: https://www.who.int/health-topics/air-pollution#tab=tab_1 (accessed on 23 April 2025).
- Petropoulou, P.; Artopoulou, I.; Kalemikerakis, I.; Govina, O. Environment and Public Health: Air Pollution and Chronic Diseases. Environ. Sci. Proc. 2023, 26, 118. [Google Scholar]
- European Environment Agency. Noise. 2024. Available online: https://www.eea.europa.eu/en/topics/in-depth/noise (accessed on 15 April 2025).
- ISGlobal Ranking of Cities. Rankings. 2025. Available online: https://isglobalranking.org/ranking/#noise (accessed on 23 April 2025).
- Gulc, A. Mapping Smart and Sustainable Mobility Innovations in Modern Cities. In Proceedings of the Future Technologies Conference (FTC) 2024, Volume 2; Lecture Notes in Networks and Systems 1155; Springer: Cham, Switzerland, 2024; pp. 372–379. [Google Scholar]
- Gadziński, J.; Goras, E. Transport i Mobilność Miejska; Instytut Rozwoju Miast i Regionów: Warsaw, Poland, 2019. [Google Scholar]
- Yannis, G.; Chaziris, A. Transport System and Infrastructure. Transp. Res. Procedia 2022, 60, 6–11. [Google Scholar] [CrossRef]
- Ospina, J.P.; Duque, J.C.; Botero-Fernández, V.; Montoya, A. The maximal covering bicycle network design problem. Transp. Res. Part A Policy Pract. 2022, 159, 222–236. [Google Scholar] [CrossRef]
- Smith, M.L.; Fu, X. When bike lanes are not enough: The role of connected low-stress cycling infrastructure on cycle commuting in urban Aotearoa New Zealand. Cities 2025, 156, 105526. [Google Scholar] [CrossRef]
- Nieto-Combariza, M.J.; Galeano-Duque, V.; Mensah, S.L.; Frimpong, L.K.; Okyere, S.A.; Oviedo, D. Self-built infrastructure interventions to (un)walkable streets: Pedestrian accessibility, safety and enjoyment in a neighbourhood in Accra. Cities 2025, 161, 105911. [Google Scholar] [CrossRef]
- Filipe Teixeira, J.; Diogo, V.; Bernát, A.; Lukasiewicz, A.; Vaiciukynaite, E.; Stefania Sanna, V. Barriers to bike and e-scooter sharing usage: An analysis of non-users from five European capital cities. Case Stud. Transp. Policy 2023, 13, 101045. [Google Scholar] [CrossRef]
- Mayer, A. Motivations and barriers to electric bike use in the U.S.: Views from online forum participants. Int. J. Urban Sustain. Dev. 2020, 12, 160–168. [Google Scholar] [CrossRef]
- Eurostat. Passenger Cars per 1 000 Inhabitants Reached 560 in 2022. 2024. Available online: https://ec.europa.eu/eurostat/web/products-eurostat-news/w/ddn-20240117-1 (accessed on 23 April 2025).
- Paiva, S.; Ahad, M.A.; Tripathi, G.; Feroz, N.; Casalino, G. Enabling technologies for urban smart mobility: Recent trends, opportunities and challenges. Sensors 2021, 21, 2143. [Google Scholar] [CrossRef] [PubMed]
- Zhang, M.; Zhao, P.; Qiao, S. Smartness-induced transport inequality: Privacy concern, lacking knowledge of smartphone use and unequal access to transport information. Transp. Policy 2020, 99, 175–185. [Google Scholar] [CrossRef]
- Makahleh, H.Y.; Ferranti, E.J.S.; Dissanayake, D. Assessing the Role of Autonomous Vehicles in Urban Areas: A Systematic Review of Literature. Future Transp. 2024, 4, 321–348. [Google Scholar] [CrossRef]
- Bridgelall, R.; Stubbing, E. Forecasting the effects of autonomous vehicles on land use. Technol. Forecast. Soc. Change 2021, 163, 120444. [Google Scholar] [CrossRef]
- Budna, K.; Rogowska, W.; Szpilko, D. Autonomiczny transport przyszłości—Ocena ryzyka zagrożeń latających taksówek. Akad. Zarządzania 2025, 9, 224–253. [Google Scholar]
- CNBC. Electric and Hybrid Vehicles Will Account for Nearly Half the Cars on the Road by 2040, Goldman Predicts. 2022. Available online: https://www.cnbc.com/2022/04/04/electric-and-hybrid-vehicles-will-account-for-nearly-half-the-cars-on-the-road-by-2040-goldman-predicts.html (accessed on 23 April 2025).
- Qadir, Z.; Munir, A.; Ashfaq, T.; Munawar, H.S.; Khan, M.A.; Le, K. A prototype of an energy-efficient MAGLEV train: A step towards cleaner train transport. Clean. Eng. Technol. 2021, 4, 100217. [Google Scholar] [CrossRef]
- Singh, P.; Dulebenets, M.A.; Pasha, J.; Gonzalez, E.D.R.S.; Lau, Y.-Y.; Kampmann, R. Deployment of Autonomous Trains in Rail Transportation: Current Trends and Existing Challenges. IEEE Access 2021, 9, 91427–91461. [Google Scholar] [CrossRef]
- Trentesaux, D.; Dahyot, R.; Ouedraogo, A.; Arenas, D.; Lefebvre, S.; Schön, W.; Lussier, B.; Chéritel, H. The Autonomous Train. In Proceedings of the 13th Annual Conference on System of Systems Engineering, Paris, France, 19–22 June 2018; pp. 514–520. [Google Scholar]
- Tan, W.; Ho, S.S. Troubling autonomous public transport: Comparing people with ambulatory disability and older adults’ perceived barriers, identification, and communication preferences. Travel Behav. Soc. 2025, 40, 101029. [Google Scholar] [CrossRef]
- Mouratidis, K.; Serrano, V.C. Autonomous buses: Intentions to use, passenger experiences, and suggestions for improvement. Transp. Res. Part F Traffic Psychol. Behav. 2021, 76, 321–335. [Google Scholar] [CrossRef]
- Shen, J.; Liu, Q.; Ye, Z.; Jiang, W.; Ma, C. Autonomous bus services: Current research status and future recommendations. Digit. Transp. Saf. 2023, 2, 229–240. [Google Scholar] [CrossRef]
- Launonen, P.; Salonen, A.O.; Liimatainen, H. Icy roads and urban environments. Passenger experiences in autonomous vehicles in Finland. Transp. Res. Part F Traffic Psychol. Behav. 2021, 80, 34–48. [Google Scholar] [CrossRef]
- Zefreh, M.M.; Edries, B.; Esztergár-Kiss, D.; Torok, A. Intention to use private autonomous vehicles in developed and developing countries: What are the differences among the influential factors, mediators, and moderators? Travel Behav. Soc. 2023, 32, 100592. [Google Scholar] [CrossRef]
- Karolemeas, C.; Tsigdinos, S.; Moschou, E.; Kepaptsoglou, K. Shared autonomous vehicles and agent based models: A review of methods and impacts. Eur. Transp. Res. Rev. 2024, 16, 25. [Google Scholar] [CrossRef]
- Tu, H.; Zhao, L.; Tu, R.; Li, H. The energy-saving effect of early-stage autonomous vehicles: A case study and recommendations in a metropolitan area. Energy 2024, 297, 131274. [Google Scholar] [CrossRef]
- Panasewicz, K.; Alonso Jorge, A. Perspective of future use of autonomous robotaxes in cities. Acad. Manag. 2023, 7, 213–232. [Google Scholar]
- Zoox. 2025. Available online: https://zoox.com/ (accessed on 23 April 2025).
- Hyundai. 2025. Available online: https://www.hyundai.com/pl/pl/o-hyundai/o-marce/robotics/robotaxi.html (accessed on 23 April 2025).
- Hu, B.; Brandstätter, G.; Müller, J.; Stern, P.; Schaffenberger, A.; Fallast, A.; Lesak, S.; Meinhard, D. Assessing automated air-taxis for urban mobility. Eur. Transp. Res. Rev. 2024, 16, 37. [Google Scholar] [CrossRef]
- Naveen, P.; Antony, M.P.; Ramasamy, B.V.; Sah, D.K.; Maheswar, R. Unlocking the Potential: How Flying Taxis Will Shape the Future of Transportation. Sustainability 2024, 16, 10795. [Google Scholar] [CrossRef]
- Chen, C.; Demir, E.; Huang, Y.; Qiu, R. The adoption of self-driving delivery robots in last mile logistics. Transp. Res. Part E Logist. Transp. Rev. 2021, 146, 102214. [Google Scholar] [CrossRef]
- Panasewicz, K. Perspective of future use of autonomous robots in e-commerce. Scientific Papers of Silesian University of Technology. Organ. Manag. Ser. 2022, 158, 473–487. [Google Scholar]
- Budna, K.; Dąbrowska, K.; Kowalczuk, E.M. Innowacje w robotyce w Polsce—Stan obecny i przyszłe perspektywy. Zesz. Nauk. Politech. Częstochowskiej. Zarządzanie 2024, 55, 17–31. [Google Scholar] [CrossRef]
- Engeber, V.; Rombaut, E.; Vanhaverbeke, L.; Lebeau, P. Autonomous Delivery Robots for Urban Last-mile Logistics Operations: A modified UTAUT framework. Transp. Res. Procedia 2023, 72, 1816–1823. [Google Scholar] [CrossRef]
- SmartCity Korea. 2025. Available online: https://smartcity.go.kr/en/2024/12/13/%EC%9E%90%EC%9C%A8%EC%A3%BC%ED%96%89%EC%88%9C%EC%B0%B0%EB%A1%9C%EB%B4%87/ (accessed on 22 April 2025).
- Ejdys, J.; Strojny, P.; Zazulka, N. Społeczna akceptacja rozwiązań inteligentnej mobilności miejskiej na przykładzie autonomicznych autobusów w Białymstoku. Akad. Zarządzania 2024, 8, 242–253. [Google Scholar]
- European Commission. Report From The Commission To The European Parliament And The Council Saving Lives: Improving Car Safety in the EU. 2016. Available online: https://eur-lex.europa.eu/legal-content/PL/TXT/HTML/?uri=CELEX:52016DC0787&from=PL (accessed on 22 April 2025).
- Sever, T.; Contissa, G. Automated driving regulations—Where are we now? Transp. Res. Interdiscip. Perspect. 2024, 24, 101033. [Google Scholar] [CrossRef]
- Wu, Z.; Zhou, H.; Xi, H.; Wu, N. Analysing public acceptance of autonomous buses based on an extended TAM model. IET Intell. Transp. Syst. 2021, 15, 1318–1330. [Google Scholar] [CrossRef]
- Tu, L.; Xu, M. An Analysis of the Use of Autonomous Vehicles in the Shared Mobility Market: Opportunities and Challenges. Sustainability 2024, 16, 6795. [Google Scholar] [CrossRef]
- Ercan, T.; Onat, N.C.; Keya, N.; Tatari, O.; Eluru, N.; Kucukvar, M. Autonomous electric vehicles can reduce carbon emissions and air pollution in cities. Transp. Res. Part D Transp. Environ. 2022, 112, 103472. [Google Scholar] [CrossRef]
- Almusawi, A.; Albdairi, M.; Qadri, S.S.S.M. Integrating Autonomous Vehicles (AVs) into Urban Traffic: Simulating Driving and Signal Control. Appl. Sci. 2024, 14, 8851. [Google Scholar] [CrossRef]
- Lu, Q.; Tamás, T.; Dániel, H.; Varga, I. The impact of autonomous vehicles on urban traffic network capacity: An experimental analysis by microscopic traffic simulation. Transp. Lett. 2020, 12, 540–549. [Google Scholar] [CrossRef]
- Zhong, H.; Li, W.; Burris, M.W.; Talebpour, A.; Sinha, K.C. Will autonomous vehicles change auto commuters’ value of travel time? Transp. Res. Part D Transp. Environ. 2020, 83, 102303. [Google Scholar] [CrossRef]
- Othman, K. Exploring the implications of autonomous vehicles: A comprehensive review. Innov. Infrastruct. Solut. 2022, 7, 165. [Google Scholar] [CrossRef]
- Choi, J.K.; Ji, Y.G. Investigating the importance of trust on adopting an autonomous vehicle. Int. J. Hum.-Comput. Interact. 2015, 31, 692–702. [Google Scholar] [CrossRef]
- Wang, J.; Zhao, S.; Zhang, W.; Evans, R. Why people adopt smart transportation services: An integrated model of TAM, trust and perceived risk. Transp. Plan. Technol. 2021, 44, 543–560. [Google Scholar] [CrossRef]
- Seuwou, P.; Chrysoulas, C.; Banissi, E.; Ubakanma, G. Measuring consumer behavioural intention to accept technology: Towards autonomous vehicles technology acceptance model (AVTAM). Adv. Intell. Syst. Comput. 2020, 1159, 623–633. [Google Scholar]
- Golbabaei, F.; Yigitcanlar, T.; Paz, A.; Bunker, J. Individual predictors of autonomous vehicle public acceptance and intention to use: A systematic review of the literature. J. Open Innov. Technol. Mark. Complex. 2020, 6, 106. [Google Scholar] [CrossRef]
- Nordhoff, S.; De Winter, J.; Kyriakidis, M.; Van Arem, B.; Happee, R. Acceptance of driverless vehicles: Results from a large cross-national questionnaire study. J. Adv. Transp. 2018, 2018, 5382192. [Google Scholar] [CrossRef]
- Brell, T.; Philipsen, R.; Ziefle, M. Suspicious minds? Users’ perceptions of autonomous and connected driving. Theor. Issues Ergon. Sci. 2019, 20, 261–282. [Google Scholar] [CrossRef]
- Hegner, S.M.; Beldad, A.D.; Brunswick, G.J. In automatic we trust: Investigating the impact of trust, control, personality characteristics, and extrinsic and intrinsic motivations on the acceptance of autonomous vehicles. Int. J. Hum.-Comput. Interact. 2019, 35, 1769–1780. [Google Scholar] [CrossRef]
- Rahman, M.M.; Thill, J.C. What drives people’s willingness to adopt autonomous vehicles? A review of internal and external factors. Sustainability 2023, 15, 11541. [Google Scholar] [CrossRef]
- Mara, M.; Meyer, K. Acceptance of autonomous vehicles: An overview of user-specific, car-specific and contextual determinants. In User Experience Design in the Era of Automated Driving; Studies in Computational Intelligence; Springer: Cham, Switzerland, 2022; Volume 980. [Google Scholar]
- Classen, S.; Sisiopiku, V.P.; Mason, J.R.; Yang, W.; Hwangbo, S.W.; McKinney, B.; Li, Y. Experience of drivers of all age groups in accepting autonomous vehicle technology. J. Intell. Transp. Syst. Technol. Plan. Oper. 2024, 28, 651–667. [Google Scholar] [CrossRef]
- Titov, W.; Schlegel, T. Promoting user acceptance in autonomous driving. In Proceedings of the 7th International Conference on Smart and Sustainable Technologies 2022, Bol, Croatia, 5–8 July 2022. [Google Scholar]
- Habib, A.; Alsmadi, D.; Prybutok, V.R. Factors that determine residents’ acceptance of smart city technologies. Behav. Inf. Technol. 2020, 39, 610–623. [Google Scholar] [CrossRef]
- Neupane, C.; Wibowo, S.; Grandhi, S.; Deng, H. A trust-based model for the adoption of smart city technologies in Australian regional cities. Sustainability 2021, 13, 9316. [Google Scholar] [CrossRef]
- Ejdys, J.; Gulc, A.; Budna, K.; Esparteiro Garcia, J. Steering into the Future: Public Perceptions and Acceptance of Autonomous Buses. Econ. Environ. 2025, 92, 1140. [Google Scholar] [CrossRef]
- Beştepe, F.; Yildirim, S.Ö. Acceptance of IoT-based and sustainability-oriented smart city services: A mixed methods study. Sustain. Cities Soc. 2022, 80, 103794. [Google Scholar] [CrossRef]
- Julsrud, D.T.E.; Krogstad, D.J.R. Is there enough trust for the smart city? Exploring acceptance for use of mobile phone data in Oslo and Tallinn. Technol. Forecast. Soc. Change 2020, 161, 120314. [Google Scholar] [CrossRef]
- Bruckes, M.; Grotenhermen, J.G.; Cramer, F.; Schewe, G. Paving the way for the adoption of autonomous driving: Institution-based trust as a critical success factor. In Proceedings of the 27th European Conference on Information Systems (ECIS): Information Systems for a Sharing Society 2019, Stockholm and Uppsala, Sweden, 8–14 June 2019. [Google Scholar]
- Dirsehan, T.; Can, C. Examination of trust and sustainability concerns in autonomous vehicle adoption. Technol. Soc. 2020, 63, 101361. [Google Scholar] [CrossRef]
- Liu, H.; Yang, R.; Wang, L.; Liu, P. Evaluating initial public acceptance of highly and fully autonomous vehicles. Int. J. Hum. Comput. Interact. 2019, 35, 919–931. [Google Scholar] [CrossRef]
- Thomas, E.; McCrudden, C.; Wharton, Z.; Behera, A. Perception of autonomous vehicles by the modern society: A survey. IET Intell. Transp. Syst. 2020, 14, 1228–1239. [Google Scholar] [CrossRef]
- Trende, A.; Gräfing, D.; Weber, L. Personalized user profiles for autonomous vehicles. In Proceedings of the 11th International ACM Conference on Automotive User Interfaces and Interactive Vehicular Applications (AutomotiveUI) 2019, Utrecht, The Netherlands, 21–25 September 2019. [Google Scholar]
- Schandl, F.; Fischer, P.; Hudecek, M.F.C. Predicting acceptance of autonomous shuttle buses by personality profiles: A latent profile analysis. Transportation 2023, 52, 1015–1038. [Google Scholar] [CrossRef]
- Rahimi, A.; Azimi, G.; Asgari, H.; Jin, X. Adoption and willingness to pay for autonomous vehicles: Attitudes and latent classes. Transp. Res. Part D Transp. Environ. 2020, 89, 102611. [Google Scholar] [CrossRef]
- Gangadharaiah, R.; Mims, L.; Jia, Y.; Brooks, J. Opinions from users across the lifespan about fully autonomous and rideshare vehicles with associated features. SAE Int. J. Adv. Curr. Pract. Mobil. 2023, 6, 309–323. [Google Scholar]
- Mercep, L. Efficient profiling and distributed synchronization of statistical user models for content-targeting and real-time applications. In Proceedings of the 38th International Convention on Information and Communication Technology, Electronics and Microelectronics (MIPRO) 2015, Opatija, Croatia, 25–29 May 2015. [Google Scholar]
- Statistical Office. 2025. Available online: https://warszawa.stat.gov.pl/warszawa/ (accessed on 24 April 2025).
- Miasto Stołeczne Warszawa; Stowarzyszenie Metropolia Warszawa; Trako. Sustainable Urban Mobility Plan for the Warsaw Metropolis 2030+. 2023. Warszawa, Wrocław, Poland. Available online: https://share.google/PtafpamHOWzNir7ga (accessed on 24 May 2025).
- Korkmaz, H.; Fidanoglu, A.; Ozcelik, S.; Okumus, A. User acceptance of autonomous public transport systems: Extended UTAUT2 model. J. Public Transp. 2022, 24, 100013. [Google Scholar] [CrossRef]
- Wu, X.; Cao, J.; Douma, F. The impacts of vehicle automation on transport-disadvantaged people. Transp. Res. Interdiscip. Perspect. 2021, 11, 100447. [Google Scholar] [CrossRef]
- Cai, L.; Yuen, K.F.; Wang, X. Explore public acceptance of autonomous buses: An integrated model of UTAUT, TTF and trust. Travel Behav. Soc. 2023, 31, 120–130. [Google Scholar] [CrossRef]
- Chen, Y.; Khalid Khan, S.; Shiwakoti, N.; Stasinopoulos, P.; Aghabayk, K. Analysis of Australian public acceptance of fully automated vehicles by extending technology acceptance model. Case Stud. Transp. Policy 2023, 14, 101072. [Google Scholar] [CrossRef]
- Huang, D.; Hu, Z.; Tian, J.; Tu, R. Improving conventional transit services with modular autonomous vehicles: A bi-level programming approach. Travel Behav. Soc. 2025, 39, 100939. [Google Scholar] [CrossRef]
- Cheng, Y.-H.; Lai, Y.-C. Exploring autonomous bus users’ intention: Evidence from positive and negative effects. Transp. Policy 2024, 146, 91–101. [Google Scholar] [CrossRef]
- WVS. World Values Survey Wave 7: 2017–2022. 2022. Available online: https://www.worldvaluessurvey.org/wvs.jsp (accessed on 23 April 2025).
- Greifenstein, M. Factors influencing the user behaviour of shared autonomous vehicles (SAVs): A systematic literature review. Transp. Res. Part F Traffic Psychol. Behav. 2024, 100, 323–345. [Google Scholar] [CrossRef]
- Charness, N.; Yoon, J.S.; Souders, D.; Stothart, C.; Yehnert, C. Predictors of Attitudes Toward Autonomous Vehicles: The Roles of Age, Gender, Prior Knowledge, and Personality. Front. Psychol. 2018, 9, 2589. [Google Scholar] [CrossRef]
- Xiao, J.; Goulias, K.G. Perceived usefulness and intentions to adopt autonomous vehicles. Transp. Res. Part A Policy Pract. 2022, 161, 170–185. [Google Scholar] [CrossRef]
- Weigl, K.; Marco, S.; Riener, A. Gender and age differences in the anticipated acceptance of automated vehicles: Insights from a questionnaire study and potential for application. Gend. Technol. Dev. 2023, 27, 88–108. [Google Scholar] [CrossRef]
- Schandl, F.; Lermer, E.; Hudecek, M.F.C. If It Concerns Me: An Experimental Investigation of the Influence of Psychological Distance on the Acceptance of Autonomous Shuttle Buses. Collabra Psychol. 2024, 10, 118770. [Google Scholar] [CrossRef]
- ZTM. Raport 2024. Zarząd Transportu Miejskiego w Warszawie Raport 2024. 2025. Available online: https://www.ztm.waw.pl/wp-content/uploads/2025/03/raport_ZTM_2024.pdf (accessed on 25 April 2025).
- Acheampong, R.; Cugurullo, F.; Guériau, M.; Dusparic, I. Can autonomous vehicles enable sustainable mobility in future cities? Insights and policy challenges from user preferences over different urban transport options. Cities 2021, 112, 103134. [Google Scholar] [CrossRef]
- Chng, S.; Anowar, S.; Cheah, L. Understanding Shared Autonomous Vehicle Preferences: A Comparison between Shuttles, Buses, Ridesharing and Taxis. Sustainability 2022, 14, 13656. [Google Scholar] [CrossRef]


Disclaimer/Publisher’s Note: The statements, opinions and data contained in all publications are solely those of the individual author(s) and contributor(s) and not of MDPI and/or the editor(s). MDPI and/or the editor(s) disclaim responsibility for any injury to people or property resulting from any ideas, methods, instructions or products referred to in the content. |
© 2025 by the authors. Licensee MDPI, Basel, Switzerland. This article is an open access article distributed under the terms and conditions of the Creative Commons Attribution (CC BY) license (https://creativecommons.org/licenses/by/4.0/).