AHP–Entropy Method for Sustainable Development Potential Evaluation and Rural Revitalization: Evidence from 80 Traditional Villages in Cantonese Cultural Region, China
Abstract
1. Introduction
2. Materials and Methods
2.1. Study Area
2.1.1. Geographical and Cultural Delineation of the CCR
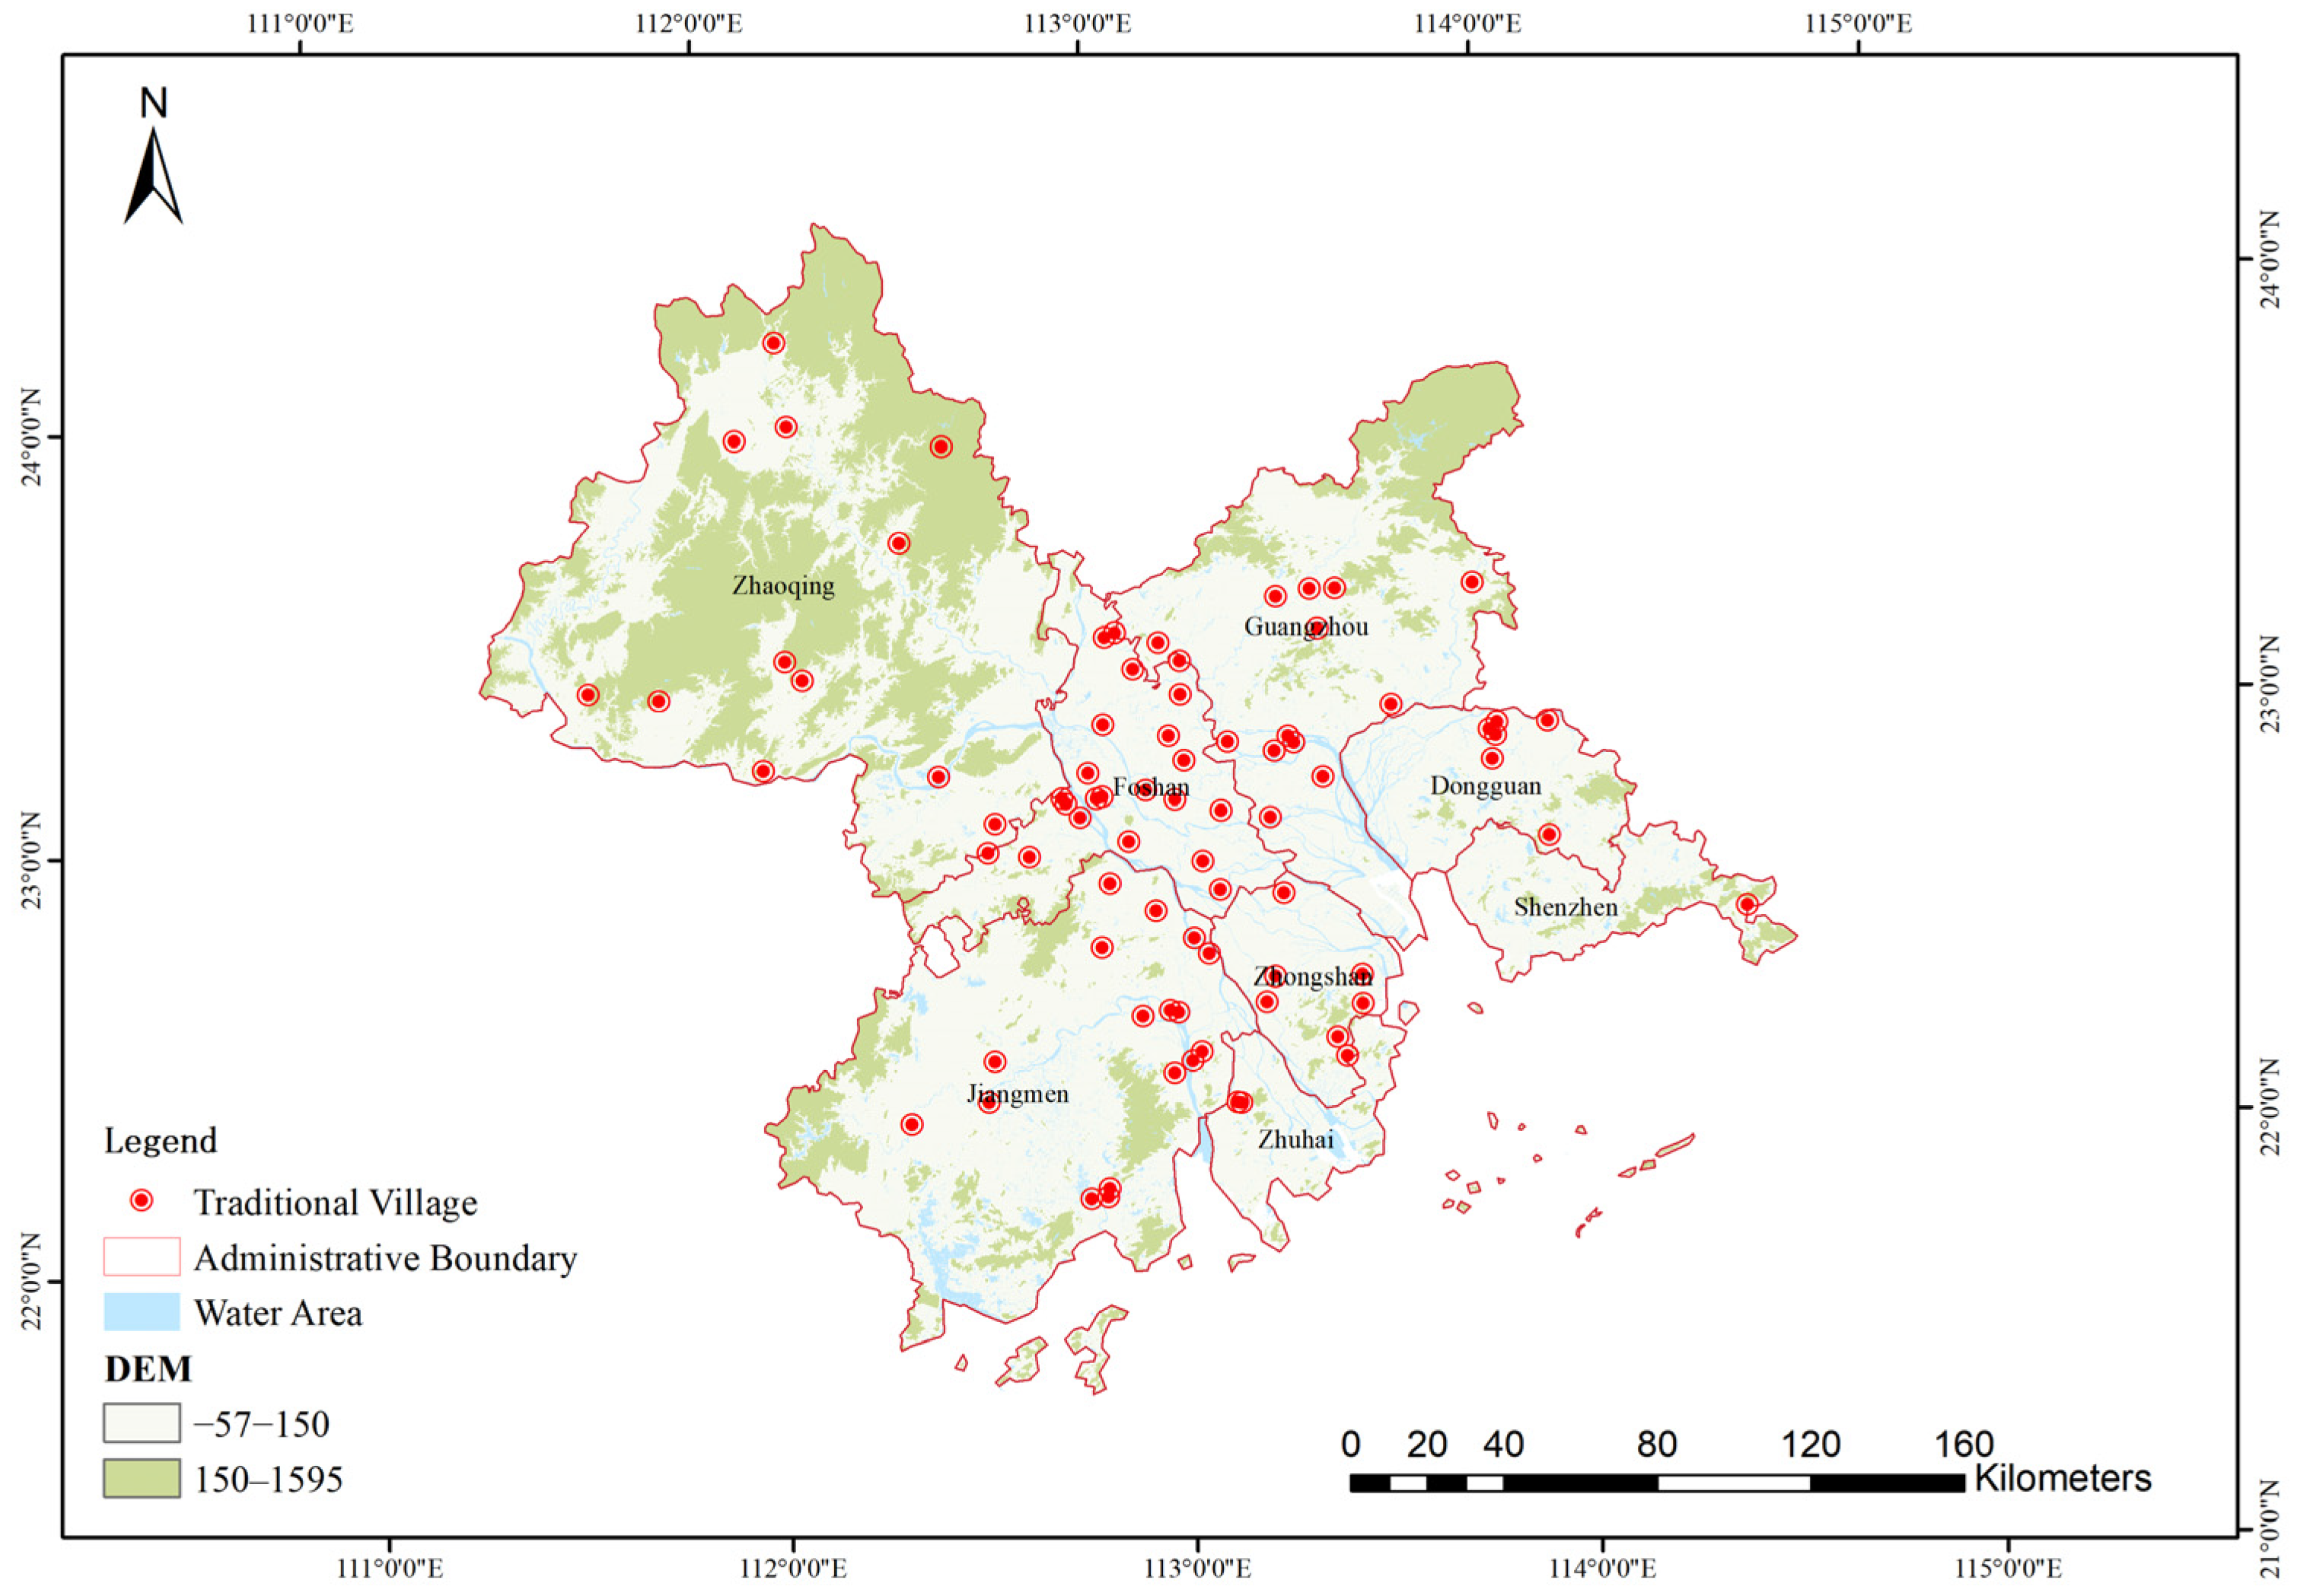
2.1.2. Village Selection and Spatial Distribution
- (1)
- Core Guangfu villages, which represent the heartland of Lingnan culture and are known for their distinctive architectural styles.
- (2)
- Hakka villages, often located in peripheral hilly areas, are known for their collective fortified structures.
- (3)
- Overseas Chinese hometowns (Qiaoxiang), especially common in Jiangmen and Foshan, exhibit diasporic influences through architectural hybridity-such as watchtowers-and cultural practices.
2.2. Research Framework and Data Sources
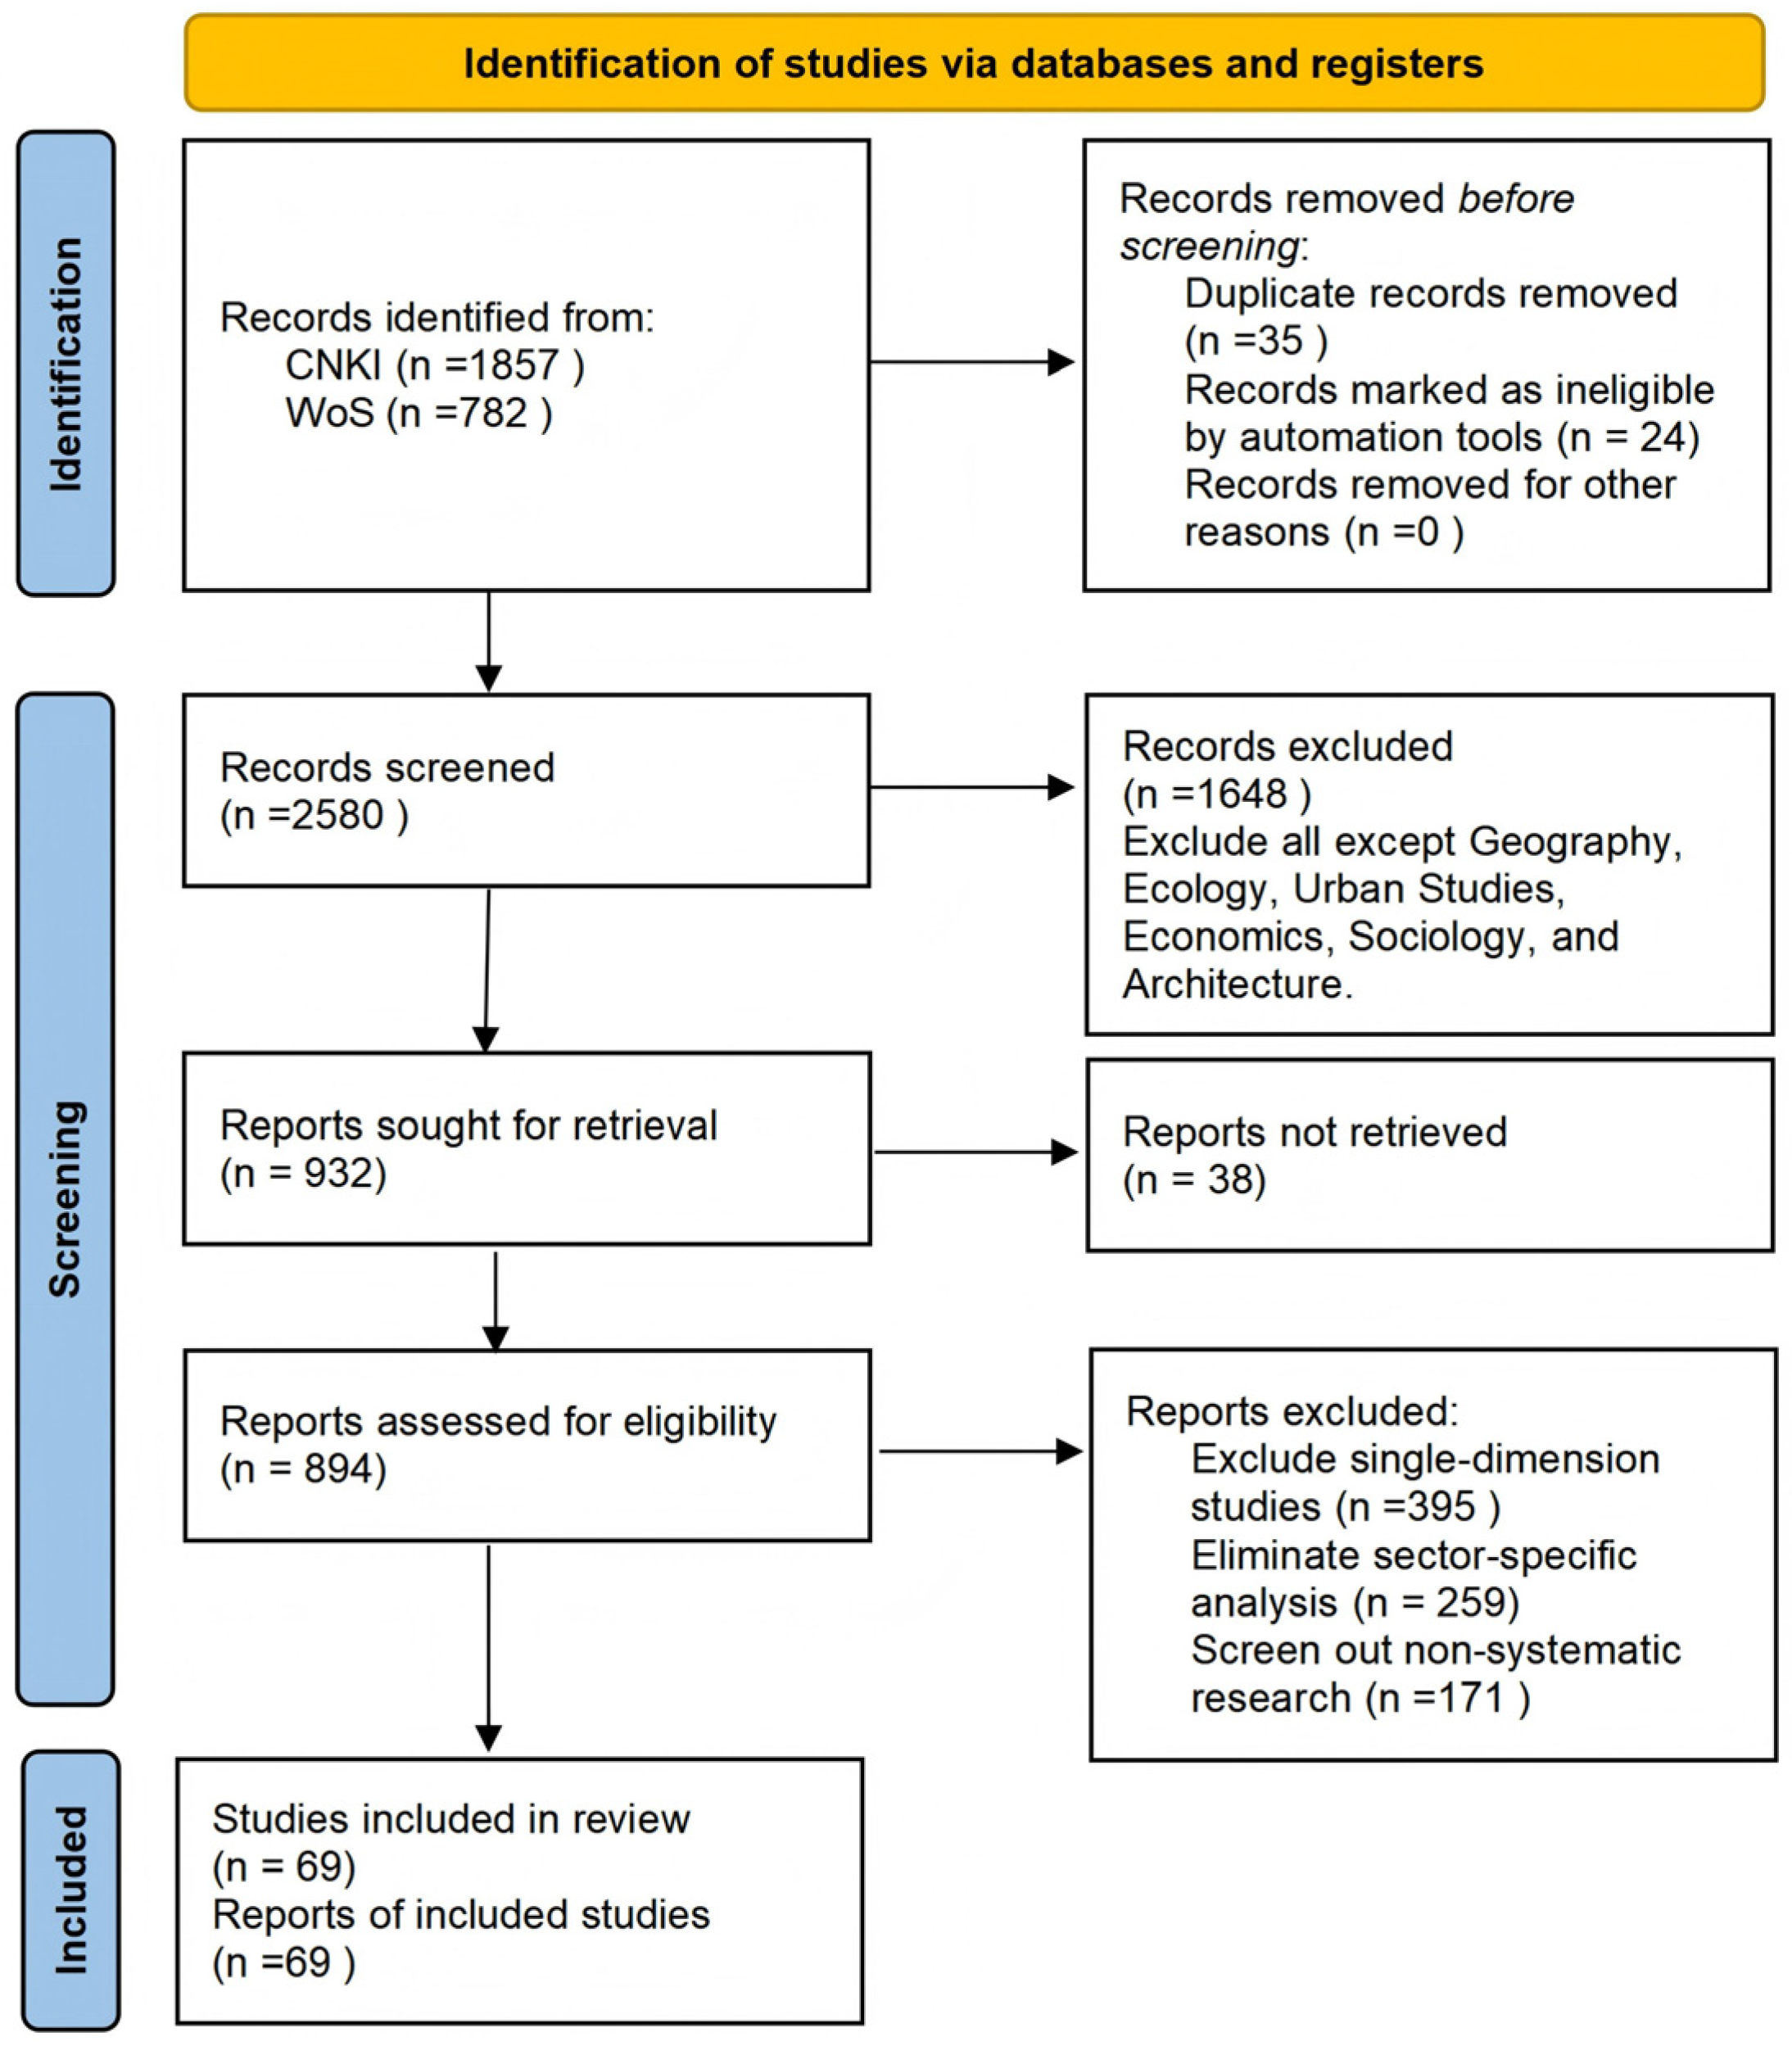
2.2.1. Establish a System of Indicators
2.2.2. Data Sources
- (1)
- Geospatial Data
- (2)
- Guangfu Traditional Village Data
2.3. Methods
2.3.1. Standardization
2.3.2. AHP–Entropy Hybrid Weighting
2.3.3. Spatial Autocorrelation Analysis
2.3.4. Geographical Detector
3. Results
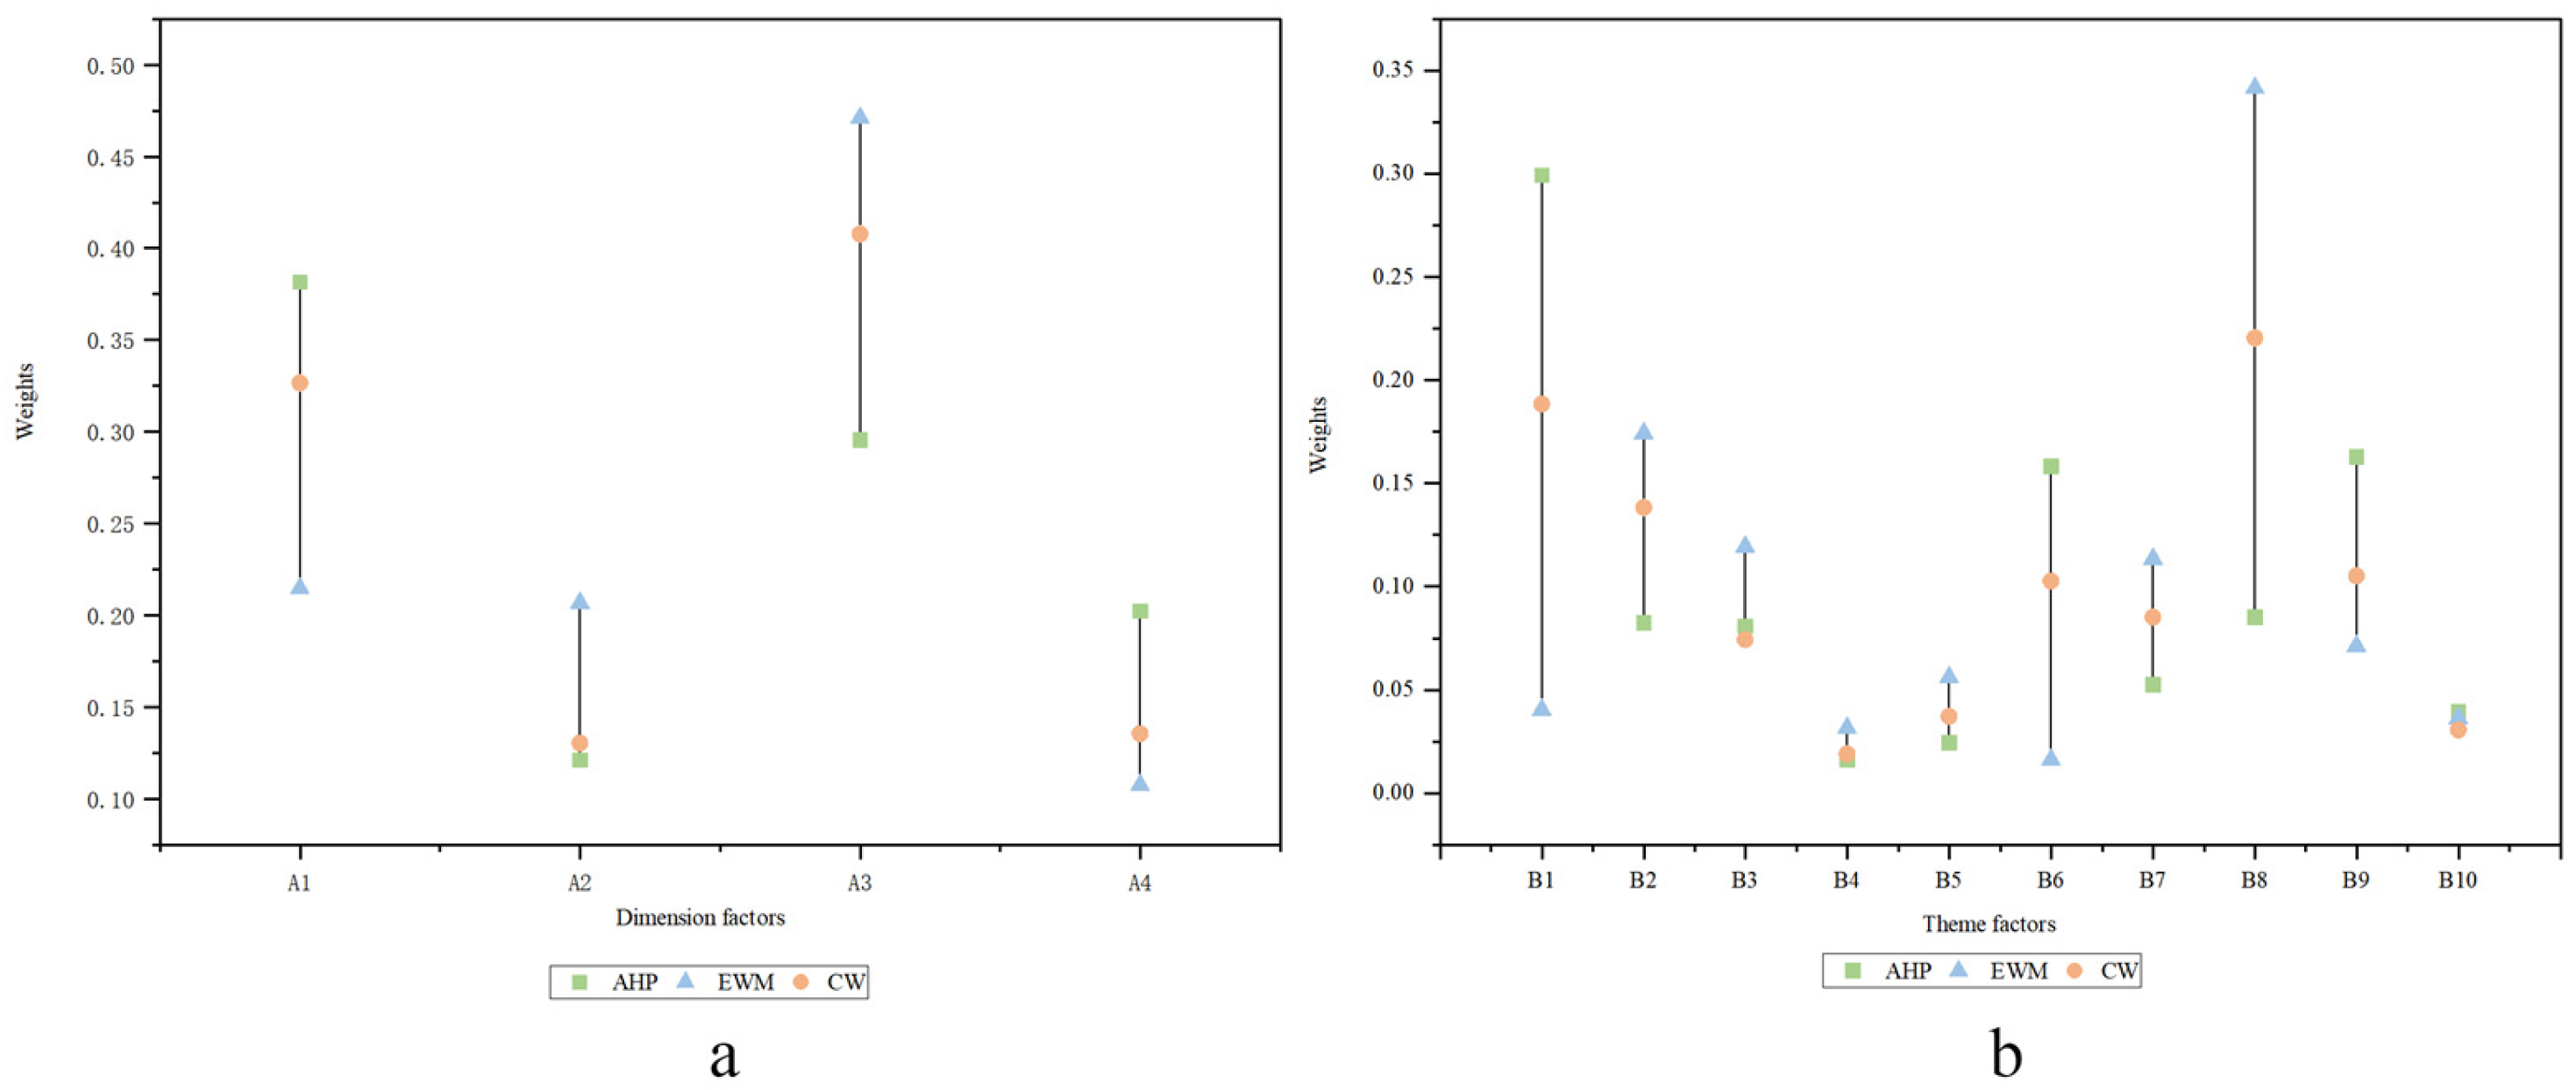
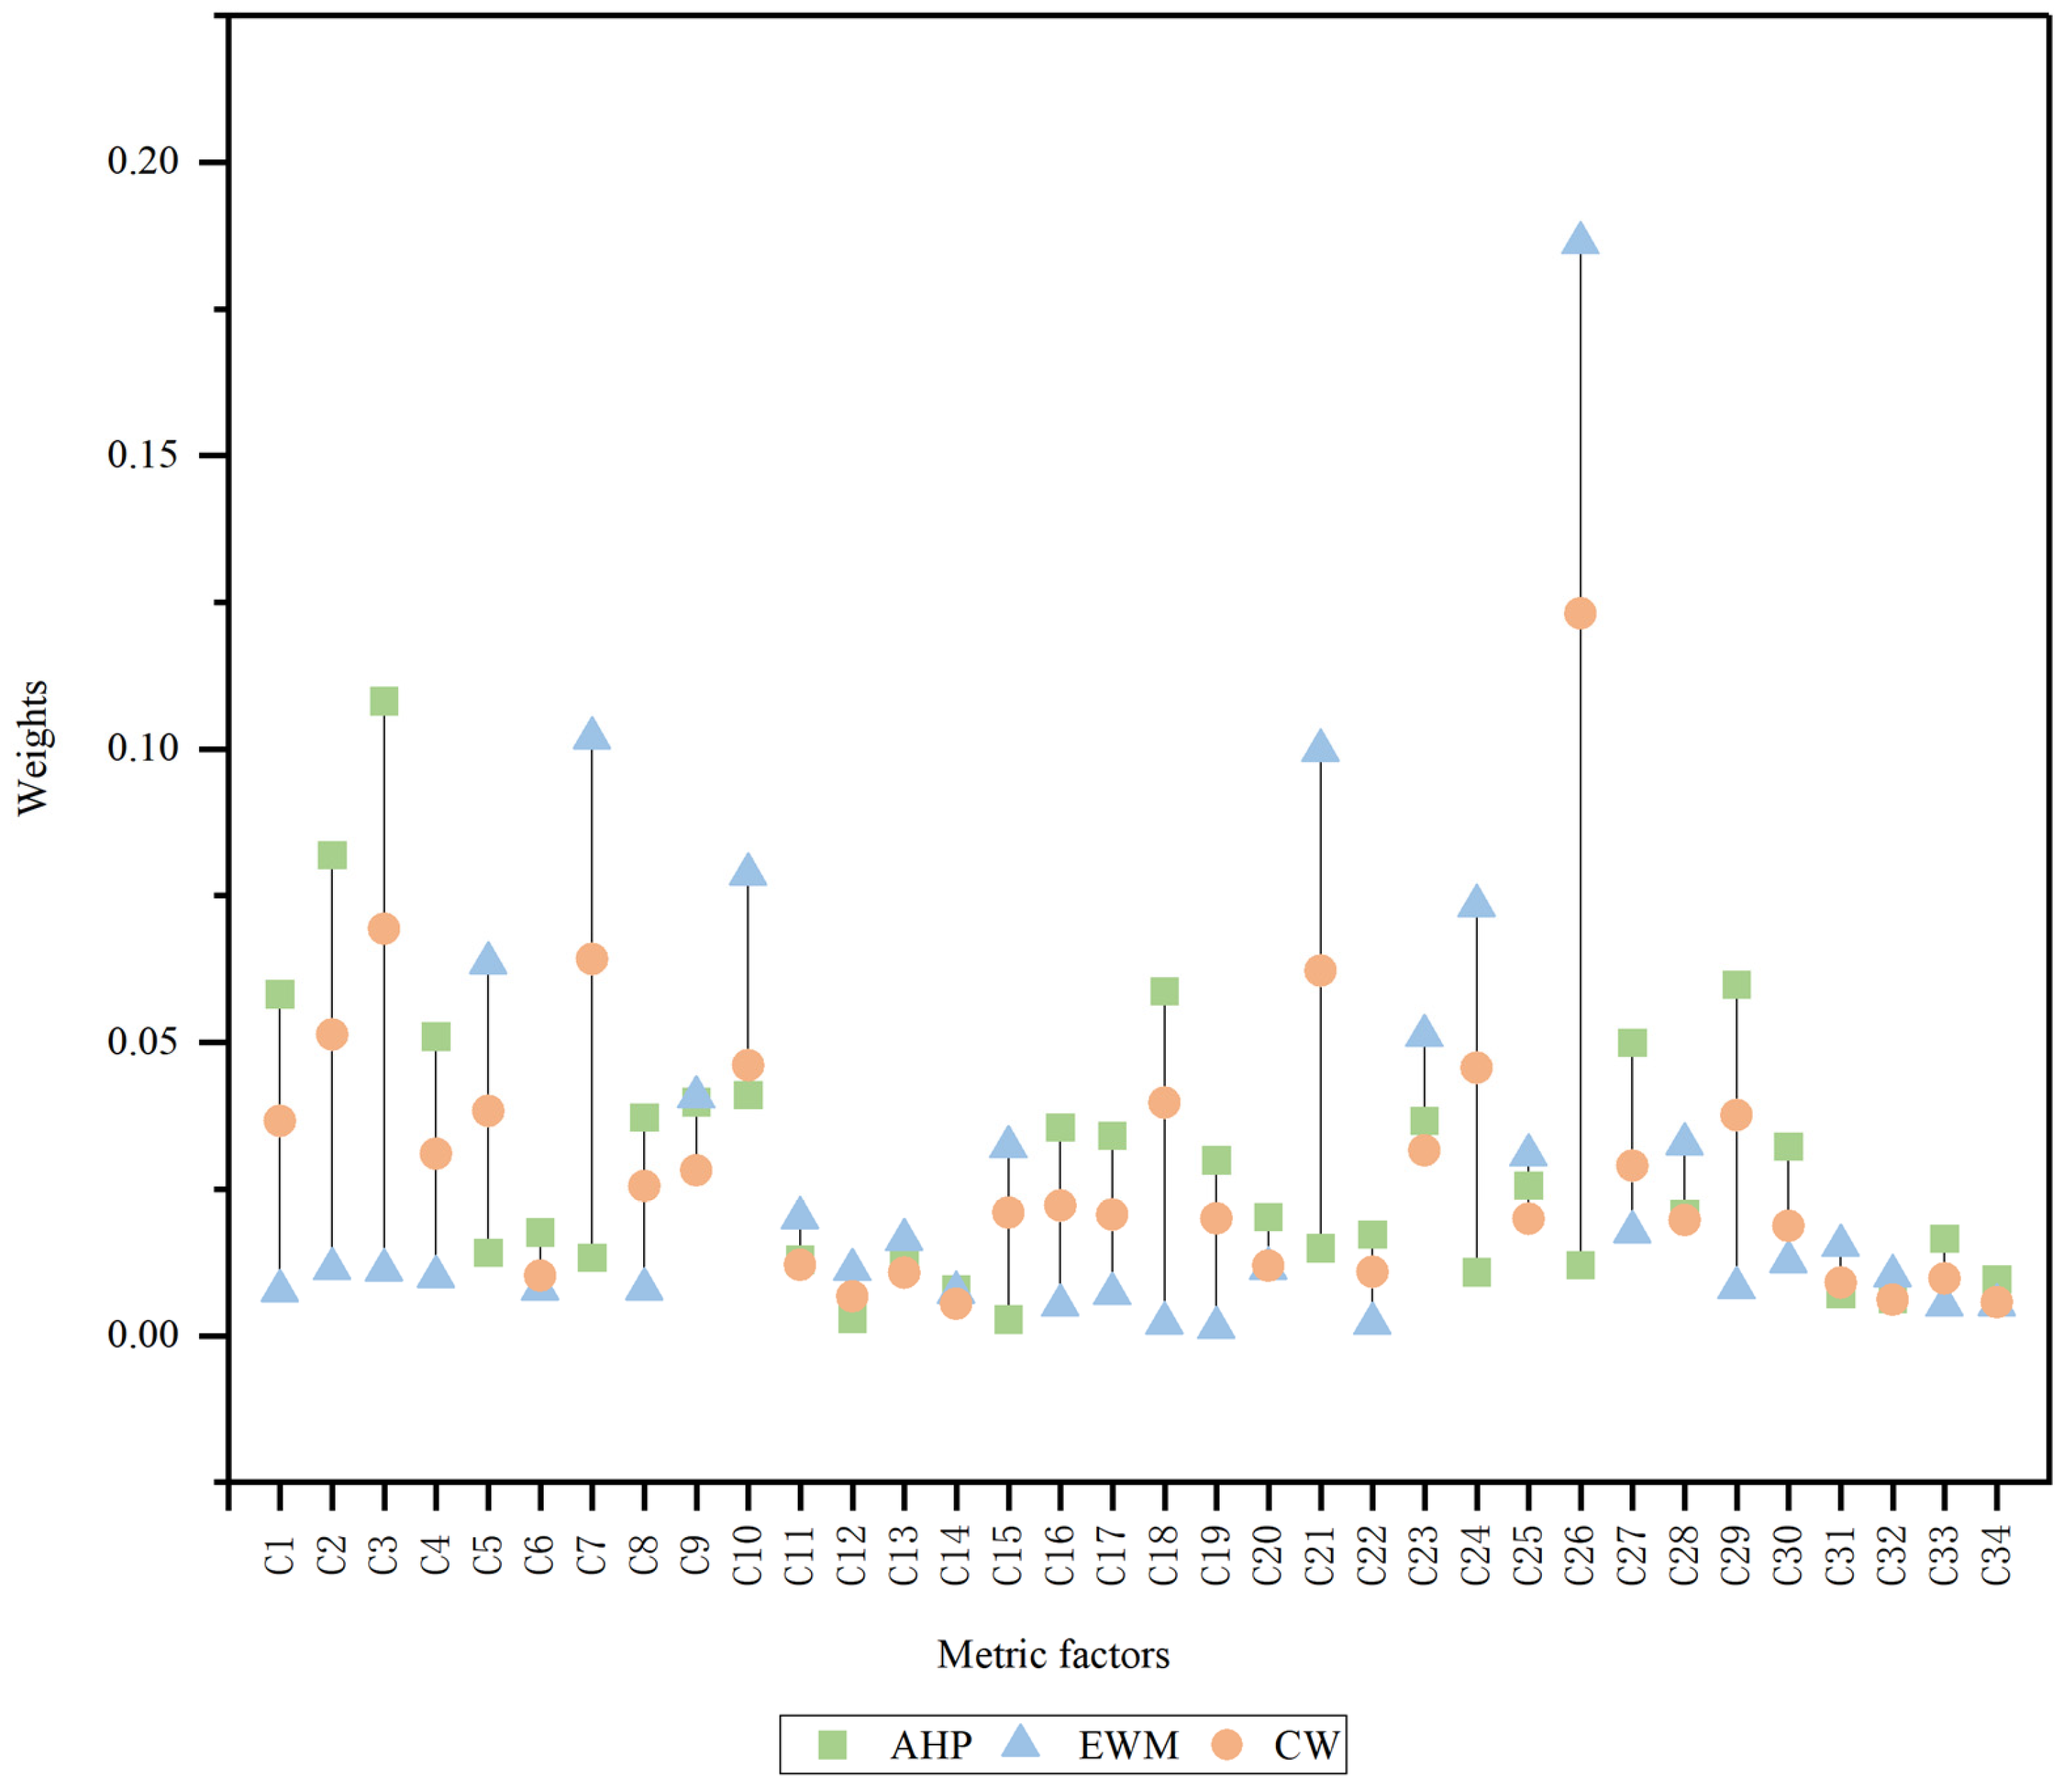
3.1. Factor Weight Analysis
3.2. Spatial Differentiation Pattern of SDP
3.3. Analysis of the Spatial Structure of the SDP in CCR
3.4. Impact of Weighting Method Disparities on Spatial Cognition
4. Discussion
4.1. Discussion on the Applicability and Effectiveness of Weighting Methods
4.1.1. The Nature of Conflict Between Subjective Preferences and Objective Information
4.1.2. The Nature of the Conflict Between Subjective Preferences and Objective Information
- (1)
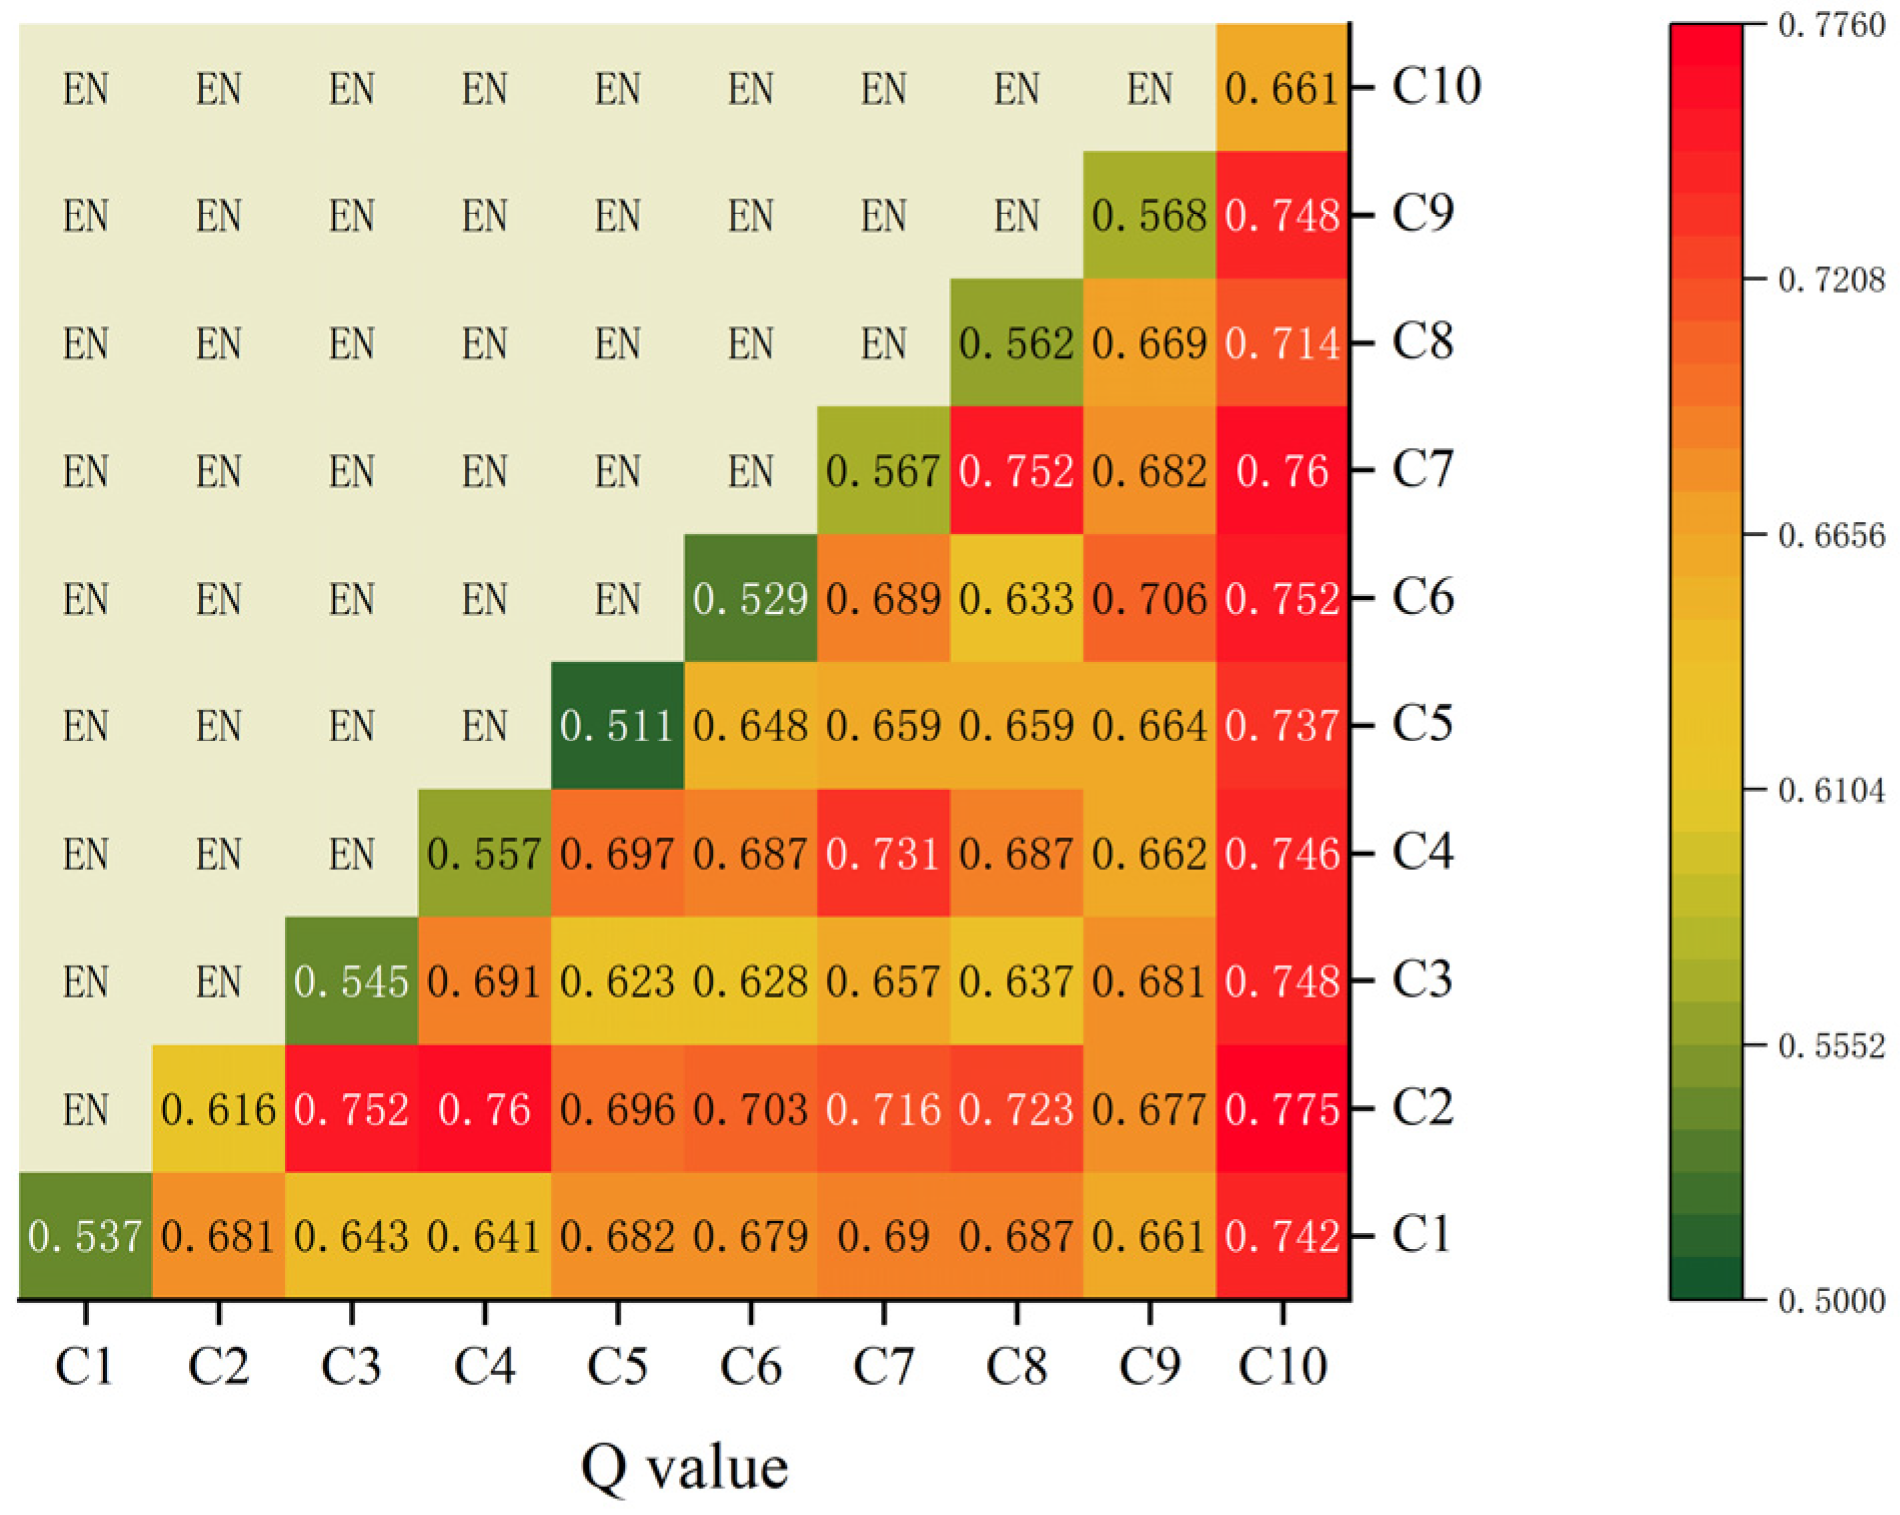
- Conflict Resolution Mechanism: The minimum information entropy principle identifies consensus domains (89% of indicators show <0.05 weight difference), while fuzzy clustering resolves disputed indicators (e.g., C7 “Water Coverage”) [22]. This eliminates the “weight oscillation” seen in studies like Ding et al. (2023), where AHP (weight = 0.40) and EWM (weight = 0.08) assigned conflicting priorities to water temperature, causing misclassification of oligotrophic waters [23].
- (2)
- Policy Relevance: High harmonization enables direct policy alignment. Longbeiling Village’s “High Sustainability” CW rating (Table 3) stems from balanced development in C33 “Disposable Income” (CW weight = 0.0187) and C19 “Natural Integration” (0.0376). This suggests Guangdong’s rural revitalization should prioritize “cultural–ecological composite industries” (e.g., heritage tourism integrated with agro-innovation) [24] over monolithic agricultural output growth.
- (3)
- Theoretical Universality: The 81% harmonization reveals inherent consistency between subjective and objective weights for most indicators, with only 11% requiring deep reconciliation. This establishes a new framework—Sustainability as Multi-Rationality Symbiosis—as evidenced by Provence (France), where CW-adjusted “Tourist Volume” weights reduced cultural over-commercialization by 37%.
4.2. Analysis of Driving Mechanisms Behind the Spatial Pattern of Traditional Village SDP
4.2.1. Core Driving Factor
4.2.2. Non-Linear Enhancement Effects of Factor Interactions
4.3. Research Implications, Limitations and Prospects
4.3.1. Implications for Differentiated Conservation Strategies of Traditional Villages
4.3.2. Limitations and Future Research Directions
- (1)
- Multidimensional data integration, combining multi-source big data with longitudinal monitoring to develop dynamic assessment systems.
- (2)
- Methodological innovation through the adoption of complexity science models and mixed methods to progress from static correlation to dynamic causal inference.
- (3)
- Uncertainty-aware weighting schemes that incorporate resampling and sensitivity analysis to enhance the robustness and interpretability of composite indicators.
- (4)
- Paradigm shifts involve, transitioning from material space metrics to endogenous community dynamics, cultural gene transmission, and living evolutionary processes. These efforts will advance traditional village research beyond merely explaining “what exists where” toward predicting “how changes unfold” and guiding “how to intervene.”
5. Conclusions
Author Contributions
Funding
Institutional Review Board Statement
Informed Consent Statement
Data Availability Statement
Conflicts of Interest
Appendix A. Quantification Criteria of the Indicators and Weight
| Number | Variable | AHP Weight | Entropy Weight | Integrated Weight | Evaluation Standards |
|---|---|---|---|---|---|
| 1 | Distance to Administrative Center | 0.0582 | 0.0077 | 0.0366 | Distance to administrative center: >12 km (2), 8–12 km (4), 5–8 km (6), 3–5 km (8), <3 km (10) |
| 2 | Distance to Transportation Node | 0.0819 | 0.0114 | 0.0513 | Distance to transportation node: >15 km (2), 8–15 km (4), 5–8 km (6), 3–5 km (8), <3 km (10) |
| 3 | Distance to Scenic Area Linkage | 0.1081 | 0.0112 | 0.0694 | Distance to transportation node: >15 km (2), 8–15 km (4), 5–8 km (6), 3–5 km (8), <3 km (10) |
| 4 | Number of External Routes | 0.0510 | 0.0101 | 0.0310 | Access routes: 1 (2), 2 (4), 3 (6), 4 (8), 5+ (10) |
| 5 | Topographic Position Index | 0.0141 | 0.0636 | 0.0383 | TPI index: 0–0.2 (2), 0.2–0.4 (4), 0.4–0.6 (6), 0.6–0.8 (8), 0.8–1 (10) |
| 6 | Ecological Sensitivity Level | 0.0176 | 0.0080 | 0.0102 | Ecological sensitivity: Level 5–4 (2), 4–3 (4), 3–2 (6), 2–1 (8), 1–0 (10) |
| 7 | Water Coverage Rate | 0.0133 | 0.1019 | 0.0642 | Water coverage: <3% (2), 3–6% (4), 6–10% (6), 10–15% (8), >15% (10) |
| 8 | Geohazard Risk | 0.0372 | 0.0008 | 0.0255 | Base 10, minus 2 per disaster |
| 9 | Rural Honorary Titles | 0.0398 | 0.0407 | 0.0282 | National (2), Provincial (1), Municipal (0.5) per item, max 10 |
| 10 | Subsidy Amount (5-year) | 0.0410 | 0.0787 | 0.0461 | <300 k (2), 300–500 k (4), 500 k–1 M (6), 1–5 M (8), >5 M (10) |
| 11 | Population Scale | 0.0129 | 0.0201 | 0.0121 | <200 (2), 200–500 (4), 500–1500 (6), 1500–3000 (8), >3000 (10) |
| 12 | Population Aging Rate | 0.0029 | 0.0113 | 0.0067 | >25% (4), 20–25% (6), 10–20% (8), <10% (10) |
| 13 | Basic Education Facilities | 0.0138 | 0.0164 | 0.0107 | >3 km (4), 2–3 km (6), 1–2 km (8), <1 km (10) |
| 14 | Medical Coverage | 0.0079 | 0.0074 | 0.0054 | >5 km (2), 4–5 km (4), 3–4 km (6), 1–3 km (8), <1 km (10) |
| 15 | Cultural-Sports Facilities | 0.0027 | 0.0322 | 0.0210 | +2 per item, max 10 |
| 16 | Settlement Antiquity | 0.0355 | 0.0052 | 0.0222 | <100 yrs (2), 100–300 yrs (4), 300–500 yrs (6), 500–700 yrs (8), >700 yrs (10) |
| 17 | Cultural Richness | 0.0341 | 0.0072 | 0.0206 | +2 per category (ancient roads, etc.), max 10 |
| 18 | Settlement Pattern Integrity | 0.0587 | 0.0022 | 0.0397 | Intact (10), Relatively intact (8), Partially retained (6), Sparsely preserved (4) |
| 19 | Natural Integration Degree | 0.0299 | 0.0014 | 0.0200 | Harmonious coexistence (10), Partially altered (7), Severely damaged (4) |
| 20 | Building Antiquity | 0.0202 | 0.0115 | 0.0119 | Ming (10), Qing (8), ROC era (6), pre-1980 (4) |
| 21 | Building Rarity | 0.0149 | 0.0998 | 0.0622 | National (5 + 2), Provincial (3 + 1.5), County (2 + 1) per item, max 10 |
| 22 | Regional Architectural Features | 0.0172 | 0.0021 | 0.0109 | +1 per regional characteristic |
| 23 | ICH Rarity | 0.0366 | 0.0512 | 0.0316 | World (10), National (6), Provincial (4), Municipal (2), County (1) |
| 24 | ICH Diversity | 0.0108 | 0.0733 | 0.0457 | County (1), Provincial (2), National (4) per item, max 10 |
| 25 | ICH Continuity | 0.0256 | 0.0308 | 0.0199 | >100 yrs (10), 50–100 yrs (5), ≤50 yrs (2) |
| 26 | ICH Inheritors | 0.0120 | 0.1863 | 0.1231 | National (10), Provincial (5), Municipal (3), County (1), None (0) |
| 27 | Arable Land Resources | 0.0499 | 0.0177 | 0.0290 | <0.5 mu/p (2), 0.5–1 mu (4), 1–2 mu (6), 2–3 mu (8), >3 mu (10) |
| 28 | Forest Resource | 0.0208 | 0.0327 | 0.0197 | <15% (2), 15–30% (4), 30–50% (6), 50–70% (8), >70% (10) |
| 29 | Agricultural Modernization | 0.0598 | 0.0082 | 0.0376 | None (3), Partial (5), Basic (7), Full (10) |
| 30 | Industrial Diversification | 0.0322 | 0.0126 | 0.0187 | +2 per non-agricultural sector, max 10 |
| 31 | Gross Industrial Output | 0.0071 | 0.0154 | 0.0090 | <50 B (2), 50–200 B (4), 200–400 B (6), 400–600 B (8), >600 B (10) |
| 32 | Agricultural Output | 0.0062 | 0.0102 | 0.0061 | <4 B (2), 4–6 B (4), 6–8 B (6), 8–10 B (8), >10 B (10) |
| 33 | Disposable Income | 0.0165 | 0.0052 | 0.0097 | <20 k (2), 20–40 k (4), 40–50 k (6), 50–60 k (8), >60 k (10) |
| 34 | Per Capita GDP | 0.0096 | 0.0053 | 0.0057 | <40 k (2), 40–60 k (4), 60–100 k (6), 100–150 k (8), >150 k (10) |
References
- Li, B.; Yang, F.; Long, X.; Liu, X.; Cheng, B.; Dou, Y. The organic renewal of traditional villages from the perspective of logical space restoration and physical space adaptation: A case study of Laoche village, China. Habitat Int. 2024, 144, 102988. [Google Scholar] [CrossRef]
- Lin, Z.; Liang, Y.; Liu, X. Study on spatial form evolution of traditional villages in Jiuguan under the influence of historic transportation network. Herit. Sci. 2024, 12, 29. [Google Scholar] [CrossRef]
- Chen, Z.; Gao, Q.; Li, X.; Yang, X.; Wang, Z. Beyond inundation: A comprehensive assessment of sea level rise impact on coastal cultural heritage in China. Herit. Sci. 2024, 12, 121. [Google Scholar] [CrossRef]
- Li, Y.; Ismail, M.A.; Aminuddin, A.; Wang, R.; Jiang, K.; Yu, H. The Lost View: Villager-Centered Scale Development and Validation Due to Rural Tourism for Traditional Villages in China. Sustainability 2025, 17, 2721. [Google Scholar] [CrossRef]
- Wang, L.; Zhuang, J.; Wang, M.; Adnan, R.M. Comprehensive assessment of spatial quality in traditional village landscapes of the Yuanshui River Basin using semantic differential and Entropy Weight Methods. Front. Environ. Sci. 2025, 13, 1552489. [Google Scholar] [CrossRef]
- Harbiankova, A.; Scherbina, E.; Budzevich, M. Exploring the significance of Heritage preservation in enhancing the settlement system resilience. Sustainability 2023, 15, 15251. [Google Scholar] [CrossRef]
- Xu, H.; Ma, C.; Lian, J.; Xu, K.; Chaima, E. Urban flooding risk assessment based on an integrated k-means cluster algorithm and improved entropy weight method in the region of Haikou, China. J. Hydrol. 2018, 563, 975–986. [Google Scholar] [CrossRef]
- Zyoud, S.H.; Fuchs-Hanusch, D. A bibliometric-based survey on AHP and TOPSIS techniques. Expert Syst. Appl. 2017, 78, 158–181. [Google Scholar] [CrossRef]
- Li, Z.; Luo, Z.; Wang, Y.; Fan, G.; Zhang, J. Suitability evaluation system for the shallow geothermal energy implementation in region by Entropy Weight Method and TOPSIS method. Renew. Energy 2022, 184, 564–576. [Google Scholar] [CrossRef]
- Wu, J.; Chen, X.; Lu, J. Assessment of long and short-term flood risk using the multi-criteria analysis model with the AHP-Entropy method in Poyang Lake basin. Int. J. Disaster Risk Reduct. 2022, 75, 102968. [Google Scholar] [CrossRef]
- Dos Santos, P.H.; Neves, S.M.; Sant’Anna, D.O.; De Oliveira, C.H.; Carvalho, H.D. The analytic hierarchy process supporting decision making for sustainable development: An overview of applications. J. Clean. Prod. 2019, 212, 119–138. [Google Scholar] [CrossRef]
- Chen, C.-H. A novel multi-criteria decision-making model for building material supplier selection based on entropy-AHP weighted TOPSIS. Entropy 2020, 22, 259. [Google Scholar] [CrossRef] [PubMed]
- Turčinović, M.; Vujko, A.; Stanišić, N. Community-led sustainable tourism in rural areas: Enhancing wine tourism destination competitiveness and local empowerment. Sustainability 2025, 17, 2878. [Google Scholar] [CrossRef]
- Wang, L.; Chen, L.; Li, C. Research on strategies for improving green product consumption sentiment from the perspective of big data. J. Retail. Consum. Serv. 2024, 79, 103802. [Google Scholar] [CrossRef]
- Guo, G.; Li, K.; Zhang, D.; Lei, M. Quantitative source apportionment and associated driving factor identification for soil potential toxicity elements via combining receptor models, SOM, and geo-detector method. Sci. Total Environ. 2022, 830, 154721. [Google Scholar] [CrossRef]
- Ding, F.; Zhang, W.; Cao, S.; Hao, S.; Chen, L.; Xie, X.; Li, W.; Jiang, M. Optimization of water quality index models using machine learning approaches. Water Res. 2023, 243, 120337. [Google Scholar] [CrossRef]
- Zhao, M.; Li, J.; Zhang, Y.; Han, Y.; Wei, J. Water cycle health assessment based on combined weight and hook trapezoid fuzzy TOPSIS model: A case study of nine provinces in the Yellow River basin, China. Ecol. Indic. 2023, 147, 109977. [Google Scholar] [CrossRef]
- Chen, Y.; Wang, D.; Zhang, L.; Guo, H.; Ma, J.; Gao, W. Flood risk assessment of Wuhan, China, using a multi-criteria analysis model with the improved AHP-Entropy method. Environ. Sci. Pollut. Res. 2023, 30, 96001–96018. [Google Scholar] [CrossRef]
- Yalcin, M.; Sari, F.; Yildiz, A. Exploration of potential geothermal fields using MAXENT and AHP: A case study of the Büyük Menderes Graben. Geothermics 2023, 114, 102792. [Google Scholar] [CrossRef]
- Li, Y.; Lu, C.; Liu, G.; Chen, Y.; Zhang, Y.; Wu, C.; Liu, B.; Shu, L. Risk assessment of wetland degradation in the Xiong’an New Area based on AHP-EWM-ICT method. Ecol. Indic. 2023, 153, 110443. [Google Scholar] [CrossRef]
- UNESCO World Heritage Centre. Operational Guidelines for the Implementation of the World Heritage Convention; UNESCO World Heritage Centre: Paris, France, 1999. [Google Scholar]
- Xu, X.; Li, C.; Dong, J.; Meng, C.; Hu, K. Improving kitchen environment comfort and health: A comprehensive evaluation method based on objective and subjective factors. Energy Build. 2023, 301, 113700. [Google Scholar] [CrossRef]
- Ding, F.; Hao, S.; Zhang, W.; Jiang, M.; Chen, L.; Yuan, H.; Wang, N.; Li, W.; Xie, X. Using multiple machine learning algorithms to optimize the water quality index model and their applicability. Ecol. Indic. 2025, 172, 113299. [Google Scholar] [CrossRef]
- OECD. Tourism Trends and Policies 2020; OECD Publishing Paris: Paris, France, 2020. [Google Scholar]
- Chen, W.; Yang, L.; Wu, J.; Wu, J.; Wang, G.; Bian, J.; Zeng, J.; Liu, Z. Spatio-temporal characteristics and influencing factors of traditional villages in the Yangtze River Basin: A Geodetector model. Herit. Sci. 2023, 11, 111. [Google Scholar] [CrossRef]
- Zhao, X.; Xue, P.; Wang, F.; Qin, Y.; Duan, X.; Yang, Z. How to become one? The modern bond of traditional villages in centralized contiguous protection and utilization areas in China. Habitat Int. 2024, 145, 103018. [Google Scholar] [CrossRef]
- Liu, W.; Xue, Y.; Shang, C. Spatial distribution analysis and driving factors of traditional villages in Henan province: A comprehensive approach via geospatial techniques and statistical models. Herit. Sci. 2023, 11, 185. [Google Scholar] [CrossRef]
- Deng, X.; Huang, M.; Peng, R. The impact of digital economy on rural revitalization: Evidence from Guangdong, China. Heliyon 2024, 10, e28216. [Google Scholar] [CrossRef]
- Li, X.; Yang, Q.; Lyu, X.; Ye, Y.; Zhang, B. Multidimensional framework for analyzing the distribution patterns of traditional villages in the karst landscape regions of China. Ecol. Inform. 2023, 77, 102184. [Google Scholar] [CrossRef]
- Feng, Y.; Wei, H.; Huang, Y.; Li, J.; Mu, Z.; Kong, D. Spatiotemporal evolution characteristics and influencing factors of traditional villages: The Yellow River Basin in Henan Province, China. Herit. Sci. 2023, 11, 97. [Google Scholar] [CrossRef]
- Shen, H.; Aziz, N.F.; Lv, X. Using 360-degree panoramic technology to explore the mechanisms underlying the influence of landscape features on visual landscape quality in traditional villages. Ecol. Inform. 2025, 86, 103036. [Google Scholar] [CrossRef]
- Gong, J.; Jian, Y.; Chen, W.; Liu, Y.; Hu, Y. Transitions in rural settlements and implications for rural revitalization in Guangdong Province. J. Rural Stud. 2022, 93, 359–366. [Google Scholar] [CrossRef]
- Jiang, X.; He, S.; Li, Z. A Study on the Water Management Knowledge of Traditional Villages from the Perspective of Stormwater Resilience—A Case Study of Changqi Ancient Village in Guangdong, China. Sustainability 2024, 16, 9807. [Google Scholar] [CrossRef]
- Zhao, Q.; Bao, H.X.; Yao, S. Unpacking the effects of rural homestead development rights reform on rural revitalization in China. J. Rural Stud. 2024, 108, 103265. [Google Scholar] [CrossRef]
- Zhang, D.X.; Zhang, X.Y.; Teng, L.; Ma, W.J.; Tan, L.G.; Li, H.H. Distribution Characteristics and Influencing Factors of Traditional Villages in the Lingnan Region of China. Buildings 2025, 15, 978. [Google Scholar] [CrossRef]
- Shen, J.; Chou, R.-J. Rural revitalization of Xiamei: The development experiences of integrating tea tourism with ancient village preservation. J. Rural Stud. 2022, 90, 42–52. [Google Scholar] [CrossRef]
- Zhong, Q.; Fu, H.; Yan, J.; Li, Z. How does energy utilization affect rural sustainability development in traditional villages? Re-examination from the coupling coordination degree of atmosphere-ecology-socioeconomics system. Build. Environ. 2024, 257, 111541. [Google Scholar] [CrossRef]
- Bano, R.; Khan, A.; Mehmood, T.; Abbas, S.; Khan, M.Z.; Shedayi, A.A.; Zaman, S.; Nawaz, M.A. Patterns of livestock depredation and Human–wildlife conflict in Misgar valley of Hunza, Pakistan. Sci. Rep. 2021, 11, 23516. [Google Scholar] [CrossRef] [PubMed]
- Zhang, Y.; Li, J.; Wang, J.; A, X. Spatial correlation between traditional villages and religious cultural heritage in the Hehuang region, Northwest China. J. Asian Archit. Build. Eng. 2025, 24, 3190–3202. [Google Scholar] [CrossRef]
- Coumans, J.V.; Wark, S. A scoping review on the barriers to and facilitators of health services utilisation related to refugee settlement in regional or rural areas of the host country. BMC Public Health 2024, 24, 199. [Google Scholar] [CrossRef]
- Degife, A.; Worku, H.; Gizaw, S.; Legesse, A. Land use land cover dynamics, its drivers and environmental implications in Lake Hawassa Watershed of Ethiopia. Remote Sens. Appl. Soc. Environ. 2019, 14, 178–190. [Google Scholar] [CrossRef]
- Garmaeepour, R.; Alambeigi, A.; Danehkar, A.; Shabani, A.A. Mangrove forest ecosystem services and the social well-being of local communities: Unboxing a dilemma. J. Nat. Conserv. 2025, 84, 126827. [Google Scholar] [CrossRef]
- Huang, Y.; Xue, Q. Spatio-Temporal distribution characteristics and driving factors of traditional villages in the Yellow River Basin. PLoS ONE 2024, 19, e0303396. [Google Scholar] [CrossRef]
- Xie, L.; Zhang, J.; Huang, W.Y.; Ke, D.D.; Li, L. Relationship between rural land titling and land transfer in China: A systematic literature review and meta-analysis. Front. Sustain. Food Syst. 2023, 7, 1143595. [Google Scholar] [CrossRef]
- Na, J.S.; Bajgai, J.; Sharma, S.; Dhakal, S.; Ahn, D.W.; Doh, Y.-A.; Kim, Y.; Lee, K.-J. Enhancing Health and Empowerment: Assessing the Satisfaction of Underprivileged Rural Women Participating in a Functional Literacy Education Program in Kailali District, Nepal. Healthcare 2024, 12, 1099. [Google Scholar] [CrossRef]
- Prakofjewa, J.; Sartori, M.; Šarka, P.; Kalle, R.; Pieroni, A.; Sõukand, R. Knowledge in motion: Temporal dynamics of wild food plant use in the Polish-Lithuanian-Belarusian border region. J. Ethnobiol. Ethnomedicine 2024, 20, 65. [Google Scholar] [CrossRef]
- Yang, L.; Shen, F.; Zhang, L.; Cai, Y.; Yi, F.; Zhou, C. Quantifying influences of natural and anthropogenic factors on vegetation changes using structural equation modeling: A case study in Jiangsu Province, China. J. Clean. Prod. 2021, 280, 124330. [Google Scholar] [CrossRef]



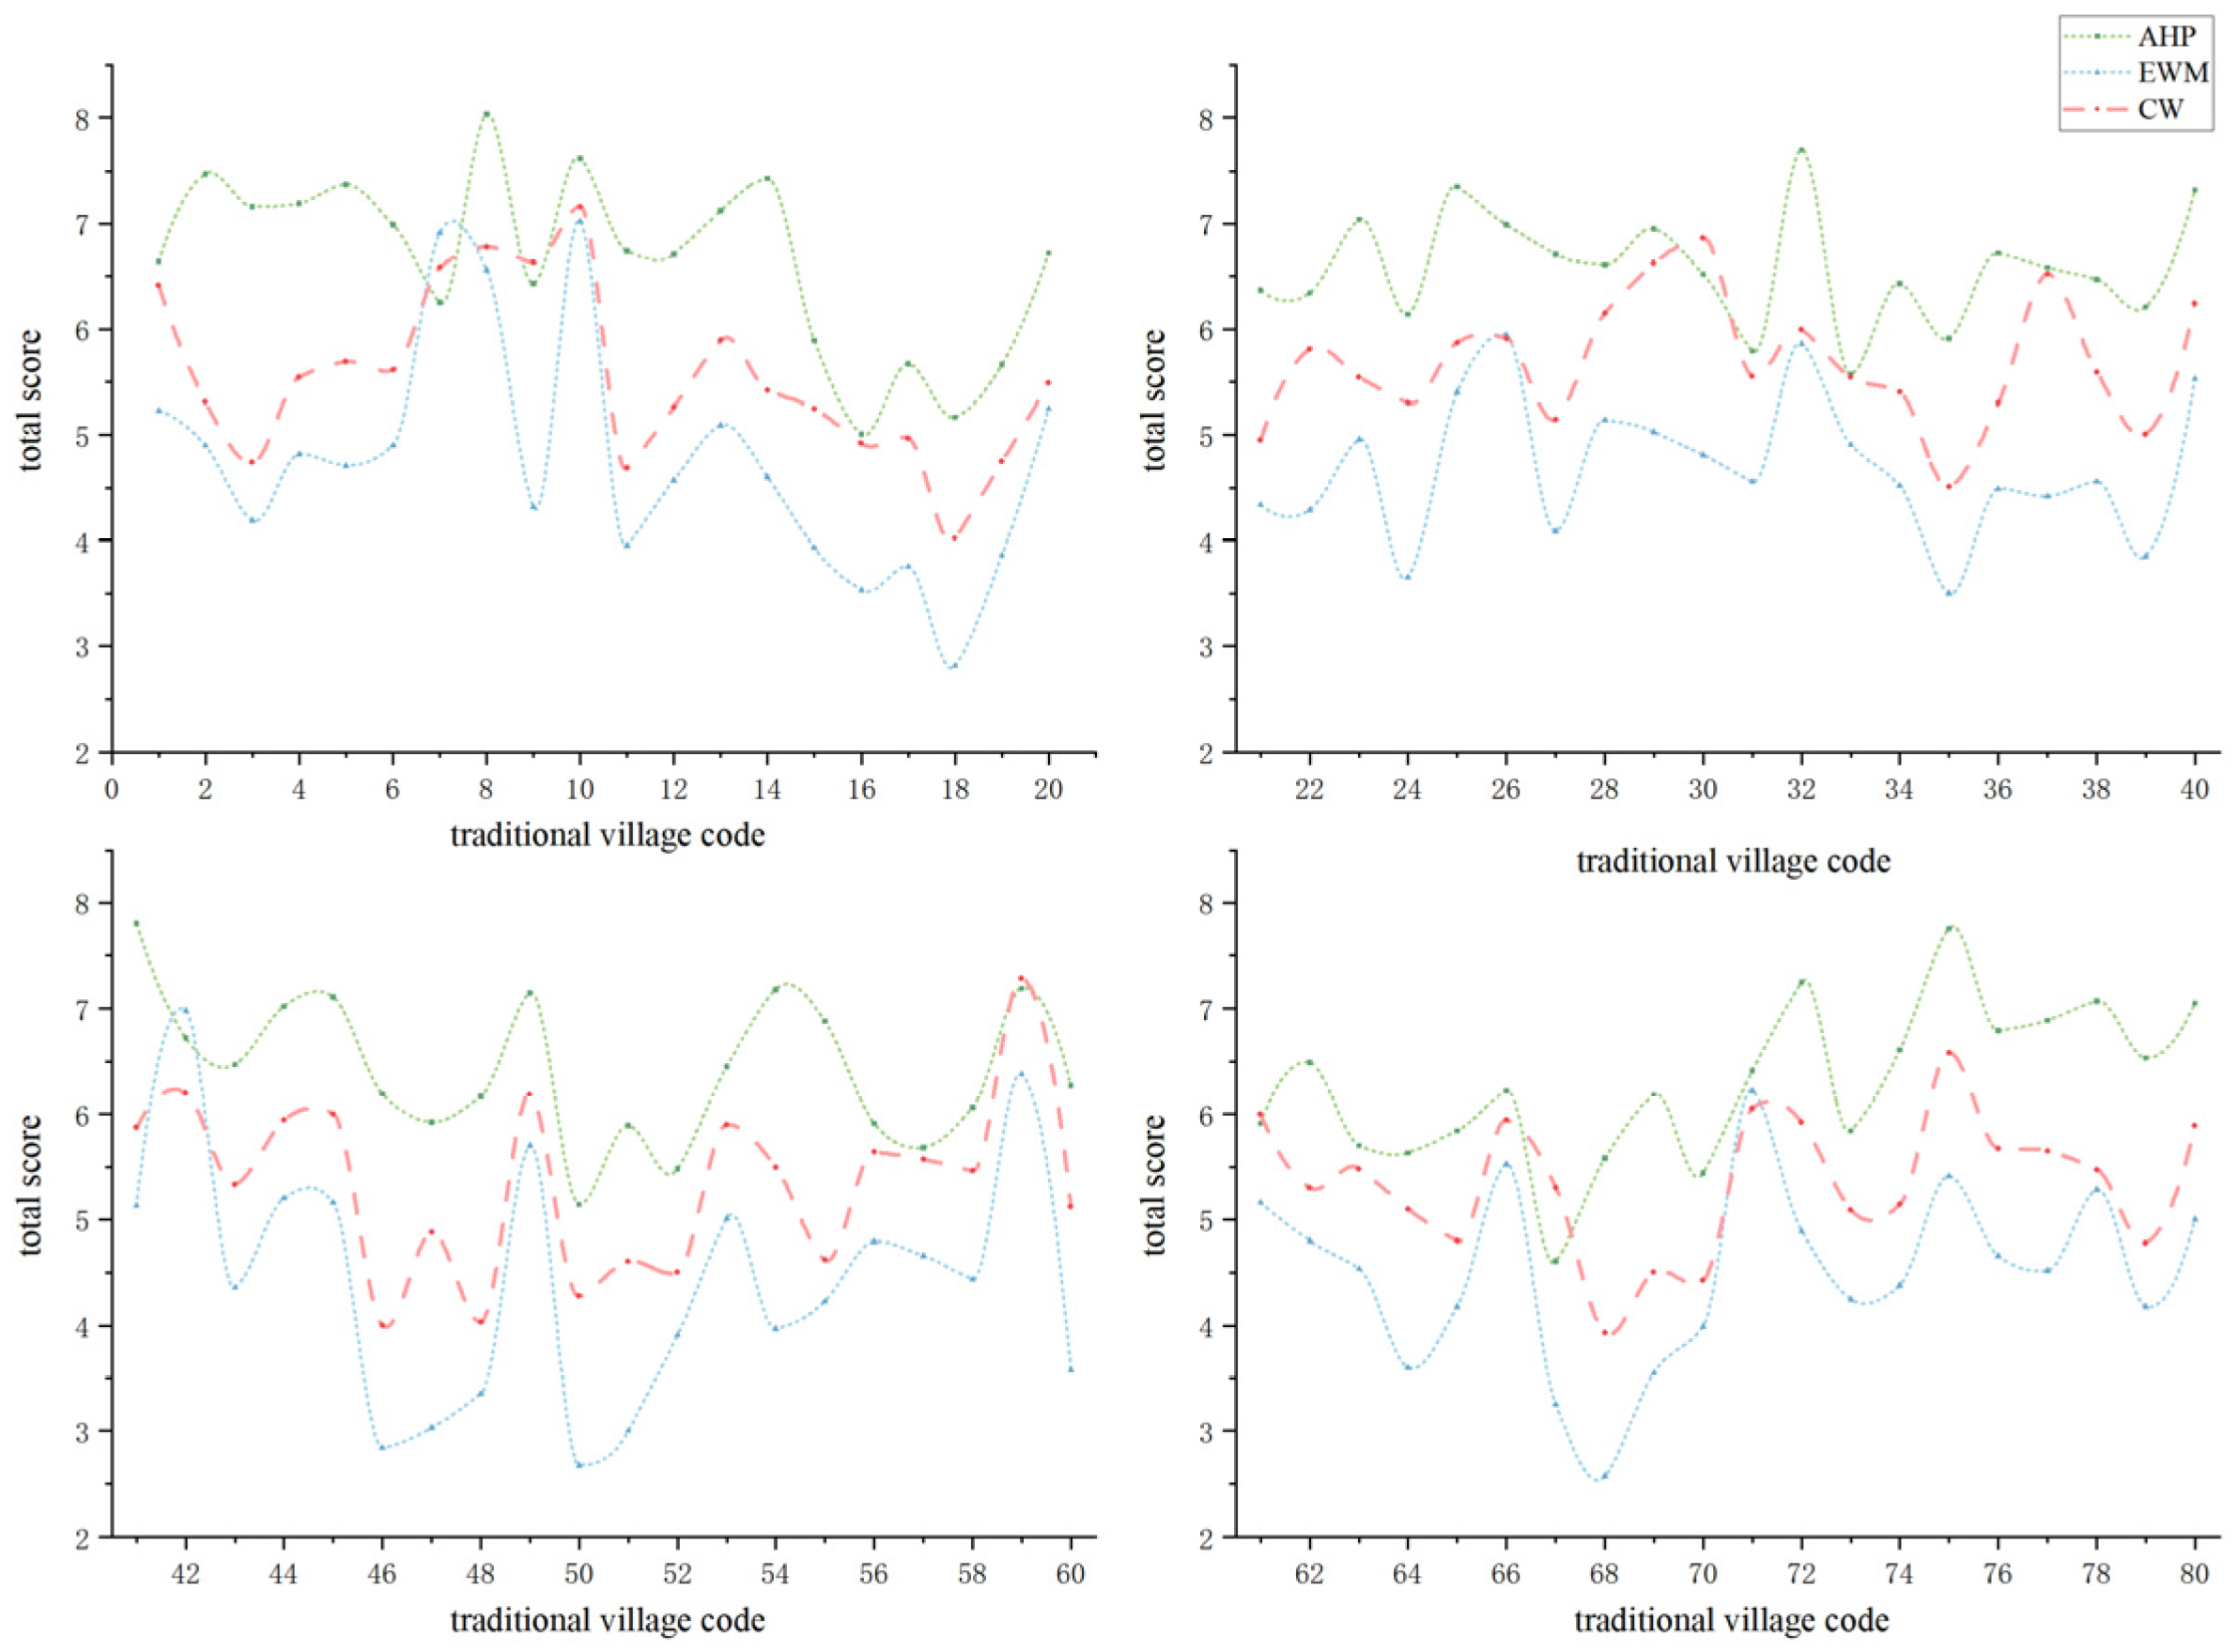

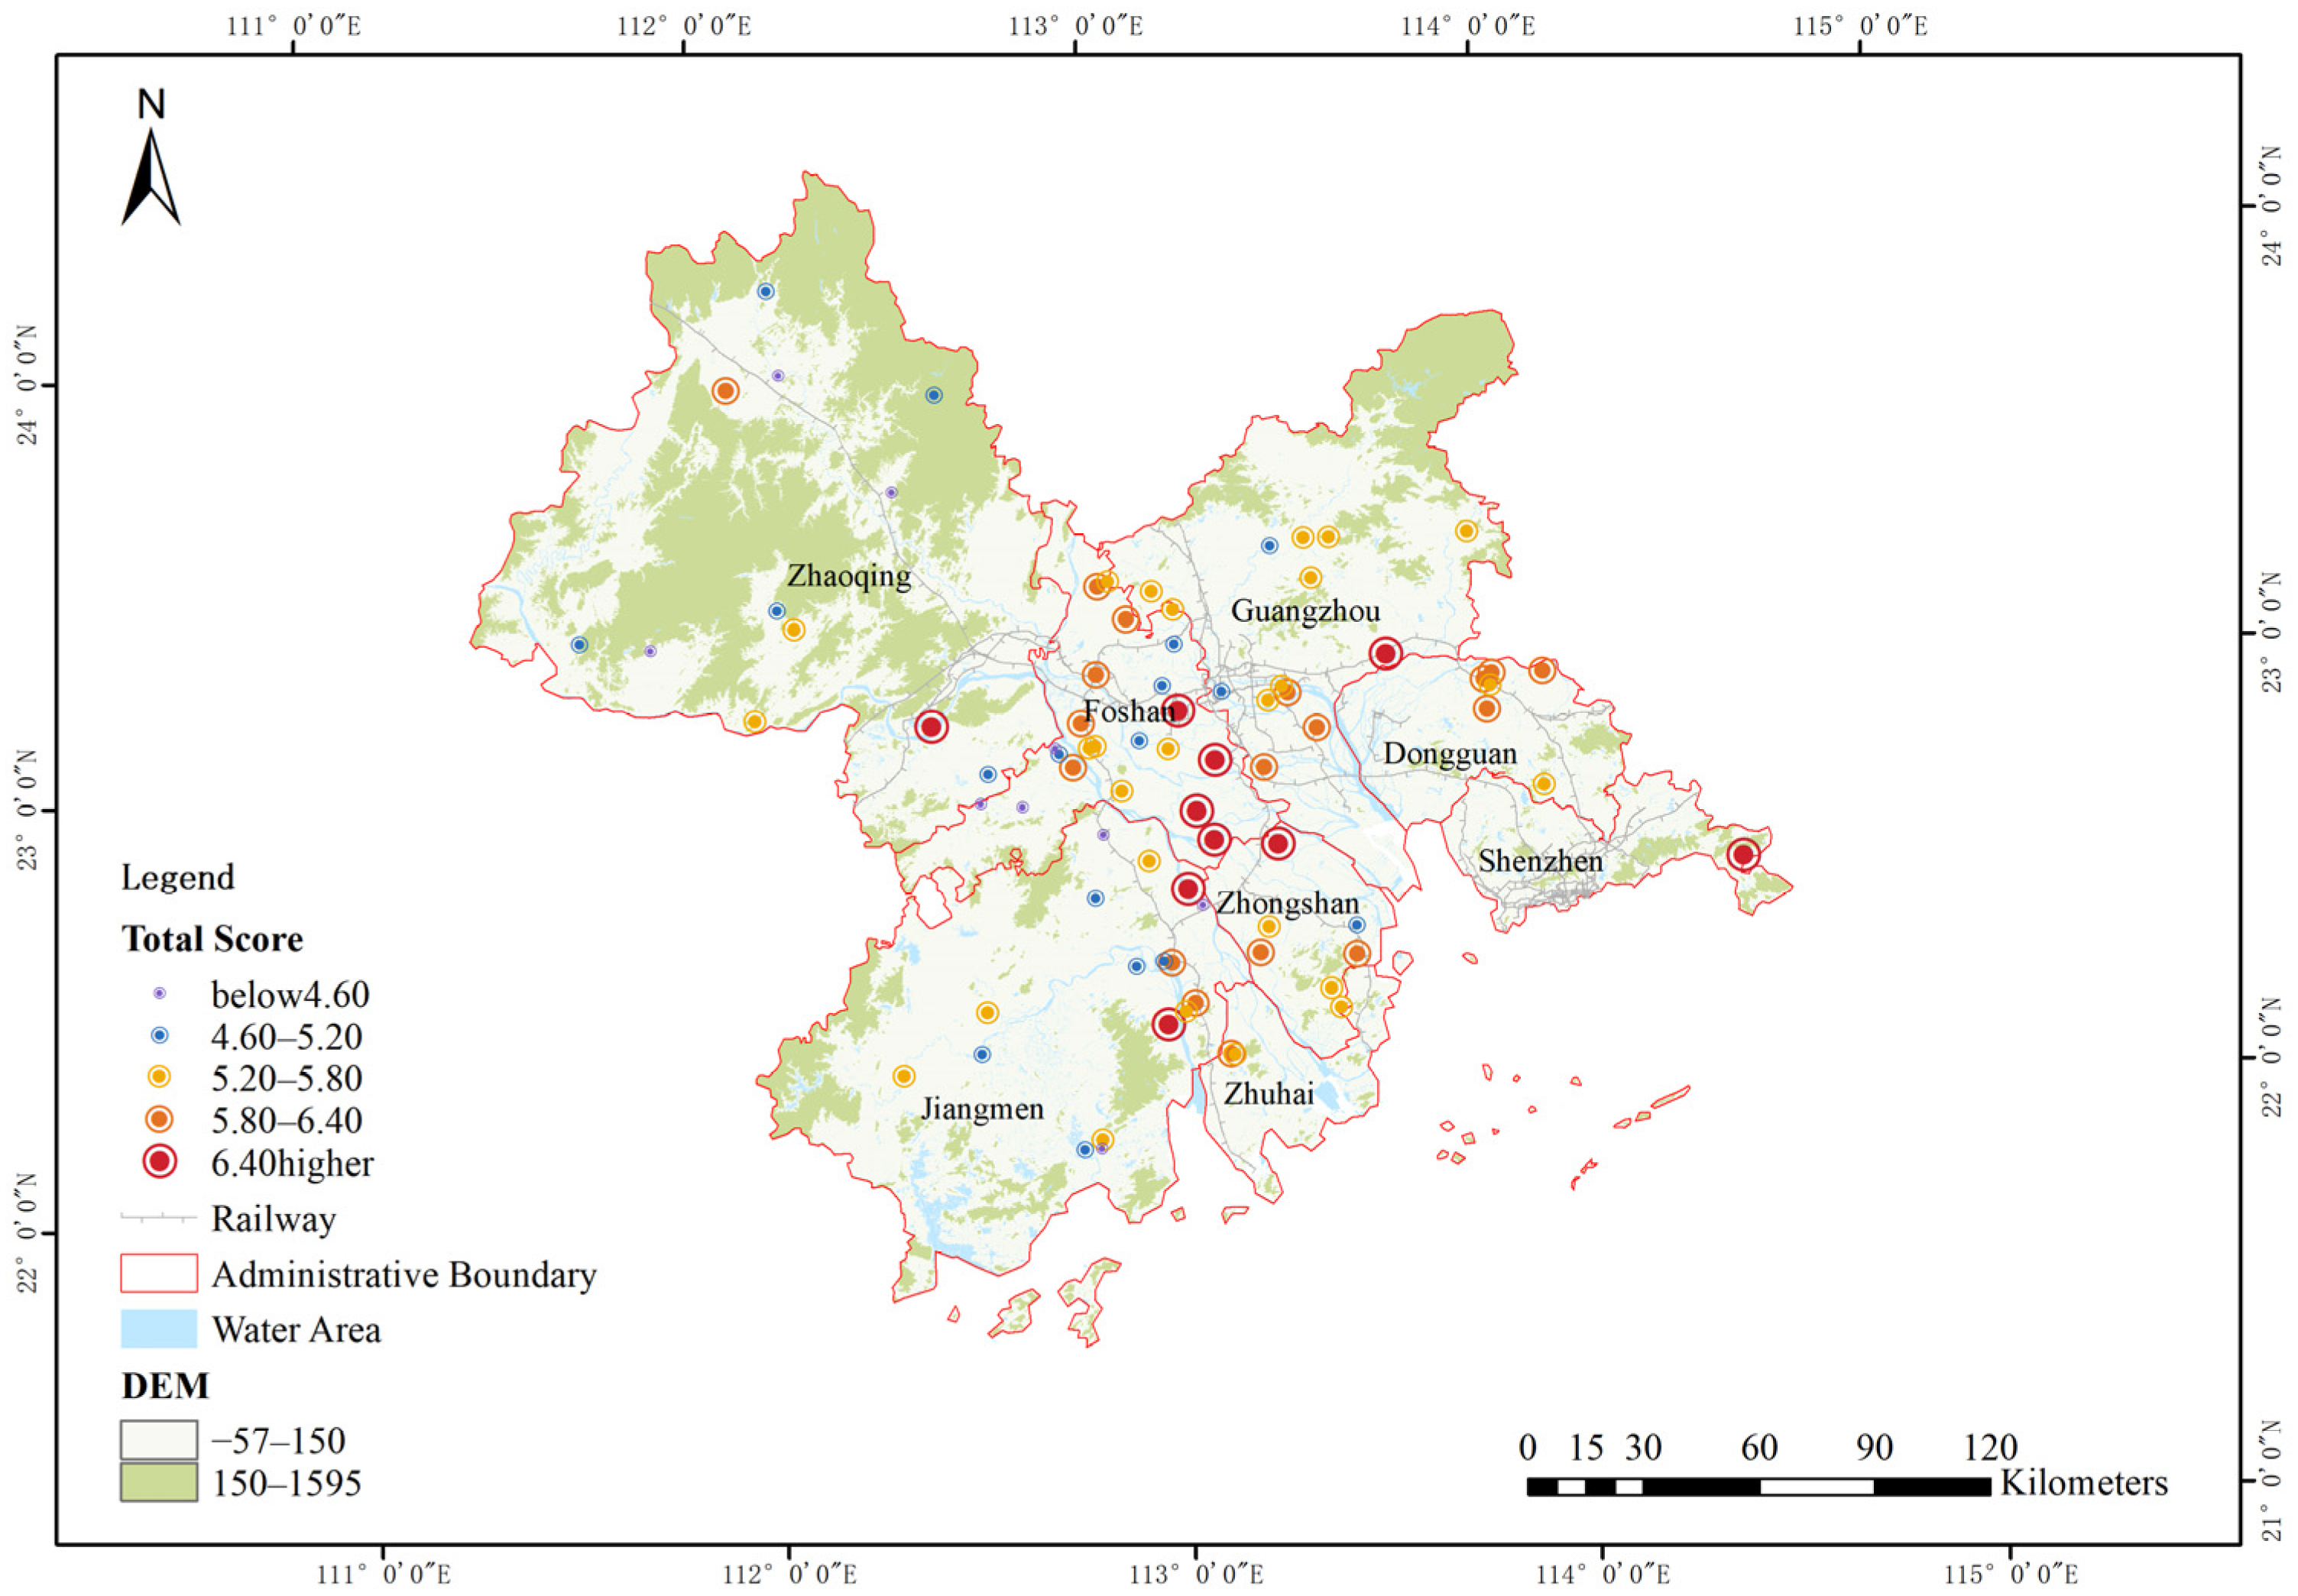


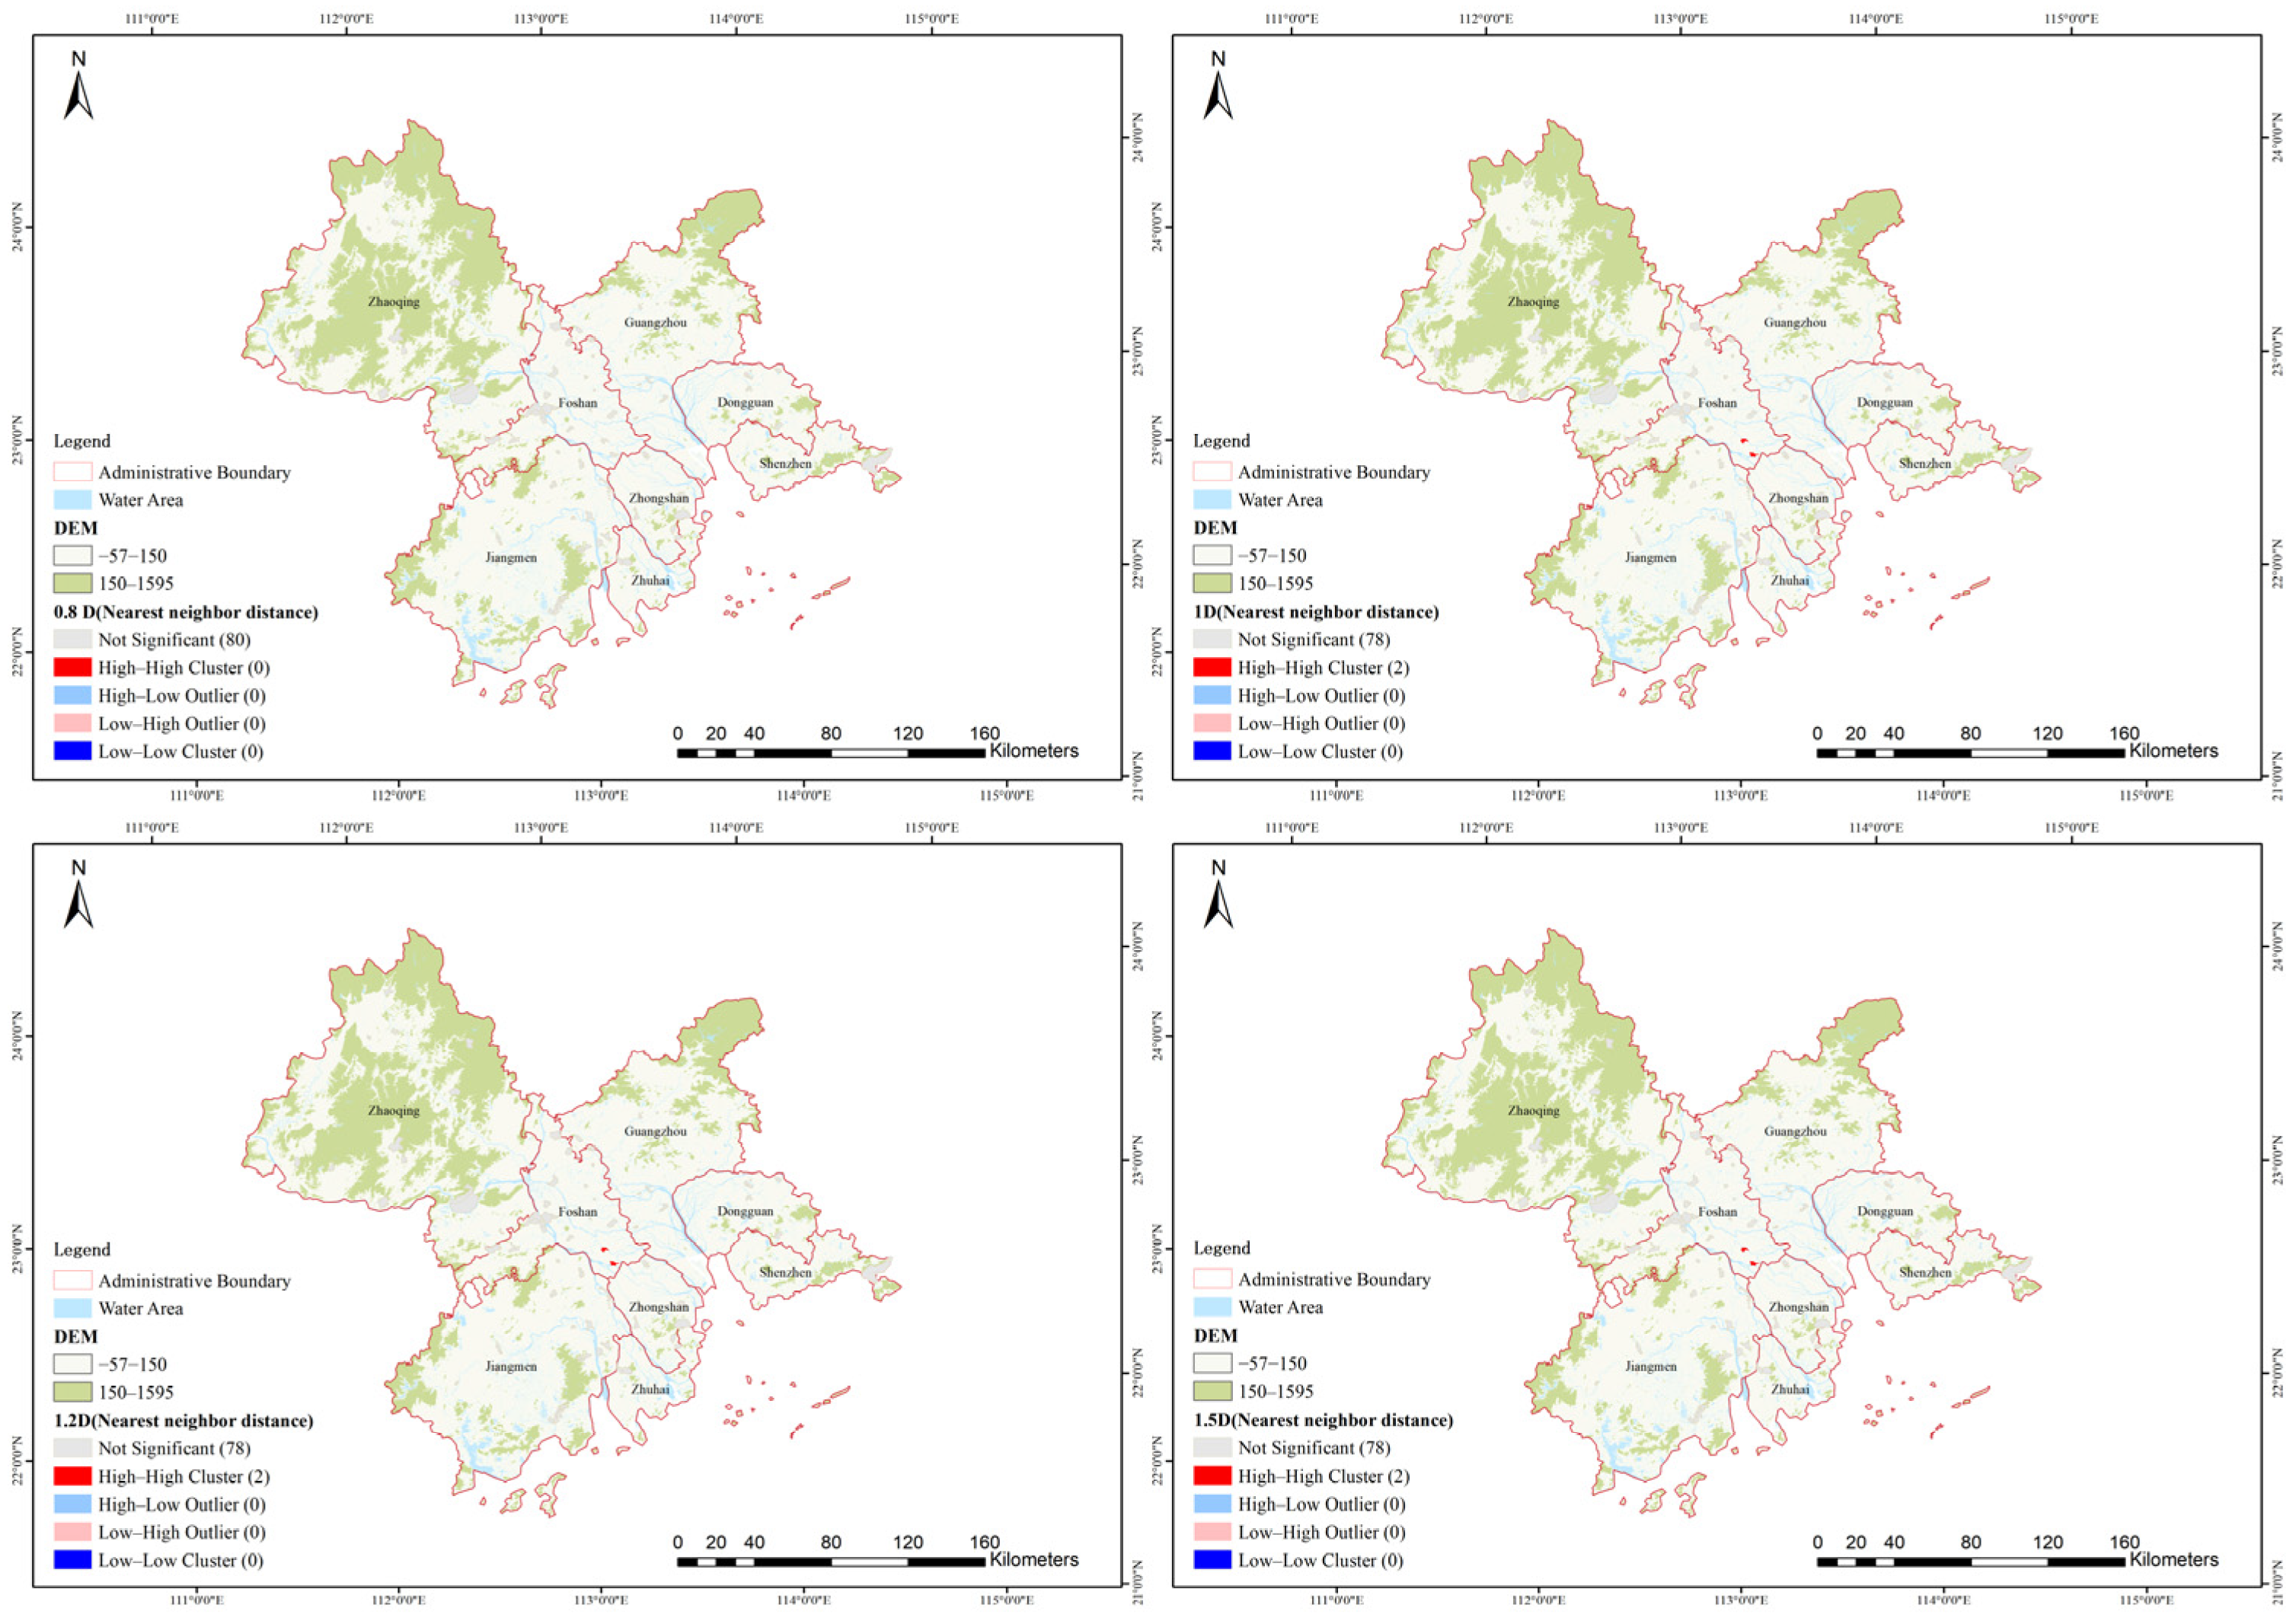

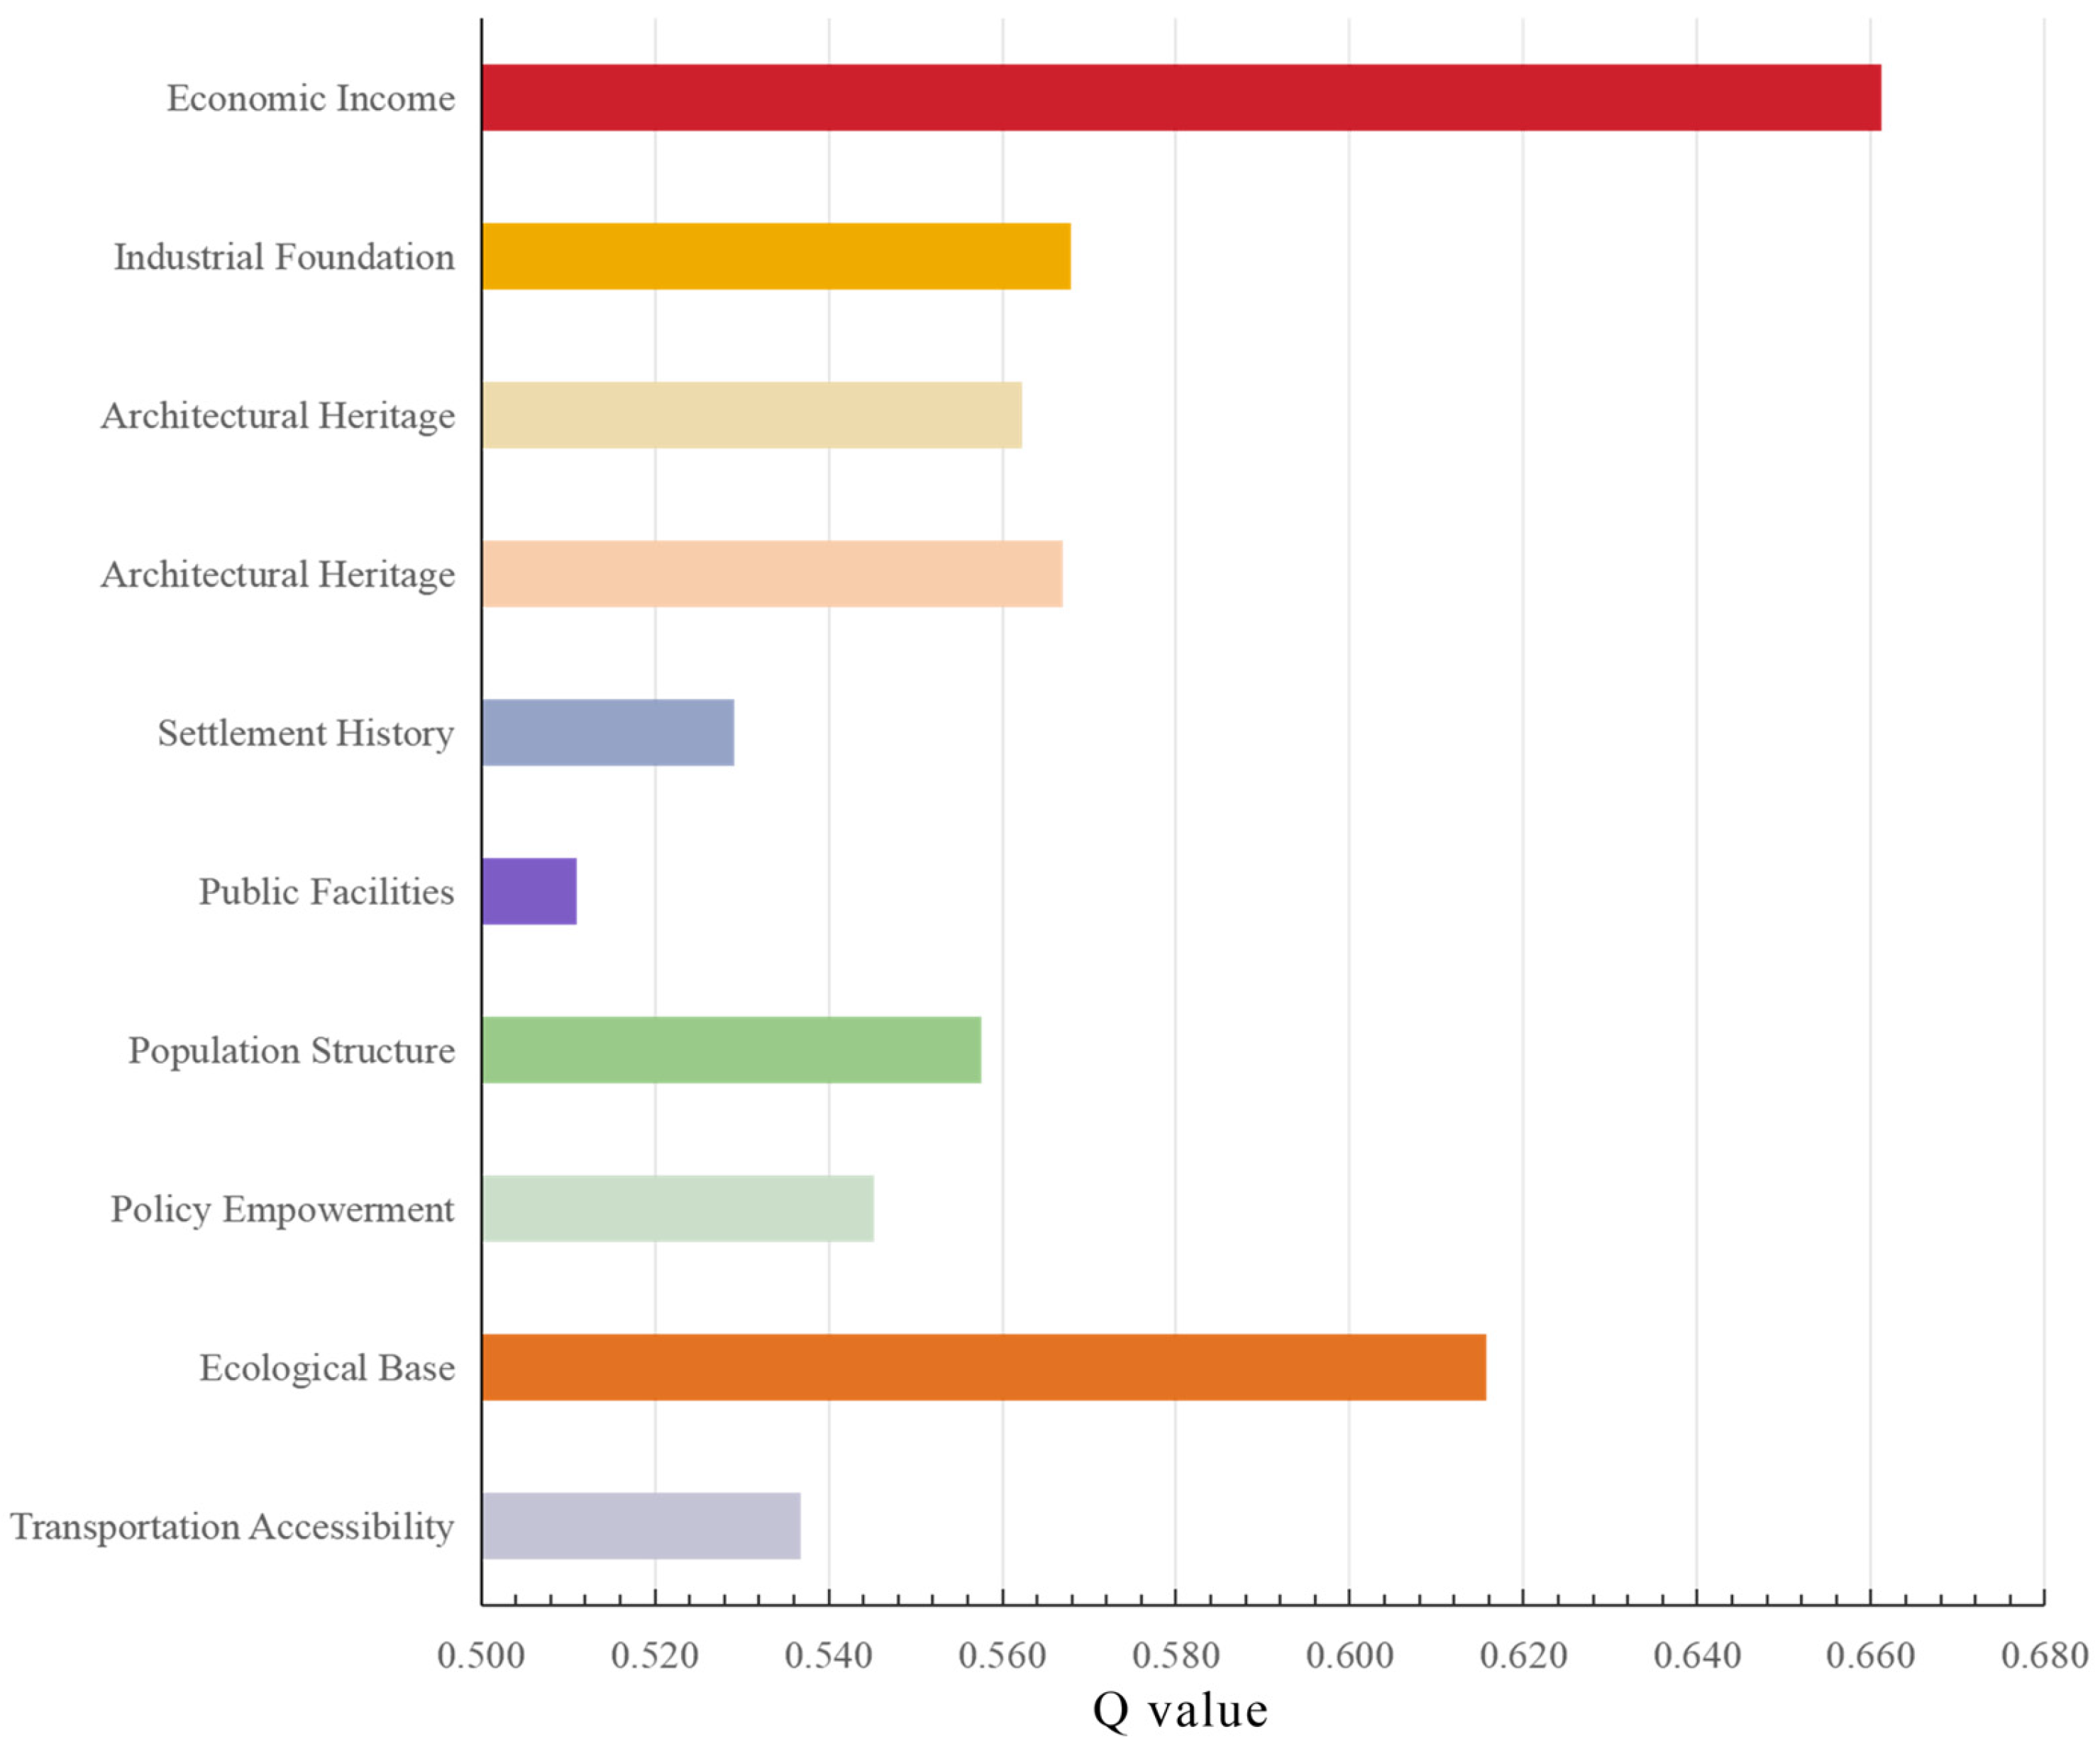
| Word | TF-IDF | Word | TF-IDF |
|---|---|---|---|
| distance | 0.040 | villager | 0.012 |
| facility | 0.027 | proportion | 0.012 |
| area | 0.022 | density | 0.012 |
| scale | 0.020 | town | 0.011 |
| travel | 0.020 | history | 0.011 |
| using land | 0.019 | environment | 0.011 |
| develop | 0.018 | population | 0.010 |
| resource | 0.016 | slope | 0.010 |
| coverage | 0.015 | Infrastructure | 0.010 |
| revenue | 0.015 | disposable | 0.010 |
| village | 0.014 | scenic area | 0.009 |
| Cultivated land area | 0.013 | Population density | 0.009 |
| building | 0.013 | scene | 0.009 |
| transportation | 0.012 | feature | 0.009 |
| Dimension | Theme | Metric | SDGs |
|---|---|---|---|
| A1 Geographical Environment | B1 Transportation Accessibility | C1 Distance to Administrative Center (−) | SDG 11 |
| C2 Distance to Transportation Node (−) | SDG 9 | ||
| C3 Distance to Scenic Area Linkage (−) | SDG 11 | ||
| C4 Number of External Routes (+) | SDG 9 | ||
| B2 Ecological Base | C5 Topographic Position Index (−) | SDG 15 | |
| C6 Ecological Sensitivity Level (−) | SDG 15 | ||
| C7 Water Coverage Rate (+) | SDG 6 | ||
| C8 Geohazard Risk (−) | SDG11 | ||
| A2 Socio-cultural Context | B3 Policy Empowerment | C9 Rural Honorary Titles (+) | SDG 1 |
| C10 Subsidy Amount (5-year) (+) | SDG 1 | ||
| B4 Population Structure | C11 Population Scale (+) | SDG 3 | |
| C12 Population Aging Rate (+) | SDG 3 | ||
| B5 Public Facilities | C13 Basic Education Facilities (+) | SDG 4 | |
| C14 Medical Coverage (+) | SDG 3 | ||
| C15 Cultural-Sports Facilities (+) | SDG 11 | ||
| A3 Historical Heritage | B6 Settlement History | C16 Settlement Antiquity (+) | SDG 11 |
| C17 Cultural Richness (+) | SDG 11 | ||
| C18 Settlement Pattern Integrity (+) | SDG 11 | ||
| C19 Natural Integration Degree (+) | SDG 11 | ||
| B7 Architectural Heritage | C20 Building Antiquity (+) | SDG 11 | |
| C21 Building Rarity (+) | SDG 11 | ||
| C22 Regional Architectural Features (+) | SDG 11 | ||
| B8 ICH Inheritance | C23 ICH Rarity (+) | SDG 11 | |
| C24 ICH Diversity (+) | SDG 11 | ||
| C25 ICH Continuity (+) | SDG 11 | ||
| C26 ICH Inheritors (+) | SDG 11 | ||
| A4 Industrial Economy | B9 Industrial Foundation | C27 Arable Land Resources (+) | SDG 2 |
| C28 Forest Resources (+) | SDG 15 | ||
| C29 Agricultural Modernization (+) | SDG 2 | ||
| C30 Industrial Diversification (+) | SDG 9 | ||
| B10 Economic Income | C31 Gross Industrial Output (+) | SDG 9 | |
| C32 Agricultural Output (+) | SDG 8 | ||
| C33 Disposable Income (+) | SDG 1 | ||
| C34 Per Capita GDP (+) | SDG 8 |
| Data Category | Data Content | Primary Source | Spatial/Temporal Resolution |
|---|---|---|---|
| Core Spatial Data | NDVI | NASA Earth Data (MODIS MOD13Q1 V6.1) | 250 m/16-day |
| Digital Elevation Model (DEM) | Geospatial Data Cloud (Source: SRTM) | 90 m/Static | SRTM DEMUTM Product |
| Auxiliary Spatial Data | Admin. Divisions, Rivers, Railways | RESDC, CAS | Vector/Static |
| Land Use | Geographic Monitoring Cloud Platform | Unspecified/Multi-Temporal | Used for background analysis |
| Research Object Data | Guangfu Village Information | List of Chinese Traditional Villages, Statistical Yearbooks, Academic Literature, Planning Docs, Fieldwork | Village-scale/Multi-Temporal |
| Metric | AHP | EWM | CW | Metric | AHP | EWM | CW |
|---|---|---|---|---|---|---|---|
| C1 | 0.058 | 0.008 | 0.037 | C18 | 0.059 | 0.002 | 0.040 |
| C2 | 0.082 | 0.011 | 0.051 | C19 | 0.030 | 0.001 | 0.020 |
| C3 | 0.108 | 0.011 | 0.069 | C20 | 0.020 | 0.012 | 0.012 |
| C4 | 0.051 | 0.010 | 0.031 | C21 | 0.015 | 0.100 | 0.062 |
| C5 | 0.014 | 0.064 | 0.038 | C22 | 0.017 | 0.002 | 0.011 |
| C6 | 0.018 | 0.008 | 0.010 | C23 | 0.037 | 0.051 | 0.032 |
| C7 | 0.013 | 0.102 | 0.064 | C24 | 0.011 | 0.073 | 0.046 |
| C8 | 0.037 | 0.001 | 0.026 | C25 | 0.026 | 0.031 | 0.020 |
| C9 | 0.040 | 0.041 | 0.028 | C26 | 0.012 | 0.186 | 0.123 |
| C10 | 0.041 | 0.079 | 0.046 | C27 | 0.050 | 0.018 | 0.029 |
| C11 | 0.013 | 0.020 | 0.012 | C28 | 0.021 | 0.033 | 0.020 |
| C12 | 0.003 | 0.011 | 0.007 | C29 | 0.060 | 0.008 | 0.038 |
| C13 | 0.014 | 0.016 | 0.011 | C30 | 0.032 | 0.013 | 0.019 |
| C14 | 0.008 | 0.007 | 0.005 | C31 | 0.007 | 0.015 | 0.009 |
| C15 | 0.003 | 0.032 | 0.021 | C32 | 0.006 | 0.010 | 0.006 |
| C16 | 0.036 | 0.005 | 0.022 | C33 | 0.017 | 0.005 | 0.010 |
| Mean | Std. Dev. | CW | EWM | AHP | |
|---|---|---|---|---|---|
| CW | 5.486 | 0.733 | 1 | ||
| EWM | 4.589 | 0.96 | 0.854 ** | 1 | |
| AHP | 6.493 | 0.708 | 0.560 ** | 0.654 ** | 1 |
| Critical Distance Parameter | Moran’s I Index | z-Score | p-Value | Significance (p < 0.05) | Spatial Pattern |
|---|---|---|---|---|---|
| 0.8D | 0.141 | 0.690 | 0.490 | Not Significant | Random |
| D | 0.149 | 0.935 | 0.350 | Not Significant | Random |
| 1.2D | 0.120 | 0.871 | 0.384 | Not Significant | Random |
| 1.5D | 0.128 | 1.063 | 0.288 | Not Significant | Random |
| Comparison Pair | Concordant Cases | Kappa (κ) | 95% CI | p-Value |
|---|---|---|---|---|
| AHP vs. EWM | 38 | 0.32 | [0.23, 0.41] | <0.001 |
| CW vs. AHP | 72 | 0.87 | [0.81, 0.93] | <0.001 |
| CW vs. EWM | 70 | 0.85 | [0.78, 0.92] | <0.001 |
| Study Case | Region | Methodology | Key Variables | Core Findings | Key Differences from Present Study |
|---|---|---|---|---|---|
| Zhao et al. (2023) [17] | Yellow River Economic Belt, China | Linear combination of AHP and Entropy Weight Method | Water cycle health indicators (e.g., water consumption efficiency, ecological water demand) | Economic indicators (GDP contribution weight ≈ 0.40) dominated weighting, leading to systematic underestimation of ecological resilience | Lacked quantification of subjectivity-objectivity consistency (harmonization rate metric absent) |
| Chen et al. (2023) [18] | Wuhan Metropolitan Area, China | Machine learning-optimized AHP (Random Forest integration) | Flood risk factors (e.g., land use, drainage density, social vulnerability) | Reduced subjective bias but failed to incorporate policy-aligned targets (e.g., social vulnerability weight = 0.08 vs. recommended ≥ 0.20) | Optimized subjectivity reduction without establishing subjectivity-objectivity dialogue mechanism (e.g., minimum information entropy principle) |
| Yalcin et al. (2023) [19] | Geothermal fields, Western Anatolia, Turkey | Integrated MaxEnt and AHP (70% weight to MaxEnt) | Geological feasibility (fault density, temperature gradient) and socioeconomic factors (community acceptance, market demand) | Objective model dominance suppressed community participation imperatives (assigned weight ≤ 0.15) | Mechanistic separation of subjectivity-objectivity without addressing dialectical “potential-status quo” interplay (e.g., weight = 0.041 for ecological sensitivity indicators) |
Disclaimer/Publisher’s Note: The statements, opinions and data contained in all publications are solely those of the individual author(s) and contributor(s) and not of MDPI and/or the editor(s). MDPI and/or the editor(s) disclaim responsibility for any injury to people or property resulting from any ideas, methods, instructions or products referred to in the content. |
© 2025 by the authors. Licensee MDPI, Basel, Switzerland. This article is an open access article distributed under the terms and conditions of the Creative Commons Attribution (CC BY) license (https://creativecommons.org/licenses/by/4.0/).
Share and Cite
Mo, W.; Xiao, S.; Li, Q. AHP–Entropy Method for Sustainable Development Potential Evaluation and Rural Revitalization: Evidence from 80 Traditional Villages in Cantonese Cultural Region, China. Sustainability 2025, 17, 9582. https://doi.org/10.3390/su17219582
Mo W, Xiao S, Li Q. AHP–Entropy Method for Sustainable Development Potential Evaluation and Rural Revitalization: Evidence from 80 Traditional Villages in Cantonese Cultural Region, China. Sustainability. 2025; 17(21):9582. https://doi.org/10.3390/su17219582
Chicago/Turabian StyleMo, Wei, Shiming Xiao, and Qi Li. 2025. "AHP–Entropy Method for Sustainable Development Potential Evaluation and Rural Revitalization: Evidence from 80 Traditional Villages in Cantonese Cultural Region, China" Sustainability 17, no. 21: 9582. https://doi.org/10.3390/su17219582
APA StyleMo, W., Xiao, S., & Li, Q. (2025). AHP–Entropy Method for Sustainable Development Potential Evaluation and Rural Revitalization: Evidence from 80 Traditional Villages in Cantonese Cultural Region, China. Sustainability, 17(21), 9582. https://doi.org/10.3390/su17219582


