Article

Evidence of Agroecological Performance in Production Systems Integrating Agroecology and Bioeconomy Actions Using TAPE in the Colombian Andean–Amazon Transition Zone

by
Yerson D. Suárez-Córdoba
1,2,3,
Jaime A. Barrera-García
2,
Armando Sterling
3,*,
Carlos H. Rodríguez-León
3 and
Pablo A. Tittonell
4,5
1
Programa de Maestría en Sistemas Sostenibles de Producción, Facultad de Ciencias Agropecuarias, Universidad de la Amazonía, Florencia 180001, Colombia
2
Programa Sostenibilidad e Intervención, Instituto Amazónico de Investigaciones Científicas SINCHI, Bogotá 111711, Colombia
3
Programa Modelos de Funcionamiento y Sostenibilidad, Instituto Amazónico de Investigaciones Científicas SINCHI, Florencia 180001, Colombia
4
Centre de Coopération Internationale en Recherche Agronomique pour le Développement (CIRAD), UPR AIDA, F-34398 Montpellier, France
5
Groningen Institute of Evolutionary Life Sciences (GELIFES), University of Groningen, Nijenborgh 7, 9747 AG Groningen, The Netherlands
*
Author to whom correspondence should be addressed.
Sustainability 2025, 17(20), 9024; https://doi.org/10.3390/su17209024 (registering DOI)
Submission received: 27 August 2025 / Revised: 25 September 2025 / Accepted: 2 October 2025 / Published: 12 October 2025

Abstract

The expansion of conventional agricultural models in the Colombian Amazon has caused deforestation, biodiversity loss, and socio-environmental degradation. In response, agroecology and bioeconomy are emerging as key strategies to regenerate landscapes and foster sustainable production systems. We evaluated the agroecological performance of 25 farms in the Andean–Amazon transition zone of Colombia using FAO’s Tool for Agroecology Performance Evaluation (TAPE). The analysis included land cover dynamics (2002–2024), characterization of the agroecological transition based on the 10 Elements of Agroecology, and 23 economic, environmental, and social indicators. Four farm typologies were identified; among them, Mixed Family Farms (MFF) achieved the highest transition score (CAET = 60.5%) and excelled in crop diversity (64%), soil health (SHI = 4.24), productive autonomy (VA/GVP = 0.69), and household empowerment (FMEF= 85%). Correlation analyses showed strong links between agroecological practices, economic efficiency, and social cohesion. Land cover dynamics revealed a continuous decline in forest cover (12.9% in 2002 to 7.1% in 2024) and an increase in secondary vegetation, underscoring the urgent need for restorative approaches. Overall, farms further along the agroecological transition were more productive, autonomous, and socially cohesive, strengthening territorial resilience. The application of TAPE proved robust multidimensional evidence to support agroecological monitoring and decision-making, with direct implications for land use planning, rural development strategies, and sustainability policies in the Amazon. At the same time, its sensitivity to high baseline biodiversity and to the complex socio-ecological dynamics of the Colombian Amazon underscores the need to refine the methodology in future applications. By addressing these challenges, the study contributes to the broader international debate on agroecological transitions, offering insights relevant for other tropical frontiers and biodiversity-rich regions facing similar pressures.

1. Introduction

Agriculture is a fundamental economic and social pillar in Colombia, contributing 6% to the national GDP in 2020, employing 62% of the rural labor force, and accounting for 16.4% of the country’s total workforce [1]. Since the Green Revolution, however, the spread of input-intensive models based on external inputs, agrochemicals, and technological packages has generated technological dependency and multiple negative impacts, such as soil degradation, biodiversity loss, weakening of the social fabric, and land use conflicts [2,3]. Across Latin America, these dynamics have fostered monocultures and excessive agrochemical use, reducing soil fertility, raising production costs, and exacerbating the ecological and economic vulnerability [4,5,6].
The Colombian Amazon has been among the regions most affected by agricultural frontier expansion. Since the early 20th century, and particularly between 1985 and 2005, colonization driven by violence, displacement, and the search for productive land transformed vast areas of natural forest [7,8]. By 2022, more than 3.6 million hectares had been deforested, mainly due to pasture expansion, illicit crops, and human settlement [9,10,11]. These processes have created unsustainable landscapes characterized by biodiversity loss, ecosystem service degradation, and rising socio-environmental pressure [12]. In this context, several studies stress the need for sustainable agricultural practices that foster diversification, conservation, and restoration of degraded areas [13,14,15].
Agroecology has emerged as a holistic approach that combines science, practice, and social movements to transform agri-food systems through ecological, social, and cultural principles [6,16,17]. Unlike conventional intensification based on monocultures and external inputs, it promotes ecological intensification by designing multifunctional agroecosystems that rely on natural processes to enhance efficiency, resilience, and sustainability across scales [18]. Beyond productivity, agroecology emphasizing farmers’ knowledge, functional biodiversity, and social participation as drivers of systemic change Its benefits have been widely documented, including positive effects on biodiversity and ecosystem services [19,20,21], climate change mitigation and adaptation [22,23,24], soil health [25,26,27,28], rural household income [29,30,31], and food security, nutrition, and human health [32,33,34,35,36]. At the global scale, recent reviews underline that agroecology constitutes a transformative pathway toward more resilient, equitable, and sustainable food systems [37,38].
Despite its recognition in scientific and policy frameworks, agroecology still faces challenges in generating systematic and comparable evidence of performance due to the diversity of methods, scales, and contexts [30,39,40]. To address this, the Food and Agriculture Organization of the United Nations (FAO) developed the Tool for Agroecology Performance Evaluation (TAPE), grounded in the 10 Elements of Agroecology [5,41]. TAPE enables the characterization of agri-food systems, the identification of strengths and weaknesses, and the monitoring of transitions across scales. It has proven useful for farmers, governments, scientific institutions, and extension services [39,42] and has been applied in diverse contexts worldwide [3,30,43,44,45,46].
The Colombian Amazon, a region of high strategic and environmental importance, still lacks systematic assessments of the multidimensional performance of agroecology, which are essential to identify existing gaps and opportunities for advancing transitions. The socio-environmental complexity of these territories makes it difficult to establish reliable baselines for monitoring, reinforcing the need to understand challenges, risks, and pathways toward sustainable agriculture. This study addresses this gap by evaluating the agroecological performance of 25 farms that have adopted agroecological and bioeconomy-related actions in the Andean–Amazon transition zone of Colombia, providing a baseline characterization of their transition processes. In addition, it examines the usefulness of TAPE for characterizing and monitoring agroecological transitions and for generating scientific evidence on their multidimensional sustainability impacts in such complex systems.

2. Materials and Methods

2.1. Study Site

This research was conducted in the western Colombian Amazon, within the Andean–Amazon transition region of the Caquetá department (Supplementary Figure S1), covering the municipalities of La Montañita, Belén de los Andaquíes, Albania, and San José del Fragua. Together, these municipalities encompass approximately 4613 km2. The area is characterized by a remarkable diversity of geomorphological landscapes, including mountainous zones, piedmonts, rolling hills, and alluvial valleys [47]. The predominant soils are Inceptisols and Oxisols, according to the USDA classification, with fine textures, poor drainage, high acidity (pH between 4.5 and 5.8), high aluminum saturation, low base saturation, and limited levels of carbon, phosphorus, potassium, and magnesium, which constrain their fertility and aeration capacity [47]. The region has a humid tropical climate, with an average annual temperature of 25 °C and a mean annual rainfall of 3235 mm, mostly concentrated between March and June during the rainy season [48]. Overall, the landscapes are characterized by the predominance of pastures and secondary forests in larger units, while smaller farms rely on diversified cropping, poultry, pig farming, aquaculture, and forest species, reflecting the coexistence of conventional ranching systems with diversified family-based strategies oriented toward agroecological transitions (Supplementary Table S2).

2.2. Sampling and Data Processing Strategy

A total of 25 mixed crop-livestock farms were selected through convenience sam-pling [49], using criteria adapted from El Mujtar et al. [44]: (i) family farms linked to value chains with strategic potential, such as cacao (Theobroma cacao L.), copoazu (Theobroma grandiflorum [Willd. ex-Spreng.] Schum.), moriche palm (Mauritia flexuosa L.f.), and dairy cattle farming; (ii) farms receiving active support from national and international organizations; (iii) farms that have incorporated actions related to agroecology and/or bioeconomy (i.e., innovative land uses such as improved pastures, integration of cacao and copoazu agroforestry systems, secondary forest enrichment, and productive restoration, together with agroecological practices such as rotational grazing, organic fertilization with biofertilizers and vermicompost, forage banks, live barriers, meliponiculture, and live-stock exclusion in wetlands); (iv) farmers’ confirmed willingness to participate in multi-hour interviews over at least three sessions; and (v) active engagement in research processes and commitment to transitioning toward agroecological systems. All selected farms met these criteria, but they represented different stages of transition, ranging from less advanced adopters to farms with more consolidated agroecological practices. It should be noted that the use of convenience sampling may introduce selection bias and limit the generalization of findings; however, the application of explicit criteria and the inclusion of farms across diverse value chains and transition stages helped to mitigate this limitation. Data were collected with FAO’s TAPE protocol [39,42] between October and December 2023 through secondary-source review, structured surveys, and field observation, including the optional Step 1bis (typologies).

2.2.1. Step 0. Description of the Context of Socio-Productive Systems

Step 0 of TAPE [39,42] provided the territorial and farm context (socioeconomic, environmental, demographic). Information came from secondary sources and adapted farm-level questionnaires (Supplementary Questionnaires S1 and S3), which capture household composition, management practices, production use and destination, land access and tenure, input and resource management, diversification, soil conditions, pesticide exposure, and social dimensions (empowerment, youth, food security) [39,44].
The analysis of territorial land use dynamics was based on spatial secondary data obtained from the Environmental and Territorial Information System of the Colombian Amazon (SIAT-AC), maintained by the Amazonian Institute for Scientific Research—SINCHI (https://siatac.co/) (accessed on 21 May 2025). Land use and land cover datasets at a 1:100,000 scale were downloaded for the years 2002, 2007, 2012, 2016, 2020, and 2024 from the repository https://siatac.co/coberturas-100k/ (accessed on 21 May 2025) [50]. These layers were spatially clipped using a study area buffer of 2 km around the 25 evaluated farms. A multitemporal analysis was then performed using ten grouped land cover classes (Wetlands, old-growth forests, Crops, Forest plantations, Fragmented areas, Pastures, Water bodies, Artificial areas, Degraded lands, and Secondary forests), following the classification scheme established by IDEAM [51].
Farms were defined as mixed crop-livestock production units sharing structural and operational characteristics, reflecting common dynamics in their interaction with the environment and resource management. Accordingly, the analysis of the socio-productive context was conducted through farm typologies (Step 1bis of TAPE), based on criteria relevant for agroecological assessment [39]. The construction of typologies followed the methodological approach proposed in previous studies on the characterization of farming systems [52,53,54], aiming to identify distinct structural patterns based on the interaction of key indicators. These indicators included land cover composition, gross production value (GPV), input use, and labor structure (Supplementary Table S1).

2.2.2. Step 1. Characterization of the Degree of Agroecological Transition

The Characterization of Agroecological Transition (CAET), corresponding to Step 1 of TAPE, was used to assess the degree of agroecological transition on farms, identifying both their strengths and weaknesses [30]. This tool is based on the 10 Elements of Agroecology [5,41], which are disaggregated into 37 indices (Table 1). These indices are evaluated using a descriptive Likert scale with scores ranging from 0 to 4. The scores are then summed and normalized into a percentage scale from 0 to 100%, resulting in a consolidated value for each element [39,42]. According to the approach proposed by Tittonell et al. [55], these elements can be grouped into two dimensions: those primarily operating at the farm level (CAETfarm) and those acting predominantly at the community level (CAETcommunity), allowing for a more nuanced interpretation of agroecological transitions across productive and social domains. Scales were context-adapted prior to fieldwork [46]; specific adaptations and index definitions are provided in the Supplementary Material (Supplementary Questionnaire S2). The questionnaire was applied jointly with the system and territorial characterization.

2.2.3. Step 2. Determination of Core Performance Indicators

The identification of performance indicators (Step 2 of TAPE) is directly linked to the dimensions of the Sustainable Development Goals (SDGs), aiming to assess the overall performance of agricultural systems [39,42]. Following the approach proposed by Lucantoni et al. [30], these dimensions were grouped into three main categories: economic, environmental, and social (Table 2). Data were collected using adapted questionnaires (Supplementary Questionnaires S1 and S3), in accordance with the methodological guidelines reported by Mottet et al. [39] and El Mujtar et al. [44].

2.3. Data Analysis

The multitemporal spatial analysis was conducted using RStudio v. 2025.05.04 [61] and the R language v. 4.4.3 [62]. Vector data processing (including reprojection, clipping, and intersection calculations) was performed using the sf package v. 1.0-21, which specializes in handling spatial objects based on the simple features format [63]. From the clipped layers, multitemporal change matrices were generated and visualized using Sankey diagrams built with the ggsankeyfier package v. 0.1.8 [64]. This tool allows the representation of flows and transitions between land cover classes over time, with the width of the links proportional to the magnitude of change, thus facilitating a clear visual interpretation of spatial dynamics [65,66].
The construction of farm typologies was carried out through hierarchical cluster analysis using Ward’s method and squared Euclidean distance as the dissimilarity measure. This approach enabled the grouping of farms with similar structural and functional characteristics into well-defined and balanced clusters [67]. The analysis was performed using InfoStat software v. 2020 [68], based on a matrix of selected variables from the farm-level questionnaire, including land cover composition, gross production value (GPV), input use, and labor structure (Supplementary Table S1). Results were visualized through a dendrogram, which allowed the identification of contrasting farm groups and provided key insights for the comparative analysis of agroecological performance.
To characterize the agroecological transition and performance of the farms (Steps 1 and 2 of TAPE), a descriptive analysis was conducted based on the established typologies. Subsequently, a cross-analysis of results from both steps was carried out by calculating Spearman correlation coefficients among the different evaluated variables. This aimed to explore how the degree of agroecological transition relates to various dimensions of sustainability. Statistical significance of the correlations was evaluated using associated p-values, with results interpreted as follows: highly significant correlation (***, p ≤ 0.001), very significant (**, p ≤ 0.01), significant (*, p ≤ 0.05), and not significant (no symbol, p > 0.05) [30]. All statistical analyses were performed using InfoStat software v. 2020 [68] and RStudio v. 2025.05.04 [61].

3. Results

3.1. Description of the Context of the Socio-Productive Systems

Over the analysis period (2002–2024), pastures (Pa) consistently dominated the landscape, accounting for over 70% of the total area in all years. In contrast, forest cover (OF) showed a continuous decline, decreasing from 12.9% in 2002 to just 7.1% in 2024. A notable trend was the progressive increase in secondary forests (SF), especially after 2016, when their share doubled, reaching 14.4% in 2020. Fragmented areas (FA) maintained a relatively stable presence, fluctuating between 4% and 7%, indicating landscapes characterized by scattered residual vegetation. Other land cover types, such as crops (Cr), forest plantations (FP), and artificial areas (AA), appeared in low proportions, suggesting localized and specific land uses. In contrast, water bodies (WB) and wetlands (We) remained stable over time, suggesting that these zones (possibly protected by topographic constraints or regulatory measures) have largely avoided intense transformation (Figure 1).
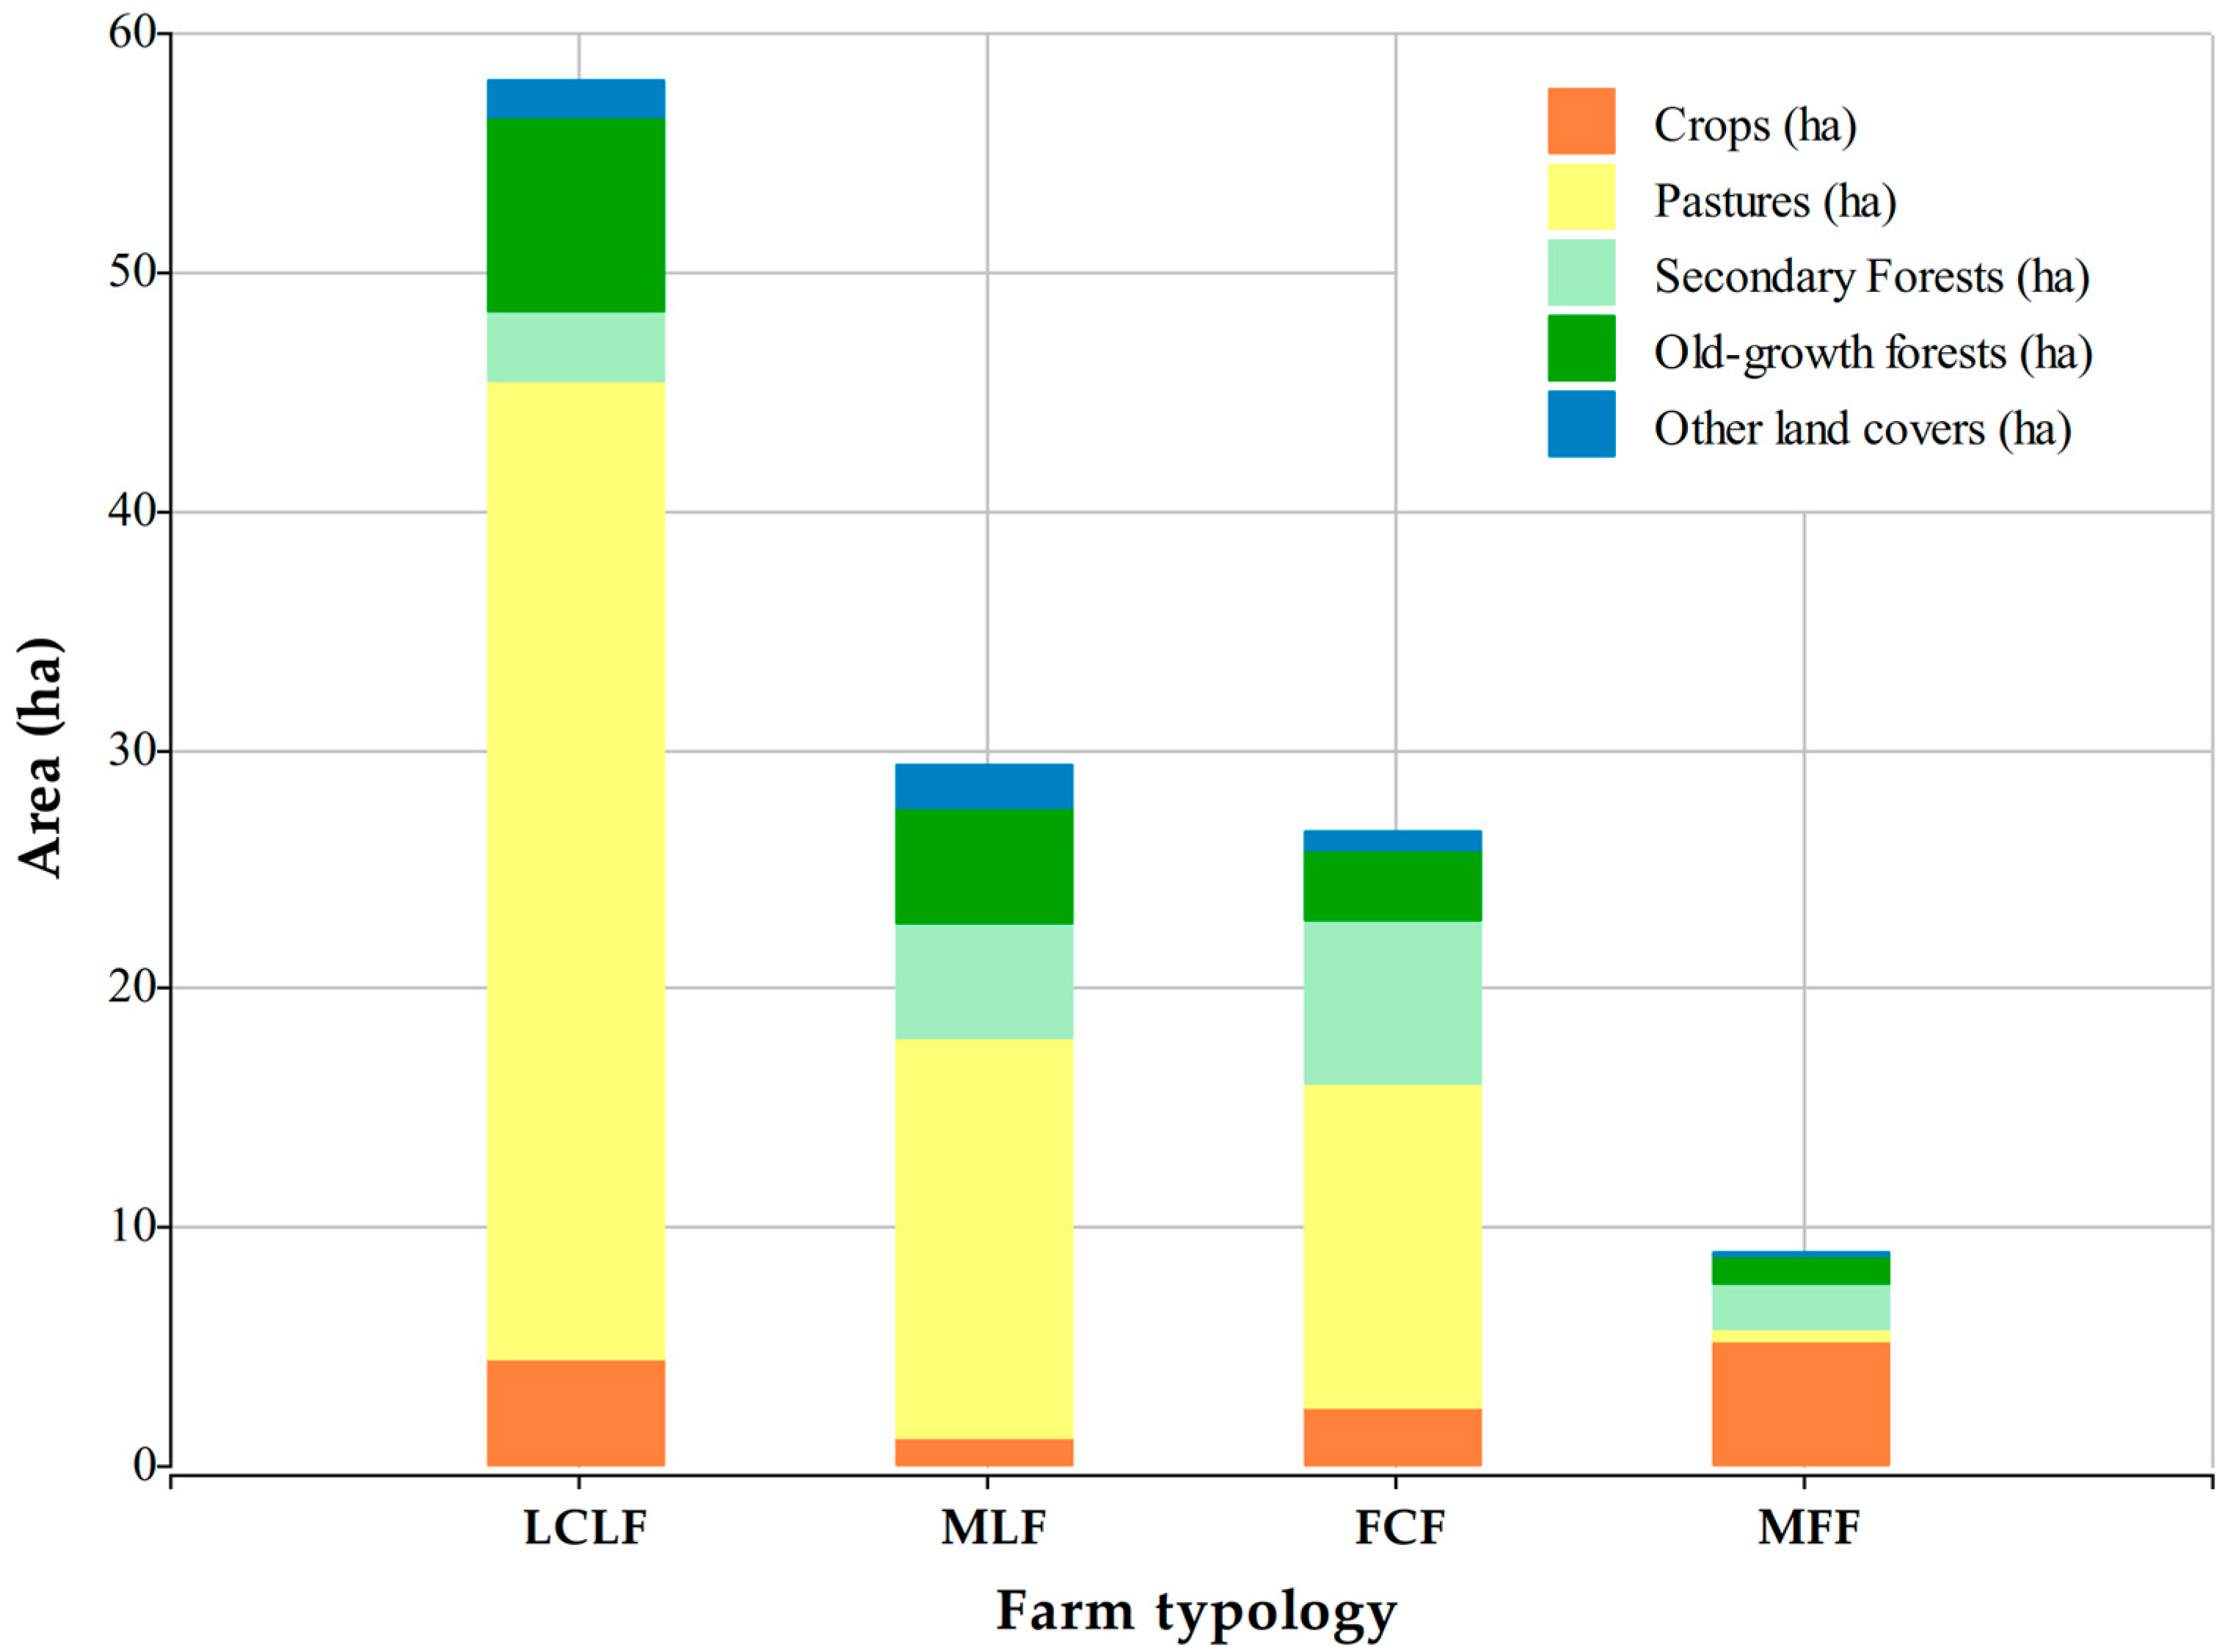
The analysis of the socio-productive context of the 25 selected farms revealed the consolidation of four farm typologies in the study area (Supplementary Figure S2 and Table S2). These farms were distributed across the typologies as follows: 10 farms classified as Large Crop–Livestock Farms (LCLF), 5 as Mixed Livestock Farms (MLF), 5 as Family Cattle Farms (FCF), and 5 as Mixed Family Farms (MFF). Large Crop-Livestock Farms (LCLF) are large-scale operations (averaging 57.9 ha; Figure 2), where pastures account for 68.9% of the total farm area. Their main activity is cattle ranching, accounting for 69.5% of the gross production (GP). These farms follow a conventional model based on agro-industrial inputs and exhibit low levels of production diversification. Their focus is on extensive livestock production, and their organizational structures tend to follow a semi-business model, with limited family or community involvement. Mixed Livestock Farms (MLF) are medium-sized production units (averaging 29.2 ha; Figure 2), where pastures also predominate, covering approximately 65% of their total area. These farms combine various livestock activities, with cattle ranching (28.9% of GP), fish farming (21.8%), poultry farming (21.4%), and pig farming (22.4%) being the most important. Although they integrate multiple components, these systems are managed under a family-based logic, with active participation of family members in daily agricultural tasks. They typically operate with moderate levels of input use and engage in both market-oriented and self-consumption activities.
Family Cattle Farms (FCF) are also medium-sized units (averaging 26.6 ha; Figure 2), where permanent pastures remain the dominant land cover, accounting for 64.2% of their area. Their economy is primarily based on cattle production, which represents 72.1% of the GDP. Unlike large-scale systems, these farms are more often organized around family labor and emphasize resource optimization rather than intensive input use. Mixed Family Farms (MFF) are small-scale operations (averaging 8.9 ha; Figure 2), where crops are the dominant land cover, occupying 69.1% of the total area. Their productive structure is primarily oriented toward poultry farming (32.7% of GP) and the cultivation of food crops for both self-consumption and local markets. These farms operate through a family-centered approach, low reliance on external inputs, and a high degree of internal organization. They represent a peasant-style model that combines subsistence cropping with strategies for productive and food resilience.

3.2. Characterization of the Agroecological Transition

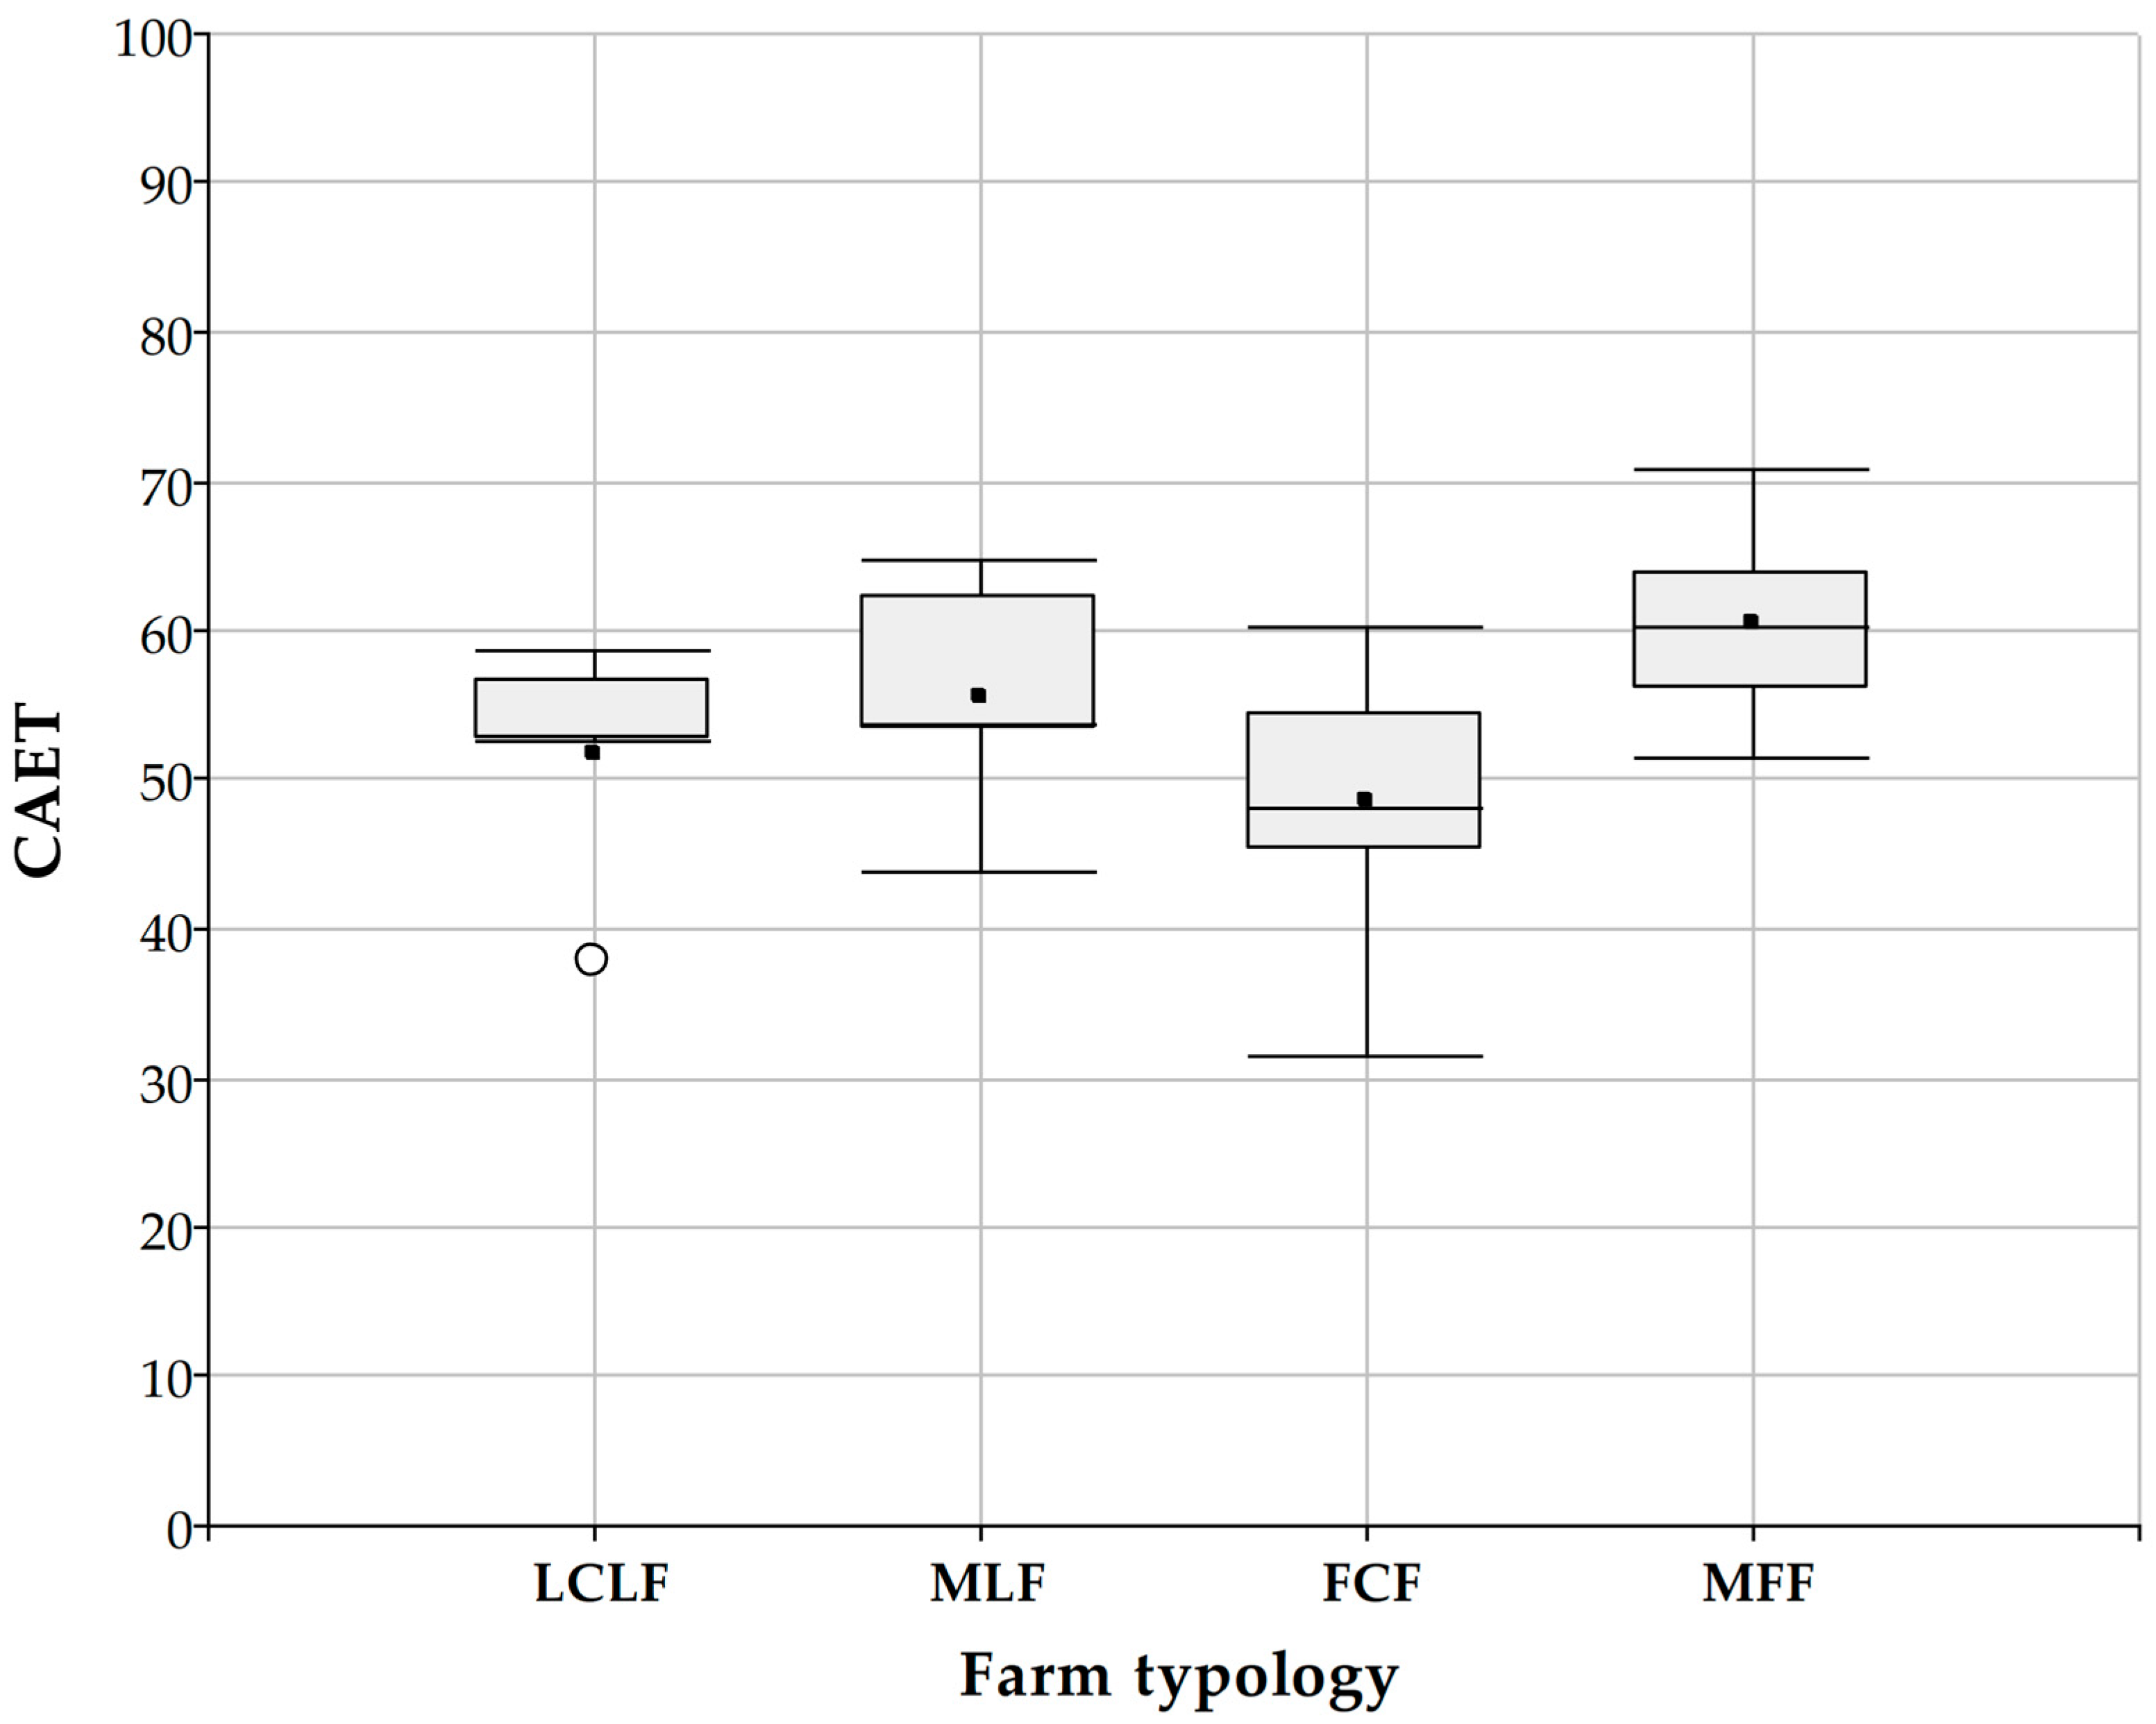
The CAET results grouped by farm typologies identified in the Colombian Andean-Amazon Transition Zone reveal differences in agroecological transition levels across farm types (Figure 3). Mixed Family Farms (MFF) show the highest average score (60%) and the lowest data dispersion, suggesting a more consistent performance within the group. They are followed by Mixed Livestock Farms (MLF), which also reach high values (56%) but with greater variability among individual units. In contrast, Family Cattle Farms (FCF) display the lowest average score (49%) and high dispersion, indicating a more heterogeneous transition process. Meanwhile, Large Crop-Livestock Farms (LCLF) exhibit an intermediate level (52%) with low variation among observations (Figure 3, Table 3).
The disaggregation of the agroecological transition index (CAET) into CAET Farm and CAET Community allowed for a more nuanced understanding of the functional and sociocultural components of the transition. Mixed Family Farms (MFF) registered the highest average values in both components, reaching 58.7% for CAET Farm and 62.3% for CAET Community. They were followed by Mixed Livestock Farms (MLF), with average scores of 51.9% and 59.3%, respectively. Large Crop-Livestock Farms (LCLF) showed intermediate transition levels (47.7% for CAET Farm and 55.7% for CAET Community). In contrast, Family Cattle Farms (FCF) exhibited the lowest average values, with 46.1% in CAET Farm and 51.0% in CAET Community (Supplementary Figure S3).
Mixed Family Farms (MFF) lead in seven out of the ten CAET elements, with notably high values in Diversity (65%), Synergies (65%), Efficiency (48%), and Recycling (55%), indicating a more consolidated agroecological management. They also score highly in Culture and Food Traditions (70%), Co-creation and Knowledge Sharing (63%), and Circular and Solidarity Economy (65%), reinforcing their territorial integration, their link to food sovereignty, and their involvement in local learning and marketing networks. Mixed Livestock Farms (MLF) also show strong performance in Diversity (58%) and Synergies (58%), with social strengths reflected in Circular and Solidarity Economy (67%) and Responsible Governance (58%). However, moderate levels of Efficiency (38%) and Recycling (46%) reveal a continued reliance on external inputs. In Large Crop-Livestock Farms (LCLF), performance is uneven. While they attain acceptable scores in Diversity (55%) and Culture and Food Traditions (60%), they show critical weaknesses in Efficiency (31%) and Recycling (40%), suggesting limited adoption of agroecological practices. Family Cattle Farms (FCF), which obtained the lowest overall scores, exhibit low performance in key elements such as Co-creation (48%), Circular Economy (50%), and Governance (51%), reflecting weak social articulation and limited organizational innovation (Table 3).
These differences are partly explained by the correlations observed between CAET elements (Supplementary Table S3). Diversity, for example, is strongly associated with Synergies (r = 0.79 ***), Recycling (r = 0.75 ***), and Efficiency (r = 0.65 ***), indicating that more diverse farms tend to implement more integrated ecological practices, facilitating nutrient cycling and efficient resource use. In addition, Culture and Food Traditions was meaningfully correlated with Synergies (0.63 ***), Efficiency (0.67 ***), and Recycling (0.60 **), underscoring the role of local knowledge and traditional practices in strengthening agroecological systems. From an organizational perspective, Co-creation was strongly correlated with Responsible Governance (0.70 ***), Human and Social Values (0.56 **), and Circular and Solidarity Economy (0.59 **), while Governance also showed strong relationships with the latter two (0.70 *** and 0.56 **, respectively). These connections suggest that participatory structures and robust social networks are essential for advancing holistic agroecological transitions.
Finally, correlation analyses between CAET and individual elements (Supplementary Table S4) revealed important patterns by farm type. In MFF, the transition is mainly supported by Circular and Solidarity Economy (r = 0.97 **), Responsible Governance (r = 0.82), and Resilience (r = 0.82), highlighting the importance of territorial ties, organizational autonomy, and adaptive capacity. In MLF, correlations are strongest with Recycling (0.97 **) and Diversity (0.87), reflecting a management approach oriented toward multifunctionality. In FCF, progress is more related to Efficiency (0.91 ***), Responsible Governance (0.84 **), and Synergies (0.79 **), whereas in LCLF, relevant technical correlations were found with Efficiency (0.97 **), Recycling (0.87), and Resilience (0.90), despite their conventional orientation. These findings confirm that the most critical elements for advancing agroecological transition in the region are Efficiency (r = 0.83 ***), Circular and Solidarity Economy (0.81 ***), Diversity (0.78 ***), and Synergies (0.75 ***), which together integrate technical, social, and cultural dimensions essential for an effective transition.

3.3. Core Performance Indicators

3.3.1. Economic Sustainability

In the economic dimension of sustainability, the results by farm typology (Table 4) reveal significant contrasts in terms of efficiency, value generation, and production system autonomy. Mixed Family Farms (MFF) show the highest levels of Production System Autonomy (VA/GVP = 0.69) and a high Perceived Income Evolution (PIE = 80), suggesting a combination of internal efficiency and economic resilience. Although their Gross Value of Production per Utilized Agricultural Area (GVP/UAA = COP 4,563,575) is lower than that of Family Cattle Farms (FCF) and Mixed Livestock Farms (MLF), MFF achieve a higher Net Value Added per Utilized Agricultural Area (VA/UAA = COP 2,662,671) and lower Intermediate Consumption per Agricultural Work Unit (IC/AWU = COP 1,746,275). This confirms that they operate with lower dependence on external inputs, reinforcing the results observed in the Efficiency and Recycling elements (Table 3). These findings are also reflected in their Net Income per Agricultural Work Unit (NI/AWU = COP 4,451,257), although further comparison with prevailing off-farm net income levels in the region would be required to contextualize its competitiveness (Table 4).
On the other hand, Mixed Livestock Farms (MLF) report the highest values in terms of Gross Value of Production per Utilized Agricultural Area (GVP/UAA = COP 13,794,232) and Gross Value of Production per Agricultural Work Unit (GVP/AWU = COP 32,519,562), but also the highest input costs per unit area (Intermediate Consumption per Agricultural Work Unit, IC/AWU = COP 4,132,139) and the heaviest workload burdens (Net Income per Agricultural Work Unit, NI/AWU = COP 14,417,036). Despite this high gross performance, their Production System Autonomy (VA/GVP = 0.58) is moderate, suggesting lower relative economic efficiency and greater dependence on external resources.
Large Crop-Livestock Farms (LCLF) show the lowest values across almost all economic indicators, including Net Value Added per Utilized Agricultural Area (VA/UAA = COP 1,088,451) and Production System Autonomy (VA/GVP = 0.56), as well as a low Perceived Income Evolution (PIE = 50), reflecting low profitability and limited productive resilience. Finally, Family Cattle Farms (FCF) show a good balance, with intermediate but solid indicators in terms of Production System Autonomy (VA/GVP = 0.60) and Perceived Income Evolution (PIE = 75). This highlights the importance of diversified livestock systems in the economic stability of these farms (Table 4).

3.3.2. Environmental Sustainability

In the environmental dimension of sustainability, the results by farm typology (Table 5) reveal marked differences in agrochemical use, soil health, and agrobiodiversity. Mixed Family Farms (MFF) stand out with the highest score in the Integrated Pest and Disease Management Index (IPDMI = 54) and the lowest Chemical Pesticide Expenditure per Agricultural Work Unit (CPE/AWU = COP 48,989), suggesting a strong implementation of ecological pest control practices. They also exhibit the highest value in the Soil Health Index (SHI = 4.24) and the lowest Chemical Fertilizer Expenditure per Agricultural Work Unit (CFE/AWU = COP 4766), indicating more sustainable management and greater efficiency in the use of internal resources. These results align with the high scores in the Synergies and Recycling elements (Table 3), reflecting agroecological practices that enhance natural fertility and reduce synthetic input dependency.
In terms of agrobiodiversity, Mixed Family Farms (MFF) also show the highest Crop Diversity Index (CDI = 64) and a high Natural Vegetation and Pollinator Presence on Farm (NVPPF = 97). However, their Livestock Diversity Index (LDI = 53) is surpassed by Large Crop-Livestock Farms (LCLF), which record the highest value in this indicator (LDI = 59). Nonetheless, LCLF exhibits a high dependency on chemical inputs, with the highest expenditures on Chemical Pesticides (CPE/AWU = COP 122,807) and Chemical Fertilizers (CFE/AWU = COP 42,438), along with a moderate Soil Health Index (SHI = 3.76). Family Cattle Farms (FCF) and Mixed Livestock Farms (MLF) occupy intermediate and lower positions, with lower levels of integrated management (IPDMI = 25 and 34, respectively), greater use of external inputs, and low values in Crop Diversity (CDI = 24 and 13) and Soil Health (SHI = 3.91 and 3.50) (Table 5).

3.3.3. Social Sustainability

In the social dimension of sustainability, the performance indicator results presented in Table 6 reflect a clear trend toward greater equity and self-sufficiency among Mixed Family Farms (MFF). These farms exhibit a combination of a high Dietary Diversity Index (DDI = 84) and the lowest Household Food Self-Consumption Expenditure per Person (HSCE = COP 1,635,000), indicating a high level of food self-sufficiency. This pattern is also observed in other farm types at early stages of agroecological transition, such as Mixed Livestock Farms (MLF), which also show a high DDI (84) and a moderate food expenditure (HSCE = COP 1,897,600), whereas Family Cattle Farms (FCF), which are less advanced in the transition, display a lower DDI (76) and higher expenditure (HSCE = COP 2,245,200), suggesting lower dietary diversification and greater reliance on external food purchases. Large Crop-Livestock Farms (LCLF), despite maintaining a high DDI (84), show the highest food expenditure (HSCE = COP 2,328,000), which may reflect a lower focus on production for self-consumption.
Regarding rural youth, Mixed Family Farms (MFF) report the highest Youth Opportunity Index (YOI = 94) and a moderate level of Youth Retention Index (YRI = 50), indicating that while young people find opportunities in this farm type, they still face challenges in remaining in rural areas. In contrast, Large Crop-Livestock Farms (LCLF) show the highest values for both YOI (93) and YRI (83), although these are accompanied by low levels of Women Employed on the Farm (WEF = 54) and a low Abbreviated Women’s Empowerment in Agriculture Index (A-WEAI = 47). MFF, on the other hand, displays high levels of Family Members Employed on the Farm (FMEF = 85), Women Employed (WEF = 79), and a solid A-WEAI score (62), indicating that these farms tend to promote greater inclusion of women and family members in productive activities. Mixed Livestock Farms (MLF), despite reporting the lowest scores in Youth Retention (YRI = 38) and Young Household Members Employed on the Farm (YHMEF = 31), show the highest value in the A-WEAI index (64), suggesting that this group may exhibit greater structural gender equity (Table 6).

3.4. Relationships Between Agroecological Transition and Key Performance Indicators

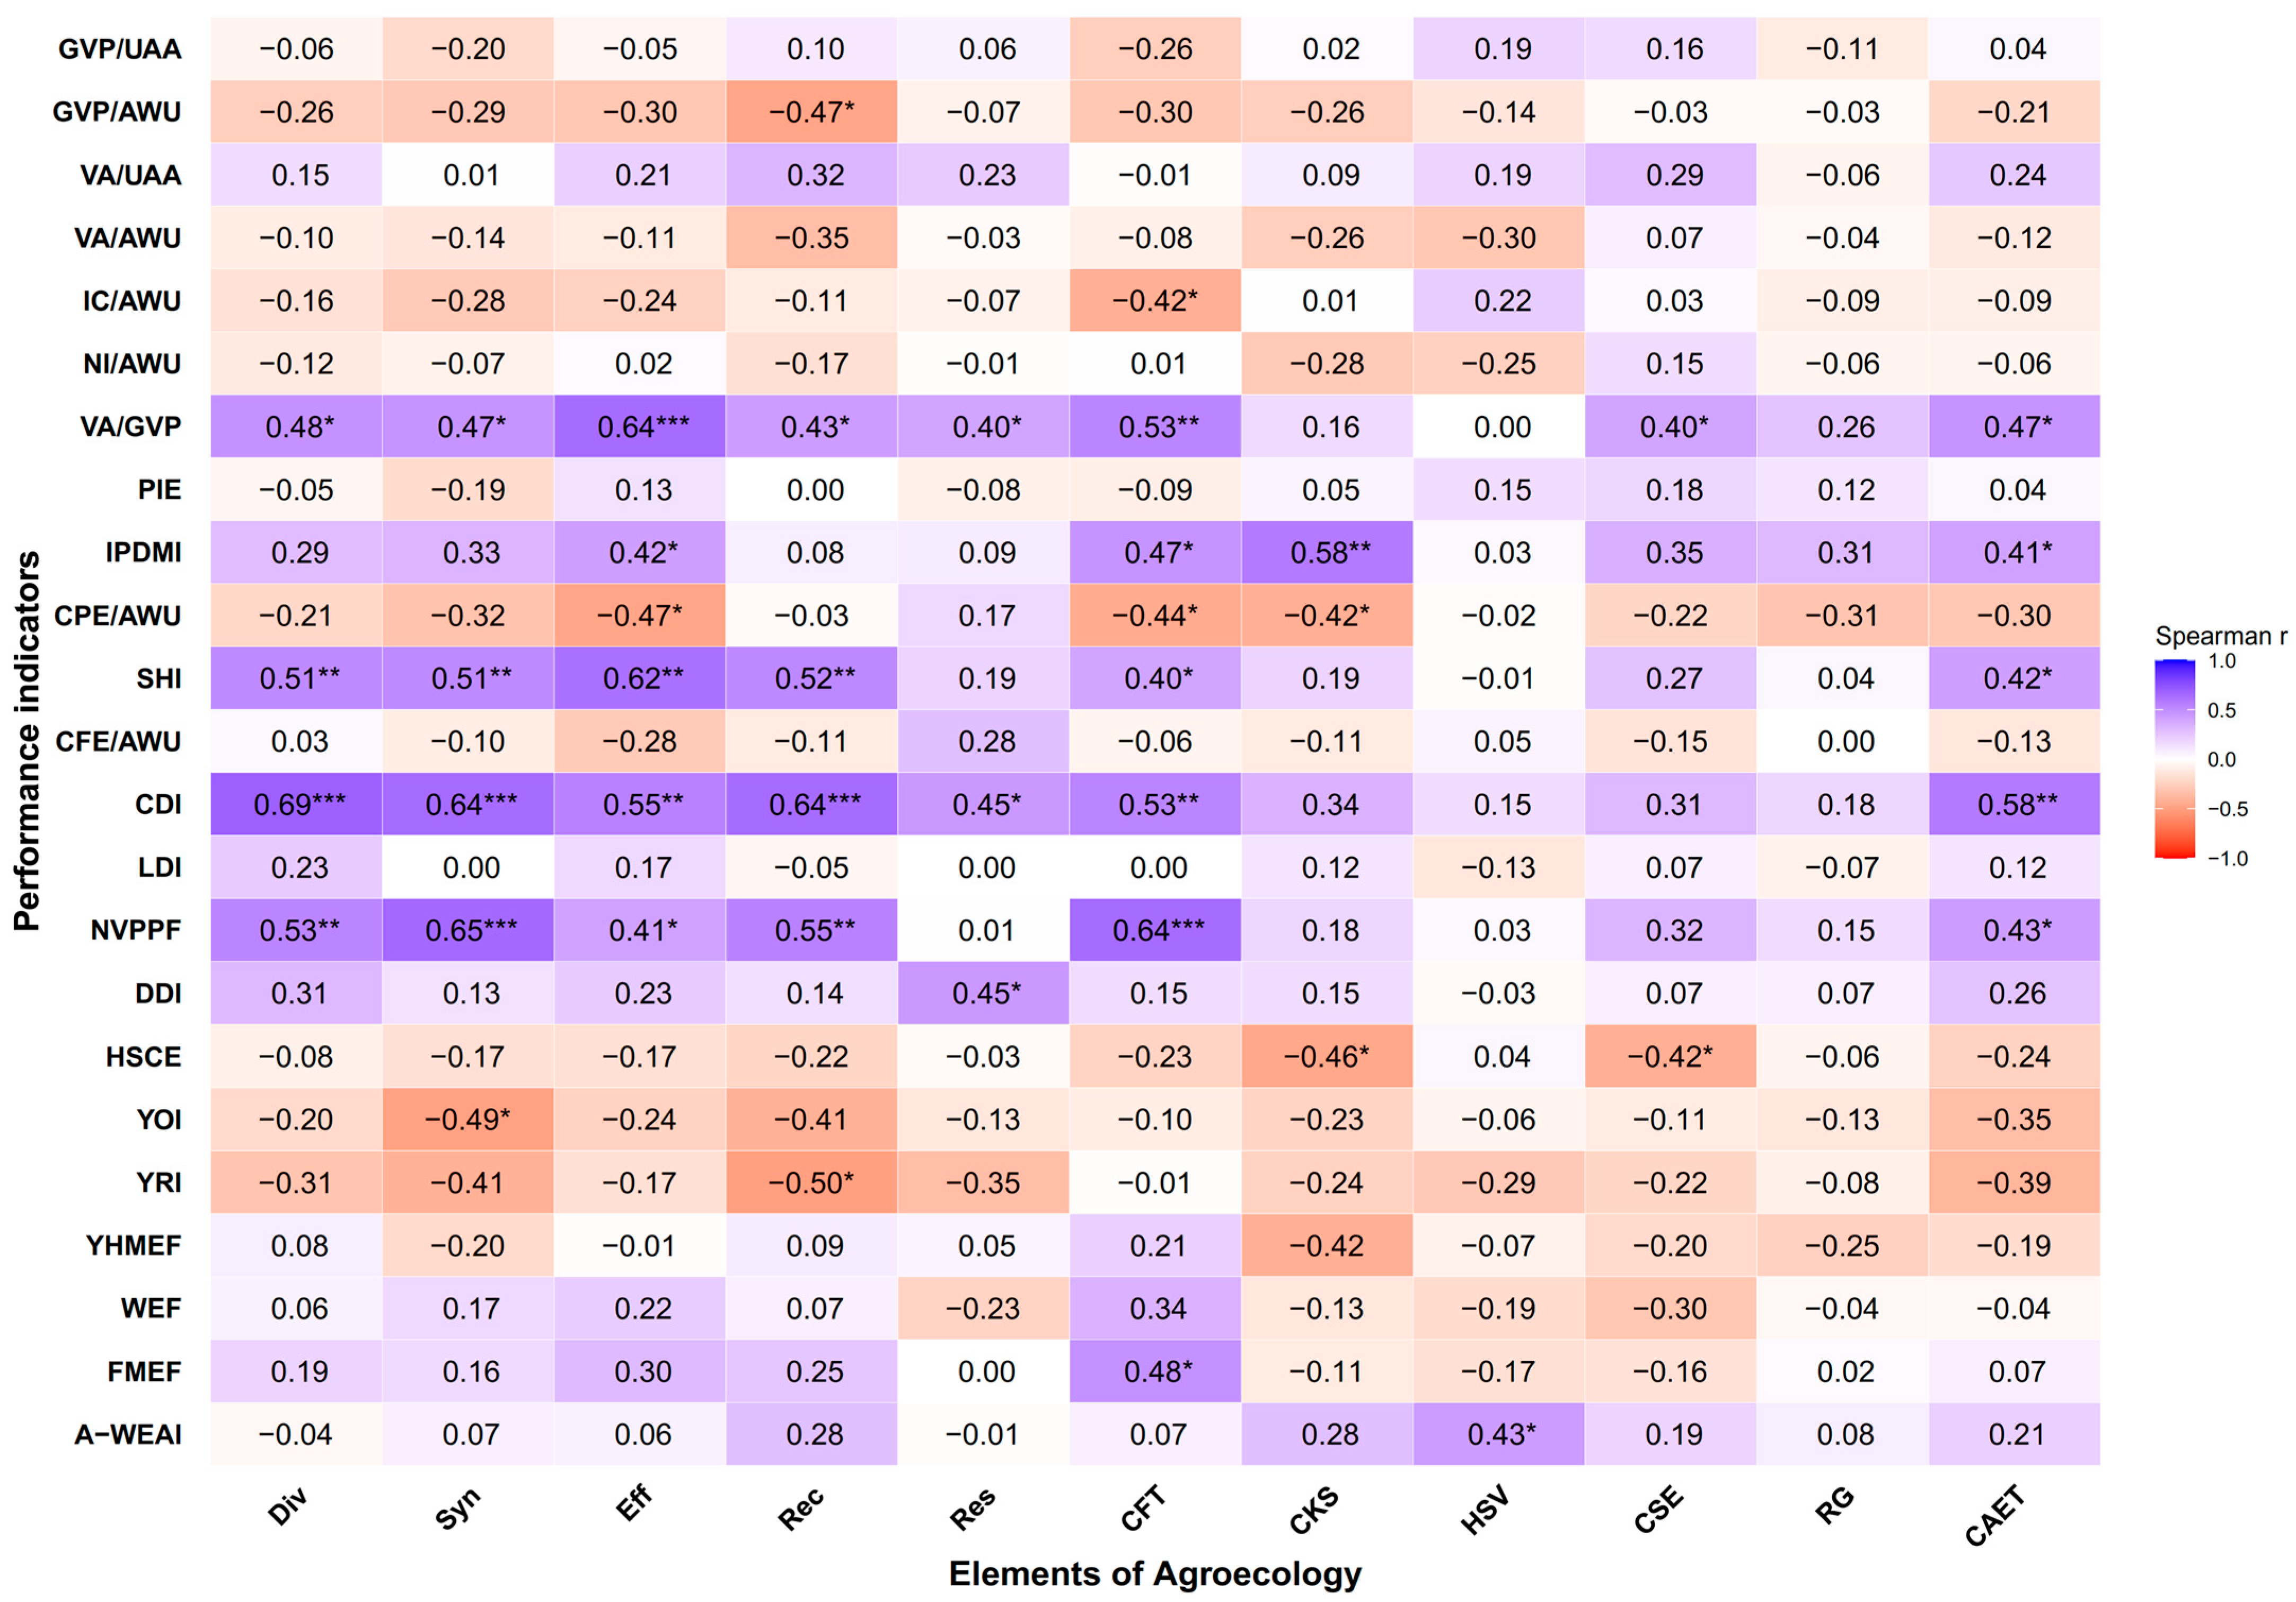
Key associations were observed between the elements of agroecology and various performance indicators on farms in the Colombian Amazon (Figure 4). The overall Characterization of the Agroecological Transition (CAET) index showed positive and significant correlations with variables that reflect sustainable and resilient practices, particularly its relationship with the Crop Diversity Index (CDI = 0.58 **), Production System Autonomy (VA/GVP = 0.47 *), and Natural Vegetation and Pollinator Presence on Farm (NVPPF = 0.43 *). These results suggest that farms more advanced in their agroecological transition are not only more biodiverse and self-sufficient, but also better preserve key components of the agricultural landscape, supporting functional biodiversity.
In addition, the Co-creation and Knowledge Sharing (CKS) element shows a positive correlation with the Integrated Pest and Disease Management Index (IPDMI = 0.58 **), highlighting the importance of shared and context-specific knowledge in the implementation of ecological management practices. This variable is also negatively correlated with Chemical Pesticide Expenditure per Agricultural Work Unit (CPE/AWU = −0.42 *), reinforcing the idea that strengthening local capacities and promoting knowledge exchange can reduce dependence on agrochemicals and foster more sustainable strategies (Figure 4).
Strong and statistically significant relationships were observed among performance indicators (Figure S4). Higher production per hectare was closely linked to greater input use (GVP/UAA vs. IC/AWU = 0.92 ***) and labor efficiency (GVP/AWU vs. VA/AWU = 0.90 ***), while Production System Autonomy showed a negative correlation with Intermediate Consumption (–0.62 **), reinforcing that more self-sufficient farms rely less on external inputs. Agroecological practices were evident in the negative association of the Integrated Pest and Disease Management Index with pesticide expenditure (–0.75 ***) and its links to improved autonomy (–0.42 *) and soil health (–0.41 *). Similarly, crop diversity was negatively correlated with economic output (–0.63 ***) but positively related to natural vegetation, pollinator presence (0.59), and soil health (0.58 **), underscoring biodiversity’s long-term role in resilience. Finally, youth retention was associated with greater opportunities (YRI vs. YOI = 0.68 **), and women’s empowerment (A-WEAI) correlated strongly with family (0.89 ***) and women’s (0.82 *) participation in farm labor, highlighting the social inclusiveness of more diversified systems.
Supplementary Figure S5 shows significant associations between farm structural aspects and their economic and environmental performance. As farm size increases, both productivity per hectare (GVP/UAA; R2 = 0.19, p = 0.0307) and crop diversity (CDI; R2 = 0.17, p = 0.0436) decrease, reflecting a trend toward lower efficiency and reduced diversification in larger units. Likewise, a higher proportion of off-farm income is associated with lower net on-farm income per agricultural work unit (NI/AWU; R2 = 0.34, p = 0.0021), indicating that reliance on external sources negatively affects economic performance within farms. Finally, increased expenditure on feed (Feed) is associated with reduced productive autonomy (VA/GVP; R2 = 0.29, p = 0.0053), highlighting how dependence on external inputs limits the capacity to generate added value.
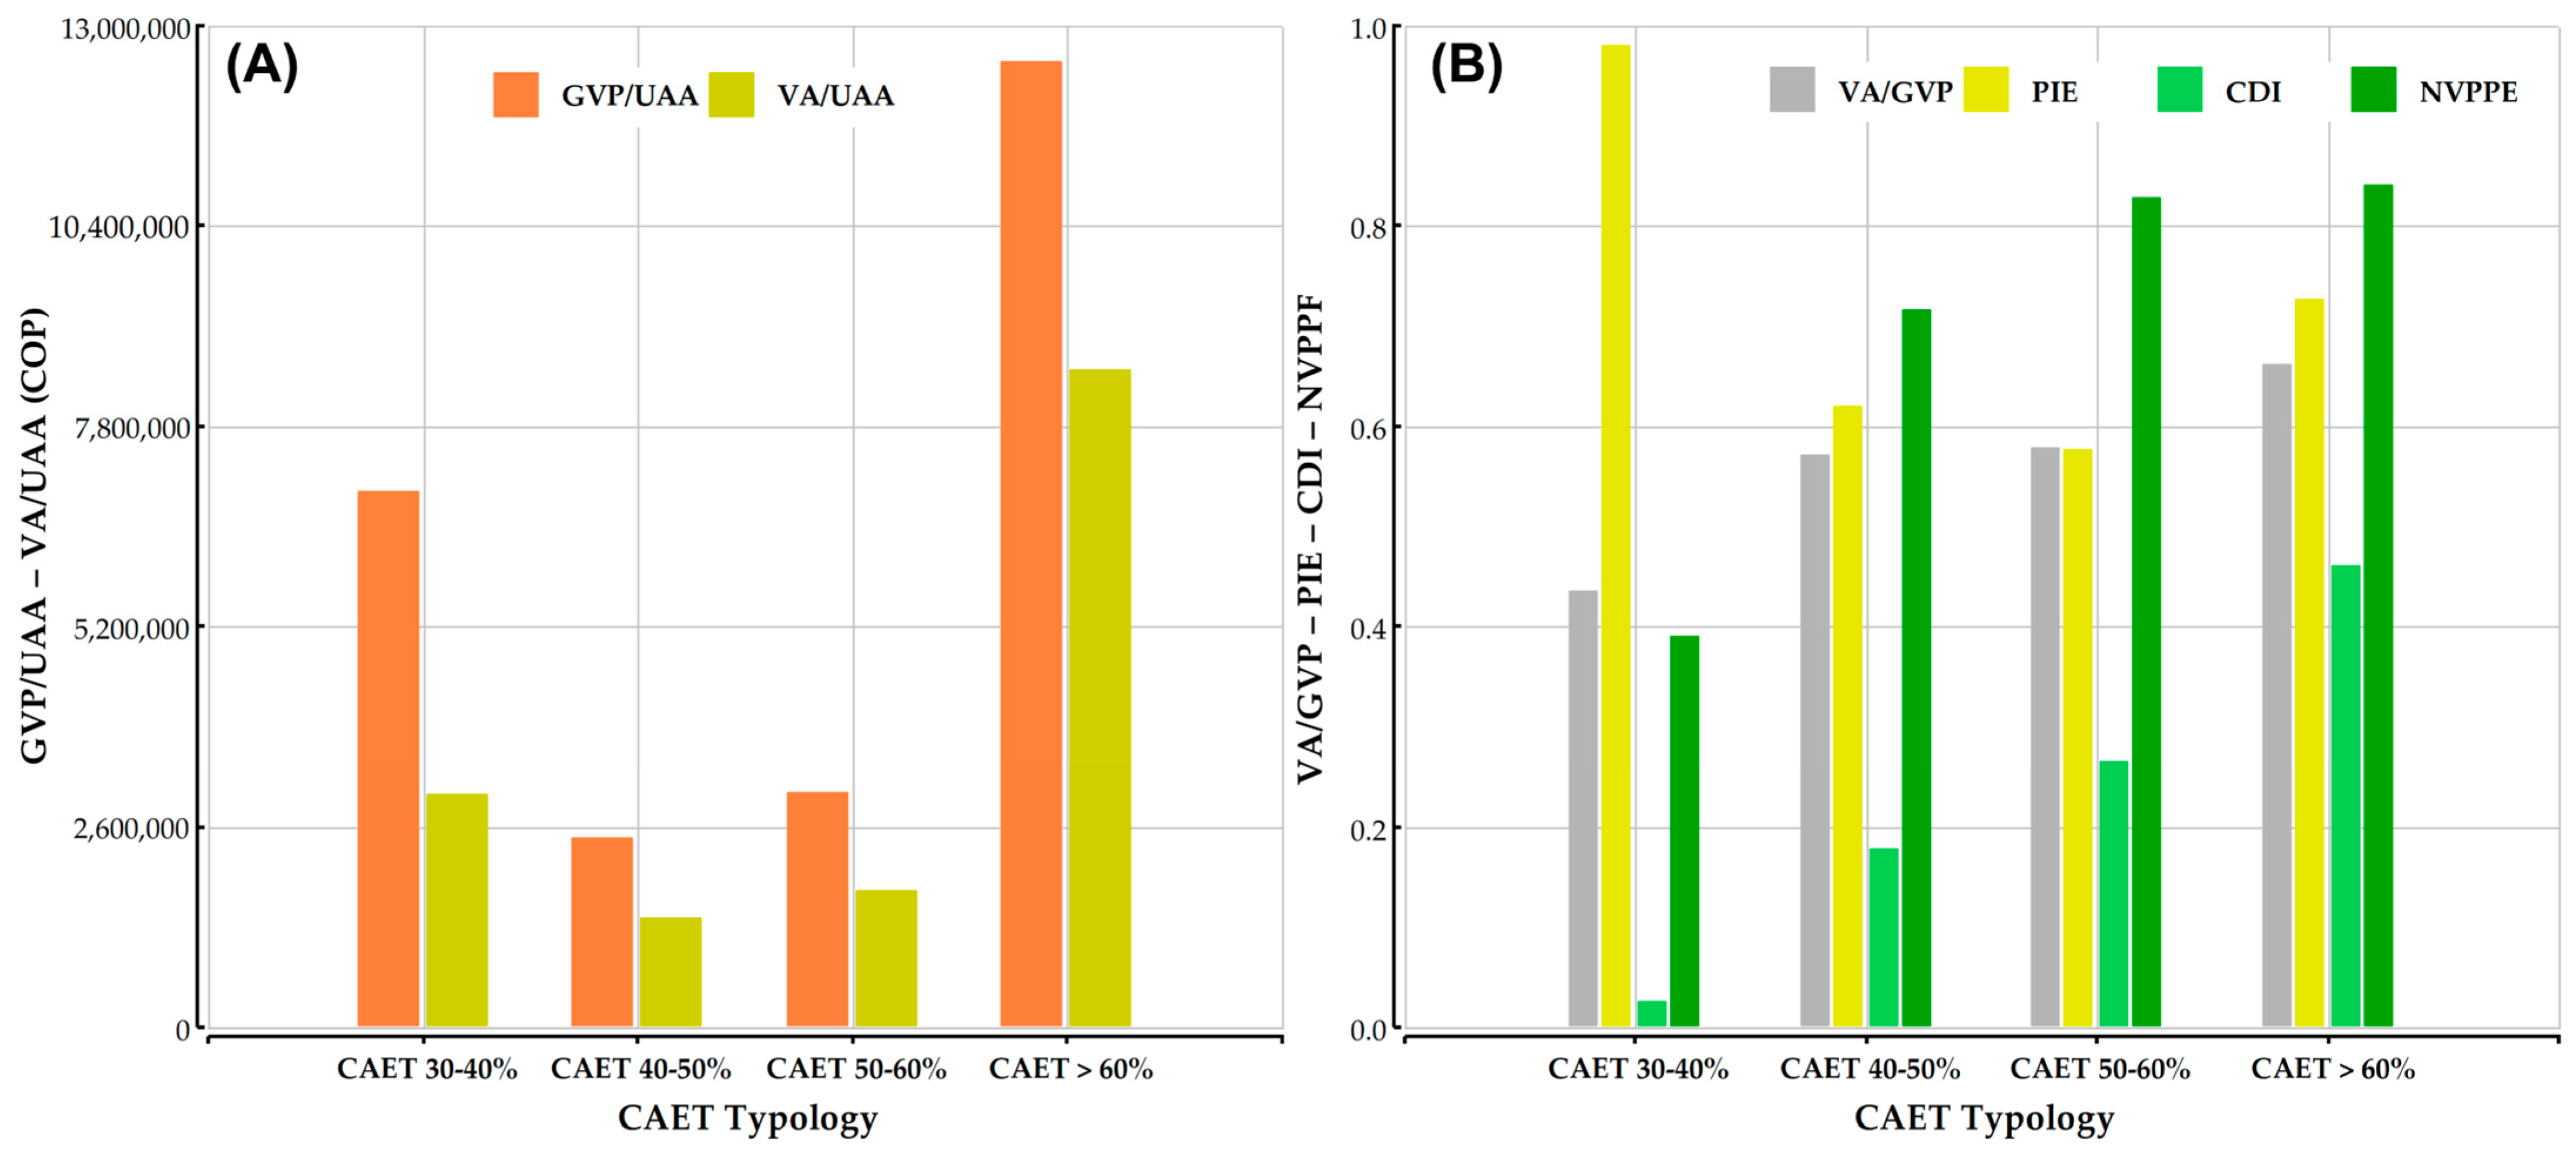
Figure 5 shows a consistent relationship between the level of agroecological transition and several key performance indicators. As farms move along the transition gradient (from CAET < 40% to CAET > 60%), the Gross Value of Production per Utilized Agricultural Area (GVP/UAA) and the Net Value Added per Utilized Agricultural Area (VA/UAA) first decline and subsequently increase, reaching their highest values in the most agroecological farms (Figure 5A). At the same time, Production System Autonomy (VA/GVP) rises from 0.46 to 0.69, indicating lower dependence on external inputs in farms with greater levels of transition. This trend is accompanied by an improvement in Perceived Income Evolution (PIE), which also shows higher values among farms with more advanced transition levels. Regarding ecological aspects, there is an increase in the Crop Diversity Index (CDI) and in the Natural Vegetation and Pollinator Presence on Farm (NVPPF), rising from 0.05 to 0.48 and from 0.41 to 0.86, respectively (Figure 5B).

4. Discussion

4.1. Progress and Limitations in the Agroecological Transition

The results of this study reveal significant progress in the agroecological transition process within the Andean–Amazon Transition Zone of the Caquetá department, particularly among Mixed Family Farms (MFF), which reached an average CAET score of 60%. This typology stood out in seven of the ten agroecological elements, reflecting strong ecosystem integration, ties to food culture, and local marketing strategies. Similar patterns have been reported by El Mujtar et al. [44] and Lucantoni et al. [30], who note that farms with greater family organization and territorial linkages advance more consistently toward sustainable production.
However, significant limitations are also evident in other farm types, particularly among Family Cattle Farms (FCF), which recorded the lowest average CAET score (49%) and low values in key indicators such as Co-creation and Knowledge Sharing (48%) and Responsible Governance (51%). This reflects an incipient transition marked by weak social articulation and limited collective innovation, a pattern also observed in other contexts [3,45], where conventional systems face structural and cultural barriers to agroecological adoption.
The correlation analysis provides additional insight into the divergent trajectories among farm types. Strong associations among Diversity, Synergies, Recycling, and Efficiency indicate that more diversified systems integrate ecological management in a coherent manner. In contrast, the weaker link with Responsible Governance suggests that diversification alone does not ensure a full agroecological transition without inclusive organizational structures. This finding aligns with HLPE [38] and Wezel et al. [69], who emphasize that technical change must be complemented by institutional innovations that strengthen equity and social justice in rural territories.
A key limitation concerns the sensitivity of the CAET index to distinguish differences among farm types. For example, crop diversity ranged from 64 in Mixed Family Farms to 22 in Large Crop–Livestock Farms, and similar contrasts appeared in pesticide and fertilizer use, yet overall CAET scores remained close (49–60%; Table 3 and Table 5). This reduced sensitivity, also highlighted by Namirembe et al. [46] and Tittonell et al. [55], who stress the need to adapt global tools to territorial specificities. Our analysis of response dispersion also revealed indices with limited variability, including Animal welfare [if applicable], Water conservation and efficiency, Adequate diet and nutritional knowledge, Labor, Environmental resilience and climate change adaptation capacity, Locally marketed products and services, Mechanisms to reduce vulnerability, Empowerment and social justice for producers, Seed and breed management, Integration of local varieties and traditional knowledge into food preparation, and Diversity of activities, products, and services (Table 1; Supplementary Questionnaire S2).
To strengthen the applicability of TAPE in Amazonian territories, future work should refine the scales and thresholds of these indices to better capture socio-environmental specificities. Such adaptations could involve recalibrating levels against Amazonian reference conditions, introducing intermediate categories to increase sensitivity, triangulating with complementary biophysical or administrative data, and validating scales through participatory workshops with local organizations. These refinements would enhance the discriminative power of TAPE and increase its policy relevance for guiding agroecological transitions in highly diverse and complex contexts.

4.2. Contribution of Agroecology to Economic Performance

The results of this study show that Mixed Family Farms (MFF) stand out in terms of economic efficiency and productive autonomy, achieving the highest score in the Production System Autonomy index (VA/GVP = 0.69) and recording one of the lowest levels of Intermediate Consumption per Agricultural Work Unit (IC/AWU = COP 1,746,275). This combination is accompanied by a high Perceived Income Evolution (PIE = 80), indicating that these farms are not only economically viable but also perceived as sustainable by those who manage them. These findings align with reports by van der Ploeg et al. [31] and Lucantoni et al. [30], who have documented that agroecological systems tend to improve economic resilience by reducing dependence on external inputs and promoting more efficient use of internal resources. In contrast, Mixed Livestock Farms (MLF) and Family Cattle Farms (FCF), although reporting high gross production values (GVP/UAA = COP 13,794,232 and 3,490,349, respectively), show lower levels of autonomy (VA/GVP = 0.58 and 0.60), reflecting a structure more exposed to market dynamics and rising input costs.
Economic findings further illustrate the advantages of agroecological transition. The positive relationship between production value and input use, combined with the negative association with autonomy, confirms that higher output in conventional systems often depends on external inputs rather than efficiency. This supports Levard [57] and Mottet et al. [39], who argue that profitability should be measured by net value added and reduced dependence on external resources. Within this framework, Mixed Family Farms (MFF) emerge as resilient models that successfully combine productivity with autonomy, providing valuable lessons to inspire and guide transition processes in other agricultural systems throughout the region [70].
Additionally, the comparison of economic indicators (GVP/UAA, VA/UAA, and PIE) based on CAET typologies (Figure 5) reveals a non-linear “U-shaped” relationship, a pattern also identified by Lucantoni et al. [30] and Pizarro et al. [71]. This behavior suggests that agricultural systems go through a critical stage during the transition process, characterized by a temporary decline in profitability levels as conventional practices are abandoned and new strategies aligned with agroecological principles are adopted [72]. This phase of vulnerability, referred to by Tittonell [18,73] as the “bottleneck”, requires special attention in terms of public policy and technical support, as the success of the transition largely depends on strengthening resilience and adaptability capacities during this key period.

4.3. Relationships Between Agroecological Practices, Environment, and Social Performance

The findings of this study show that farms with greater progress in the agroecological transition, particularly Mixed Family Farms (MFF), effectively integrate sustainable practices that positively impact both the environment and the social fabric. MFF recorded the highest values in the Integrated Pest and Disease Management Index (IPDMI = 54), Soil Health Index (SHI = 4.24), and Crop Diversity Index (CDI = 64), while also reporting the lowest expenditures on Chemical Pesticides (CPE/AWU = COP 48,989) and Chemical Fertilizers (CFE/AWU = COP 4766). This evidence aligns with findings reported by Duran-Bautista et al. [25], Muchane et al. [28], and Faye and Braun [26], who emphasize that well-managed agroecological systems feature healthier soils, more efficiently closed nutrient cycles, and a significant reduction in dependence on synthetic inputs. These factors contribute to greater agroecosystem resilience.
In social terms, Mixed Family Farms (MFF) also stand out for their positive performance. These farms show a high Dietary Diversity Index (DDI = 84) and the lowest Household Food Self-Consumption Expenditure per Person (HSCE = 1,635,000 COP), reflecting a high level of food self-sufficiency. This finding is consistent with studies by Bezner Kerr et al. [32] and van Zutphen et al. [36], who argue that productive diversification based on agroecological principles not only improves diet quality but also reduces household food vulnerability in rural areas. Additionally, MFF reports the highest levels of Family Members Employed on the Farm (FMEF = 85%) and Abbreviated Women’s Empowerment in Agriculture Index (A-WEAI = 62), suggesting a more inclusive, participatory, and equitable social structure. These results are in line with the arguments of Wordofa et al. [74], who emphasize that agroecological systems tend to strengthen the role of women and families in agroecosystem management, fostering shared responsibility and collective well-being.
The integration of agroecological practices also translated into tangible environmental and social benefits. Farms with stronger co-creation and knowledge-sharing networks were more likely to adopt ecological pest management strategies, confirming the role of participatory innovation in driving ecological approaches. At the same time, reduced pesticide use was associated with improved soil health, reinforcing previous findings by Steier and Cianci [20] and Bohan et al. [19], who demonstrated that lowering agrochemical dependence not only mitigates environmental impacts but also enhances soil functionality and strengthens the resilience of production systems. Taken together, these findings underscore how the interplay of technical practices, governance, and social organization is essential for advancing sustainability transitions.

4.4. Territorial Implications and Contributions to Sustainability Policies

The multitemporal land cover analysis around the evaluated farms revealed a marked dominance of pastures, which consistently exceeded 70% of the area across all years analyzed (2002–2024), along with a sustained reduction in forest cover, which declined from 12.9% to 7.1% over the same period. This pattern reflects the continuous expansion of the agricultural frontier, particularly of extensive cattle ranching, into natural ecosystems. These findings are consistent with those reported by Armenteras et al. [7] and Ruiz-Agudelo et al. [9], who documented the impact of colonization dynamics and land use change on the accelerated loss of forest cover in the Colombian Amazon. Simultaneously, a progressive increase in secondary vegetation was identified starting in 2016, which may indicate processes of land abandonment or natural regeneration. If properly managed, these areas represent an opportunity to apply agroecological restoration approaches, as suggested by Rodríguez-León et al. [75] and Loch et al. [14], who emphasize the potential of agroecology to transform degraded landscapes into functional and resilient territories.
Farms that are more advanced in their agroecological transition, particularly Mixed Family Farms (MFF), not only show better economic and social performance indicators, but also greater crop diversity and presence of key elements of functional biodiversity. This is exemplified by the Natural Vegetation and Pollinator Presence on Farm (NVPPF) index, which reaches a value of 97 in these farms, positioning them as strategic spaces for ecological regeneration and landscape connectivity. In this sense, these farms can be considered territorial nodes that not only strengthen food sovereignty but also contribute to restoring ecosystem services and mitigating the effects of climate change, as suggested by Lavelle et al. [12], Tittonell [18], and HLPE [38]. This evidence reinforces the importance of incorporating agroecology into rural land use planning and environmental management agendas, recognizing the role of farmers as key actors in building sustainable landscapes. This contributes as a starting point to drive large-scale transitions [76].
Additionally, the implementation of TAPE in this study proved to be a robust tool for generating comparable, participatory, and decision-oriented data in complex contexts such as the Colombian Amazon. It made it possible to demonstrate how agroecological performance integrates productive efficiency, functional biodiversity, and key aspects of the social fabric in a coherent way, providing a solid foundation for designing interventions that respond to the real dynamics of agri-food systems in highly complex territories. These capabilities have been validated in other international experiences, including in Africa [30,46,74,77], Europe [78,79], and Latin America [3,43,44,71], consolidating TAPE as a strategic tool to support the formulation of agroecological public policies.
Finally, the results of this research confirm that the agroecological transition is neither homogeneous nor linear, but rather a territorial process that emerges from the interaction between biodiversity, productive autonomy, local knowledge, and organizational networks. In this regard, the Andean–Amazon Transition Zone of Caquetá, due to its biocultural richness, socio-environmental complexity, and strategic position within the Amazon biome, represents a key setting for scaling up agroecology as an alternative model for rural development. As noted by Altieri et al. [80], FAO [5], Wezel et al. [69], and Tittonell et al. [55], the articulation of science, policy, and peasant knowledge is essential for advancing toward more resilient, just, and regenerative food systems.

5. Conclusions

This study shows that farms further along the agroecological transition achieve stronger performance across economic, environmental, and social indicators, whereas transition bottlenecks persist in livestock-dominated systems with high dependence on external inputs. TAPE proved useful to identify strengths and gaps, though contextual adaptation is advisable in the Andes–Amazon Transition Zone, given its high socioecological heterogeneity. Agroecology emerges as a viable territorial pathway toward resilient and sustainable food systems. Furthermore, it is compatible with—and can enhance—economic outcomes: in our sample, farms at advanced transition levels combined stable productivity with higher input autonomy and more diversified income streams, yielding more resilient net margins. We therefore view agroecology not merely as one option among many but as a territorial strategy that is fully applicable when enabling conditions are in place (secure tenure, extension services, market linkages, and tailored finance).
To translate these insights into action, policymakers should (i) provide targeted incentives and concessional credit for diversification and input autonomy; (ii) strengthen technical assistance and farmer-to-farmer networks; (iii) deploy market instruments (e.g., public procurement and territorial market linkages) that reward diversified production; (iv) implement payments for ecosystem services and conservation agreements for biodiversity and soil health; (v) support the participation of women and youth; and (vi) adopt an adapted TAPE as a regional monitoring framework. These measures can accelerate agroecological transitions while respecting the diversity of trajectories across the region. Future research should implement longitudinal, high-frequency monitoring of environmental and socioeconomic indicators, adapt and validate TAPE for this region, and use quasi-experimental designs (e.g., Before–After–Control–Impact, BACI) alongside cost–benefit analyses to test scalability—especially in livestock-dominated systems.

Supplementary Materials

The following supporting information can be downloaded at: https://www.mdpi.com/article/10.3390/su17209024/s1, Figure S1. Geographic location of the evaluated farms in the Colombian Andean–Amazon Transition Zone; Figure S2. Dendrogram of the hierarchical cluster analysis using Ward’s method and squared Euclidean distance; Figure S3. Boxplots showing average CAET Farm and CAET Community scores (%) by farm typology in the Colombian Andean–Amazon Transition Zone; Figure S4. Correlation matrix between performance indicator scores; Figure S5. Linear regressions between structural farm characteristics and economic and environmental indicators in the Andean–Amazon transition zone, Caquetá, Colombia; Table S1. Variables used for the characterization of production systems; Table S2. Socio-productive characterization (mean ± standard error) of four farm typologies in the Andean–Amazon transition zone, Caquetá, Colombia; Table S3. Correlation matrix among the 10 elements of agroecology in farms of the Colombian Andean–Amazon Transition Zone; Table S4. Correlation matrix between the 10 elements of agroecology and the overall agroecological transition (CAET) for the different identified farm types; Questionnaire S1. Step 0. Survey for the Basic Characterization of the Household and the Farm.; Questionnaire S2. Step 1. Survey for the Characterization of the Agroecological Transition (CAET); Questionnaire S3. Step 2. Survey for the Evaluation of Agroecological Performance.

Author Contributions

Conceptualization, Y.D.S.-C. and P.A.T.; methodology, Y.D.S.-C., P.A.T. and A.S.; software, Y.D.S.-C. and A.S.; validation, Y.D.S.-C., P.A.T., A.S. and J.A.B.-G.; formal analysis, Y.D.S.-C. and A.S.; investigation, Y.D.S.-C., J.A.B.-G. and A.S.; resources, J.A.B.-G. and C.H.R.-L.; data curation, Y.D.S.-C.; writing—original draft preparation, Y.D.S.-C.; writing—review and editing, Y.D.S.-C., A.S., P.A.T. and C.H.R.-L.; visualization, Y.D.S.-C. and A.S.; supervision, J.A.B.-G., A.S. and C.H.R.-L.; project administration, C.H.R.-L. and J.A.B.-G.; funding acquisition J.A.B.-G. and C.H.R.-L. All authors have read and agreed to the published version of the manuscript.

Funding

This research was part of the project: “Fortaleciendo las capacidades territoriales para apoyar innovaciones en agroecología, pesca artesanal responsable y bioeconomía circular para la adaptación y mitigación al cambio climático en zonas costeras y fronteras forestales en Colombia DeSIRA (Development Smart Innovation through Research in Agriculture) 2020—CO”, funded under the Subvención Acciones Exteriores FOOD/2021/423-487, through a contract between the European Union (EU) and the Instituto Amazónico de Investigaciones Científicas (SINCHI). The partner institutions include the Ministerio de Ciencia, Tecnología e Innovación (MINCIENCIAS), the Centre de Coopération Internationale en Recherche Agronomique pour le Développement (CIRAD), the Universidad Tecnológica del Chocó ‘Diego Luis Córdoba’ (UTCH), and the Corporación Colombiana de Investigación Agropecuaria (AGROSAVIA).

Institutional Review Board Statement

Ethical review and approval were waived for this study because it is classified as without risk, as it involved only non-invasive interviews with adult farmers to collect information on farming practices. The unit of analysis was the farm production system, not the individual farmer. No sensitive personal, medical, genetic, or financial information was collected. Participation was voluntary, all responses were anonymized to ensure confidentiality, and informed consent was obtained from all participants.

Informed Consent Statement

Informed consent was obtained from all subjects involved in the study.

Data Availability Statement

Data is contained within the article and Supplementary Materials.

Acknowledgments

The authors thank all the farmers in the study area for their help and support during the fieldwork.

Conflicts of Interest

The authors declare no conflicts of interest. The funders had no role in the design of the study; in the collection, analyses, or interpretation of the data; in the writing of the manuscript, or in the decision to publish the results.

References

  1. OCDE. Rural Policy Review of Colombia 2022; OECD Rural Studies; OECD: Paris, France, 2022; ISBN 9789264497856. [Google Scholar]
  2. Anderson, K.; Valdés, A. Distortions to Agricultural Incentives in Latin America; The International Bank for Reconstruction and Development/The World Bank: Washington, DC, USA, 2008; ISBN 978-0-8213-7513-6. [Google Scholar]
  3. Barrios Latorre, S.A.; Sadovska, V.; Chongtham, I.R. Perspectives on Agroecological Transition: The Case of Guachetá Municipality, Colombia. Agroecol. Sustain. Food Syst. 2023, 47, 382–412. [Google Scholar] [CrossRef]
  4. Altieri, M.A.; Toledo, V.M. The Agroecological Revolution in Latin America: Rescuing Nature, Ensuring Food Sovereignty and Empowering Peasants. J. Peasant. Stud. 2011, 38, 587–612. [Google Scholar] [CrossRef]
  5. FAO. The 10 Elements of Agroecology. Guiding the Transition to Sustainable Food and Agricultural Systems; FAO: Rome, Italy, 2018. [Google Scholar]
  6. Gliessman, S.R. Agroecology: The Ecology of Sustainable Food Systems, 3rd ed.; CRC Press: Boca Raton, FL, USA, 2015; ISBN 9780429153709. [Google Scholar]
  7. Armenteras, D.; Murcia, U.; González, T.M.; Barón, O.J.; Arias, J.E. Scenarios of Land Use and Land Cover Change for NW Amazonia: Impact on Forest Intactness. Glob. Ecol. Conserv. 2019, 17, e00567. [Google Scholar] [CrossRef]
  8. Lapola, D.M.; Pinho, P.; Barlow, J.; Aragão, L.E.O.C.; Berenguer, E.; Carmenta, R.; Liddy, H.M.; Seixas, H.; Silva, C.V.J.; Silva-Junior, C.H.L.; et al. The Drivers and Impacts of Amazon Forest Degradation. Science 2023, 379, eabp8622. [Google Scholar] [CrossRef]
  9. Ruiz-Agudelo, C.A.; de Paula Gutiérrez-Bonilla, F.; Cortes-Gómez, A.M.; Suarez, A. A First Approximation to the Colombian Amazon Basin Remnant Natural Capital. Policy and Development Implications. Trees For. People 2022, 10, 100334. [Google Scholar] [CrossRef]
  10. Dávalos, L.M.; Sanchez, K.M.; Armenteras, D. Deforestation and Coca Cultivation Rooted in Twentieth-Century Development Projects. Bioscience 2016, 66, 974–982. [Google Scholar] [CrossRef]
  11. González-González, A.; Villegas, J.C.; Clerici, N.; Salazar, J.F. Spatial-Temporal Dynamics of Deforestation and Its Drivers Indicate Need for Locally-Adapted Environmental Governance in Colombia. Ecol. Indic. 2021, 126, 107695. [Google Scholar] [CrossRef]
  12. Lavelle, P.; Dolédec, S.; de Sartre, X.A.; Decaëns, T.; Gond, V.; Grimaldi, M.; Oszwald, J.; Hubert, B.; Ramirez, B.; Veiga, I.; et al. Unsustainable Landscapes of Deforested Amazonia: An Analysis of the Relationships among Landscapes and the Social, Economic and Environmental Profiles of Farms at Different Ages Following Deforestation. Glob. Environ. Change 2016, 40, 137–155. [Google Scholar] [CrossRef]
  13. Álvarez, F.; Casanoves, F.; Suárez, J.C.; Pezo, D. The Effect of Different Levels of Tree Cover on Milk Production in Dual-Purpose Livestock Systems in the Humid Tropics of the Colombian Amazon Region. Agrofor. Syst. 2021, 95, 93–102. [Google Scholar] [CrossRef]
  14. Loch, V.D.C.; Celentano, D.; Cardozo, E.G.; Rousseau, G.X. Towards Agroecological Transition in Degraded Soils of the Eastern Amazon. For. Trees Livelihoods 2020, 30, 90–105. [Google Scholar] [CrossRef]
  15. Sachet, E.; Mertz, O.; Vanegas, M.; Cruz-Garcia, G.S.; Beltran, M.; Angel-Sanchez, Y.K.; Zapata, Y.C.; Lavelle, P.; Solarte, A.; Suarez, J.C.; et al. Codesigning Sustainable Land Uses: Framing Participatory Methods for Research and Development Projects. Agroecol. Sustain. Food Syst. 2023, 47, 413–440. [Google Scholar] [CrossRef]
  16. Altieri, M.A.; Funes-Monzote, F.R.; Petersen, P. Agroecologically Efficient Agricultural Systems for Smallholder Farmers: Contributions to Food Sovereignty. Agron. Sustain. Dev. 2012, 32, 1–13. [Google Scholar] [CrossRef]
  17. Wezel, A.; Casagrande, M.; Celette, F.; Vian, J.F.; Ferrer, A.; Peigné, J. Agroecological Practices for Sustainable Agriculture. A Review. Agron. Sustain. Dev. 2014, 34, 1–20. [Google Scholar] [CrossRef]
  18. Tittonell, P. Ecological Intensification of Agriculture—Sustainable by Nature. Curr. Opin. Environ. Sustain. 2014, 8, 53–61. [Google Scholar] [CrossRef]
  19. Bohan, D.A.; Richter, A.; Bane, M.; Therond, O.; Pocock, M.J.O. Farmer-Led Agroecology for Biodiversity with Climate Change. Trends Ecol. Evol. 2022, 37, 927–930. [Google Scholar] [CrossRef]
  20. Steier, G.; Cianci, A.G. Environmental Resilience and Food Law: Agrobiodiversity and Agroecology, 1st ed.; Steier, G., Cianci, A.G., Eds.; CRC Press: Boca Raton, FL, USA, 2019; ISBN 9780429443350. [Google Scholar]
  21. Wanger, T.C.; DeClerck, F.; Garibaldi, L.A.; Ghazoul, J.; Kleijn, D.; Klein, A.M.; Kremen, C.; Mooney, H.; Perfecto, I.; Powell, L.L.; et al. Integrating Agroecological Production in a Robust Post-2020 Global Biodiversity Framework. Nat. Ecol. Evol. 2020, 4, 1150–1152. [Google Scholar] [CrossRef] [PubMed]
  22. Bezner Kerr, R.; Postigo, J.C.; Smith, P.; Cowie, A.; Singh, P.K.; Rivera-Ferre, M.; Tirado-von der Pahlen, M.C.; Campbell, D.; Neufeldt, H. Agroecology as a Transformative Approach to Tackle Climatic, Food, and Ecosystemic Crises. Curr. Opin. Environ. Sustain. 2023, 62, 101275. [Google Scholar] [CrossRef]
  23. Dittmer, K.M.; Rose, S.; Snapp, S.S.; Kebede, Y.; Brickman, S.; Shelton, S.; Egler, C.; Stier, M.; Wollenberg, E. Agroecology Can Promote Climate Change Adaptation Outcomes Without Compromising Yield in Smallholder Systems. Environ. Manag. 2023, 72, 333–342. [Google Scholar] [CrossRef]
  24. Hrabanski, M.; Le Coq, J.F. Climatisation of Agricultural Issues in the International Agenda through Three Competing Epistemic Communities: Climate-Smart Agriculture, Agroecology, and Nature-Based Solutions. Environ. Sci. Policy 2022, 127, 311–320. [Google Scholar] [CrossRef]
  25. Duran-Bautista, E.H.; Angel-Sanchez, Y.K.; Bermúdez, M.F.; Suárez, J.C. Agroforestry Systems Generate Changes in Soil Macrofauna and Soil Physical Quality Relationship in the Northwestern Colombian Amazon. Agrofor. Syst. 2023, 97, 927–938. [Google Scholar] [CrossRef]
  26. Faye, J.B.; Braun, Y.A. Soil and Human Health: Understanding Agricultural and Socio-Environmental Risk and Resilience in the Age of Climate Change. Health Place 2022, 77, 102799. [Google Scholar] [CrossRef]
  27. Luján Soto, R.; Cuéllar Padilla, M.; de Vente, J. Participatory Selection of Soil Quality Indicators for Monitoring the Impacts of Regenerative Agriculture on Ecosystem Services. Ecosyst. Serv. 2020, 45, 101157. [Google Scholar] [CrossRef]
  28. Muchane, M.N.; Sileshi, G.W.; Gripenberg, S.; Jonsson, M.; Pumariño, L.; Barrios, E. Agroforestry Boosts Soil Health in the Humid and Sub-Humid Tropics: A Meta-Analysis. Agric. Ecosyst. Environ. 2020, 295, 106899. [Google Scholar] [CrossRef]
  29. Landholm, D.M.; Pradhan, P.; Wegmann, P.; Sánchez, M.A.R.; Salazar, J.C.S.; Kropp, J.P. Reducing Deforestation and Improving Livestock Productivity: Greenhouse Gas Mitigation Potential of Silvopastoral Systems in Caquetá. Environ. Res. Lett. 2019, 14, 114007. [Google Scholar] [CrossRef]
  30. Lucantoni, D.; Sy, M.R.; Goïta, M.; Veyret-Picot, M.; Vicovaro, M.; Bicksler, A.; Mottet, A. Evidence on the Multidimensional Performance of Agroecology in Mali Using TAPE. Agric. Syst. 2023, 204, 103499. [Google Scholar] [CrossRef]
  31. van der Ploeg, J.D.; Barjolle, D.; Bruil, J.; Brunori, G.; Costa Madureira, L.M.; Dessein, J.; Drąg, Z.; Fink-Kessler, A.; Gasselin, P.; Gonzalez de Molina, M.; et al. The Economic Potential of Agroecology: Empirical Evidence from Europe. J. Rural. Stud. 2019, 71, 46–61. [Google Scholar] [CrossRef]
  32. Bezner Kerr, R.; Madsen, S.; Stüber, M.; Liebert, J.; Enloe, S.; Borghino, N.; Parros, P.; Mutyambai, D.M.; Prudhon, M.; Wezel, A. Can Agroecology Improve Food Security and Nutrition? A Review. Glob. Food Sec 2021, 29, 100540. [Google Scholar] [CrossRef]
  33. Deaconu, A.; Berti, P.R.; Cole, D.C.; Mercille, G.; Batal, M. Agroecology and Nutritional Health: A Comparison of Agroecological Farmers and Their Neighbors in the Ecuadorian Highlands. Food Policy 2021, 101, 102034. [Google Scholar] [CrossRef]
  34. Kansanga, M.M.; Kangmennaang, J.; Bezner Kerr, R.; Lupafya, E.; Dakishoni, L.; Luginaah, I. Agroecology and Household Production Diversity and Dietary Diversity: Evidence from a Five-Year Agroecological Intervention in Rural Malawi. Soc. Sci. Med. 2021, 288, 113550. [Google Scholar] [CrossRef]
  35. Santoso, M.V.; Bezner Kerr, R.N.; Kassim, N.; Martin, H.; Mtinda, E.; Njau, P.; Mtei, K.; Hoddinott, J.; Young, S.L. A Nutrition-Sensitive Agroecology Intervention in Rural Tanzania Increases Children’s Dietary Diversity and Household Food Security but Does Not Change Child Anthropometry: Results from a Cluster-Randomized Trial. J. Nutr. 2021, 151, 2010–2021. [Google Scholar] [CrossRef]
  36. van Zutphen, K.G.; van den Berg, S.; Gavin-Smith, B.; Imbo, E.; Kraemer, K.; Monroy-Gomez, J.; Pannatier, M.; Prytherch, H.; Six, J.; Thoennissen, C.; et al. Nutrition as a Driver and Outcome of Agroecology. Nat. Food 2022, 3, 990–996. [Google Scholar] [CrossRef] [PubMed]
  37. Ewert, F.; Baatz, R.; Finger, R. Agroecology for a Sustainable Agriculture and Food System: From Local Solutions to Large-Scale Adoption. Annu. Rev. Resour. Econ. 2023, 15, 351–381. [Google Scholar] [CrossRef]
  38. HLPE. Agroecological and Other Innovative Approaches for Sustainable Agriculture and Food Systems That Enhance Food Security and Nutrition. A Report by the High Level Panel of Experts on Food Security and Nutrition of the Committee on World Food Securityn World; High Level Panel of Experts on Food Security and Nutrition (HLPE): Rome, Italy, 2019. [Google Scholar]
  39. Mottet, A.; Bicksler, A.; Lucantoni, D.; De Rosa, F.; Scherf, B.; Scopel, E.; López-Ridaura, S.; Gemmil-Herren, B.; Bezner Kerr, R.; Sourisseau, J.-M.; et al. Assessing Transitions to Sustainable Agricultural and Food Systems: A Tool for Agroecology Performance Evaluation (TAPE). Front. Sustain. Food Syst. 2020, 4, 252. [Google Scholar] [CrossRef]
  40. Darmaun, M.; Chevallier, T.; Hossard, L.; Lairez, J.; Scopel, E.; Chotte, J.-L.; Lambert-Derkimba, A.; de Tourdonnet, S. Multidimensional and Multiscale Assessment of Agroecological Transitions. A Review. Int. J. Agric. Sustain. 2023, 21, 2193028. [Google Scholar] [CrossRef]
  41. Barrios, E.; Gemmill-Herren, B.; Bicksler, A.; Siliprandi, E.; Brathwaite, R.; Moller, S.; Batello, C.; Tittonell, P. The 10 Elements of Agroecology: Enabling Transitions towards Sustainable Agriculture and Food Systems through Visual Narratives. Ecosyst. People 2020, 16, 230–247. [Google Scholar] [CrossRef]
  42. FAO. TAPE Tool for Agroecology Performance Evaluation 2019—Process of Development and Guidelines for Application. Test Version; FAO: Rome, Italy, 2019; ISBN 978-92-5-132064-8. [Google Scholar]
  43. James, D.; Blesh, J.; Levers, C.; Ramankutty, N.; Bicksler, A.J.; Mottet, A.; Wittman, H. The State of Agroecology in Brazil: An Indicator-Based Approach to Identifying Municipal “Bright Spots”. Elem. Sci. Anthr. 2023, 11, 11. [Google Scholar] [CrossRef]
  44. El Mujtar, V.A.; Zamor, R.; Salmerón, F.; del Guerrero, A.S.; Laborda, L.; Tittonell, P.; Hogan, R. Lexical Analysis Improves the Identification of Contextual Drivers and Farm Typologies in the Assessment of Transitions to Agroecology through TAPE—A Case Study from Rural Nicaragua. Agric. Syst. 2023, 209, 103686. [Google Scholar] [CrossRef]
  45. Bicksler, A.J.; Mottet, A.; Lucantoni, D.; De Rosa, F. Fao’S Tool for Agroecology Performance Evaluation (Tape): A Multi-Dimensional Assessment Tool for the Performance of Agroecology for Better Decision Making in the Transition to Sustainable Food Systems. In Proceedings of the Organic World Congress 2021, Rennes, France, 6–10 September 2021. [Google Scholar]
  46. Namirembe, S.; Mhango, W.; Njoroge, R.; Tchuwa, F.; Wellard, K.; Coe, R. Grounding a Global Tool—Principles and Practice for Agroecological Assessments Inspired by TAPE. Elem. Sci. Anthr. 2022, 10, 22. [Google Scholar] [CrossRef]
  47. IGAC. Estudio General de Suelos y Zonificación de Tierras Departamento de Caquetá. Escala 1:100.000; Imprenta Nacional de Colombia: Bogotá, Colombia, 2014; ISBN 978-958-832373-2. [Google Scholar]
  48. Murad, C.A.; Pearse, J. Landsat Study of Deforestation in the Amazon Region of Colombia: Departments of Caquetá and Putumayo. Remote Sens. Appl. 2018, 11, 161–171. [Google Scholar] [CrossRef]
  49. Voss, C.; Tsikriktsis, N.; Frohlich, M. Case Research in Operations Management. Int. J. Oper. Prod. Manag. 2002, 22, 195–219. [Google Scholar] [CrossRef]
  50. SIAT-AC Sistema de Información Ambiental Territorial de la Amazonia Colombiana. Available online: https://siatac.co/ (accessed on 14 April 2025).
  51. IDEAM. Leyenda Nacional de Coberturas de La Tierra. Metodología CORINE Land Cover Adaptada Para Colombia. Escala 1:100.00; Martínez Ardila, N.J., Murcia García, U.G., Eds.; Instituto de Hidrología, Meteorología y Estudios Ambientales: Bogotá, Colombia, 2010; ISBN 978-958-806729-2. [Google Scholar]
  52. Betancurt, B.; Rodriguez, C.H.; Garzón, M.T. Línea Base Para El Monitoreo de La Sostenibilidad de Los Sistemas Productivos Agropecuarios En El Departamento de Caquetá, 1st ed.; Instituto Amazónico de Investigaciones Científicas SINCHI: Bogotá, Colombia, 2015; ISBN 9789588317861. [Google Scholar]
  53. Bernal Núñez, A.P.; Gutiérrez-Montes, I.; Hernández-Núñez, H.E.; Gutiérrez Suárez, D.R.; Gutiérrez García, G.A.; Suárez, J.C.; Casanoves, F.; Flora, C.; Sibelet, N. Diverse Farmer Livelihoods Increase Resilience to Climate Variability in Southern Colombia. Land Use Policy 2023, 131, 106731. [Google Scholar] [CrossRef]
  54. Gutiérrez Garcia, G.A.; Gutiérrez-Montes, I.; Suárez Salazar, J.C.; Casanoves, F.; Gutiérrez Suárez, D.R.; Hernández-Núñez, H.E.; Flora, C.B.; Sibelet, N. Contribution of Local Knowledge in Cocoa (Theobroma cacao L.) to the Well-being of Cocoa Families in Colombia: A Response from the Relationship. Agric. Hum. Values 2024, 42, 461–484. [Google Scholar] [CrossRef]
  55. Tittonell, P.; El Mujtar, V.; Felix, G.; Kebede, Y.; Laborda, L.; Luján Soto, R.; de Vente, J. Regenerative Agriculture—Agroecology without Politics? Front. Sustain. Food Syst. 2022, 6, 844261. [Google Scholar] [CrossRef]
  56. Lucantoni, D.; Mottet, A.; Bicksler, A.; De Rosa, F.; Scherf, B.; Scopel, É.; López-Ridaura, S.; Gemmil-Herren, B.; Bezner Kerr, R.; Sourisseau, J.M.; et al. Évaluation Des Transitions Vers Des Systèmes Agricoles et Alimentaires Durables: Un Outil Pour l’évaluation Des Performances Agroécologiques (TAPE). Agron. Polit. Agric. Commune Rev. AES 2021, 11, 1–19. [Google Scholar] [CrossRef]
  57. Levard, L. Guide Pour l’évaluation de l’agroécologie. Méthode Pour Apprécier Ses Effets et Les Conditions de Son Développement; Éditions du Gret/Éditions Quæ: Versailles, France, 2023; ISBN 978-2-7592-3646-6. [Google Scholar]
  58. Nicholls, C.; Altieri, M.; Dezanet, A.; Lana, M.; Feistauer, D.; Ouriques, M. A Rapid, Farmer–Friendly Agroecological Method to Estimate Soil Quality and Crop Health in Vineyard Systems. Biodynamics 2004, 33–39. [Google Scholar]
  59. FAO; FHI. 360 Minimum Dietary Diversity for Women: A Guide to Measurement; FAO: Rome, Italy, 2016; ISBN 978-92-5-109153-1. [Google Scholar]
  60. IFPRI. Instructional Guide on the Abbreviated Women’s Empowerment in Agriculture Index (A-WEAI); Malapit, H., Kovarik, C., Sproule, K., Meinzen-Dick, R., Quisumbing, A., Eds.; International Food Policy Research Institute: Washington, DC, USA, 2015. [Google Scholar]
  61. Posit Team. RStudio: Integrated Development Environment for R, Version 2025.05.04; Posit Software: Boston, MA, USA, 2025.
  62. R Core Team. A Language and Environment for Statistical Computing; R Foundation for Statistical Computing: Vienna, Austria, 2025. [Google Scholar]
  63. Pebesma, E.; Bivand, R.; Racine, E.; Sumner, M.; Cook, I.; Keitt, T.; Lovelace, R.; Wickham, H.; Ooms, J.; Müller, K.; et al. Sf: Simple Features for R; CRAN: Vienna, Austria, 2025. [Google Scholar]
  64. de Vries, P.; Piet, G.; Jongbloed, R.; Grundlehner, A.; Tamis, J. Ggsankeyfier: Create Sankey and Alluvial Diagrams Using “Ggplot2”; CRAN: Vienna, Austria, 2024. [Google Scholar]
  65. Lupton, R.C.; Allwood, J.M. Hybrid Sankey Diagrams: Visual Analysis of Multidimensional Data for Understanding Resource Use. Resour. Conserv. Recycl. 2017, 124, 141–151. [Google Scholar] [CrossRef]
  66. Schmidt, M. The Sankey Diagram in Energy and Material Flow Management. J. Ind. Ecol. 2008, 12, 173–185. [Google Scholar] [CrossRef]
  67. Balzarini, M.G.; Gonzalez, L.; Tablada, M.; Casanoves, F.; Di Rienzo, J.A.; Robledo, C.W. InfoStat. Manual Del Usuario; Editorial Brujas: Córdoba, Argentina, 2008. [Google Scholar]
  68. Di Rienzo, J.A.; Casanoves, F.; Balzarini, M.G.; Gonzalez, L.; Tablada, M.; Robledo, C.W.; Di Rienzo, J.A.; Casanoves, F.; Balzarini, M.G.; Gonzalez, L.; et al. InfoStat; Grupo InfoStat: Cordoba, Argentina, 2020. Version 2020.
  69. Wezel, A.; Herren, B.G.; Kerr, R.B.; Barrios, E.; Gonçalves, A.L.R.; Sinclair, F. Agroecological Principles and Elements and Their Implications for Transitioning to Sustainable Food Systems. A Review. Agron. Sustain. Dev. 2020, 40, 40. [Google Scholar] [CrossRef]
  70. Nicholls, C.I.; Altieri, M.A. Pathways for the Amplification of Agroecology. Agroecol. Sustain. Food Syst. 2018, 42, 1170–1193. [Google Scholar] [CrossRef]
  71. Pizarro, D.M.; Erickson, M.G.; Gómez-Bravo, C.A.; Picasso, V.D.; Lucantoni, D.; Mottet, A.; Wattiaux, M.A. Agroecological Performance of Smallholder Dairy Cattle Systems in the Peruvian Amazon. Agric. Syst. 2025, 223, 104199. [Google Scholar] [CrossRef]
  72. Gliessman, S. Transforming Food Systems with Agroecology. Agroecol. Sustain. Food Syst. 2016, 40, 187–189. [Google Scholar] [CrossRef]
  73. Tittonell, P. Assessing Resilience and Adaptability in Agroecological Transitions. Agric. Syst. 2020, 184, 102862. [Google Scholar] [CrossRef]
  74. Wordofa, M.G.; Aweke, C.S.; Endris, G.S.; Tolesa, G.N.; Lemma, T.; Hassen, J.Y.; Lucantoni, D.; Mottet, A. Economic, Environmental and Social Indicators of Sustainability among Smallholders in Ethiopia: Based on Tool for Agroecological Performance Evaluation Data. Data Brief 2024, 52, 109988. [Google Scholar] [CrossRef]
  75. Rodríguez-León, C.H.; Sterling, A.; Trujillo-Briñez, A.; Suárez-Córdoba, Y.D.; Roa-Fuentes, L.L. Forest Attribute Dynamics in Secondary Forests: Insights for Advancing Ecological Restoration and Transformative Territorial Management in the Amazon. Diversity 2025, 17, 39. [Google Scholar] [CrossRef]
  76. Tittonell, P.; Piñeiro, G.; Garibaldi, L.A.; Dogliotti, S.; Olff, H.; Jobbagy, E.G. Agroecology in Large Scale Farming—A Research Agenda. Front. Sustain. Food Syst. 2020, 4, 584605. [Google Scholar] [CrossRef]
  77. Aweke, C.S.; Wordofa, M.G.; Endris, G.S.; Tolesa, G.N.; Tefera, T.L.; Hassen, J.Y.; Lucatoni, D.; Mottet, A. The Interface between Agroecology and Dietary Diversity: Evidence from Rural Ethiopia. Agroecol. Sustain. Food Syst. 2025, 49, 543–562. [Google Scholar] [CrossRef]
  78. Marino, D.; Curcio, F.; Felici, F.; Mazzocchi, G. Toward Evidence-Based Local Food Policy: An Agroecological Assessment of Urban Agriculture in Rome. Land 2023, 13, 30. [Google Scholar] [CrossRef]
  79. Costa-Pereira, I.; Aguiar, A.A.R.M.; Delgado, F.; Costa, C.A. A Methodological Framework for Assessing the Agroecological Performance of Farms in Portugal: Integrating TAPE and ACT Approaches. Sustainability 2024, 16, 3955. [Google Scholar] [CrossRef]
  80. Altieri, M.A.; Nicholls, C.I.; Henao, A.; Lana, M.A. Agroecology and the Design of Climate Change-Resilient Farming Systems. Agron. Sustain. Dev. 2015, 35, 869–890. [Google Scholar] [CrossRef]
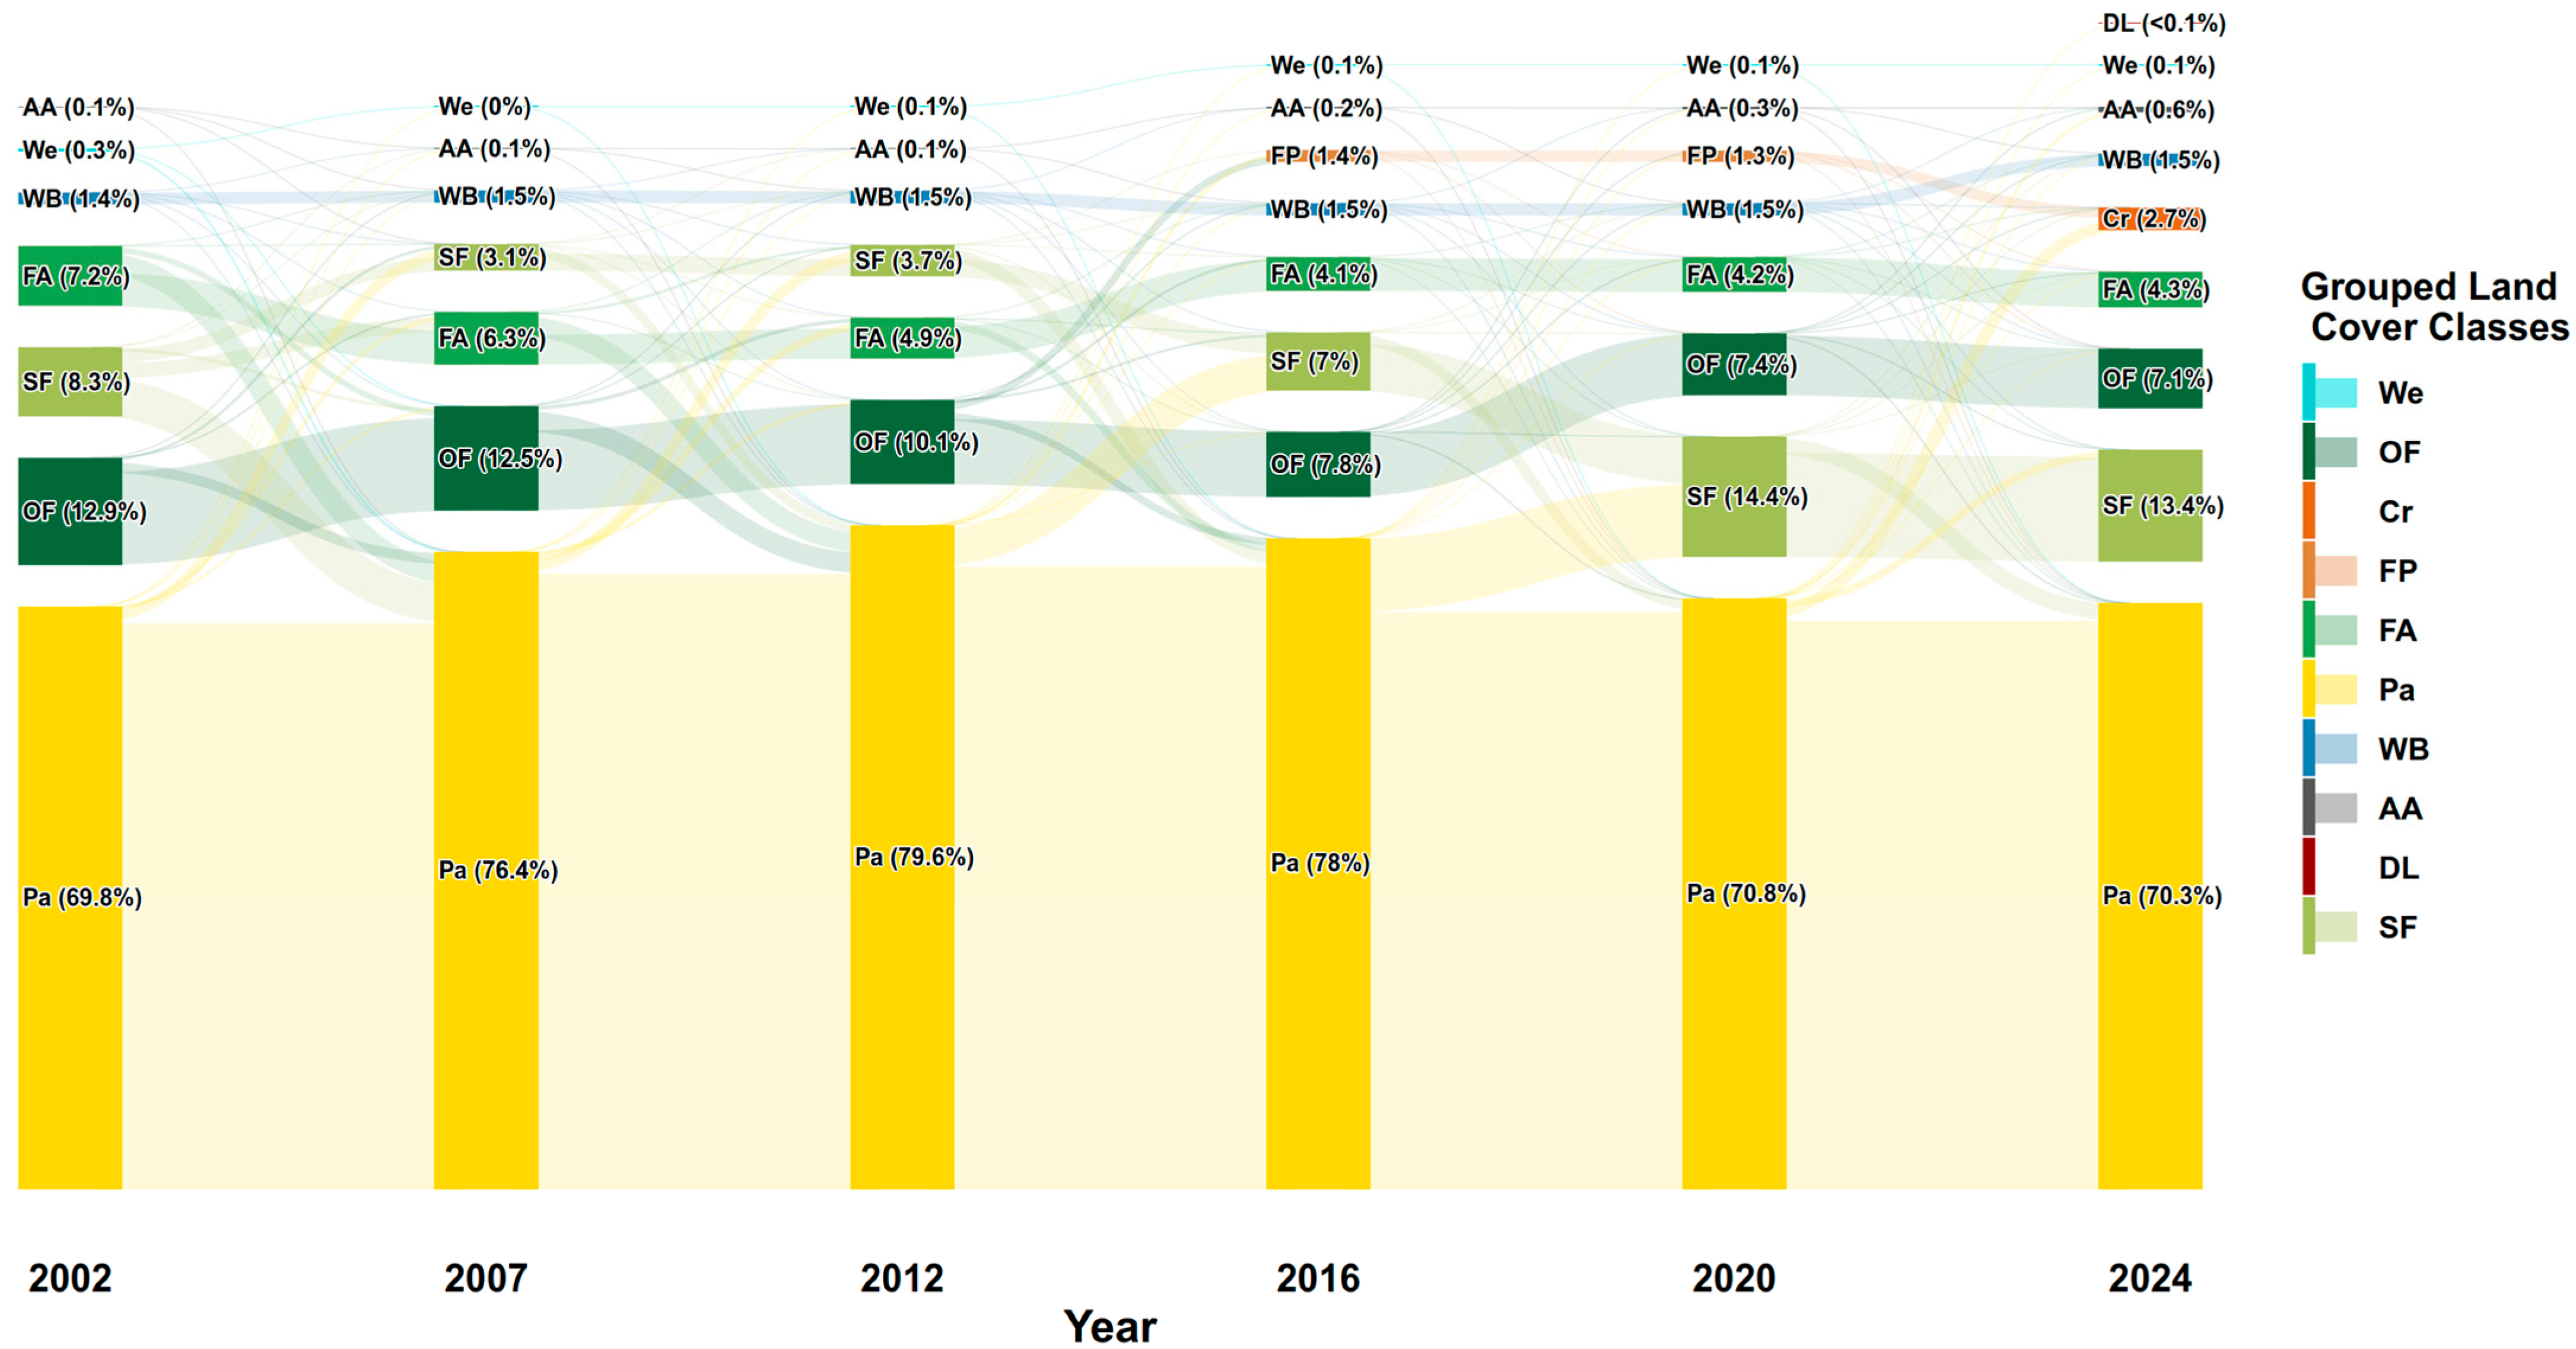
Figure 1. Multitemporal Sankey diagram illustrating land cover change flows between 2002 and 2024 within a 2 km buffer around 25 farms located in the Colombian Andean–Amazon Transition Zone. The links between nodes represent the area transitions among land cover categories across each time interval. Wetlands (We), Old-growth Forests (OF), Crops (Cr), Forest Plantations (FP), Fragmented Areas (FA), Pastures (Pa), Water Bodies (WB), Artificial Areas (AA), Degraded Lands (DL), and Secondary Forests (SF).
Sustainability 17 09024 g001
Figure 2. Average land use by farm typology (ha). Large Crop-Livestock Farms (LCLF), Mixed Livestock Farms (MLF), Family Cattle Farms (FCF), and Mixed Family Farms (MFF).
Sustainability 17 09024 g002
Figure 3. Boxplots showing average CAET scores (%) by farm typology identified in the Colombian Andean–Amazon Transition Zone. Large Crop-Livestock Farms (LCLF), Mixed Livestock Farms (MLF), Family Cattle Farms (FCF), and Mixed Family Farms (MFF).
Sustainability 17 09024 g003
Figure 4. Correlation matrix between the Agroecology Elements scores and performance indicators. Gross Value of Production per Utilized Agricultural Area (GVP/UAA), Gross Value of Production per Agricultural Work Unit (GVP/AWU), Net Value Added per Utilized Agricultural Area (VA/UAA), Net Value Added per Agricultural Work Unit (VA/AWU), Intermediate Consumption per Agricultural Work Unit (IC/AWU), Net Income per Agricultural Work Unit (NI/AWU), Production System Autonomy (VA/GVP), Perceived Income Evolution (PIE), Integrated Pest and Disease Management Index (IPDMI), Chemical Pesticide Expenditure per Agricultural Work Unit (CPE/AWU), Soil Health Index (SHI), Chemical Fertilizer Expenditure per Agricultural Work Unit (CFE/AWU), Crop Diversity Index (CDI), Livestock Diversity Index (LDI), Natural Vegetation and Pollinator Presence on Farm (NVPPF), Dietary Diversity Index (DDI), Household Food Self-Consumption Expenditure per Person (HSCE), Youth Opportunity Index (YOI), Youth Retention Index (YRI), Young Household Members Employed on the Farm (YHMEF), Women Employed on the Farm (WEF), Family Members Employed on the Farm (FMEF), Abbreviated Women’s Empowerment in Agriculture Index (A-WEAI), Diversity (Div), Synergies (Syn), Efficiency (Eff), Recycling (Rec), Resilience (Res), Culture and Food Traditions (CFT), Co-creation and Knowledge Sharing (CKS), Human and Social Values (HSV), Circular and Solidarity Economy (CSE), and Responsible Governance (RG). Colors indicate correlation strength and direction (red = negative, blue = positive). * Significant (p < 0.05), ** Very significant (p < 0.01), *** Highly significant (p < 0.001).
Sustainability 17 09024 g004
Figure 5. Relationships between agroecological transition typologies (CAET) and key performance indicators in the Andean–Amazon transition zone, Caquetá, Colombia. (A) shows the Gross Value of Production per Utilized Agricultural Area (GVP/UAA) and the Net Value Added per Utilized Agricultural Area (VA/UAA). (B) shows the Production System Autonomy (VA/GVP), Perceived Income Evolution (PIE), Crop Diversity Index (CDI), and Natural Vegetation and Pollinator Presence on Farm (NVPPF).
Sustainability 17 09024 g005
Table 1. Summary of indicators used to assess and interpret the characterization of agroecological transition (CAET).
ElementIndexMethodology
Diversity (Div)CropsCAET Score 0–100% [39,42]
Interpretation of CAET scores [56]:
>70%: agroecological system; 60–70%: in agroecological transition; 50–60%: early-stage transition; <50%: not agroecological.
Animals (including fish and insects)
Trees (and other perennials)
Diversity of activities, products, and services
Synergies (Syn)Crop–livestock integration
Soil–plant system management
Integration with trees (agroforestry, silvopastoral, agrosilvopastoral systems)
Connectivity among agroecosystem elements and the surrounding landscape
Efficiency (Eff)Use of external inputs
Soil fertility management
Pest and disease management
Productivity and household needs
Recycling (Rec)Biomass and nutrient recycling
Water conservation and efficiency
Seed and breed management
Use and production of renewable energy
Resilience (Res)Stability of production and capacity to withstand disturbances
Mechanisms to reduce vulnerability
Environmental resilience and climate change adaptation capacity
Level of indebtedness
Average diversity
Culture and food traditions (CFT)Adequate diet and nutritional knowledge
Traditional identity and awareness (peasant/indigenous)
Integration of local varieties and traditional knowledge into food preparation
Co-creation and knowledge sharing (CKS)Platforms for horizontal knowledge creation and sharing of good practices
Access to agroecological knowledge and farmers’ interest in agroecology
Participation of farmers in grassroots networks and organizations
Human and social values (HSV)Women’s empowerment
Labor (productive conditions and social inequalities)
Youth empowerment and migration
Animal welfare [if applicable]
Circular and solidarity economyLocally marketed products and services
Producer networks, consumer relations, and role of intermediaries
Local food system
Responsible governanceEmpowerment and social justice for producers
Producer organizations and associations
Farmer participation in land and natural resource governance
Table 2. Summary of indicators and methods used to assess and interpret the performance of agricultural systems.
DimensionIndicatorMethodology
EconomicGross Value of Production per Utilized Agricultural Area (GVP 1/UAA 2)GVP = Gross output—Intraconsumption [57]
Gross Value of Production per Agricultural Work Unit (GVP/AWU 3)
Net Value Added per Utilized Agricultural Area (VA/UAA)VA = GVP—Intermediate consumption (e.g., seeds, fertilizers, pesticides, feed, veterinary services, fuel, energy, machinery, equipment, maintenance)—Depreciation [57]
Net Value Added per Agricultural Work Unit (VA/AWU)
Intermediate Consumption per Agricultural Work Unit (IC/AWU)Total sum of all intermediate consumption divided by agricultural work units
Net Income per Agricultural Work Unit (NI/AWU)NI = VA—Cost of all external inputs (e.g., rent, taxes, interest, salaried labor, transport, other services) + Subsidies [57]
Production System Autonomy (VA/GVP)Ratio (−1 to 1) of NAV to GPV; an indirect indicator of efficiency [31,57]
Perceived Income Evolution (PIE) Score > 50: increasing income trend; Score = 50: stable income; Score < 50: decreasing income trend [30]
EnvironmentalIntegrated Pest and Disease Management Index (IPDMI 4)Score of 100 indicates high implementation of IPM practices and low pesticide use; score of 0 indicates low implementation and high pesticide use
Chemical Pesticide Expenditure per Agricultural Work Unit (CPE/AWU)Sum of expenses on chemical pesticides per agricultural work unit
Soil Health Index (SHI)Score of 5 indicates very good soil health; score of 1 indicates poor soil health (adapted from [58], modified by [39])
Chemical Fertilizer Expenditure per Agricultural Work Unit (CFE/AWU)Sum of expenses on chemical fertilizers per agricultural work unit
Crop Diversity Index (CDI)Gini-Simpson index of crop and livestock diversity [39]
Livestock Diversity Index (LDI)
Natural Vegetation and Pollinator Presence on Farm (NVPPF)Score of 100 indicates high presence of natural vegetation and pollinators; score of 0 reflects very low or absent presence [39]
SocialDietary Diversity Index (DDI)Score of 100 indicates high diversity of food group consumption; score of 0 reflects low consumption diversity [39,59]
Household Food Self-Consumption Expenditure per Person (HSCE)Sum of household food expenses for self-consumption divided by the number of farm residents
Youth Opportunity Index (YOI)Score of 100 indicates high availability of training and employment opportunities for youth; score of 0 indicates very limited or no opportunities [39]
Youth Retention Index (YRI) Score of 100 indicates strong desire of youth to remain in agriculture; score of 0 indicates willingness to migrate and lack of agricultural future perception [39]
Young Household Members Employed on the Farm (YHMEF 5)Household composition data [30,39]
Women Employed on the Farm (WEF 5)
Family Members Employed on the Farm (FMEF 5)
Abbreviated Women’s Empowerment in Agriculture Index (A-WEAI)Abbreviated index measuring women’s empowerment in agriculture (adapted from [60], modified by [39])
1 Value expressed in Colombian pesos (COP). 2 Value expressed in hectares (ha). 3 Number of agricultural workers fully available throughout the year (Agricultural Work Unit, AWU). 4 Value expressed as a percentage (%). This index was calculated as the average of the normalized variables [amount of synthetic pesticides applied per hectare (previously log-transformed and 1-variable normalized), use of mitigation techniques, use of ecological management practices, perception of the importance of pesticides, and use of antibiotics] on a 0–1 scale. 5 Value expressed as a percentage.
Table 3. Average agroecological transition score (CAET, %) and scores for the 10 Elements of Agroecology across the four identified farm typologies.
Farm TypologyCAETDivSynEffRecResCFTCKSHSVCSERG
LCLF5255503140626053555555
MLF5658583846616055566758
FCF4948513442555348535051
MFF6065654855617063566557
Large Crop-Livestock Farms (LCLF), Mixed Livestock Farms (MLF), Family Cattle Farms (FCF), and Mixed Family Farms (MFF). Diversity (Div), Synergies (Syn), Efficiency (Eff), Recycling (Rec), Resilience (Res), Culture and Food Traditions (CFT), Co-creation and Knowledge Sharing (CKS), Human and Social Values (HSV), Circular and Solidarity Economy (CSE), and Responsible Governance (RG). Colors represent a gradient of performance, with red indicating lower values, yellow intermediate values, and green higher values.
Table 4. Results of economic performance indicators by farm typology.
Farm TypologyGVP/UAA (COP)GVP/AWU (COP)VA/UAA (COP)VA/AWU (COP)IC/AWU (COP)NI/AWU (COP)VA/GVPPIE
LCLF2,001,51222,724,1441,088,45112,803,468828,7358,351,2600.5650
MLF13,794,23232,519,5629,424,96318,503,4354,132,13914,417,0360.5860
FCF3,490,34915,675,4201,877,9699,262,1171,524,7386,846,3630.6075
MFF4,563,5757,877,6462,662,6715,695,8461,746,2754,451,2570.6980
Large Crop-Livestock Farms (LCLF), Mixed Livestock Farms (MLF), Family Cattle Farms (FCF), and Mixed Family Farms (MFF). Gross Value of Production per Utilized Agricultural Area (GVP/UAA), Gross Value of Production per Agricultural Work Unit (GVP/AWU), Net Value Added per Utilized Agricultural Area (VA/UAA), Net Value Added per Agricultural Work Unit (VA/AWU), Intermediate Consumption per Agricultural Work Unit (IC/AWU), Net Income per Agricultural Work Unit (NI/AWU), Production System Autonomy (VA/GVP), Perceived Income Evolution (PIE), and COP = Colombian Pesos.
Table 5. Results of environmental sustainability indicators by farm typology.
Farm TypologyIPDMICPE/AWU (COP)SHICFE/AWU (COP)CDILDINVPPF
LCLF37122,8073.7642,438225970
MLF3480,9303.506250133877
FCF25100,5723.916964244875
MFF5448,9894.244766645397
Large Crop-Livestock Farms (LCLF), Mixed Livestock Farms (MLF), Family Cattle Farms (FCF), and Mixed Family Farms (MFF). Integrated Pest and Disease Management Index (IPDMI), Chemical Pesticide Expenditure per Agricultural Work Unit (CPE/AWU), Soil Health Index (SHI), Chemical Fertilizer Expenditure per Agricultural Work Unit (CFE/AWU), Crop Diversity Index (CDI), Livestock Diversity Index (LDI), Natural Vegetation and Pollinator Presence on Farm (NVPPF), and COP = Colombian Pesos.
Table 6. Results of social sustainability indicators by farm typology.
Farm TypologyDDIHSCE (COP)YOIYRIYHMEF (%)WEF (%)FMEF (%)A-WEAI
LCLF842,328,000938383546547
MLF841,897,600753831626564
FCF762,245,200846663777753
MFF841,635,000945067798562
Large Crop-Livestock Farms (LCLF), Mixed Livestock Farms (MLF), Family Cattle Farms (FCF), and Mixed Family Farms (MFF). Dietary Diversity Index (DDI), Household Food Self-Consumption Expenditure per Person (HSCE), Youth Opportunity Index (YOI), Youth Retention Index (YRI), Young Household Members Employed on the Farm (YHMEF), Women Employed on the Farm (WEF), Family Members Employed on the Farm (FMEF), Abbreviated Women’s Empowerment in Agriculture Index (A-WEAI), and COP = Colombian Pesos.
Disclaimer/Publisher’s Note: The statements, opinions and data contained in all publications are solely those of the individual author(s) and contributor(s) and not of MDPI and/or the editor(s). MDPI and/or the editor(s) disclaim responsibility for any injury to people or property resulting from any ideas, methods, instructions or products referred to in the content.