Abstract
The “Lucid Waters and Lush Mountains are Invaluable Assets” idea (i.e., “Two Mountains” concept) has charted a new path for balancing economic and ecological needs. To systematically evaluate the extent to which China’s ecological conservation has supported economic development since 2012, an assessment indicator system was established that employs a coupling coordination degree (D) model, the entropy weight method, and statistical analysis. The results revealed significant correlations between ecological protection and economic development, and D increased from 2012 to 2023. D in China was good (0.6 < D ≤ 0.8) in this period, which indicates that ecological protection has played a growing role in supporting high-quality economic development and that notable progress has been made in the implementation of the “Two Mountains” concept. Both emission reduction and resource conservation were significantly correlated with D. Reducing carbon emissions and lowering energy consumption had stronger effects on coordinated development than reducing pollutant emissions and increasing water productivity. D was highest in East and South China. The “Two Mountains” concept should be implemented to balance ecological protection and economic development and enhance the economic benefits derived from ecological resources. Management measures should be implemented based on local conditions. Ultimately, these changes would help meet established sustainable development goals.
1. Introduction
On 15 August 2005, Xi Jinping proposed that “lucid waters and lush mountains are invaluable assets,” (i.e., “Two Mountains” concept), during his research trip to Yucun, Anji County. He has repeatedly emphasized and expounded on this concept. The core of the “Two Mountains” concept is the dialectical unity of ecological conservation and economic development, which are mutually reinforcing. Economic growth must not come at the cost of environmental degradation, nor can ecological protection and economic development be treated as separate or opposing goals. This concept systematically argues that protecting the environment means safeguarding productive forces. It has thus helped promote coordinated development and ecological protection.
Since 2012, China has adhered to the “Two Mountains” concept. This has helped promote green development in China, as well as bluer skies, greener mountains, and clearer waters. The environment has become more important for China in recent years, given that ecological considerations are essential for supporting high-quality development. Understanding the impact of the “Two Mountains” concept on China’s ecological conservation and economic development is crucial for supporting China’s high-quality development. Here, over a decade of time-series data were used to evaluate the relationship between China’s environmental quality and economic development under the “Two Mountains” concept.
Practices associated with the “Two Mountains” concept have had transformative effects, as indicated by studies of spatiotemporal variation. Between 2009 and 2021, the coupling coordination degree (D) of China’s ecological environment and economic development (DEE) has increased [1,2,3,4]. The effect of the “Two Mountains” policy has been positive [3]. By 2021, 56.67% of Chinese provinces had entered the coordinated development stage, but improvements in the ecological environment are still needed [4]. China has made significant achievements in environmental governance, economic growth, and social service development. Significant regional differences have been observed within China following the implementation of the “Two Mountains” policy. For example, between 2010 and 2021, DEE in China was highest in the eastern regions [4]. In 2022, the “Two Mountains” policy had a stronger transformative effect on eastern regions and southern regions compared with northern regions [5]. Similarly, a study of 290 Chinese prefecture-level cities has shown that cities with high DEE are mainly located in coastal areas, and DEE gradually decreases inland [6]. DEE has been reported for the Yangtze River Economic Belt [7,8,9,10] and the Yellow River Basin [11,12,13,14]. DEE is also increasing in these regions.
Many studies of DEE in China have focused on specific river basins or provinces. Research at the national level is lacking, and this has limited our understanding of DEE. Although some studies have analyzed DEE using indexes and models, few in-depth analyses of their interaction mechanisms and changes over time have been conducted. Furthermore, some studies have provided descriptions of general patterns and performed correlation analyses; however, the complex causal relationships and inherent laws underlying DEE have not yet been examined. Some indicators fail to accurately reflect the essence of high-quality development in both the ecological environment and the economy.
Here, an evaluation index system was constructed to systematically evaluate how China has implemented the “Two Mountains” concept and promoted economic development and ecological protection since the new era. This system, which employs scientific methods and intuitive data, demonstrates that ecological protection and economic development are not entirely incompatible. The “Two Mountains” concept can help achieve harmony between humans and nature.
2. Materials and Methods
2.1. Index System
Coordinated ecological and economic development tends to progress in the same direction; their development is affected by various interactions between these systems and internal factors. Improvements in ecological quality and economic growth are generally consistent over time. The current status, underlying processes, and efficiency of coordinated ecological and economic development are particularly important. Major current goals include enhancing resource and environmental production efficiency, increasing energy and resource use efficiency, and reducing the environmental impact of economic growth.
In light of this, an evaluation index system was developed based on three perspectives: “lucid waters and lush mountains,” “valuable assets,” and the “link between the two.” This system assesses how high-level ecological protection enhances high-quality economic growth. The “lucid waters and lush mountains” and “valuable assets” indexes quantify the status of ecological and economic development. The linkage indexes, which account for pollution reduction and energy conservation, reveal their interactions. The following principles were considered when selecting indicators: Authority, indicators should be consistent with national requirements; Availability, indicators can be obtained at the provincial level; Logic, indicators should reflect the essence and interactions among protection and development; Inclusiveness: indicators should consider people’s sense of happiness; and Scientific Soundness: experimental data for hard-to-obtain indicators, such as remote-sensing data for the “ecological space proportion (%).” Table 1 shows the index system.

Table 1.
Index System.
2.2. Data Sources and Preprocessing
China’s provincial-level administrative units from 2012 to 2023 were examined; Tibet Autonomous Region, Hong Kong, Macau, and Taiwan were excluded because data were lacking.
Statistical yearbooks and bulletins on the state of the ecological environment were used to obtain indicator data. The China Carbon Accounting Database published by Tsinghua University was used to obtain carbon emission data. The data on ecological space were derived from remote-sensing data. Data were collected over the period 2012–2023. When key indicator data for individual years were missing, linear interpolation was used to fill in the gaps. Tibet Autonomous Region was omitted from our assessment because of extensive gaps in the data.
The data for each indicator were standardized before being assigned weights to eliminate the effects caused by different orders of magnitude, units, and positive and negative indicators of the data. The formulas for data preprocessing are
Negative indicators:
where xij′ is xij after standardization, xij denotes indicator j in year i, and min(xj) and max(xj) are the minimum and maximum values of indicator j, respectively. Per the requirements of the entropy value method calculations, when xij′ = 0, a “shift value” is added to xij; that is, min(xij′) = min(xij′) + 0.001, which ensures that all data are greater than 0.
2.3. Weight Determination
The “lucid waters and lush mountains” and “valuable assets” indicators were each assigned a weight of 0.5. The entropy weight method was used to calculate the indicator weights, which are based on the information conveyed to the decision-maker by each indicator. Using the entropy method for weighting can mitigate subjectivity and information overlap among multiple indicator variables. The calculation formulas are as follows:
where pij represents the proportion of the i-th indicator in the j-th evaluation object, Ei denotes the entropy value of the i-th indicator, k is a constant, and Gij indicates the information utility value of the i-th indicator in the j-th evaluation object. Here, j represents the number of evaluation objects; that is, j = 1, 2, 3, …, n. In this study, 30 provinces are involved in the assessment; thus, n = 30. Additionally, t represents the number of years evaluated; that is, t = 1, 2, 3, …, r. Our study spanned 12 years (from 2012 to 2023); thus, r = 12. wj represents the indicator weight. Table 1 shows the results.
2.4. DEE
“Coupling” refers to the mutual influence of two different systems at a specific time point [20]. This concept has been widely applied [2,6,21,22,23,24,25,26]. A coupling model was established for ecological and socio-economic subsystems with the following formula [27,28]:
where C represents the coupling degree, which determines the coupling effect between the ecological environment and economic development. Values closer to 1 indicate stronger mutual influences. f(EE) denotes the function for evaluating the ecological environment, with higher values indicating higher quality. g(SE) represents the function for evaluating socio-economic development.
where ωEE represents the indicator weights in the ecological environment subsystem, ωSE represents the indicator weights in the socio-economic subsystem, and j denotes the number of evaluation objects. In this study, 30 provinces were included in the assessment; thus, n = 30. νEE and νSE are the normalized values of the indicators in the ecological and socio-economic subsystems, respectively.
The coupling degree is key for evaluating spatiotemporal variation in the interaction between ecological and socio-economic subsystems. However, the coupling degree is not effective for characterizing coordinated development between systems [29]. Therefore, the D model was used to characterize coordinated development, which combines the degree of coupling and coordination [27]:
where D represents the coupling coordination degree between the ecological environment and the socio-economic subsystems. Higher D values indicate higher coordinated development. T is the evaluation index of coordinated development. α and β represent the contributions of the ecological environment subsystem and the socio-economic subsystem to the coupling coordination degree, respectively, and α + β = 1. Assuming that the importance of each subsystem in coordinated development is similar, α = β = 0.5. In light of previous studies, D was divided into different groups (Table 2).

Table 2.
Classification of D.
Finally, statistical regression analysis was used to analyze the relationship of emission reduction and resource-saving indicators with D, which revealed the internal laws regulating coordinated development.
3. Results
3.1. National Status
3.1.1. National Comprehensive Evaluation Scores
Comprehensive evaluation scores increased gradually from 2012 to 2023 (Figure 1A), and the changes were divided into three stages. The average annual growth from 2012 to 2016 was 51.73%. From 2016 to 2020, the average annual growth rate was 7.27%. The growth rate was 1.39% from 2020 to 2023. The comprehensive evaluation score of national economic development increased linearly from 2012 to 2023 (Figure 1B), and two stages of change could be distinguished (31.79% and 21.89% average annual growth rates for 2012–2020 and 2021–2023, respectively).
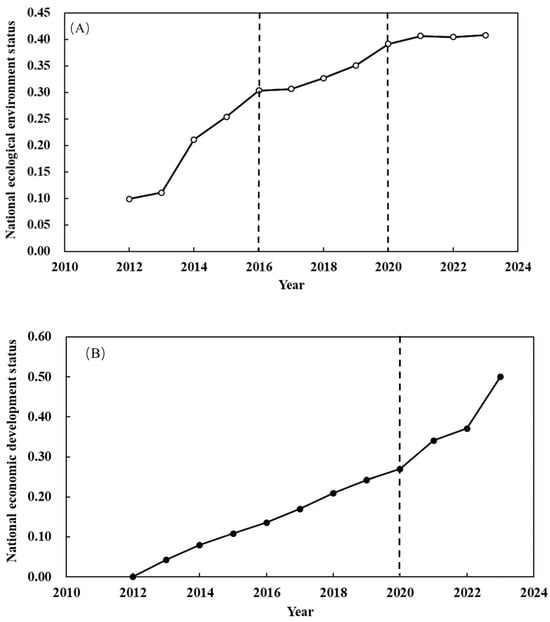
Figure 1.
National ecological environment (A) and economic (B) development status. The dashed lines indicate the critical thresholds between different development states.
3.1.2. National Coordinated Development Status
A significant power-law correlation was observed between the scores of the ecological environment and the economy (R2 = 0.76, p = 0.03; Figure 2), indicating that environmental quality is positively associated with economic growth. D increased over the study period (Figure 3). Before 2014, D was relatively low. Medium D was reached in 2015, and a good coordination level was reached in 2021.
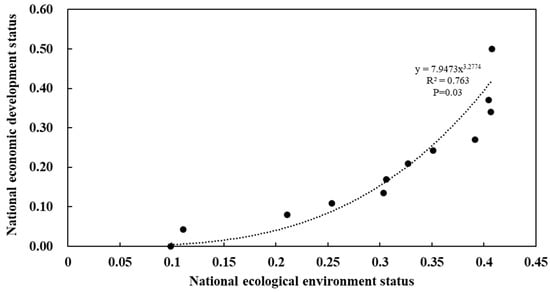
Figure 2.
Correlation between the ecological environment and the economy.
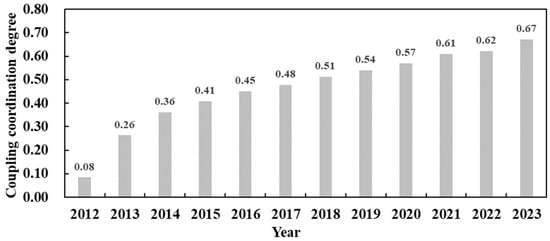
Figure 3.
DEE values nationwide.
3.2. Regional Status
China was divided into seven geographical regions (Table 3), and D was analyzed in each region.

Table 3.
Regional Division.
3.2.1. Regional Comprehensive Evaluation Scores
Evaluation scores of the ecological environment in all regions increased from 2012 to 2023 (Figure 4A). High comprehensive scores were observed in South and Southwest China, followed by East China. Fast growth in these scores was observed in the Northwest and Northeast regions (average annual growth rates of 10.80% and 8.47%, respectively). This was followed by the Central China region (average annual growth rate: 5.27%); average annual growth rates in the other regions were less than 4%. The comprehensive evaluation scores of the economic status in all regions increased linearly from 2012 to 2023 (Figure 4B). High comprehensive scores were observed in East, South, and Central China. High growth rates were observed in Southwest, Northwest, Central, and South China (average annual growth rates of 13.07%, 12.04%, 10.65%, and 10.30%, respectively). Average annual growth rates in other regions were all less than 10%.
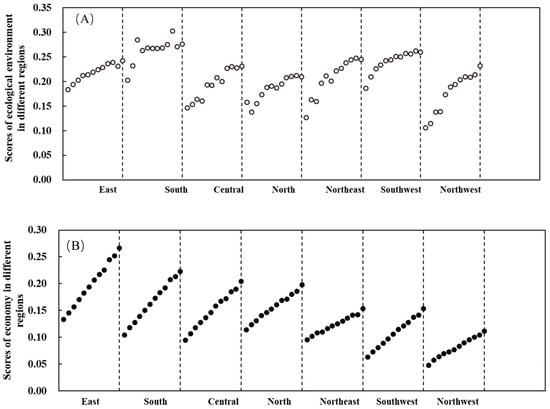
Figure 4.
Comprehensive evaluation scores of ecological environment (A) and economy (B) in different regions.
3.2.2. Regional Coordinated Development Status
Significant exponential correlations were observed in the evaluation scores in the seven geographical regions (Figure 5, p < 0.01). The correlation coefficients were greater than 0.9 for all regions, except for North China (0.87) and South China (0.53). D increased in each region from 2012 to 2023 (Figure 6). D values in the seven geographical regions were divided into four groups. The highest degree of coupling and coordination was observed in South and East China, followed by Central China (second echelon); North, Northeast, and Southwest China (third echelon); and Northwest China (fourth echelon). Transitions from low to medium coupling and coordination in the study period were observed for the first three echelons. Low coupling and coordination were still observed for Northwest China at the end of the study period, but a transition to medium coupling and coordination is imminent. These findings indicate that the “Two Mountains” concept has had a positive impact.
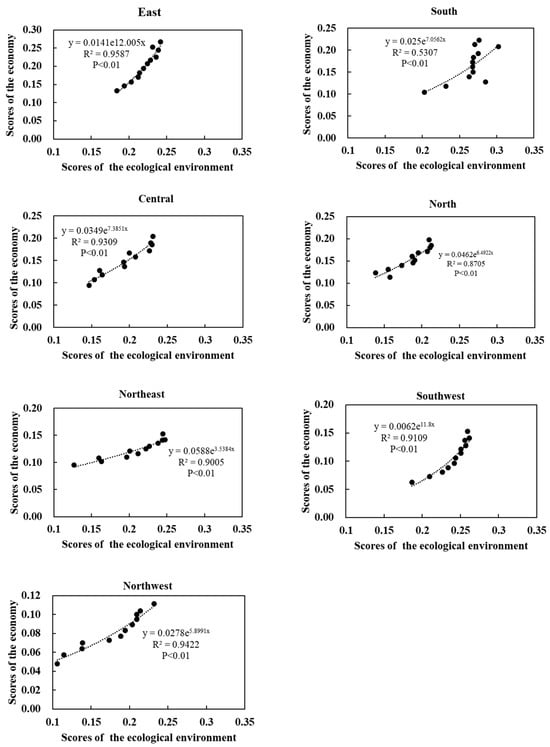
Figure 5.
Correlation between the regional ecological environment and the economy.

Figure 6.
DEE for different regions.
3.3. Influencing Factors
3.3.1. Effect of Emission Reduction
- (1)
- National level
At the national level, major pollutants and carbon dioxide emissions were both strongly negatively correlated with D (p < 0.01, Figure 7). D increased as the emissions of pollutants and carbon dioxide decreased. The correlation coefficient (R2 = 0.39, p < 0.01) and the slope of the line (k = −1.35) were greater between carbon emissions per unit of GDP and D than between the emissions of major pollutants and D (R2 = 0.05, p < 0.01 and k = −0.58). In the new development stage, reducing carbon emissions has affected DEE. This is consistent with China’s current development status and relevant management policies. For example, the “Opinions on Further Strengthening the Fight Against Pollution” in 2021 proposed that carbon reduction became the main strategic direction of China’s ecological civilization construction [30]. Reductions in pollutants and carbon emissions are needed to improve environmental quality.
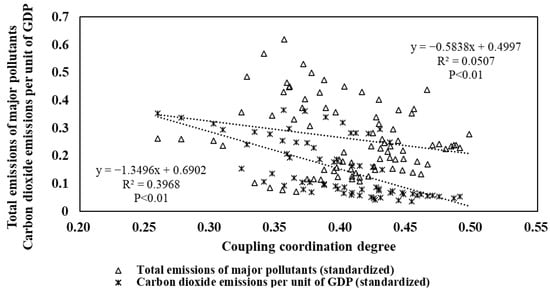
Figure 7.
Correlations between total emissions, carbon emissions per unit of GDP nationwide, and D.
- (2)
- Regional level
Major pollutants and carbon dioxide emissions in all regions were strongly negatively correlated with D (p < 0.01, Figure 8). Reductions in major pollutants had the most significant effect on the coupled development in North China; the slope (k = −3.18) and correlation coefficient (R2 = 0.66) in the linear regression equation were highest for the North China region. In contrast, small slopes and correlation coefficients were observed in the linear regression equations for the Northwest, Southwest, and South China regions, indicating that reductions in major pollutants in these regions have a relatively smaller effect on coupled development; other regions fell in between these extremes. Similarly, reductions in carbon emissions had the strongest effect on the coupled development in North China, as the largest slope (k = −1.05) and correlation coefficient (R2 = 0.61) in the linear regression equation were observed for this region. This was followed by the Southwest region and then the East China and South China regions, indicating that carbon emissions have a relatively smaller effect on the coupled development in these regions; other regions fell in between these extremes.
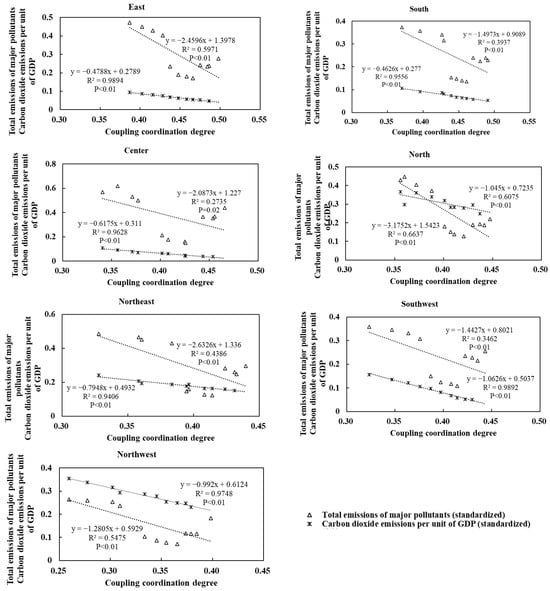
Figure 8.
Correlations of total regional pollutant emissions and carbon emissions per unit of GDP with D.
3.3.2. Effect of Resource Conservation
- (1)
- National level
The water resource productivity was strongly positively correlated with D (p < 0.02), and D was negatively correlated with energy consumption per unit of GDP (p > 0.01, Figure 9). The water resource productivity was exponentially correlated with D (R2 = 0.40), and D increased exponentially when the water resource productivity exceeded a certain threshold. The energy consumption per unit of GDP was linearly correlated with D (R2 = 0.65). Reducing energy consumption and improving energy utilization efficiency affect the coordinated development of the environment and economy.
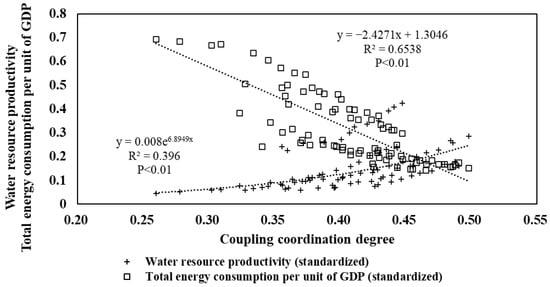
Figure 9.
The correlation between national water resource productivity, total energy consumption per unit of GDP, and D.
- (2)
- Regional level
The water resource productivity in each region was strongly exponentially correlated with D (p < 0.01, Figure 10). The R2 values for all six regions were greater than 0.9, with the exception of the Northeast region (R2 of 0.89); the R2 values for East China and Central China reached 0.99. As the water resource productivity increased, D increased exponentially. Energy consumption per unit of GDP was strongly linearly correlated with D. The R2 values of all regions were greater than 0.9, with the exception of Central China and Southwest China. The largest linear coefficient was observed for the East China region, followed by Northeast, North, South, and Northwest China; linear coefficients were lowest for Southwest and Central China. Overall, D increased linearly as energy consumption decreased.
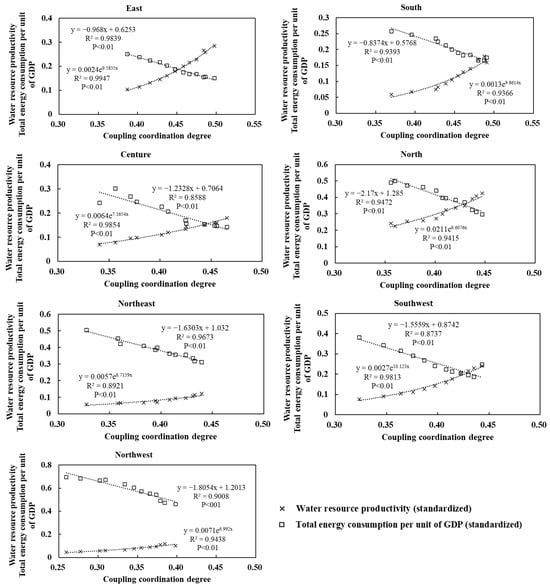
Figure 10.
The correlation between water resource productivity, total energy consumption per unit of GDP, and D in each region.
4. Discussion
4.1. Development Status
Environmental quality has gradually increased in China, and the comprehensive evaluation score has increased with improvements in ecological environment governance. Since 2012, China has been committed to addressing environmental problems. Comprehensive planning for ecological civilization construction and ecological environment protection has been performed, and various long-term projects have been implemented. From 2013 to 2016, China developed the “three tens” action plans for pollution control. During the 13th and 14th Five-Year Plans, China aimed to improve the health of the land, air, and water by designating ecological protection red lines and establishing a protected area system. These measures have significantly reduced pollutant emissions and improved environmental quality. Various challenges need to be addressed to promote ecological civilization construction. In 2020, China officially proposed its “Carbon Peaking and Carbon Neutrality” goals, which marked the entry of a new strategic phase of ecological civilization construction with carbon reduction as the key focus. A major goal now is to coordinate pollution control and climate change responses. Achieving continuous improvement in the ecological environment has become challenging, and the growth rate of the comprehensive evaluation score for ecological environment quality has decreased.
The fundamental trend of sustained improvement in China’s economy remains unchanged. The comprehensive evaluation scores of economic development can be divided into two stages, which are consistent with China’s current development trajectory. Since 2012, high-quality development has been prioritized in China’s national governance. The 19th National Congress report noted that China’s economy entered a high-quality development phase. Currently, China is aiming to transform development models. A modern economic system is critically important for overcoming these challenges and is a strategic goal for China’s development. In 2021, China aimed to become a modern socialist country, with high-quality development being the primary focus. Promoting high-quality economic development requires qualitative changes that ultimately lead to quantitative growth. The growth rates of China’s comprehensive economic development evaluation scores were altered before and after this transition.
4.2. Coordinated Development Status
D of the ecological environment and economy increased over the study period, and this is consistent with observed gradual increases in the strength of this relationship [31]. The economy is moving toward low-carbon development. This reflects the positive impact of the “Two Mountains” concept, as resource conservation and ecological protection have become key priorities. Efforts to increase D are gaining traction. A healthy ecological environment provides a solid foundation for economic development, attracting investment and promoting industrial innovation. Economic development, in turn, supports ecological [32] protection by promoting technological innovation and industrial upgrading, improving resource efficiency, and reducing pollution. This creates a positive interaction between economic growth and ecological conservation, advancing sustainable development [33,34]. Ecological and socio-economic factors influence the eco-landscape in various ways. The eco-landscape is key to mitigating the economic–ecological incompatibilities [35]. Comprehensive scores of the ecological environment and economic development were exponentially correlated. This reflects the complex and dynamic nature of their positive interactions [4].
4.3. Regional Differences
Variation in D was observed among regions. For example, ecosystem services per unit area in China are higher in the east and south and lower in the west and north. Human activities have diverse effects on ecosystems [32].
D was highest in East and South China. This indicates that high-quality development is promoted by mutual interactions between the environmental and economic systems. Resource conservation had a significant effect on their coordinated development, while emission reduction had a relatively weak effect. These regions have developed economies with advantageous industrial structures and a focus on low-pollution, high-value-added industries such as technology and services, which have minimal negative ecological impacts and limited emission reduction potential. Resource conservation and high utilization efficiency are emphasized during development to alleviate environmental pressure, promote green economic growth, and foster positive interactions between the ecological environment and the economy.
D was high in Central China. However, the comprehensive score of the ecological environment was not very high, indicating that the ecological environment can still promote high-quality economic development. Resource conservation significantly affected D, and emission reduction had a moderate effect on D. Central China has a diverse industrial structure with a high proportion of industry, and this poses a major challenge for ecological governance. As the application of the “Two Mountains” concept improves, the ecological environment will promote high-quality economic development.
D was average in North, Northeast, and Southwest China, indicating that further improvement is needed in these regions [23]. In North China, the comprehensive scores of both the ecological and economic systems were moderate. The region’s industrial structure is dominated by heavy industry, which leads to high emissions of waste gases and wastewater. The extensive use of coal results in high carbon emissions. Additionally, water resources are scarce and are often not sufficient for meeting the needs of both the ecological environment and economic development. High energy-consuming industries comprise a significant proportion of industries, which makes them a major source of pollutant emissions and carbon emissions; these industries also have major effects on water resource productivity and energy consumption and thus implications for D. This poses substantial challenges for eco-economic development in North China. In Northeast China, the comprehensive score of the ecological environment increased rapidly over the study period. However, the scale of the traditional industrial sector is large, and pollutant emissions of this sector are high. Due to the challenges associated with industrial restructuring, the effects of energy-saving and emission-reduction measures are often not immediate; consequently, emission reduction and resource conservation have moderate effects on D. In Southwest China, the evaluation score of the ecological environment was high, and that of economic development is increasing rapidly. Carbon emissions, water resource productivity, and energy consumption have major effects on D.
D was relatively low in Northwest China. However, the comprehensive scores in this region increased rapidly over the study period, and the correlation between the two sets of scores was high. As a result, D is expected to gradually increase in the future. The ecological environment in Northwest China is fragile, and water resources are scarce. Thus, the efficient utilization of energy in this region significantly affects both the ecological environment and economic development. Water resource productivity was the most prominent driver of D. The “Two Mountains” concept has had a positive impact in this region.
4.4. Limitations and Future Research Goals
Several limitations require consideration. First, GDP has well-recognized limitations: it omits social and environmental costs such as pollution and crime, only captures material consumption, and therefore fails to reflect broader dimensions of well-being and quality of life, such as work–life balance, health, and education. To address this, GDP data were complemented with data on the (i) per capita GDP growth rate (%) and (ii) the urban–rural per capita disposable income ratio (%), which jointly provide a more nuanced view of living standards. Nevertheless, GDP remains a concise and transparent measure that enables comparisons of economic performance over time and across countries and regions. It is built on decades-long, widely available statistical series and employs well-established national accounting methodologies, making it readily understandable to the public, the media, and policymakers.
All indicators were aggregated into a single index, which inevitably entails a high degree of generalization and increases the uncertainty of the results. Nevertheless, quantitative exploration of the relationship between ecological protection and economic development can help clarify interactions between the environment and the economy.
CCD is likely influenced by natural endowments, policy interventions, and cross-boundary effects, leading to spatial non-independence [36,37,38]. Although our model controls for forest coverage and the proportion of ecological space, the results may still deviate from reality and not fully capture DEE.
In the future, more refined indicators need to be adopted, methodological designs need to be improved, and a broader array of modeling techniques should be employed. These efforts will allow more precise assessments of conditions in each province and city and support tailored, evidence-based policy recommendations.
5. Conclusions
5.1. Conclusions
Interactions between the ecological environment and economic development are complex, dynamic, and generally positive. China’s ecological environment has gradually improved due to the implementation of the “Two Mountains” policy, and comprehensive evaluation scores for the ecological environment and the economy have increased. This has enhanced DEE, which means that the synergy between the ecological environment and economic growth has increased. Emission reduction and resource conservation both enhance D. Specifically, carbon emission reduction has a stronger effect on D than pollutant reduction, and reductions in energy consumption are more effective than improving water-resource output efficiency for promoting coordinated ecological and economic development.
5.2. Recommendations
The “Two Mountains” concept aligns with the laws of human social development. Achieving a Beautiful China must remain a central priority. Achieving this will require targeted, science-based, and law-based approaches for pollution control and comprehensive improvements in environmental quality. Development should be planned to promote harmony between humanity and nature, with green and low-carbon growth. The green transformation of the economy and society also needs to be accelerated, and a solid ecological foundation is needed to support economic development. Institutions and mechanisms for translating the “Two Mountains” concept into practice need to be improved, and the institutional underpinnings of ecological civilization should be strengthened. Vigorous public promotion of the concept is needed to promote ecological civilization and garner broad public support for building a Beautiful China. Active participation in global climate and environmental governance will be needed to create a fair, reasonable, and mutually beneficial global environmental-governance system that forges a shared path toward ecological civilization.
The “Two Mountains” concept should be embraced, and development should be planned strategically. Economic activities and human behaviors need to be strategically controlled. A shift away from traditional models of production and consumption is needed to promote changes in quality and efficiency. There is also a need to clarify the value of ecological products and convert the ecological value of our natural endowments into tangible economic benefits.
Management policies that employ different measures based on local ecosystem and economic conditions are needed. Socio-economic factors across different periods and regions also require consideration.
East and South China: Positive interactions between the ecological environment and the economy need to be strengthened. The growth of high-tech and service industries with higher value and lower energy consumption needs to be promoted. Resource conservation should be enhanced, and the efficiency of resource utilization should be increased. New paths for resource development and recycling should be generated. Investment in green technology should be increased. Corporate innovation should be encouraged to enhance emission reduction and energy-saving technologies and reduce pollutant emissions during production. Ecological industries need to be developed to achieve breakthroughs in the coordination of ecological and economic development.
Central China: The industrial structure should be further optimized through the development of service industries. The management of the ecological environment and resource conservation should be advanced, and advanced technologies are needed to promote further reductions in emissions. Economic advantages should be derived from ecological advantages, and DEE should be promoted.
North China: The focus in this region should be on optimizing the industrial structure. A transition from the steel and chemical industries to green and low-carbon industries is needed. Emerging industries should be cultivated, energy and resource efficiency should be improved, clean production should be enhanced, and pollutant emission reduction and management should be strengthened to enhance ecological and environmental quality. Breakthroughs in D are needed.
Northeast China: Energy-saving and eco-friendly technologies need to be promoted in traditional industries to reduce pollutant emissions. The growth of emerging industries should be enhanced, strict emission reduction targets should be set, and resource recycling should be promoted to increase resource utilization efficiency.
Southwest and Northwest China: Resource-utilization efficiency should be improved, and ecological protection and restoration should be strengthened. The ecological-economic development models should be explored, and the transformation of ecological resources into economic benefits should be promoted. High-quality economic development should be supported via ecological and environmental protection.
Author Contributions
Conceptualization, H.Y.; Methodology, R.G. and M.Z.; Data curation, M.Z. and M.W.; Writing—original draft, M.Z.; Writing—review & editing, H.Y., R.G. and M.Z.; Funding acquisition, R.G. All authors have read and agreed to the published version of the manuscript.
Funding
This research was funded by National Key Research and Development Program, 2024YFF1306504 and National Natural Science Foundation of China, 42077347.
Institutional Review Board Statement
Not applicable.
Informed Consent Statement
Not applicable.
Data Availability Statement
The original contributions presented in this study are included in the article. Further inquiries can be directed to the corresponding author.
Conflicts of Interest
The authors declare no conflict of interest.
References
- Zhang, H.; Geng, C.; Wei, J. Coordinated development between green finance and environmental performance in China: The spatial-temporal difference and driving factors. J. Clean. Prod. 2022, 346, 131150. [Google Scholar] [CrossRef]
- Ge, Y.; Hu, S.; Song, Y.; Zheng, H.; Liu, Y.; Ye, X.; Ma, T.; Liu, M.; Zhou, C. Sustainable poverty reduction models for the coordinated development of the social economy and environment in China. Sci. Bull. 2023, 68, 2236–2246. [Google Scholar] [CrossRef]
- Ye, R.; Wu, H.; Hu, A.; Mi, Z.; Bian, M. High-quality Development and the “Two Mountains” Conversion: Measurement and Spatio-temporal Evolution. Ecol. Econ. 2023, 39, 211–221, (In Chinese with English Abstract). [Google Scholar]
- Chen, Y. A Study on the Measurement and Prediction of the Coupling and Coordination Relationship Between Ecological Environment and High—Quality Economic Development. Master’s Thesis, Hebei University, Baoding, China, 2024. [Google Scholar]
- You, J.; Chen, Q. A Study on the Measurement of the “Two Mountains” Conversion Index and Spatial Distribution Characteristics across China. Guizhou Soc. Sci. 2024, 10, 120–128, (In Chinese with English Abstract). [Google Scholar]
- Dang, D.; Li, X.; Lyu, X.; Liu, S.; Dou, H.; Li, M.; Wang, K.; Cao, W. Changing of the coordination of socioeconomic development and the environment as sustainable development progresses. Geo. Sus 2025, 6, 100245. [Google Scholar] [CrossRef]
- Ni, L.; Liang, Y. Measuring the Effects of the “Two Mountains” Practice and Its Spatio-Temporal Succession in the Yangtze River Economic Belt. Resour. Dev. Mark. 2022, 38, 1451–1460, (In Chinese with English Abstract). [Google Scholar]
- Cheng, J.; Liu, S.; Huang, C.; Wang, L.; Liu, Z.; Peng, C. Impacts of environmental and socioeconomic factors on gross ecosystem product of the Three Gorges reservoir area, China. Land. Degrad. Dev. 2024, 35, 2824–2839. [Google Scholar] [CrossRef]
- Qian, L.; Cheng, Y. A Study on the Spatio-Temporal Evolution of the Synergistic Development of Eco-Environment and High-Quality Economy in the Yangtze River Delta. J. Zhejiang Shuren Univ. 2024, 24, 77–85, (In Chinese with English Abstract). [Google Scholar]
- Huang, Y.; Li, Y.; Sheng, M.; Li, T.; Shao, J.; Zhao, W. Coupling Response of Ecosystem Service Value to Human Activity Intensity in Mountainous Areas: A Case Study of the Three Gorges Reservoir Hinterland, China. Land. Degrad. Dev. 2025, 36, 1356–1370. [Google Scholar] [CrossRef]
- Gao, Z.; Cheng, L.; Zhang, X. Evaluation of the Coupling and Coordinated Development Level of Economy, Ecology and Water Resources in the Yellow River Basin. Stat. Decis. Mak. 2022, 38, 123–127. (In Chinese) [Google Scholar]
- Zhang, X.; Dong, Y. A Study on the Carrying Capacity and Coupling and Coordinated Development of Economy-Resources-Environment System in the Yellow River Basin. Theory Pract. 2023, 10, 22–29, (In Chinese with English Abstract). [Google Scholar]
- Gui, C.; Liu, P.; Chen, Q.; Li, Y. Analysis on the Coupling and Coordinated Development of Resources, Environment and Economy in the Yellow River Basin. J. Chang. Univ. Sci. Technol. (Soc. Sci. Ed.) 2024, 37, 87–93+144. (In Chinese) [Google Scholar]
- Li, J.; Pan, J.; Feng, F.; Xu, P.; Liu, C. Analysis of the Coupling and Coordinated Development and Restrictive Factors of Population-Water Resources-Economy-Ecological Environment Systems in Nine Provinces (Regions) of the Yellow River Basin. J. Water. Resour. Water. Eng. 2024, 35, 47–56, (In Chinese with English Abstract). [Google Scholar]
- National Development and Reform Commission; Ministry of Finance; former Ministry of Land and Resources; former Ministry of Water Resources; former Ministry of Agriculture; former State Forestry Administration. Pilot National Ecological Civilization Demonstration Zone Construction Plan (Trial). Beijing, China. 2013. Available online: https://www.ndrc.gov.cn/xxgk/zcfb/tz/201312/t20131213_963991.html (accessed on 3 June 2025).
- National Development and Reform Commission; National Bureau of Statistics (NBS); former Ministry of Environmental Protection (MEP); Organization Department of the CPC Central Committee. Green Development Index System. Beijing, China. 2016. Available online: https://www.ndrc.gov.cn/fggz/hjyzy/stwmjs/201612/t20161222_1161174_ext.html (accessed on 3 June 2025).
- National Development and Reform Commission, National Bureau of Statistics, former Ministry of Environmental Protection, and Organization Department of the CPC Central Committee, among other departments. Ecological Civilization Construction Assessment Target System. Beijing, China. 2016. Available online: https://www.ndrc.gov.cn/fggz/hjyzy/stwmjs/201612/t20161222_1161174_ext.html (accessed on 3 June 2025).
- National Development and Reform Commission. Beautiful China Construction Assessment Index System. Beijing, China. 2020. Available online: https://www.gov.cn/zhengce/zhengceku/2020-03/07/content_5488275.htm (accessed on 3 June 2025).
- Ministry of Ecology and Environment. National Ecological Civilization Construction Demonstration Zone (City) Construction Index. Beijing, China. 2024. Available online: https://www.mee.gov.cn/xxgk2018/xxgk/xxgk05/202402/t20240218_1066210.html (accessed on 3 June 2025).
- Li, Y.; Li, Y.; Zhou, Y.; Shi, Y.; Zhu, X. Investigation of a coupling model of coordination between urbanization and the environment. J. Environ. Manage. 2012, 98, 127–133. [Google Scholar] [CrossRef] [PubMed]
- Chen, Y.; Zhao, L. Exploring the relation between the industrial structure and the ecoenvironment based on an integrated approach: A case study of Beijing, China. Ecol. Indic. 2019, 103, 83–93. [Google Scholar] [CrossRef]
- Liu, J.; Tian, Y.; Huang, K.; Yi, T. Spatial-temporal differentiation of the coupling coordinated development of regional energy-economy-ecology system: A case study of the Yangtze River Economic Belt. Ecol. Indic. 2021, 124, 107394. [Google Scholar] [CrossRef]
- Liang, L.; Zhang, F.; Wu, F.; Chen, Y.; Qin, K. Coupling coordination degree spatial analysis and driving factor between socio-economic and eco-environment in northern China. Ecol. Indic. 2022, 135, 108555. [Google Scholar]
- Han, D.; Yu, D.; Qiu, J. Assessing coupling interactions in a safe and just operating space for regional sustainability. Nat. Commun. 2023, 14, 1369. [Google Scholar] [CrossRef]
- Wang, J.; Wang, Z.; Li, K.; Li, C.; Wen, F.; Shi, Z. Factors affecting phase change in coupling coordination between population, crop yield, and soil erosion in China’s 281 cities. Land Use Policy 2023, 132, 106761. [Google Scholar] [CrossRef]
- Zhang, Z.; Qi, J.; Wang, Q.; Wang, S.; Hu, F. Analysis and forecast of the coupled development level of socioeconomy ecological environment and tourism in China’s Yellow River Basin. Sci. Rep. 2025, 15, 5446. [Google Scholar] [CrossRef]
- Kong, W.; Ren, L.; Wang, S.; Liu, Y. Spatial and temporal evolution of the ecological environment and economy coordinated development in Hebei Province, China. J. Appl. Ecol. 2016, 27, 2941–2949. [Google Scholar]
- Yang, Y.; Hu, N. The spatial and temporal evolution of coordinated ecological and socioeconomic development in the provinces along the Silk Road Economic Belt in China. Sustain. Cities Soc. 2019, 47, 101466. [Google Scholar] [CrossRef]
- Niu, Y.; Wang, S. Research of the coupling relationship between the vulnerable ecological environment and poverty in Gansu Province. Acta. Eco. Sin. 2017, 37, 6431–6439. [Google Scholar][Green Version]
- Dong, H.; Liu, Y.; Zhao, Z.; Tan, X.; Managi, S. Carbon neutrality commitment for China: From vision to action. Sustain. Sci. 2022, 17, 1741–1755. [Google Scholar] [CrossRef]
- Zhang, X.; Wang, Y.; Qi, Y.; Wu, J.; Liao, W.; Shui, W.; Zhang, Y.; Deng, S.; Peng, H.; Yu, X.; et al. Evaluating the trends of China’s ecological civilization construction using a novel indicator system. J. Clean. Prod. 2016, 133, 910–923. [Google Scholar] [CrossRef]
- Shi, J.; Li, S.; Song, Y.; Zhou, N.; Guo, K.; Bai, J. How socioeconomic factors affect ecosystem service value: Evidence from China. Ecol. Indic. 2022, 145, 109589. [Google Scholar] [CrossRef]
- Wu, X.; Fu, B.; Wang, S.; Song, S.; Li, Y.; Xu, Z.; Wei, Y.; Liu, J. Decoupling of SDGs followed by re-coupling as sustainable development progresses. Nat. Sustain. 2022, 5, 452–459. [Google Scholar] [CrossRef]
- Xu, Z.; Peng, J.; Liu, Y.; Qiu, S.; Zhang, H.; Dong, J. Exploring the combined impact of ecosystem services and urbanization on SDGs realization. Appl. Geogr. 2023, 153, 102907. [Google Scholar] [CrossRef]
- Ling, H. A Study on the Coordinated Development of Environment, Economy, and Social Services in China—Based on 287 Prefecture-Level Cities. Master’s Thesis, Yangzhou University, Hangzhou, China, 2024. [Google Scholar]
- Wang, H.; Lu, X.; Deng, Y.; Sun, Y.; Nielsen, C.P.; Liu, Y.; Zhu, G.; Bu, M.; Bi, J.; McElroy, M.B. China’s CO2 peak before 2030 implied from characteristics and growth of cities. Nat. Sustain. 2019, 2, 748–754. [Google Scholar] [CrossRef]
- Warchold, A.; Pradhan, P.; Kropp, J.P. Variations in sustainable development goal interactions: Population, regional, and income disaggregation. Sustain. Dev. 2021, 29, 285–299. [Google Scholar] [CrossRef]
- Xiao, H.; Bao, S.; Ren, J.; Xu, Z. Transboundary impacts on SDG progress across Chinese cities: A spatial econometric analysis. Sustain. Cities Soc. 2023, 92, 104496. [Google Scholar] [CrossRef]
Disclaimer/Publisher’s Note: The statements, opinions and data contained in all publications are solely those of the individual author(s) and contributor(s) and not of MDPI and/or the editor(s). MDPI and/or the editor(s) disclaim responsibility for any injury to people or property resulting from any ideas, methods, instructions or products referred to in the content. |
© 2025 by the authors. Licensee MDPI, Basel, Switzerland. This article is an open access article distributed under the terms and conditions of the Creative Commons Attribution (CC BY) license (https://creativecommons.org/licenses/by/4.0/).