Article

The Spatial Distribution Characteristics and Accessibility Analysis of Modern Commemorative Landscapes: A Case Study in Nanjing, China

College of Landscape Architecture, Nanjing Forestry University, Nanjing 210037, China
*
Author to whom correspondence should be addressed.
Sustainability 2025, 17(18), 8355; https://doi.org/10.3390/su17188355
Submission received: 12 August 2025 / Revised: 10 September 2025 / Accepted: 15 September 2025 / Published: 17 September 2025

Abstract

Urban commemorative landscapes serve as vital components of a city’s cultural expression. Employing a two-dimensional “physical-perceptual” accessibility evaluation framework, this study conducted a systematic analysis of the spatial distribution characteristics and accessibility of 124 commemorative landscapes in Nanjing, and investigated the factors influencing their accessibility. The analysis revealed four key findings: (1) A pronounced “core-periphery” pattern was identified, characterized by high-density, evenly distributed clusters in central districts that contrast with sparse, scattered layouts in outer suburbs. (2) Weighting analysis via the entropy method indicated that perceived accessibility (53.96%) exerted a slightly greater influence on composite accessibility than spatial accessibility (46.04%). (3) Modern commemorative landscapes in the main urban areas exhibited strong correlations with road network density and high public perception, and their comprehensive accessibility is significantly better than that of the remote suburban areas. Significant disparities in accessibility were observed among different types of modern commemorative landscapes. The comprehensive accessibility of memorial facilities was found to be the highest, attributable to their balanced spatial distribution and the fact that most of them are distributed in the densely populated main urban areas. (4) Key factors influencing accessibility were identified as attraction carrying capacity, regional population density, and elevation. This study aims to provide a reference for the comprehensive quantitative evaluation of urban commemorative landscapes, thereby promoting the coordinated development of historical space preservation and cultural resource utilization.

1. Introduction

Commemorative landscapes, as distinctive spatial forms, are used to translate abstract concepts into tangible realities. They are constituted not only as physical spaces, but also as carriers and transmitters of culture, thereby reflecting humanity’s spiritual world and cultural connotations [1]. These spaces are recognized as providing the public with platforms for historical reflection, self-understanding, and mutual exchange, thereby enhancing social cohesion [2]. For instance, the Memorial to the Murdered Jews of Europe in Berlin is designed with a striking site layout to prompt profound reflection on historical tragedies among visitors; conversely, the National 9/11 Memorial & Museum in New York integrates ruins with landscape design, providing a space for public collective mourning and emotional connection, thereby strengthening social identity and cohesion. As an important part of cultural heritage, the spatial Accessibility of commemorative landscapes directly affects the public’s access to historical memories and serves as an important indicator of the adaptive use of cultural heritage [3]. Furthermore, the assessment of accessibility provides a scientific basis for the protection and use of cultural heritage [4]. In international practice, London’s Kew Gardens, as a World Heritage Site, has been recognized for significantly enhancing public accessibility through optimized transportation networks and open policies; meanwhile, the Vietnam Veterans Memorial in Washington D.C., is noted for its open spatial layout and seamless integration into the urban slow-traffic system, exemplifies highly integrated accessibility and public utilization. Furthermore, as a significant repository of “urban cultural genes,” commemorative landscapes require spatial optimization that is crucial for the perpetuation of urban culture.
As vital carriers of historical memory and cultural significance, commemorative landscapes have garnered increasing research attention since the 21st century. In the early 20th century, scholarly discussion frequently treated commemorative landscapes primarily as adjuncts to commemorative architecture [5], with studies focusing on elucidating their value and significance [6,7]. Following the advent of the 21st century, particularly post-2005, commemorative landscapes have been studied independently, with emphasis placed on their unique commemorative value [8,9] and design techniques [10]. Current research primarily focuses on two key dimensions: The first explores, through case studies, the close relationship between commemorative landscapes and historical culture [11], as well as their employed narrative techniques [12]. In recent years, international academic research has shifted from static descriptions to dynamic, process-oriented interpretations. The “biographical” perspective proposed by van der Schriek (2018) emphasizes that the significance of landscapes is continuously reconstructed and reinterpreted through temporal and social changes [13]. Simultaneously, commemorative landscapes are not always symbols of consensus. They often serve as central arenas for power struggles and narrative competitions among different groups. These studies provide a theoretical framework for understanding the complex social values of commemorative landscapes [14]. The second dimension focuses on the spatial characteristics of commemorative landscapes from the perspective of environmental spatial features. This includes analyses of spatial function extension [15], collective emotional expression [16], and landscape construction evaluation [17]. Advancements in technology and increased interdisciplinary exchange have further established dimensions such as the spatial sequence [18,19], visual characteristics [20], and landscape perception [21] of commemorative landscapes have also gradually become research hotspots, providing more diversified perspectives for understanding commemorative landscapes. Recently, driven by in-depth studies of urban space, scholars have begun to focus on the spatial distribution patterns of commemorative landscapes within urban systems and their social effects. For example, Zhao (2025) demonstrated a strong correlation between the spatial distribution of commemorative landscapes and the historical development trajectory of cities through the analyses of the major historical and cultural cities in China [22]. Despite this progress, methodological limitations remain in systematic, city-wide analyses of commemorative landscapes. Specifically, quantitative methods and multi-dimensional evaluation systems for comprehensively assessment of their spatial distribution and accessibility are still lacking.
Research on accessibility originated in the 1950s. First proposed by Hansen (1959), accessibility was defined as the potential for interaction, reflecting the ease with which spatial barriers can be overcome to move between points within a given area [23]. Since the 21st century, research has expanded to encompass various public spaces, including urban parks and green spaces [24], tourist attractions [25], sports facilities [26], and elderly care service facilities [27], leading to a continuous broadening of its conceptual scope. Predominant methods for measuring attraction accessibility comprise the shortest path method [28], buffer zone analysis [29], gravity model method [30], and two-step floating catchment area (2SFCA) method [31]. Contemporary methodologies employ quantitative analysis frameworks to assess accessibility by integrating variables such as landscape type, service area, attractiveness, and population demographics (size and distribution) [32], resulting in significant progress and continuous refinement in accessibility assessment studies. However, research on the accessibility of commemorative landscapes, which possess unique cultural significance and emotional value, has not yet fully incorporated their distinctiveness as cultural carriers, and existing measurement methods still require refinement.
To address these gaps, this study focuses on the modern commemorative landscapes in Nanjing. The study first categorizes their current status and then applies the Average Nearest Neighbor Index, Kernel Density Analysis, and a comprehensive accessibility measurement method that integrates subjective and objective factors to examine their spatial distribution patterns, density characteristics, and accessibility levels. Furthermore, it examines the factors influencing accessibility through Geographical Detector analysis. This study aims to provide a reference for the comprehensive quantitative evaluation of urban commemorative landscapes, thereby supporting the coordinated development of historical space preservation and cultural resource utilization.

2. Overview of the Research Subject

2.1. Urban Profile

Nanjing, the capital of Jiangsu Province, is located in eastern China along the lower reaches of the Yangtze River. According to the *Nanjing City Territorial Space Master Plan (2021–2035)*, approved by the State Council in 2024, Nanjing covers 6587.04 km2 and has a planned permanent population of 13 million. Geographically, Nanjing extends from 31°14′ N latitude to 32°37′ N, and from 118°22′ E longitude to 119°14′ E. Its administrative structure comprises 11 districts: Gulou, Xuanwu, Qinhuai, Jianye, Qixia, Yuhuatai, Jiangning, Liuhe, Pukou, Lishui, and Gaochun. Nanjing holds significant status as an important central city in eastern China, a major national hub for scientific research and education, and a comprehensive transportation hub. As a megacity within the Yangtze River Delta region, it functions as a vital gateway for development in central and western China. Furthermore, Nanjing was among the first cities designated as both a National Famous Historical and Cultural City and a National Key Scenic Tourism City.

2.2. Overview of Modern and Contemporary Commemorative Landscapes in Nanjing

Nanjing has a rich revolutionary history and cultural heritage, making it a crucial site for understanding China’s modern and contemporary history (post-1840) [33]. The city’s modern and contemporary commemorative landscapes include not only nationally significant memorial sites, such as the Sun Yat-sen Mausoleum, the Memorial Hall of the Victims in Nanjing Massacre by Japanese Invaders, and the Yuhuatai Martyrs’ Cemetery, but also numerous memorials dedicated to local historical events and figures.
In China, commemorative landscapes are defined as a distinct type of garden landscapes dedicated to honoring notable historical figures (e.g., sages and philosophers) or significant events associated with specific locations, all characterized by profound historical and cultural significance [34]. A total of 124 commemorative landscapes in Nanjing were identified through systematic collation and comprehensive verification, based on the Lists of National Key Cultural Relics Protection Units (First to Eighth Editions) issued by the State Council of the People’s Republic of China, supplemented with provincial (Jiangsu), municipal (Nanjing), and district/county-level cultural relics protection lists. Additional references came from catalogues of commemorative landscape resources and relevant academic literature. Their spatial distribution is presented in Figure 1. Building on commemorative content, scale (land area), and synthesizing recent relevant research [35,36], while considering the naming principles for memorial facilities and heritage site lists, the commemorative landscapes were categorized into four main types: Eminent Historical Figure’s Burial Site, Commemorative Facility Resource Site, Commemorative Ruins Resource Site, and Integrated Memorial Site. The classification results are summarized in Table 1.

3. Data and Methods

3.1. Data Acquisition and Processing Methods

The study used fundamental geospatial data for Nanjing, obtained from the Nanjing Municipal Bureau of Planning and Natural Resources’ publication *Nanjing Territorial Space Master Plan (2021–2035)*, which was acquired in 2024. This dataset included a vector boundary map of Nanjing, that served as the spatial reference framework for all subsequent analyses. Digital Elevation Model (DEM) data were obtained from the Geospatial Data Cloud platform, specifically from the Landsat 8-9 OLI/TIRS C2 L dataset, under the identifier LC09_L2SP_120037_20250516_20250517_02_T1 (2024). Manual visual interpretation of satellite imagery was conducted in ArcGIS 10.8 and supplemented with field survey data to generate vector and raster datasets for administrative divisions, road networks, and elevation in Nanjing.
Point of Interest (POI) data were acquired from the Baidu Maps POI database. Based on the compiled list of Nanjing’s modern commemorative landscapes, geographic coordinates (latitude/longitude) were extracted using Baidu’s coordinate picker tool, and additional attributes such as area and construction year were obtained from Baidu Encyclopedia entries. This process enabled the creation of a comprehensive POI dataset for Nanjing’s commemorative landscape resources. A sample of the POI data is provided in Table 2.
For the perceived accessibility analysis, a network text analysis method was applied. Web-based perception data were collected in May 2024 from major travel platforms, including Ctrip, Qunar, and Dianping. A web crawler was developed using Python 3.12.3 to collect user ratings (on a 5-point scale) and total review counts for the 124 commemorative landscapes. During data processing, the raw crawled data were cleaned through deduplication, removal of irrelevant characters, and elimination of invalid ratings. The average rating and total review count were then calculated for each site and used as core indicators of perceived accessibility.
To analyze the factors influencing accessibility, population data were taken from the Seventh National Population Census of China (Nanjing section, 2020). District-level GDP data were acquired from the *Nanjing Statistical Yearbook 2024*. During data processing, street/district-level population statistics were integrated with the vector-based administrative boundary map of Nanjing. Kernel density analysis was performed using ArcGIS to generate a population density raster at a 1 km × 1 km resolution. District-level GDP data were combined with the population density raster to a spatial distribution map of per capita GDP. Attraction carrying capacity data, used as an auxiliary variable for geographical detector analysis, were derived from visitor capacity estimates provided by Ctrip and Dianping.

3.2. Research Methods

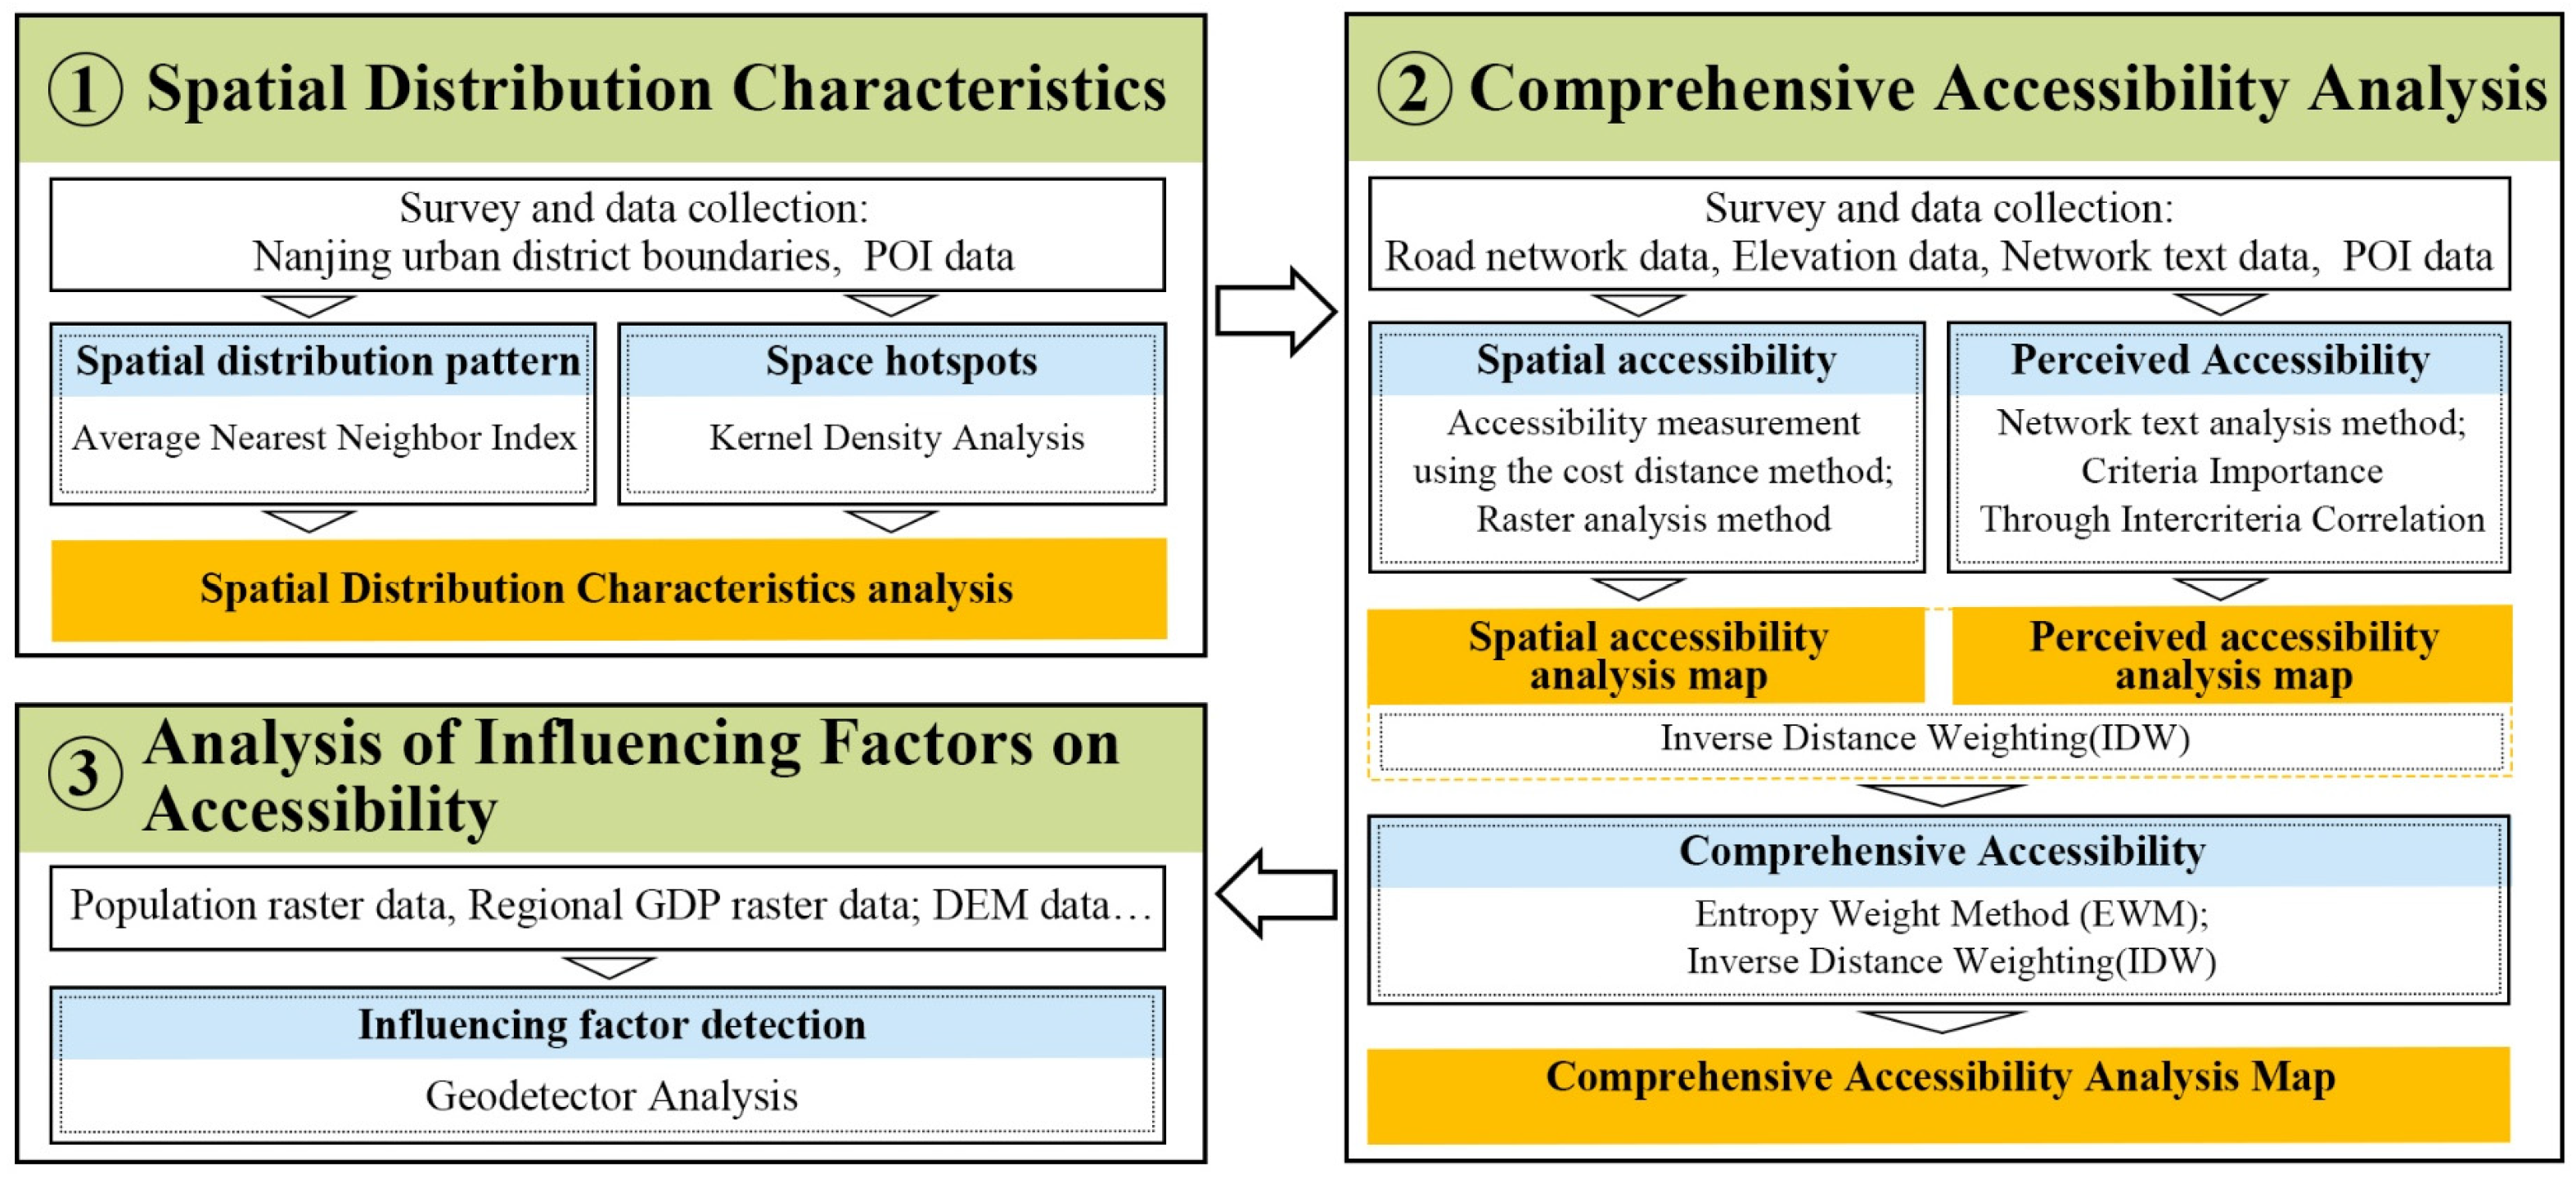
Initially, a geographic database was constructed using POI data to compile and process foundational information on modern and contemporary commemorative landscape resource points in Nanjing. Subsequently, the Average Nearest Neighbor Index was then applied to analyze spatial distribution patterns and identify whether the landscapes were clustered or dispersed. To further examine spatial distribution density, Kernel Density Analysis was employed to reveal the distribution pattern characteristics of the studied landscapes. Next, transportation network data were integrated for raster analysis and cost distance modeling to measure spatial accessibility, whereas network text data were used to assess perceived accessibility. The two accessibility measures were then combined to produce comprehensive results. Finally, the Geographical Detector tool was employed to explore the factors contributing to accessibility disparities among the studied landscapes. This process established a complete research framework encompassing the sequence of “Data Preparation—Distribution Pattern Analysis—Density Feature Analysis—Accessibility Assessment—Influencing Factor Detection”. (See Figure 2 for the research framework).

3.2.1. Average Nearest Neighbor Index

The spatial distribution characteristics of Nanjing’s modern and contemporary commemorative landscapes were analyzed with the Average Nearest Neighbor Index. The core principle of this index involves: first, calculation of the average distance between selected commemorative landscapes; second, comparison of the measured average nearest neighbor distance with the expected average nearest neighbor distance. The ratio between these values forms the nearest neighbour index, which determines whether the spatial distribution follows clustered, uniform, or dispersed patterns. The mathematical expression is given as follows:
R = d i d e
The expected value of nearest neighbor distance d e   is calculated as
d e = 1 2 N A
Here, N = number of commemorative landscapes; A = area of the study region.
Interpretation criteria: when R < 1 : Indicates a clustered distribution of commemorative landscapes; when R > 1 : Indicates dispersed distribution; when R = 1 (indicating observed value equals expected value): Indicates random distribution.

3.2.2. Kernel Density Analysis

Kernel Density Analysis was employed to examine the spatial distribution density characteristics of modern commemorative landscapes in Nanjing. This method objectively characterizes the dispersed or clustered patterns of point features in geographic space and is widely used for analyzing point feature distribution. The analysis was conducted in ArcGIS 10.8 with a 1 km search radius. The calculation formula is given as follows:
f x = 1 n h i = 1 n K x x i h
Here, f ( x ) represents the kernel density estimate at point x . Higher f ( x ) value indicates greater spatial density of the feature point distribution. N : Sample size; h : Bandwidth parameter that controls smoothing intensity; K : Weight function.

3.2.3. Spatial Accessibility Measurement Using the Cost Distance Method

Cost Distance Analysis represents a crucial approach in Geographic Information System (GIS) spatial analysis. Unlike traditional buffer analysis or network analysis methods that typically focus on single influencing factors, the cost distance method incorporates multiple resistance factors encountered during surface travel. This approach enables more realistic simulation of human movement in complex urban environments. By quantifying these factors, this method calculates the minimum cumulative cost path between locations [37]. In this study, the cost distance method was applied to analyze the spatial Accessibility pattern of modern commemorative landscapes in Nanjing. A geographic database was constructed using POI data to calculate average travel times from these sites to various locations throughout the city.
Transportation accessibility analysis was assessed using Nanjing’s road network raster data. Following the principle of time-distance accessibility measurement through raster analysis, specific speeds (40 km/h, 60 km/h, 75 km/h, 100 km/h) were assigned to different road network classes (highways, arterial roads, sub-arterial roads, and feeder roads) [38]. The raster cell size (resolution) was set to 30 m × 30 m, determined by the study area extent and the resolution of the available Landsat remote sensing imagery (30 m). Based on the road class, corresponding speeds were assigned, and the time cost required to pass through each road network raster cell was calculated using the formula: Time Cost = Cell Size (30 m)/Speed. Here, the calculated value represents the relative traversal time of a single 30 m grid cell, rather than the absolute travel time across a region. During subsequent cost distance accumulation, these per-cell values are summed along least-cost paths to approximate total travel time from the origin to any location. Subsequently, a slope raster was generated from DEM data using ArcGIS 10.8’s ‘Slope’ tool. Appropriate resistance coefficients (1.0, 1.5, 2.0, 3.5, 999.0) were assigned to different slope types (gentle slope: 0–5°, moderate slope: 5–10°, medium slope: 10–15°, steep slope: 15–25°, extremely steep slope: >25°) [39]. The resistance coefficient represents a dimensionless multiplier that specifies the factor by which travel time increases within each slope class; for example, a coefficient of 2.0 indicates twofold increase in travel time compared to flat terrain. Using ArcGIS tools, the road network time cost raster (T-road) was multiplied by the slope resistance coefficient raster (W-slope)—derived through reclassification according to the above criteria—to generate the final integrated cost raster (T-final). The calculation formula is expressed as
T f i n a l = T r o a d × W s l o p e
Using various modern commemorative landscape resource points as origins, the Cost Distance tool was applied to identify least-cost routes and calculate average travel times from each site to multiple destinations in Nanjing. Regions with lower average travel times exhibit better accessibility. Accessibility was calculated as follows:
A i = j = 1 n T i j / n
Here, A i represents the accessibility of a specific region; T i j denotes the travel time from the modern commemorative landscape resource point i to point j via the shortest travel route in the transportation network; n is the total number of modern commemorative landscape resource points.

3.2.4. Perceived Accessibility Measurement Using the Network Text Analysis Method

Subjective accessibility perception is a critical research focus in tourism studies. Previous studies show that online rating data are effective measures of attraction appeal [40]. As direct measures of visitor evaluations, online media ratings reliably reflect psychological-level accessibility perceptions [41]. This study applied network text analysis to quantitatively measure perceived accessibility of commemorative landscapes. The methodology involved collecting tens of thousands of valid review records from major travel platforms (Ctrip, Qunar, and Dianping) using Python web crawlers, with a focus on key metrics including attraction ratings and review counts. Data standardization was performed with the CRITIC method to assign weights to attraction ratings (experience quality) and review counts (popularity). The mathematical expression is as follows:
Following data normalization, the comparative intensity and conflict index were calculated separately. The standard deviation σ j quantifies the variability degree of the j indicator:
σ j = 1 m i = 1 m x i j * x ¯ j * 2
Here x ¯ j * represents the mean value of the standardized indicator. Higher σ j values indicate greater discriminative power for the indicator.
The conflict between indicators was measured using the correlation coefficient r j k , resulting in a conflict matrix R is constructed:
R j = k = 1 n ( 1 r j k )
Integration of both comparative intensity and conflict index yielded the information content C j and weight ω j :
C j = σ j × R j ,      ω j = C j k = 1 n C k
After determining weights, perceived accessibility values were computed based on these weights. Inverse distance weighting (IDW) within ArcGIS 10.8 was subsequently employed to generate spatial distribution maps of perceived accessibility.

3.2.5. Entropy Weight Method

For comprehensive accessibility measurement, the entropy weight method was used to assign relative weights to road transport accessibility and perceived accessibility. The entropy weight method is an objective weighting approach based on information entropy theory, assigning weights according to indicator variability. When an indicator’s data exhibits greater variability, its entropy value decreases while its weight increases, and vice versa [42]. In perceived accessibility analysis, where exclusively web-sourced data may exhibit strong inter-indicator correlations (e.g., high search popularity often accompanies high ratings), the CRITIC was employed to adjusts weights using correlation coefficients to prevent information redundancy. For synthesizing perceived accessibility and spatial accessibility data, this study adopted the entropy weight method, as it is predominantly applied to objective data with strong independence.

3.2.6. Geographical Detector Analysis

The Geographical Detector method was employed to examine spatial heterogeneity and its driving factors [43]. In this study, the Geographical Detector was applied to analyze factors influencing accessibility to modern commemorative landscapes in Nanjing. This method demonstrates distinct advantages in addressing spatial heterogeneity and in revealing complex interactions among factors. Compared with traditional regression methods, it effectively captures the nonlinear coupling relationships between natural factors (e.g., terrain) and social factors (e.g., population distribution) in shaping commemorative landscape accessibility [44]. Through the q-statistic, this method not only quantifies the explanatory power of individual factors but also detects synergistic effects among multiple factors. This ability to conduct interaction analysis is essential for understanding the spatial differentiation mechanisms of commemorative landscapes. Furthermore, the Geographical Detector’s flexibility in handing data types enables simultaneous processing of both continuous elevation data and discrete road network classification data, ensuring scientific rigor and analytical completeness. Specifically, factor detection was used to measure the explanatory power of influencing factors on accessibility, as expressed through the q -value. The calculation formula is as follows:
q = 1 l L N l σ l 2 N σ 2
Here, N l and σ l 2 denote the sample size and variance of stratum l ; while N and σ l 2 represent the sample size and variance of the entire study area. The q -statistic ranges between [0, 1], with higher values indicating greater explanatory power. It should be noted that q only quantifies the magnitude of a factor’s influence on the dependent variable, rather than its directional effect.

4. Results and Analysis

4.1. Spatial Distribution Characteristics of Modern Commemorative Landscapes in Nanjing

4.1.1. Spatial Distribution Patterns

The spatial distribution characteristics of Nanjing’s modern commemorative landscapes are examined with the Average Nearest Neighbor Analysis tool in ArcGIS. The results (See Table 3) indicate that both Commemorative Facility Resources and Commemorative Ruins Resources have average nearest neighbor indices below 1, suggesting clustered distribution patterns for these two types as well as for the overall distribution of commemorative landscapes. In contrast, Eminent Historical Figure’s Burials and Integrated Memorials exhibit dispersed distribution patterns. Analysis of each commemorative landscape type reveals distinct clustering tendencies. Commemorative Facility Resources, as urban public facilities, are highly concentrated in Nanjing’s central urban core (e.g., the Crossing-the-Yangtze River Campaign Memorial Hall and “20 May” Student Movement Memorial Square), demonstrating pronounced clustering effects. Commemorative Ruins Resources, serving as memorials for major historical events, are also primarily clustered in central urban areas, though with less pronounced pattern (average nearest neighbor index 0.72) than Commemorative Facility Resources (0.66) owing to their nature as fixed historical structures. Eminent Historical Figure’s Burials exhibit a tendency toward peripheral distribution in central urban areas, though some are located in core zones because of Nanjing’s historical significance (e.g., Nanjing Massacre memorials), yielding a non-significant dispersed pattern. Integrated Memorials, typically large-scale sites such as the Sun Yat-sen Mausoleum Scenic Area or comprehensive memorial halls like the Victory Memorial Hall of Yangtze Crossing Campaign, display significant dispersion (average nearest neighbor index 1.80) because of spatial constraints on their distribution and siting.

4.1.2. Kernel Density Analysis

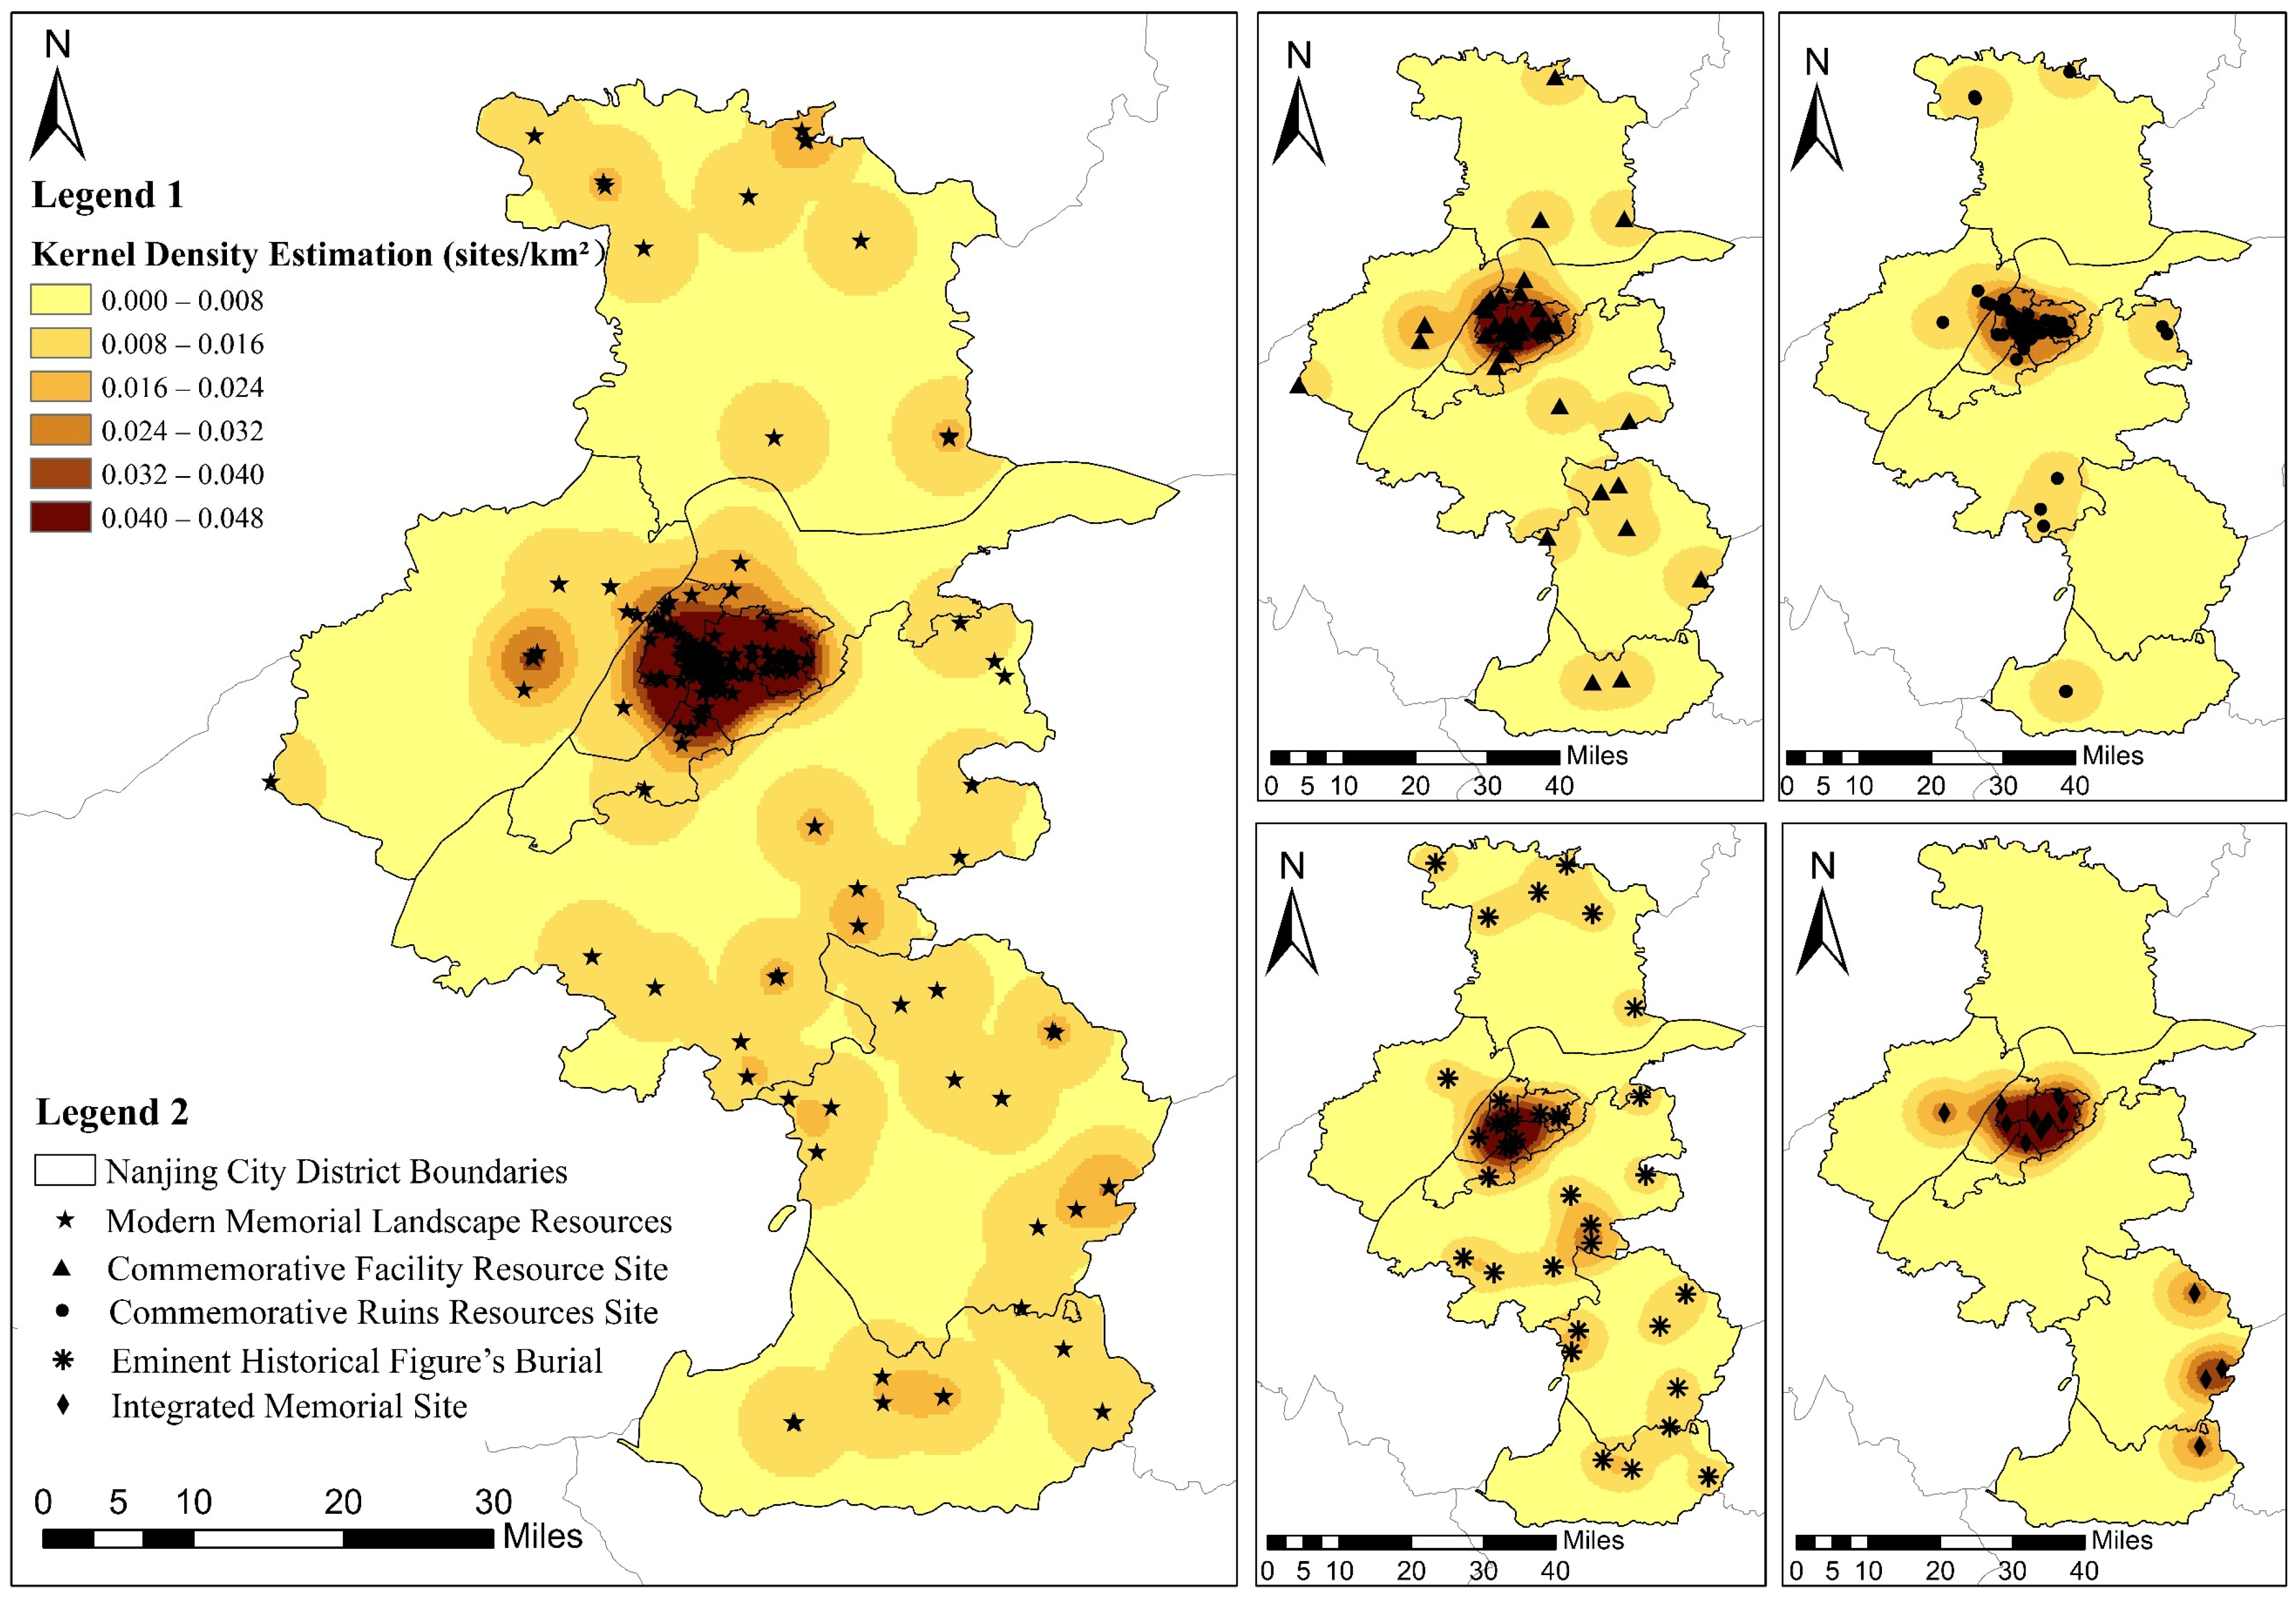
The kernel density spatial distribution of modern commemorative landscapes in Nanjing’s central urban area exhibit marked regional disparities, characterized by a distinct pattern of “large dispersion with small clusters” and characteristic “single-core, multi-zone” features (Figure 3). Primary clustering characteristics were observed in and around the downtown area, particularly forming notable “core” zones with elevated kernel density values around the old city districts and key historical-cultural sites. These areas encompass major historical-cultural landmarks such as the Memorial Hall of the Victims of the Nanjing Massacre by Japanese Invaders and the Yuhuatai Scenic Area. Additionally, several smaller “nuclei” are distributed across other historical-cultural locations in Nanjing, displaying relatively higher densities and clustering tendencies. Conversely, in peripheral areas of Nanjing’s central urban district, especially those farther from the core zones, commemorative landscapes demonstrate significantly lower densities, forming distinct “zonal” distribution patterns. These low-density areas are mainly situated in the outer regions of the central urban district, attributed to fewer or more dispersed cultural heritage sites in these locations.
Various types of landscapes exhibit markedly differentiated spatial distribution characteristics. Commemorative facilities form high-density clusters in the main urban districts of Xuanwu, Gulou, and Qinhuai, particularly in the Xinjiekou-Meiyuan Xincun-Daxinggong area where kernel density values ranged from 0.024–0.048, reflecting the agglomeration effects of political-cultural centers. Meanwhile, suburban areas such as Taishan Street in Pukou District show localized secondary clusters. Commemorative sites are distributed along the historical-cultural axis of Changjiang Road-Zhongshan East Road, with kernel density values between 0.008–0.032, exhibiting strong spatial correspondence with Republic-era architectural clusters, though some form isolated medium-density points in areas like Maigaoqiao in Qixia District owing to in situ preservation requirements of historical events. Eminent burial landscapes exhibit a “dual-core” pattern, with the highest kernel density (0.024–0.048) around Yuhuatai Martyrs Cemetery and secondary density cluster in the Ganjiaxiang-Yaohuamen area of Qixia District. These distributions are significantly influenced by topography, with medium-low density areas predominantly distributed in hilly regions such as Purple Mountain and Niushou Mountain. Integrated memorials exhibit a prominent “core-periphery” characteristic, with the Sun Yat-sen Mausoleum Scenic Area and the Memorial Hall of the Victims in Nanjing Massacre by Japanese Invaders forming extreme high-density cores exceeding 0.048, while overall displaying a “few but large” distribution pattern with low-density areas accounting for 78% of the total area. Overall, the spatial distributions of Nanjing’s modern commemorative landscapes follow a typical “core-periphery” model, with high-density clusters in the main urban area and sparse distribution in suburban regions. This pattern not only reflects Nanjing’s spatial characteristics as a historical-cultural city but also illustrates differentiated distribution patterns across commemorative landscape types, influenced by multiple factors including political-cultural forces, historical events, and topographic conditions.

4.2. Comprehensive Accessibility Analysis of Modern Commemorative Landscapes in Nanjing

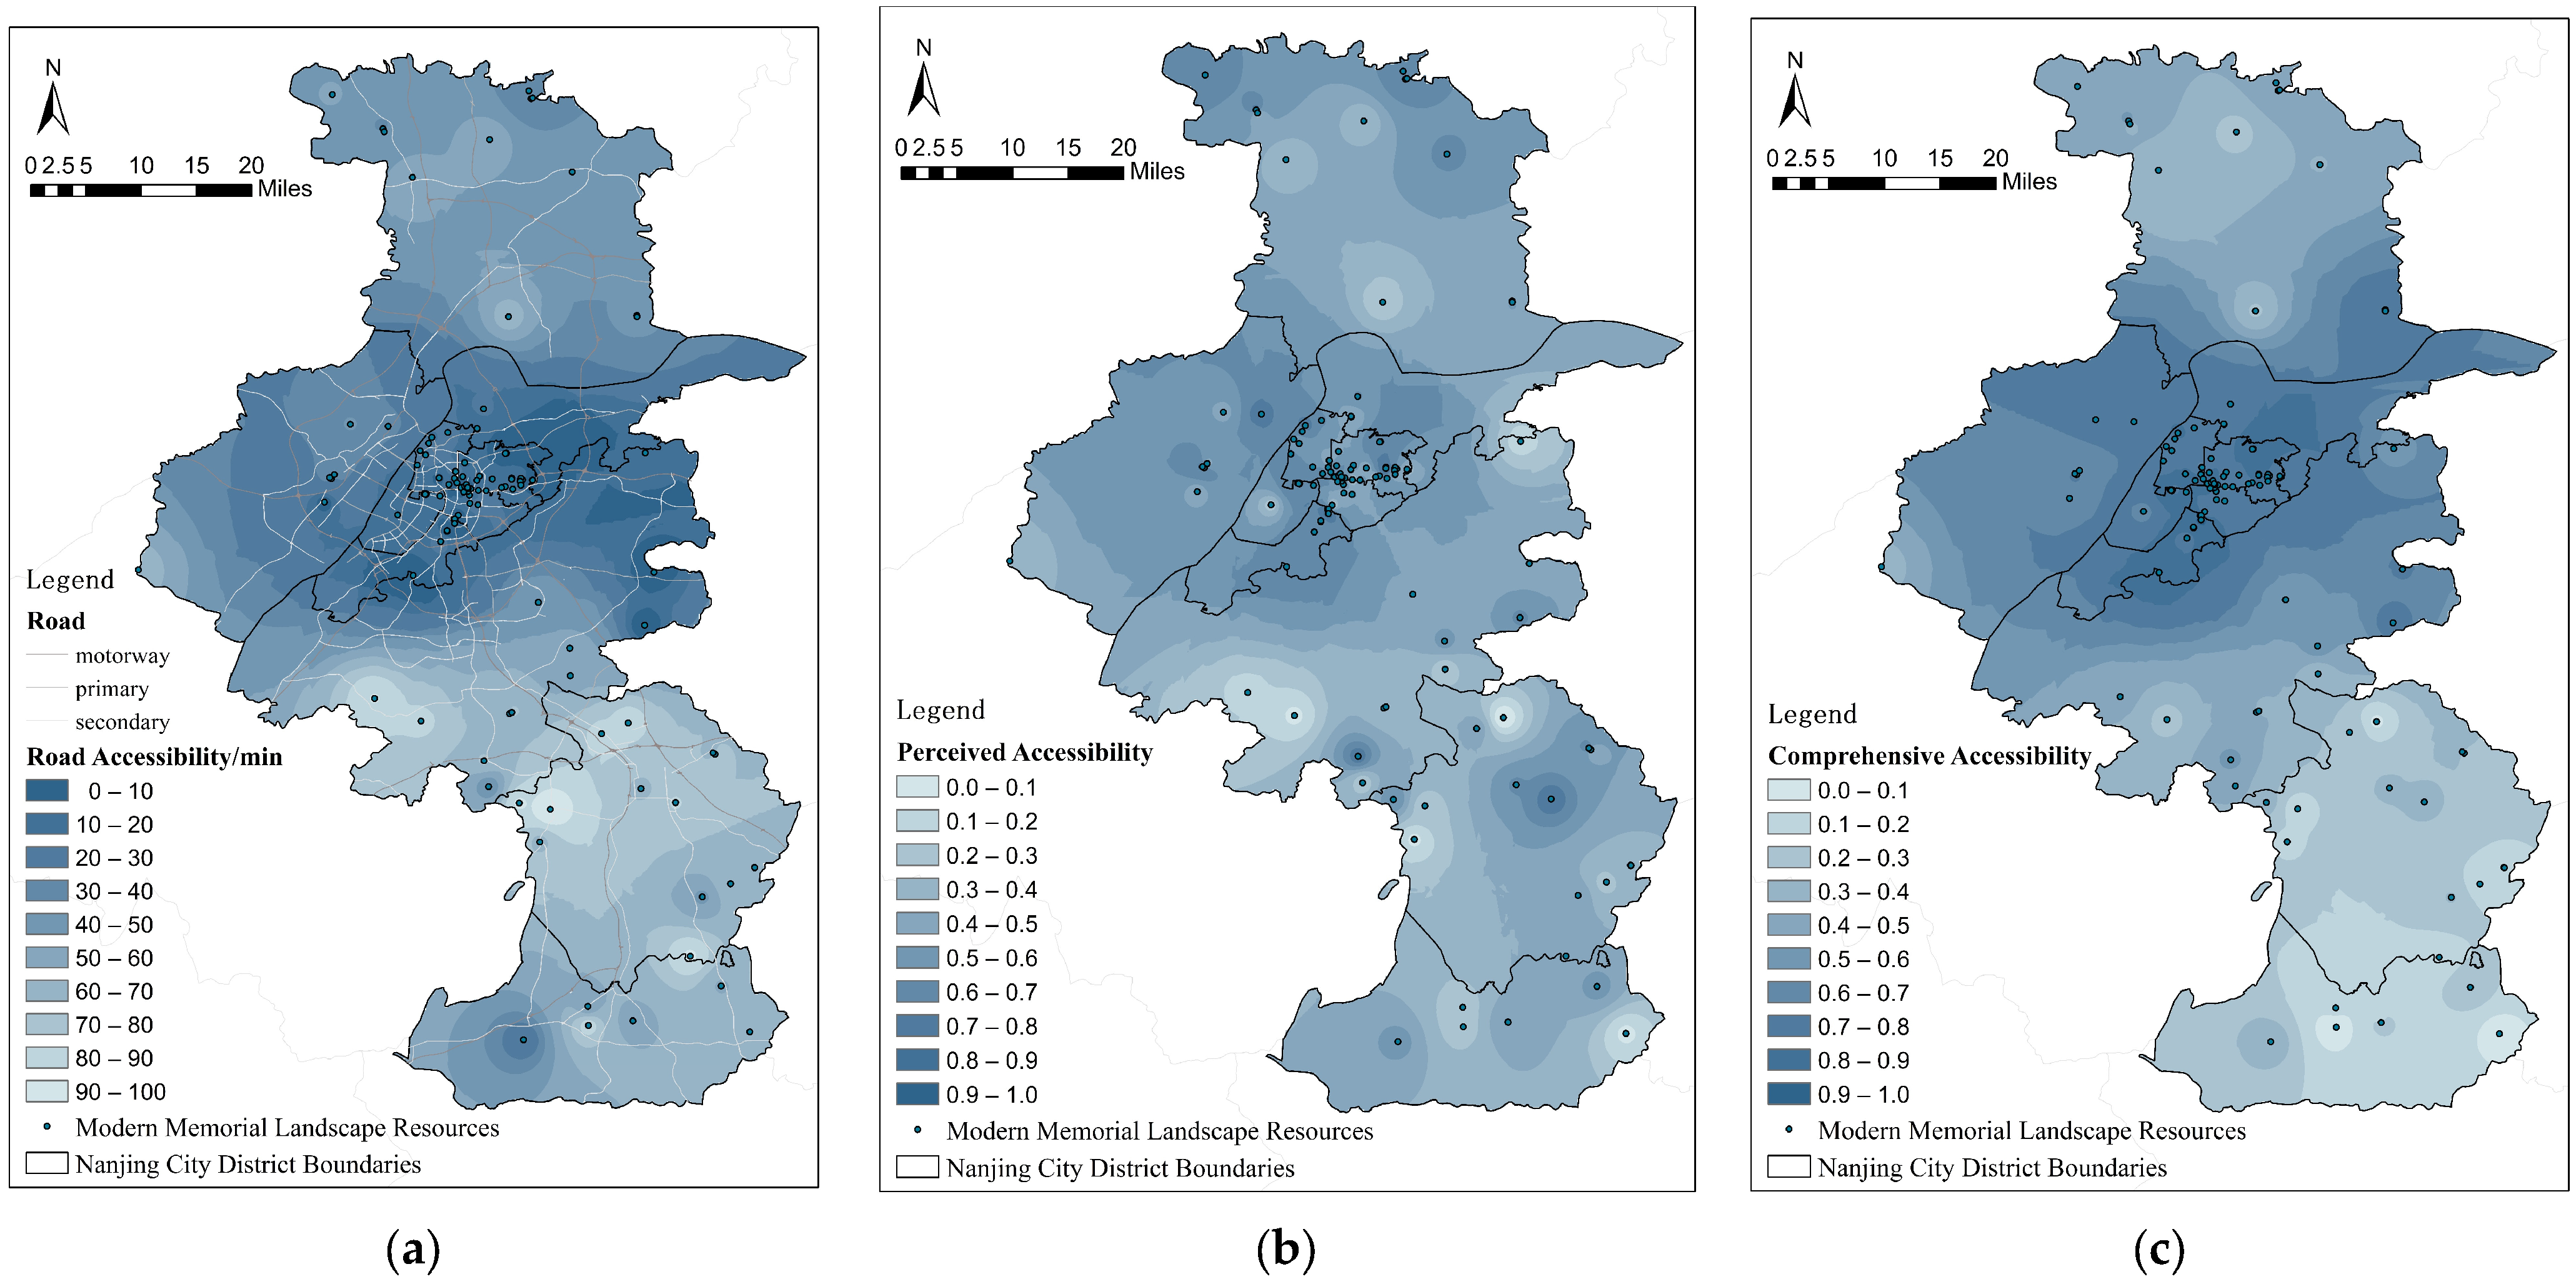
The comprehensive accessibility pattern of Nanjing’s modern commemorative landscapes shows clear transportation-oriented characteristics. Regions with high accessibility are typically located in areas with dense road networks, with spatial configurations that align closely with the arterial road network, predominantly forming a grid-like structure (Figure 4a). Specifically, high-accessibility zones are concentrated along road networks and at their intersections, whereas enclosed interior spaces within these areas exhibit relatively weaker accessibility.

4.2.1. Spatial Accessibility Analysis

The spatial accessibility of Nanjing’s modern commemorative landscapes exhibits relatively minor spatial disparities overall. Owing to the extensive road network coverage, most areas within Nanjing demonstrate good accessibility. Regions with higher accessibility are mainly concentrated in the main urban district where modern commemorative landscapes are clustered, as well as in certain areas of Liuhe, Lishui, and Gaochun, exhibiting polycentric distribution characteristics.
Areas with high accessibility levels are predominantly situated in the central urban district, characterized by convenient transportation, dense population, and well-developed infrastructure. Within this region, the average travel time to leisure and tourism resources remains low, less than 30 min. In contrast, the limited areas with weaker accessibility exhibit average travel times exceeding 60 min. Modern commemorative landscapes in these less accessible areas are mainly situated in western suburban Nanjing, including the Shicun Anti-Japanese Heroes Monument, as well as the Qunli Martyrs Monument and Wushan Martyrs Monument in northern Lishui District. Constrained by limited secondary road network coverage, these sites demonstrate average travel times exceeding 80 min.

4.2.2. Perceived Accessibility Analysis

In the CRITIC weighting analysis, the forward normalization formula was applied to normalize both the collected average ratings and total review counts, followed by a comprehensive calculation of weights for these two datasets (the weight calculation results are shown in Table 4). Based on the derived weight assignments, the perceived accessibility of modern commemorative landscapes was computed (the calculation results are presented in Table 5). Inverse distance weighting (IDW) was employed to generate accessibility surfaces, and produce a spatial pattern analysis map of perceived accessibility (Figure 4b).
The interpolation-generated perceived accessibility distribution map reveals pronounced spatial heterogeneity in the accessibility of Nanjing’s modern commemorative landscapes. CRITIC weighting analysis (Table 5) indicates that landscape ratings contribute 66.00% of the weight, substantially exceeding the review count weight (33.99%), suggesting that visitor experience quality represents the decisive factor influencing perceived accessibility.
Spatially (Figure 4b), high-value clusters (0.7–1.0) radiate outward from the Yuhuatai Scenic Area (0.755) as the core, forming a “central-radial” pattern. This core area has achieved strong psychological accessibility through effective digital dissemination, underpinned by its perfect 5.00 rating and 3660 reviews. Transitional fluctuation zones (0.4–0.6) exhibit “scattered point” characteristics, as exemplified by Youzishan Martyrs Cemetery (0.558)—Despite achieving a high 4.90 rating, its influence is constrained by a relatively modest 579 reviews. Low-value contiguous zones (≤0.3) form a pronounced depression in the Jiangning-Lishui border area, where attractions such as the Former Headquarters Site of the New Fourth Army (0.220) are constrained by both their limited review count (345) and dispersed locations.

4.2.3. Comprehensive Accessibility Analysis

The entropy weight method was employed to calculate weights for both the spatial accessibility data and perceived accessibility data. Based on these weights (See Table 6), comprehensive accessibility was assessed through weighted integration of spatial and perceived accessibility, with the results presented in Table 7.
The entropy weight method results (Table 6) indicate that perceived accessibility (weight = 53.96%) constitutes the primary influencing factor, highlighting the core status of visitor experience in modern commemorative landscapes development, while spatial accessibility (46.04%) retains its fundamental supporting role, together forming a dynamically balanced influence mechanism. Spatially, comprehensive accessibility exhibits a clear three-tier gradient distribution (Figure 4c). The core high-value zones (0.8–1.0), represented by Yuhuatai Scenic Area (0.818), are concentrated in major urban transportation hub areas, generating a siphon effect owing to their 5A-level scenic area advantages; Secondary transition zones (0.4–0.6) including “20 May” Square (0.615) and New Fourth Army Site (0.427) exhibit point distribution along urban arterial roads, with accessibility limited by both location and recognition factors; Peripheral low-value zones (0.1–0.3), exemplified by Youzishan Martyrs Cemetery (0.399) form accessibility depressions owing to rural road conditions and inadequate supporting facilities. This spatial pattern results from both road network density disparities (8.7 km/km2 in central urban areas, 4.6 times higher than in peripheral areas) and the combined effects of online dissemination (the top three attractions account for 67% of total reviews) and policy influence (all national-level bases are located in >0.7 zones). In summary, the comprehensive accessibility of Nanjing’s commemorative landscapes presents significant “core-high periphery-low” spatial heterogeneity characteristics, with strong agglomeration in main urban areas and uneven development in peripheral regions.

4.3. Accessibility Analysis of Different Types of Modern Commemorative Landscapes in Nanjing

4.3.1. Commemorative Facility Resources

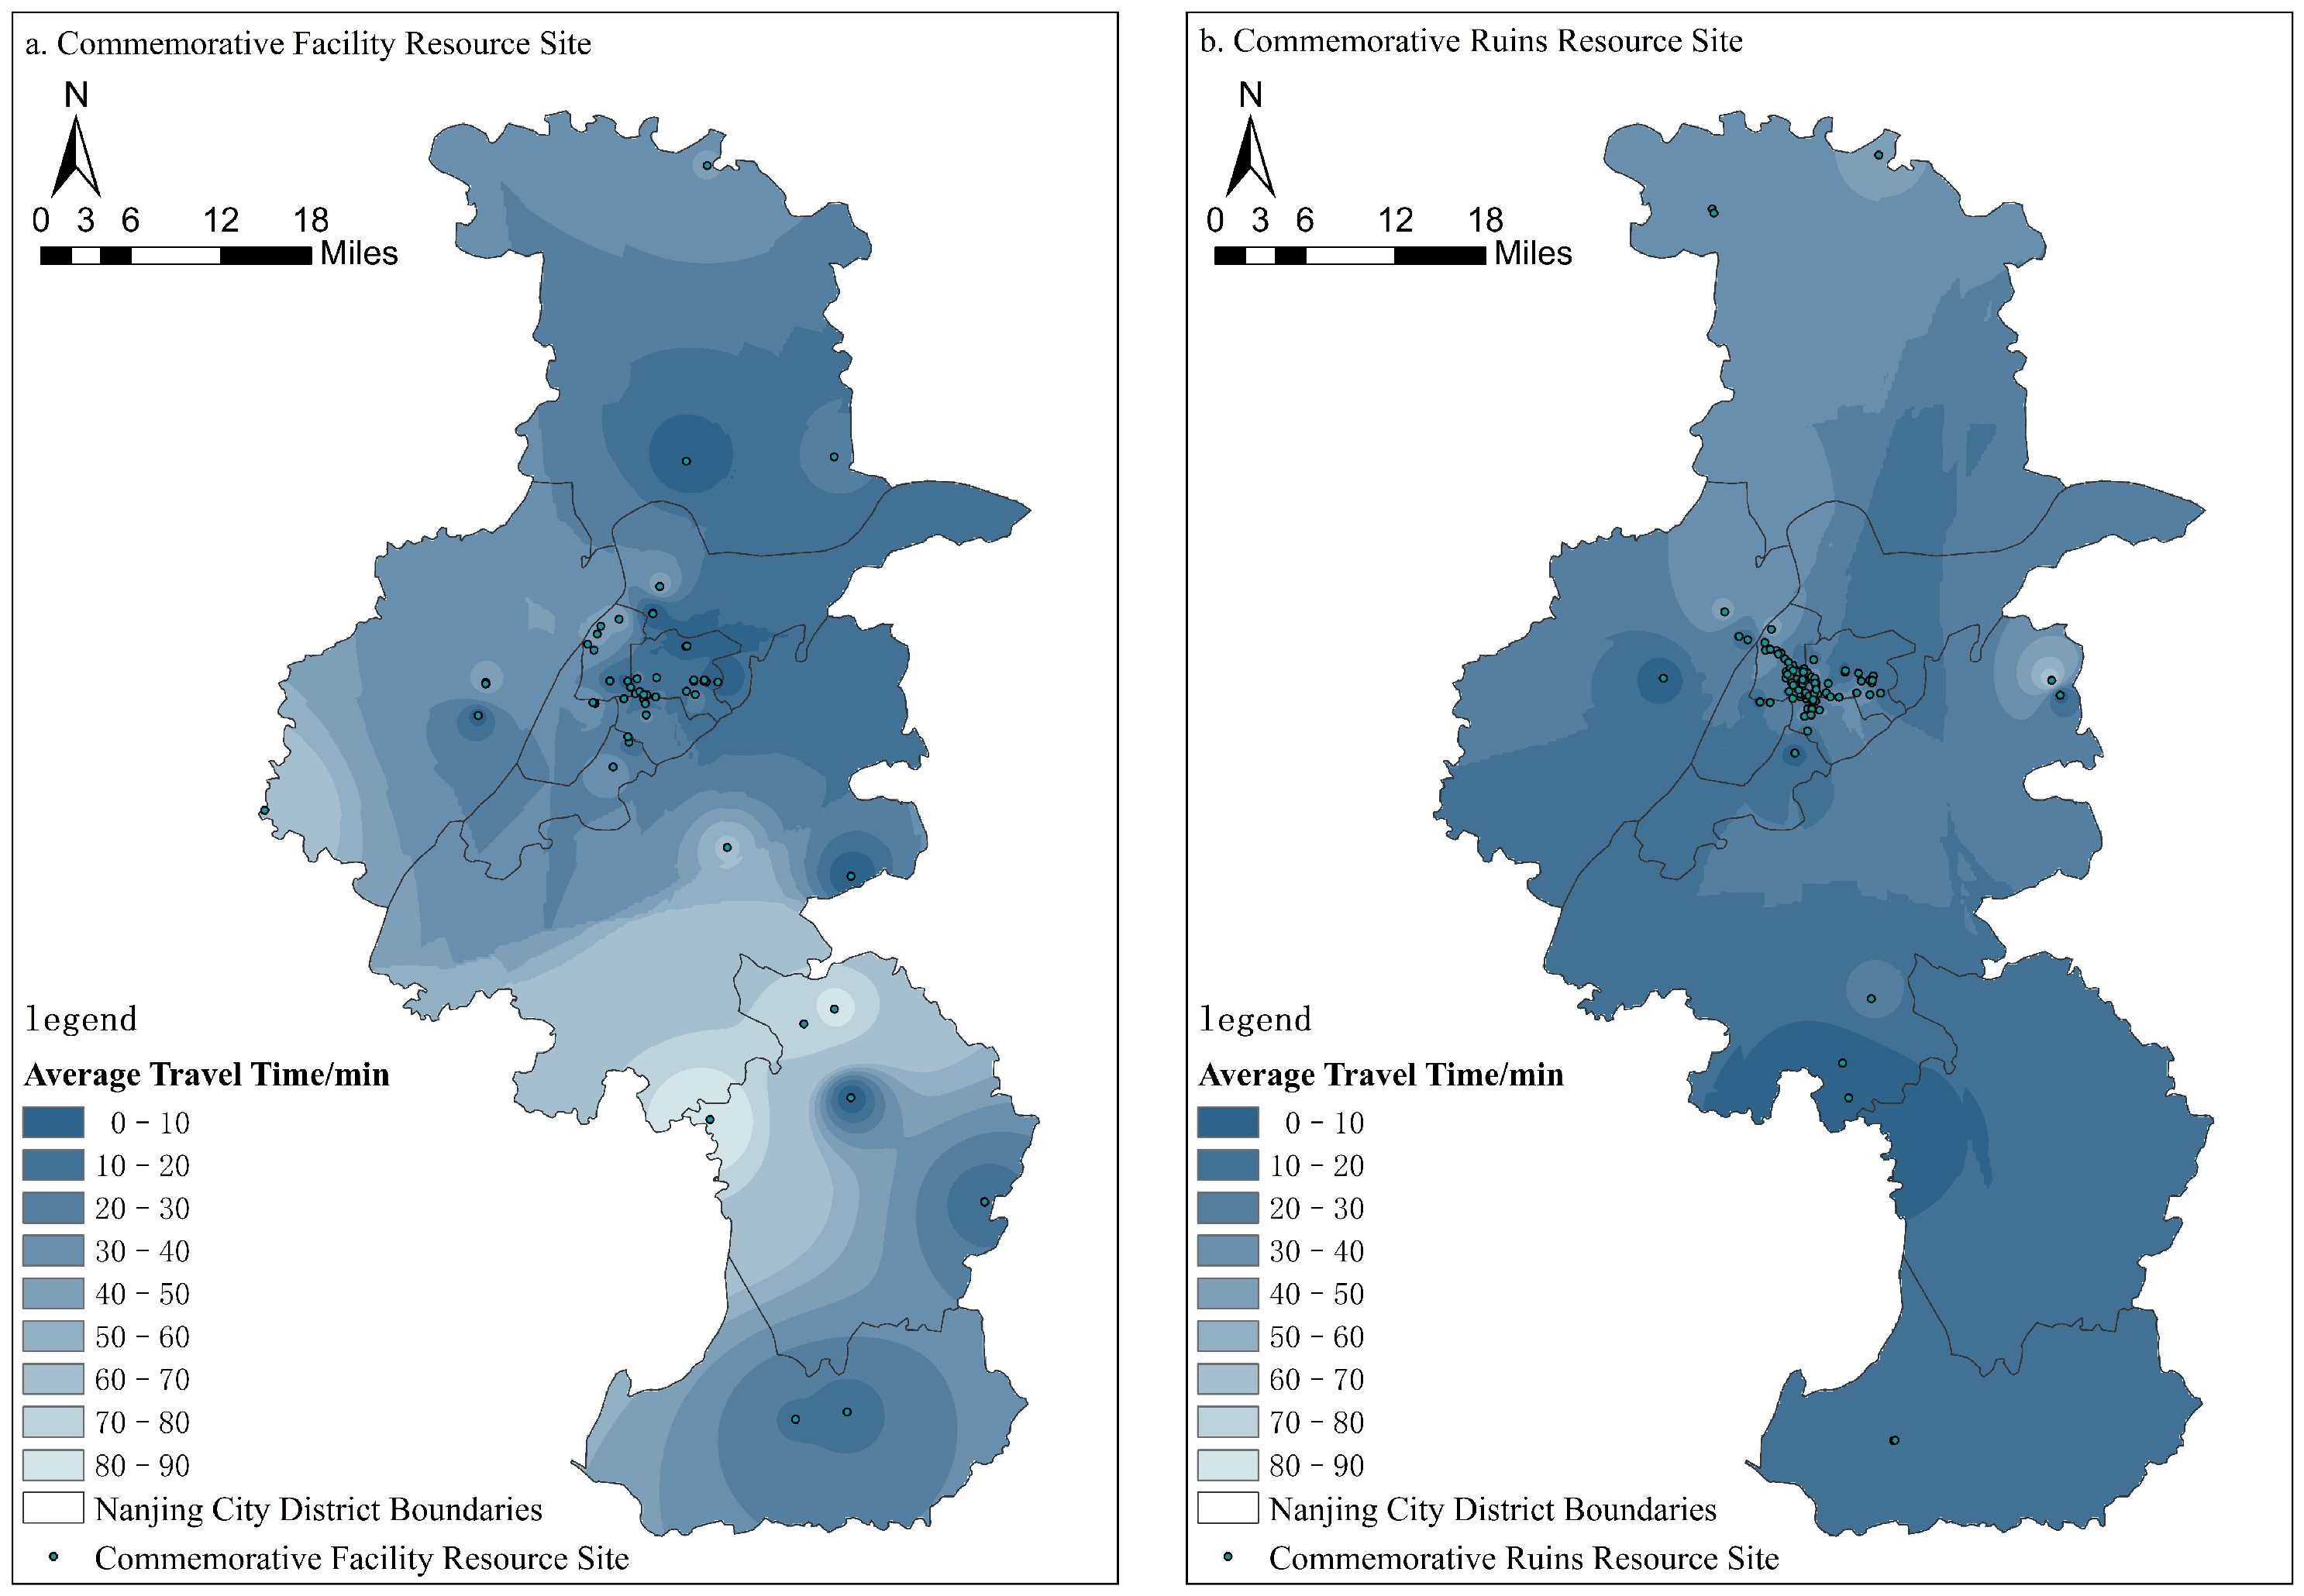
Commemorative Facility Resources exhibit a spatial differentiation pattern characterized by high urban and low suburban accessibility. High-accessibility centers are concentrated within Nanjing’s main urban districts (e.g., Xuanwu District, Gulou District, Qinhuai District) as well as the urban areas of Lishui, Gaochun, and Liuhe, featuring minimum average travel times less than 0.2 h and primarily located in areas characterized by high transportation network density (Figure 5a). Conversely, low-accessibility areas are distributed across northern Liuhe District, northern Lishui District, and northwestern Gaochun District, with average travel times of 1.0–2.6 h, which creates a sharp contrast with the central urban area. Within the central urban districts, Commemorative Facility Resources are highly clustered, forming extensive high-accessibility zones supported by dense road networks. In outer suburban areas such as Liuhe District and Lishui District, sporadically distributed resource points and insufficient transportation connections result in inconvenient travel between facilities. Border areas between inner suburbs (e.g., Jiangning District, Pukou District) and outer suburbs typically exhibit average travel times of 0.2–0.8 h, demonstrating a concentric pattern of decreasing accessibility outward.

4.3.2. Commemorative Ruins Resources

Commemorative Ruins Resources in Nanjing exhibit a spatial differentiation pattern of generally high accessibility with localized low areas. The high-accessibility centers cover nearly all major areas of Nanjing (Figure 5b), with minimum average travel times less than 0.2 h, which is primarily attributable to their proximity to major transportation networks. Limited low-accessibility areas occur in eastern Qixia District and northern Liuhe District, with average travel times of 1.0–2.0 h, forming a significant contrast with the central urban area.

4.3.3. Eminent Historical Figure’s Burials

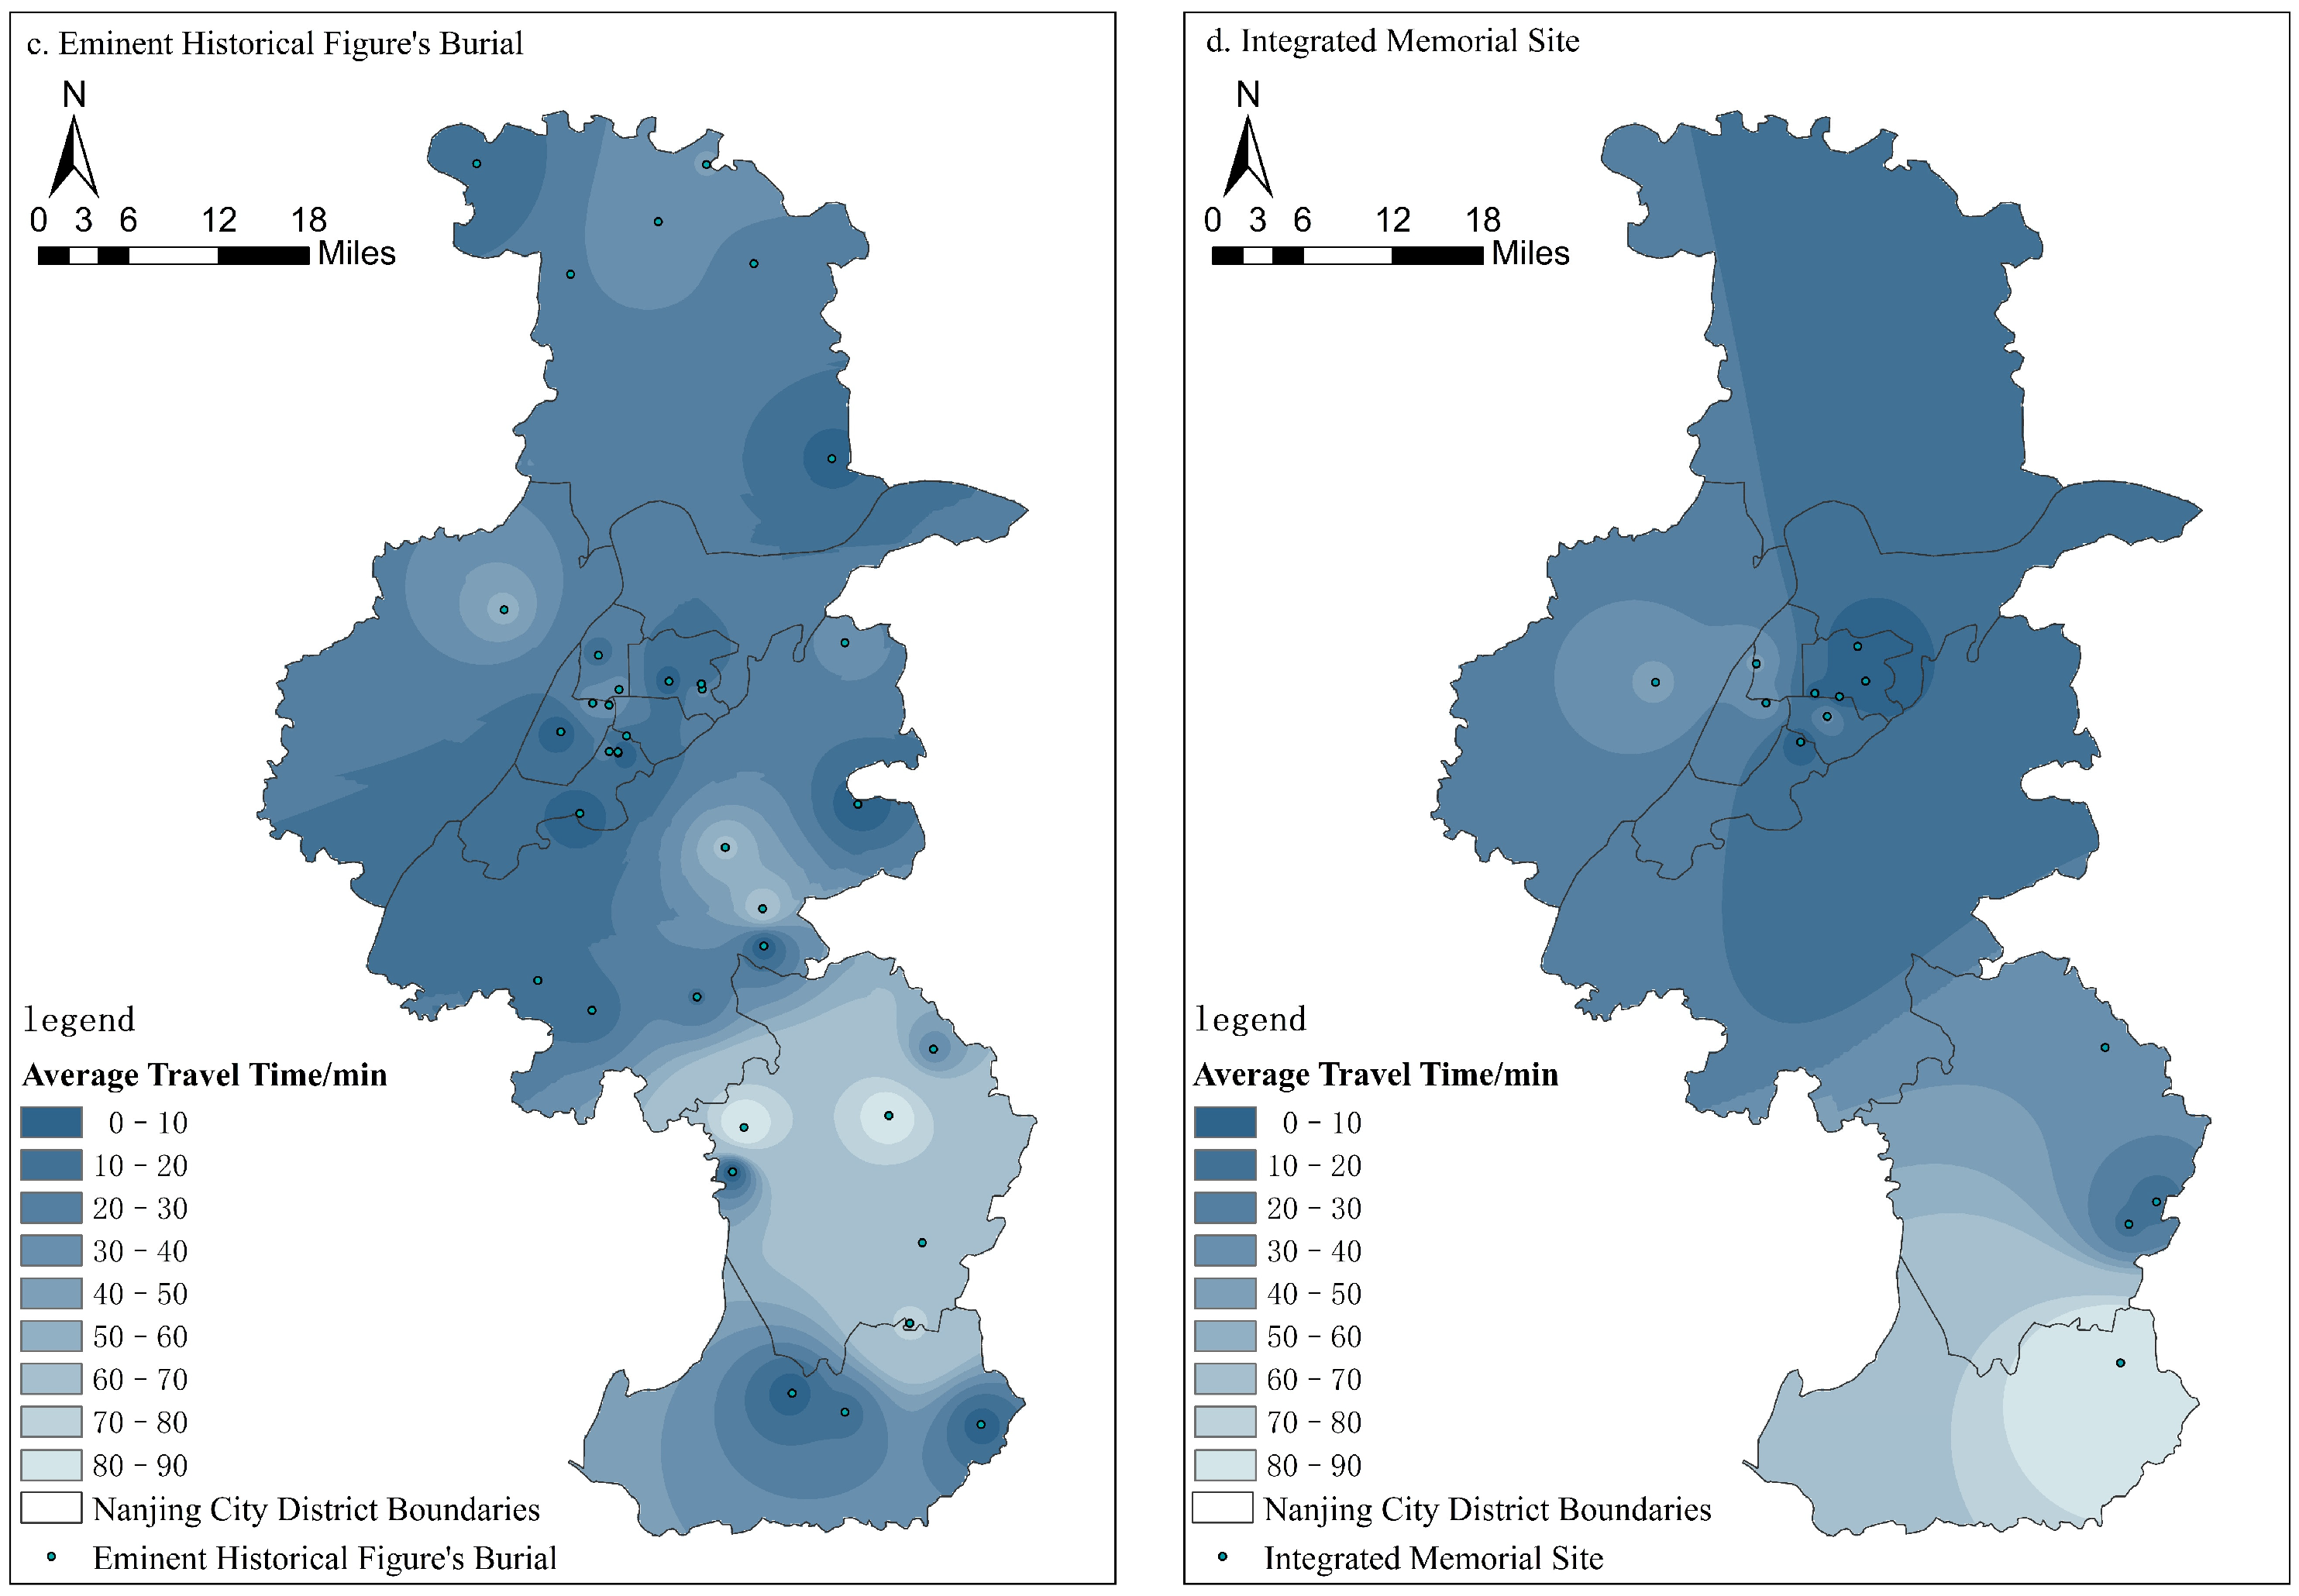
Eminent Historical Figure’s Burials demonstrate a spatial accessibility pattern characterized by central clustering with concentric diffusion. High-accessibility centers are located in Nanjing’s main urban district and resource-intensive areas (e.g., Qixia District, Yuhuatai District), where the shortest average travel times less than 0.2 h. However, significantly longer average travel times are exhibited in western Pukou and southern Jiangning districts (Figure 5c). Outer suburban areas (e.g., northern Liuhe District, southern Gaochun District) exhibit the longest average travel times (up to 2.5 h), indicating substantial regional accessibility disparities.

4.3.4. Integrated Memorials

Integrated Memorials in Nanjing exhibit a spatial differentiation pattern characterized by high core and low peripheral accessibility. High-accessibility centers are concentrated in the main urban districts (e.g., Xuanwu District, Gulou District, Qinhuai District), with minimum average travel times less than 0.2 h (Figure 5d). Owing to the limited quantity of Integrated Memorials in both Nanjing’s inner and outer suburban areas, their overall accessibility is comparatively lower than that of other commemorative landscape types. Low-accessibility areas occur in northern Liuhe District, southern Lishui District, and northeastern Gaochun District, with average travel times of 1.0–2.5 h, creating a marked contrast to the central urban area.

4.4. Analysis of Influencing Factors on Accessibility of Modern Commemorative Landscapes in Nanjing

Building upon previous research employing geographical detectors to analyze influencing factors of accessibility disparities [43,45], and considering Nanjing’s natural spatial characteristics, this study selected five determinant variables for detecting accessibility differences: attraction kernel density, regional population density, per capita GDP, elevation and attraction carrying capacity. Kernel density and accessibility analyses indicate that accessibility is correlated with the degree of spatial aggregation and geographical setting. Consequently, attraction kernel density and elevation were selected as two important variables. Regarding perceived accessibility, online attraction ratings and review counts have been demonstrated to influence accessibility perceptions. Furthermore, the level of economic development can constrain regional infrastructure development and maintenance, while the scale of attractions and their service capacity (particularly visitor carrying capacity) can directly affect their appeal and the resulting demand for accessibility. Therefore, the study incorporated population density, per capita GDP, and attraction carrying capacity into the influencing factors system to systematically identify accessibility disparity formation mechanisms.
The data processing procedure consisted of the following steps: Regional population density, per capita GDP, elevation, and attraction carrying capacity were directly classified into six levels using the natural breaks method (Jenks) applied to raster data. Additionally, attraction kernel density was first calculated through density analysis in ArcGIS 10.8, then similarly classified into six levels using the natural break’s method. Following preliminary processing, all datasets were imported into the geographical detector for analytical computation.
Single-factor detection results from the geographical detector (Table 8) reveal that attraction carrying capacity exhibits the strongest explanatory power (q = 0.653) for accessibility differences, followed by regional population density (0.519) and elevation (0.389). Attraction kernel density (0.297) and per capita GDP (0.197) exhibit relatively lower q -values and weaker explanatory power. Overall, attraction carrying capacity, regional population density, and elevation significantly influence the spatial distribution pattern of accessibility, while attraction kernel density and per capita GDP, though influential, contribute comparatively less.
Factor interactions may amplify or diminish their individual effects on spatial differentiation. To investigate these relationships, the interaction detection function was employed to analyze the five selected factors. Interaction patterns are categorized as follows: (1) q A B < m i n q A , q B indicates nonlinear weakening effect between the two factors; (2) m i n q A , q B < q A B < m a x q A , q B suggests single-factor nonlinear weakening; (3) q A B > m a x q A , q B demonstrates bifactor enhancement; (4) q A B = q A + q B represents linear bifactor enhancement; (5) q A B > q A + q B signifies nonlinear bifactor enhancement.
The interaction detection results (Table 9) demonstrate that all pairwise combinations of the influencing factors result in enhanced effects, indicating that the interactive explanatory power is equal to or greater than the sum of the individual factor effects. Overall, different factor pairs exhibited varying degrees of interactive influence, with all combinations significantly enhancing spatial accessibility patterns (as evidenced by interaction q -values predominantly > 0.100). Specifically, four factor pairs demonstrated nonlinear enhancement effects, while six exhibited bifactor enhancement effects, which reveals complex, diverse, and interconnected mechanisms underlying accessibility patterns. Among these, the interaction between regional population density and attraction carrying capacity was the most pronounced, reaching 0.913, followed by the interactions of attraction carrying capacity with elevation, per capita GDP, and attraction kernel density, with q -values of 0.867, 0.865, and 0.814. This indicates that accessibility patterns were significantly influenced by comprehensive interactions between natural and socio-economic factors. The combined effects of visitor carrying capacity, moderate elevation, sufficient population size, and a dense attraction layout collectively contribute to higher accessibility.

5. Discussion

5.1. Accessibility Differences Among Various Types of Commemorative Landscapes

Accessibility disparities among commemorative landscapes not only reflect the fundamental patterns of urban spatial resource allocation but also reveal the functional positioning and historical evolution characteristics of different landscape types, thereby exhibiting distinct hierarchical features. Previous research indicates that event-based commemorative landscapes—including war relics and historical event sites—are often constrained by historical and geographical conditions, typically remaining at their original event sites. This “spatial lock-in” effect results in generally poor accessibility [17]. Commemorative facility layouts typically align with urban central systems, forming an administrative center agglomeration pattern, whereas commemorative sites are influenced by both historical authenticity and urban renewal.
Personage-based commemorative sites (e.g., former residences), utilizing existing buildings, are more easily integrated into urban central areas, exhibiting moderate accessibility. Celebrity tomb landscapes, shaped by traditional beliefs and policies, combine ecological isolation with cultural integration features. Comprehensive commemorative sites (e.g., the Victory Memorial Hall of Crossing the Yangtze River), as national cultural symbols, balance ceremonial needs and public accessibility in their siting.
These findings validate the correlation between accessibility differences and landscapes types and spatial distributions, which is consistent with existing research. In Nanjing, commemorative facilities—concentrated in the main urban area and supported by dense road networks—exhibit optimal accessibility, with an average travel time of 0.2 h. This aligns with Moreno’s (2025) “15 min city” theory regarding urban cultural heritage accessibility [46]. In contrast, commemorative sites exhibit an average travel time of approximately 0.3 h, consistent with Hu’s (2025) findings on Chinese historical urban areas [4], reflecting the constraining effect of fragmented distribution in core zones. This also conforms to the spatial distribution characteristics of commemorative sites, dictated by historical events.
Tomb-based landscapes, typically located in suburban fringe areas or hilly terrains (e.g., Yuhuatai Martyrs’ Cemetery and the Zhongshan Mausoleum area on the southern slopes of Purple Mountain), face dual topographic and transportation constraints, with an average travel time of 0.8 h. This finding corroborates Chen’s (2020) “marginalized urban memory space” theory [47]. Although comprehensive commemorative sites feature large-scale facilities and strong attractiveness, their accessibility is most limited due to peripheral locations and scarcity. For instance, remote sites such as the Gaochun Youzi Mountain Martyrs’ Cemetery require travel times exceeding 2 h. These typological differences reflect a “core-focused, edge-neglected” tendency in commemorative landscape planning, where transportation disadvantages in peripheral landscapes further weaken cultural service functions.

5.2. Influencing Factors of Commemorative Landscape Accessibility

The formation mechanism of commemorative landscape accessibility involves a complex process of dynamic interplay among multiple factors, including natural geographical conditions, urban spatial structures, and socio-cultural demands. Accessibility represents not only the physical overcoming of spatial barriers but also a comprehensive manifestation of resource allocation efficiency and the realization of cultural rights. Regarding dominant factors, the accessibility analysis reveals the central role of the road network, consistent with Zhou’s (2023) findings on red tourist sites [48], further validating the decisive role of transportation infrastructure in cultural heritage accessibility.
Geographical detector results identify attraction carrying capacity (q = 0.653) as the most critical factor influencing accessibility. This finding contrasts with that of Pulido-Fernández, J. (2025)’s study on European cultural heritage sites, which identified tourist flow as the dominant factor [49]. The influence of elevation is significantly greater than that found in studies of flat European and American cities [50] but aligns with Tian’s (2023) analysis of mountainous cities [39], indicating the universality of terrain constraints in hilly urban areas. Population density (q = 0.519) exhibits weaker explanatory power than attraction carrying capacity, which is partially consistent with Vale’s (2023) conclusions regarding high-density European urban areas [51]. However, the weaker effect of population factors may reflect stronger policy orientation in Chinese urban transportation planning, rather than purely demand-driven approaches. A novel finding is that the interaction between attraction carrying capacity and elevation (q = 0.867) is significantly stronger than that of any single factor. This result transcends traditional research that separately analyzes social or natural conditions, providing a more systematic framework for understanding accessibility mechanisms in complex urban environments.
Additionally, the interaction effect between attraction kernel density and carrying capacity addresses a gap in existing research. Although attraction kernel density has relatively low individual explanatory power, its synergistic effect with regional population density significantly enhances model interpretability. This finding echoes Lee’s (2013) “facility-demand matching” theory [52], but further quantifies how optimized integration of urban functional layouts and transportation networks can enhance accessibility. Overall, while building on classical theories, this study expands accessibility research through multi-factor interaction analysis, providing more precise empirical evidence for planning strategies that balance natural constraints and societal needs.

5.3. Optimization Recommendations

To address the uneven distribution and significant accessibility disparities between central urban and suburban areas, this study proposes recommendations in three key areas: transportation network optimization, potential resource development, and the enhancement of display formats.
For transportation Network Optimization: Accessibility analysis and geographical detector results indicate that road network density is the most influential factor affecting accessibility. Given the slow expansion of Nanjing’s current highway and metro networks, simply adding new roads or metro lines cannot rapidly improve the accessibility of suburban commemorative landscapes. For suburban sites such as the Lishui Red Heritage Sites Group, it is recommended to introduce dedicated tourist shuttle services and establishing “landscape transfer stations” at Nanjing Metro stations to shorten transfer times and enhance accessibility.
Regarding potential Resource Development and Utilization: Geographical detector analysis shows that the interaction between elevation and attraction density significantly impacts accessibility. Kernel density analysis reveals an uneven distribution of commemorative landscapes across Nanjing. Therefore, in emerging development areas including Jiangbei New District and Yuhua Banqiao New Town, commemorative landscapes should be integrated through urban renewal projects and underutilized heritage spaces to alleviate core-periphery resource imbalance and improve accessibility.
For diversified Cultural Display Formats, regional population density, as an important factor, reflects how accessibility is shaped by visitor numbers, carrying capacity, and surrounding population density. This is corroborated by geographical detector results showing that attraction carrying capacity strongly influences accessibility. Thus, integrating existing commemorative landscapes with parks and plazas can enhance site capacity and expand service scope to improve accessibility. Additionally, digital strategies such as developing a “Nanjing Modern Commemorative Land-scape Guide” app could integrate real-time transport data with site interpretation to improve accessibility perception and cultural dissemination efficiency. The app could provide door-to-door navigation by combining landscape locations, real-time transport data, and transfer solutions, with a “transport mode cost comparison” module for suburban sites to enhance accessibility perception.

5.4. Research Limitations and Future Directions

This study innovatively applies geographical detectors to analyze the coupling relationship between commemorative landscapes and accessibility, quantifying interaction effects of road network density, terrain, and population factors to construct a “physical-perceptual” dual-dimensional evaluation system. This approach addresses the limitation of traditional studies focusing on single factors and offers a new tool for equity-oriented planning of historical landscapes. However, due to data collection constraints, socio-cultural factors (e.g., group emotional variations) are not fully incorporated, including varying emotional connections and cultural identity differences among demographic groups (e.g., locals/tourists, age/income groups). Online rating data are prone to user group biases (e.g., overrepresentation of young netizens), failing to capture authentic perceptions of marginalized groups (e.g., the elderly). This may lead to misalignment between analytical conclusions and real-world needs, limiting the social applicability of findings. Moreover, simplified transportation mode analysis results in incomplete spatial accessibility assessment, neglecting the impact of slow traffic systems (walking/cycling) and multimodal transportation options (e.g., shared bikes, transit transfers) on “last-mile” accessibility. Although Nanjing’s well-known commemorative landscapes attract domestic and international tourists, limiting the study to administrative boundaries and ignoring accessibility to neighboring areas reduces result generalizability.
Future research could integrate street-view imagery, walkability indices, and visitor trajectory data to refine socio-cultural dimensions and “last-mile” accessibility analysis. Cross-city comparisons and multimodal transportation models could validate the universality of the “core-periphery” pattern. Participatory community design and dynamic policy monitoring could transform accessibility improvements into enhanced cultural identity, revitalizing commemorative landscapes from “static heritage” to “everyday spaces” and achieving a sustainable balance between preservation and development.

6. Conclusions

As critical carriers of urban heritage, commemorative landscapes embody historical memory, cultural values, and social commemorative functions. Their rational represents a key component of high-quality urban development. This study focuses on modern commemorative landscapes in Nanjing, employing spatial analysis and accessibility metrics to systematically reveal their “core-periphery” distribution pattern. The results demonstrate that landscapes in the main urban area, supported by dense road networks and high public perception, form highly accessible zones, whereas suburban landscapes face significant accessibility barriers. By innovatively integrating physical and perceived accessibility, the study reveals that subjective evaluation metrics (e.g., online ratings and review volume) contribute 53.96% of the accessibility weighting. These findings provide quantitative evidence for optimizing cultural resource allocation in Nanjing and serve as a reference for heritage preservation and spatial equity planning in other historical cities. The study further contributes to achieving Sustainable Development Goal (SDG) 11 (Sustainable Cities and Communities) by revealing the spatial differentiation characteristics of cultural resources, thereby providing a foundation for policies aimed at reducing interregional inequalities in cultural services. Meanwhile, the proposed accessibility evaluation framework facilitates balancing heritage conservation and urban development needs, enhances resource use efficiency, reduces environmental impact, and promotes inclusive social development and sustainable tourism planning.
Commemorative landscapes are integral to both the conservation of historical cities and the provision of urban public cultural services. Their protection and rational use can enhance urban cultural identity and belonging, perpetuate historical continuity, promote inclusive development of urban cultural spaces, and provide crucial support for achieving sustainable urban transformation.

Author Contributions

Conceptualization, Z.Y., Z.Z., Z.F. and X.S.; Methodology, Z.Y. and X.S.; Software, Z.Y., Z.Z., Z.F., S.Z. and Y.G.; Validation, Z.Y., Z.F., S.Z. and Y.G.; Formal analysis, Z.Y., Z.Z., Z.F. and Y.G.; Investigation, Z.Y., S.Z. and X.S.; Resources, Z.Z.; Data curation, Z.Z., Z.F., S.Z. and Y.G.; Writing—original draft, Z.Y. and X.S.; Writing – review & editing, Z.Y., Z.Z., Z.F., Y.G. and X.S.; Visualization, Z.Y., Z.F. and X.S.; Supervision, X.S.; Project administration, Z.Y. and X.S.; Funding acquisition, Z.Y. and X.S. All authors have read and agreed to the published version of the manuscript.

Funding

This research was partially supported by Postgraduate Research & Practice Innovation Program of Jiangsu Province: KYCX24_1369.

Institutional Review Board Statement

Not applicable.

Informed Consent Statement

Not applicable.

Data Availability Statement

The original contributions presented in this study are included in the article. Further inquiries can be directed to the corresponding author.

Conflicts of Interest

The authors declare no conflict of interest.

References

  1. Qi, K. Meditations on Commemoration; China Architecture & Building Press: Beijing, China, 1996. (In Chinese) [Google Scholar]
  2. Ge, Y.; Lu, R. Evaluating the impact of monumental landscapes on population aggregation in Hongshan Culture. Asian Archaeol. 2025, 9, 97–108. [Google Scholar] [CrossRef]
  3. Tilden, F. Interpreting Our Heritage, 4th ed.; The University of North Carolina Press: Chapel Hill, NC, USA, 2009. [Google Scholar]
  4. Hu, H. Spatial Synergy Between Cultural Heritage and Metro Networks: A Case Study of Distribution Patterns and Value Assessment in Beijing. Sustainability 2025, 17, 1666. [Google Scholar] [CrossRef]
  5. Sert, J.L.; Léger, F.; Giedion, S. Nine Points on Monumentality. In Architecture Culture 1943–1968; Columbia University Press: New York, NY, USA, 1968; pp. 48–51. [Google Scholar]
  6. Kahn, L.I.; Latour, A. Louis I. Kahn: Writings, Lectures, Interviews; Rizzoli International Publications: New York, NY, USA, 1991. [Google Scholar]
  7. Rossi, A. Monumento a la Resistenza di Cuneo, 1962. DC PAPERS Rev. Crítica Teoría Arquitect. 2006, 15, 138–141. [Google Scholar]
  8. Liu, B.; Li, K. Preliminary study on design principles of memorial landscapes. Planners 2003, 2, 21–25. (In Chinese) [Google Scholar]
  9. Zhang, H.; Wang, X. Discussion on contemporary memorial landscape design. Chin. Landsc. Archit. 2010, 26, 38–42. (In Chinese) [Google Scholar]
  10. Feng, Y. Analysis of spatial characteristics of red memorial landscape design for event commemoration. Anhui Archit. 2021, 4, 26–28. (In Chinese) [Google Scholar] [CrossRef]
  11. Rofe, M.W. Memorial landscapes, recognition, and marginalisation: A critical assessment of Adelaide’s ‘cultural heart’. Landsc. Res. 2022, 48, 632–646. [Google Scholar] [CrossRef]
  12. Kelsch, P.J. Viewing the Landscape of the George Washington Memorial Parkway: A Cultural History of Scenic Resources and Landscape Ideology. Land 2022, 11, 1190. [Google Scholar] [CrossRef]
  13. van der Schriek, M. Landscape Biographies of Commemoration. Landsc. Res. 2018, 44, 99–111. [Google Scholar] [CrossRef]
  14. Rofe, M.W.; Ripmeester, M. Memorial Landscapes and Contestation: Destabilising Artefacts of Stability. Landsc. Res. 2023, 48, 609–614. [Google Scholar] [CrossRef]
  15. Różycki, S.; Michalski, M.; Kobielec, A. Use of Geoinformatics for the Digitization and Visualization of Sensitive Space in the Urban Landscape: A Case Study of the Gross-Rosen Sub-Camps Systems. Remote Sens. 2024, 16, 783. [Google Scholar] [CrossRef]
  16. Armstrong, L. Ms Memorial Maker: The Engagement of Female Memorial Makers with the Dominant Narrative of War in Australia’s War Memorial Landscape. Ph.D. Thesis, The Australian National University, Canberra, Australia, 2019. [Google Scholar]
  17. Attwa, Y.; Refaat, M.; Kandil, Y. A study of the relationship between contemporary memorial landscape and user perception. Ain Shams Eng. J. 2022, 13, 101527. [Google Scholar] [CrossRef]
  18. Gu, H. Thematic analysis of mausoleum landscape design: Comparative study of Ming Xiaoling Mausoleum, Sun Yat-sen Mausoleum and Yuhuatai Martyrs’ Cemetery. Hundred Sch. Arts 2010, 26 (Suppl. S1), 103–107. (In Chinese) [Google Scholar]
  19. Zhang, Q.; Zhang, Y. Research on spatial sequence of memorial landscape based on visual perception: A case study of Yuhuatai Martyrs’ Cemetery in Nanjing. Chin. Landsc. Archit. 2019, 35, 55–60. (In Chinese) [Google Scholar]
  20. Liu, B.; Jiang, S. Analysis of visual characteristics of memorial landscapes. Chin. Landsc. Archit. 2012, 28, 22–30. (In Chinese) [Google Scholar]
  21. David, B. Meaningful Pasts: Historical Narrative, Commemorative Landscapes, and Everyday Lives. Landsc. Hist. 2024, 45, 137–138. [Google Scholar] [CrossRef]
  22. Zhao, S.; Li, Q. Measurement of traffic accessibility and evaluation of tourism utilization potential of cultural heritage resources in Yunnan Province based on multi-source data. Arid. Land Resour. Environ. 2025, 39, 175–188. (In Chinese) [Google Scholar] [CrossRef]
  23. Hansen, W.G. How Accessibility Shapes Land Use. J. Am. Inst. Plan. 1959, 25, 73–76. [Google Scholar] [CrossRef]
  24. Du, H. Urban landscape accessibility evaluation model based on GIS and spatial analysis. Results Eng. 2025, 25, 103723. [Google Scholar] [CrossRef]
  25. Shang, N.; Cao, K. Study on the coupling between scenic spot accessibility and tourist flow in Xinjiang. World Reg. Stud. 2024, 33, 176–188. (In Chinese) [Google Scholar]
  26. Wang, W.; Cai, Y.; Xiong, X.; Xu, G. Evaluating Accessibility and Equity of Multi-Level Urban Public Sports Facilities at the Residential Neighborhood Scale. Buildings 2025, 15, 1640. [Google Scholar] [CrossRef]
  27. Lu, J.; Li, L.; Wang, W. Assessing accessibility and environmental equity in the context of sustained aging: Pathways for age-friendly urban park planning. Urban For. Urban Green. 2025, 108, 128768. [Google Scholar] [CrossRef]
  28. Meng, Y.; Xing, H.; Yuan, Y.; Wong, M.S.; Fan, K. Sensing urban poverty: From the perspective of human perception-based greenery and open-space landscapes. Comput. Environ. Urban Syst. 2020, 84, 101544. [Google Scholar] [CrossRef]
  29. Li, Z.; Liu, W.; Zhang, B. Spatial accessibility dynamics of urban parks in Nanjing, China: Implications for spatial equity. Open House Int. 2024, 49, 696–717. [Google Scholar] [CrossRef]
  30. Guo, N.; Wang, L. Analysis of kindergarten enrollment accessibility and influencing factors in Lanzhou City. Arid. Land Geogr. 2025, 48, 1043–1054. (In Chinese) [Google Scholar]
  31. Wang, Z.; Liu, Y.; Wang, T.; Tang, S.; Wu, X. Supply and demand analysis of urban thermal environments regulation services from an accessibility perspective: A coupled thermal risk and green space cooling assessment model. Urban Clim. 2025, 60, 102356. [Google Scholar] [CrossRef]
  32. Jalkanen, J.; Vierikko, K.; Kujala, H.; Kivistö, I.; Kohonen, I.; Lehtinen, P.; Toivonen, T.; Virtanen, E.; Moilanen, A. Identifying priority urban green areas for biodiversity conservation and equitable recreational accessibility using spatial prioritization. Landsc. Urban Plan. 2025, 259, 105356. [Google Scholar] [CrossRef]
  33. Fang, C.; Li, J.; Yang, B. Research on the protection of war landscape heritage from the perspective of collective memory: A case study of Nanjing Anti-Japanese War landscape heritage. Mod. Urban Res. 2017, 7, 22–30. (In Chinese) [Google Scholar]
  34. Meng, M. Differences between Chinese and Western memorial gardens and the trend of mutual integration. Chin. Landsc. Archit. 2007, 1, 61–65. (In Chinese) [Google Scholar]
  35. Li, J. Problems and protection suggestions of Anti-Japanese War sites in western China: The third paper of the series “Investigation and Research on Anti-Japanese War Sites in Western China”. Forum Chin. Cult. 2015, 12, 14–20+191. (In Chinese) [Google Scholar]
  36. Liu, L. Protection and Utilization of Modern Revolutionary Historical Sites. South. Cult. Relics 2005, 1, 118–122. (In Chinese) [Google Scholar]
  37. Savary, P.; Foltête, J.C.; Garnier, S. Cost distances and least cost paths respond differently to cost scenario variations: A sensitivity analysis of ecological connectivity modeling. Int. J. Geogr. Inf. Sci. 2022, 36, 1652–1676. [Google Scholar] [CrossRef]
  38. Li, Y. Measurement of facility service entity scope under CSPON background: Research on the all-position accessibility network model. Nat. Resour. Inform. 2025, 1, 72–80. (In Chinese) [Google Scholar]
  39. Tian, J.; Ming, Q.; Liu, A. Evaluation model of tourism accessibility based on time geography and its application in mountain tourist attractions. Hum. Geogr. 2023, 38, 181–191. (In Chinese) [Google Scholar] [CrossRef]
  40. Wang, K.; Xiao, Y.; Zhang, Z.; Zhiwei, L.Y. Research on tourism cultural scene types along the Grand Canal based on POI data. J. Geo-Inf. Sci. 2025, 27, 1738–1750. (In Chinese) [Google Scholar]
  41. Ji, X.; Xue, W.; Li, J.; Chen, F.; Li, W. Research on the measurement of Golden Week self-driving tour accessibility and influencing factors based on spatio-temporal utility method. J. Arid Land Res. Environ. 2024, 38, 197–208. (In Chinese) [Google Scholar] [CrossRef]
  42. Zou, Z.; Yun, Y.; Sun, J. Entropy method for determination of weight of evaluating indicators in fuzzy synthetic evaluation for water quality assessment. J. Environ. Sci. 2006, 18, 1020–1023. [Google Scholar] [CrossRef]
  43. Xiao, W.; Huang, E.; Li, C.; Li, H. Investigating the spatial distribution and influencing factors of traditional villages in Qiandongnan based on ArcGIS and geodetector. Sci. Rep. 2025, 15, 5786. [Google Scholar] [CrossRef]
  44. Li, W.; Xiao, J.; Zeng, P. Research on spatial distribution characteristics and influencing factors of cultural tourism resources along the Sichuan-Tibet route. J. Tibet Univ. Soc. Sci. Ed. 2025, 40, 203–209. (In Chinese) [Google Scholar] [CrossRef]
  45. Tan, X.; Liu, Z.; Shi, L.; Huang, X. Geospatial analysis of sports tourism resources in China’s urban clusters: A case study of the Sichuan-Chongqing region utilizing GIS and the geographic detector. Front. Sports Act. Living 2024, 6, 1496469. [Google Scholar] [CrossRef]
  46. Moreno, C.; Gall, C.; Woo, J.; Lee, D.; Bencekri, M. Assessing accessibility of cultural sites through the 15-minute city framework in Seoul. Int. J. Urban Sci. 2025, 29, 8–39. [Google Scholar] [CrossRef]
  47. Chen, X.; Zhang, H.; Yuan, Z. Contested memory amidst rapid urban transition: The cultural politics of urban regeneration in Guangzhou, China. Cities 2020, 102, 102755. [Google Scholar] [CrossRef]
  48. Zhou, H.; Ma, Y.; Fan, Y.; Ning, X. Spatial distribution and accessibility analysis of red tourism resources in Inner Mongolia. Arid. Land Geogr. 2023, 46, 814–822. (In Chinese) [Google Scholar]
  49. Pulido-Fernández, J.I.; Carrillo-Hidalgo, I.; López-Sánchez, Y.; Casado-Montilla, J. Assessing Social Carrying Capacity of Tourists in Protected Natural Areas. Curr. Issues Tour. 2025, 28, 1062–1078. [Google Scholar] [CrossRef]
  50. Neutens, T.; Schwanen, T. Equity of Urban Service Delivery: A Comparison of Different Accessibility Measures. Environ. Plan. A 2010, 42, 1613–1635. [Google Scholar] [CrossRef]
  51. Vale, D.; Lopes, A.S. Accessibility inequality across Europe: A comparison of 15-minute pedestrian accessibility in cities with 100,000 or more inhabitants. Urban Sustain. 2023, 3, 55. [Google Scholar] [CrossRef]
  52. Lee, G.; Hong, I. Measuring Spatial Accessibility in the Context of Spatial Disparity between Demand and Supply of Urban Park Service. Landsc. Urban Plan. 2013, 119, 85–90. [Google Scholar] [CrossRef]
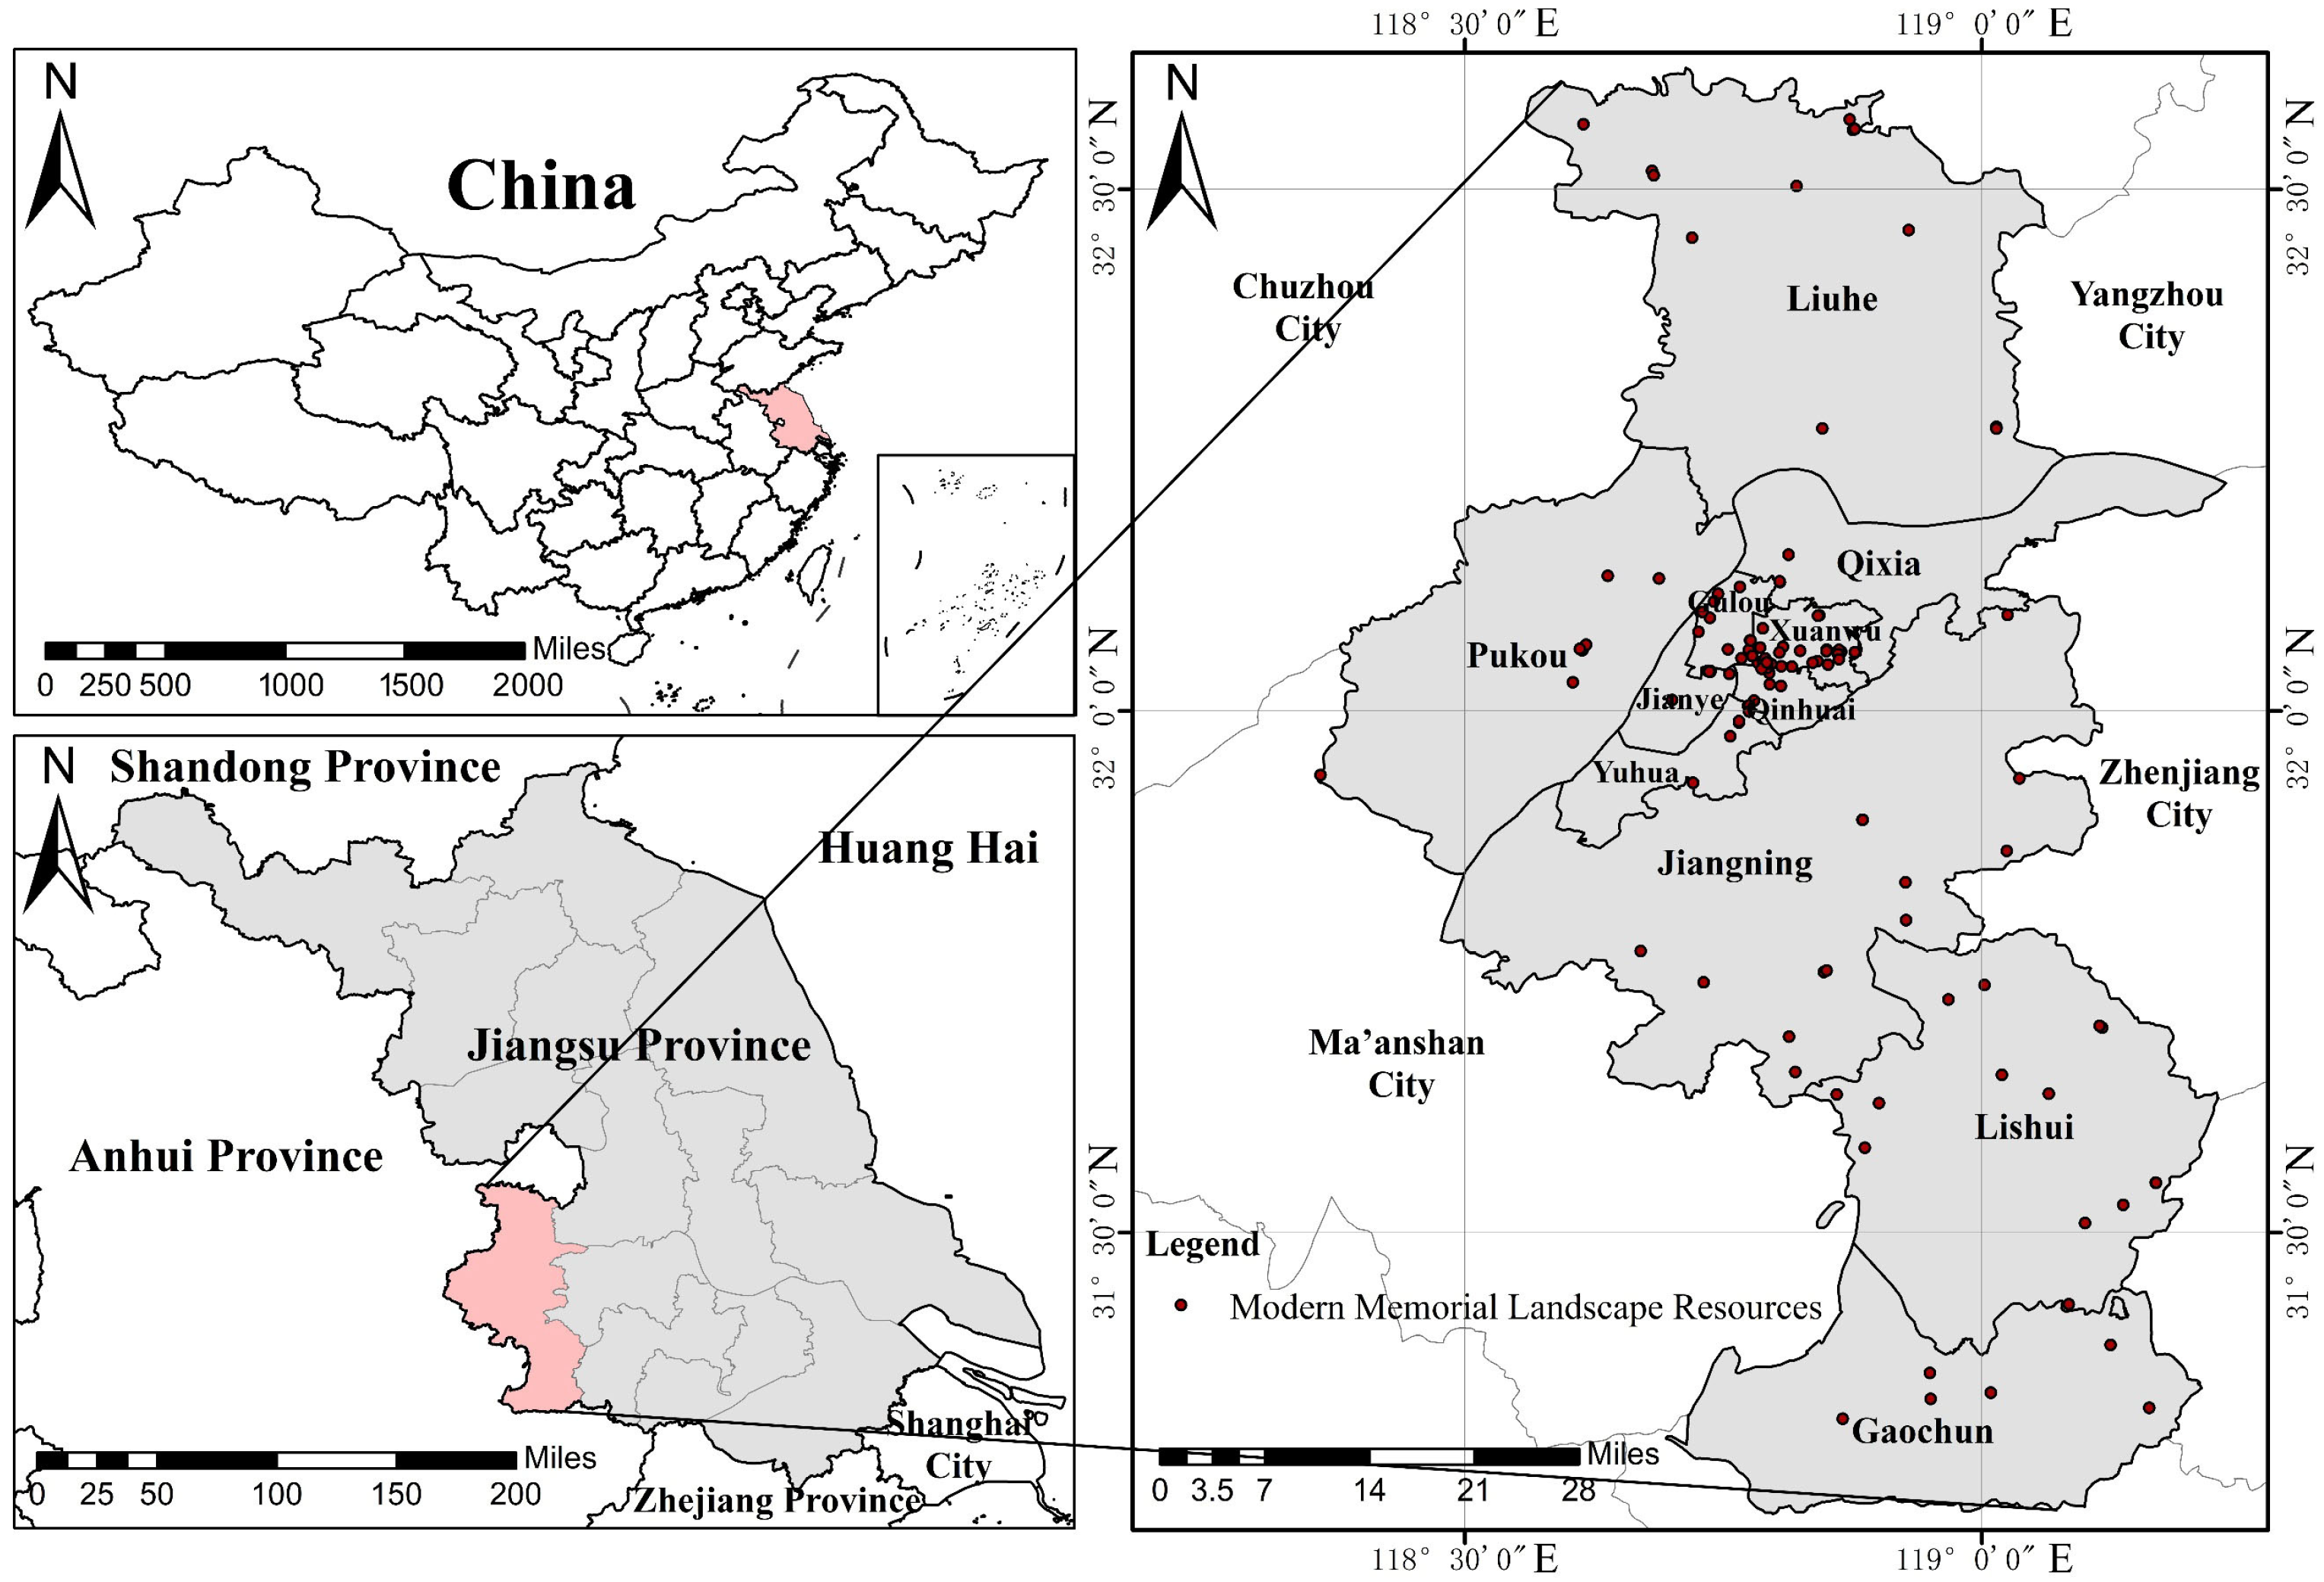
Figure 1. The location map of Nanjing City and a distribution map of modern commemorative landscapes within Nanjing.
Sustainability 17 08355 g001
Figure 2. Research Framework.
Sustainability 17 08355 g002
Figure 3. Core density analysis of spatial distribution of modern commemorative landscapes in Nanjing.
Sustainability 17 08355 g003
Figure 4. Analysis of overall accessibility spatial pattern of modern commemorative landscapes in Nanjing ((a). Spatial Accessibility Analysis; (b). Perceived Accessibility Analysis; (c). Comprehensive Accessibility Analysis).
Sustainability 17 08355 g004
Figure 5. Spatial Pattern Analysis of Accessibility for Different Types of Modern Commemorative Landscapes in Nanjing.
Sustainability 17 08355 g005aSustainability 17 08355 g005b
Table 1. Classification of Modern Commemorative Landscapes in Nanjing.
ClassCoverage TypesRepresentative LandscapeNumber of SitesProportion
Eminent Historical Figure’s Burial SiteMartyrs’ tombs, Martyrs’ cemeteries, soldiers’ cemeteriesXitian Temple Cemetery Martyrs’ Cemetery, Yuntai Mountain Anti-Japanese Martyrs’ Cemetery, Zhuzhen Revolutionary Martyrs’ Cemetery, National Revolutionary Army Fallen Soldiers’ Cemetery3629.03%
Commemorative Facility Resource SiteMemorial sites, monuments, memorial halls, memorials and former residences of famous peopleThe Square commemorating the 20 May Student Movement, the former residence of John Rabe, the Memorial Hall of the Chinese Communist Delegation in Meiyuan New Village, and the exhibition hall of the former site of the Nanjing Lijixiang Comfort House5645.16%
Commemorative Ruins Resource SiteMemorial Site, Historic SiteThe site of the 2 July strike of the railway workers in Liangpu, the site of the first police station of the New Fourth Army, and the site of the Pearl Bridge tragedy of the national student anti-Japanese patriotic movement2016.13%
Integrated Memorial SiteMemorial scenic spots, large memorial halls, groups of memorial sites memorial parkMemorial Hall for the Victims of the Nanjing Massacre by Japanese Invading China, Yuhuatai Scenic Area, Memorial Hall for the Victory of Crossing the Yangtze River, Nanjing Anti-Japanese Aviation Martyrs Park, Zhongshan Mausoleum Scenic Area, and Xishe—Ligao County Anti-Japanese Democratic Government Old Site
Group
129.68%
Total 124
Table 2. Sample POI Data Fields.
NameYearTypeAddressLongitudeLatitudeLevelFloor space
Yue Army Martyrs’ Cemetery1912Eminent Historical Figure’s Burial132 Shuiximen Street118.76767432.039187Jiangsu Provincial Cultural Protection Unit377 m2
The memorial hall of Meiyuan New Village of the CPC delegation1954Commemorative Facility Resource18-1 Hanfu Street118.80814732.048913National key cultural protection units4600 m2
The former site of the Central Army Military Academy1908Commemorative Ruins ResourceNo. 3 Huangpu Road118.81602832.059976National key cultural protection units23,499 m2
Yuhuatai Scenic Area1949Integrated Memorial215 Yuhua Road118.78685532.003382National key cultural protection units129.49 ha
Table 3. Spatial distribution pattern of modern and contemporary memorial landscapes in Nanjing.
Types of Memorial Landscapes Z Value p -ValueAverage Nearest Neighbor IndexDistribution CharacteristicsWhether the
Results are
Significant
Commemorative Facility Resource−4.300.000.66clusteredYes
Commemorative Ruins Resource−5.000.000.72clusteredNo
Eminent Historical Figure’s Burial0.660.511.09dispersedNo
Integrated Memorial4.590.001.80dispersedYes
All−12.320.000.48clusteredYes
Note: Z value is less than −2.58 or greater than 2.58, and p -value is below 0.01, indicating that the result is considered significant at the 99% level.
Table 4. Calculation Results of CRITIC Weighting Method.
ItemIndicator
Variability
Indicator
Conflict
Information
Content
Weight
Review Count of Commemorative Landscapes0.2640.9010.23833.9964%
Rating of Commemorative Landscapes0.1360.9010.12366.0036%
Table 5. Sample Evaluation Results of Perceived Accessibility for Modern Commemorative Landscapes Based on Weight Analysis.
Attraction NameLandscape TypeResult of Perceived
Accessibility
Youzishan Martyrs CemeteryEminent Historical Figure’s Burials0.558
“20 May” Student Movement Memorial SquareCommemorative Facility Resources0.389
Former Headquarters Site of the New Fourth Army First DetachmentCommemorative Ruins Resources0.220
Yuhuatai Scenic AreaIntegrated Memorials0.755
Table 6. Summary of Weight Calculation Results Using Entropy Weight Method.
ItemInformation Entropy eInformation Utility Value dWeight
Coefficient w
Spatial Accessibility0.98370.016346.0423%
Perceived Accessibility0.97530.024753.9577%
Table 7. Sample Results of Comprehensive Accessibility Calculation for Modern Commemorative Landscapes in Nanjing Based on Weight Analysis.
Attraction NameComprehensive Accessibility Evaluation ResultSpatial CharacteristicsPerceptual Disparity
Youzishan Martyrs Cemetery0.399Surrounded by rural roads in GaochunInsufficient supporting facilities with historical significance
“20 May” Student Movement Memorial Square0.615Core urban areaTransportation hub with moderate public recognition
Former Headquarters Site of the New Fourth Army First Detachment0.427Node of district/county roads in GaochunRemote location with low visibility
Yuhuatai Scenic Area0.818Node of county roads in JiangningNational 5A-level attraction with high review volume
Table 8. Detection Results of Influencing Factors on Accessibility of Modern Commemorative Landscapes in Nanjing.
X1-Attraction Kernel
Density
X2-Regional Population DensityX3-Per Capita GDPX4-ElevationX5-Attraction Carrying
Capacity
q  statis0.2970.5190.1970.3890.653
p-value0.0000.0000.0020.0000.000
Table 9. Location map of Nanjing City and a distrs on Accessibility of Modern Commemorative Landscapes in Nanjing.
FactorsX1-Attraction
Kernel Density
X2-Regional
Population
Density
X4-Per Capita GDPX5-ElevationX6-Attraction
Carrying Capacity
X1-Attraction kernel density0.297
X2-Regional population density0.644 a0.519
X3-Per capita GDP0.551 b0.636 a0.197
X4-Elevation0.687 b0.760 a0.660 b0.389
X5-Attraction carrying capacity0.814 a0.913 a0.865 b0.867 a0.653
Note: The a logo indicates two-factor enhancement; the b logo indicates nonlinear enhancement.
Disclaimer/Publisher’s Note: The statements, opinions and data contained in all publications are solely those of the individual author(s) and contributor(s) and not of MDPI and/or the editor(s). MDPI and/or the editor(s) disclaim responsibility for any injury to people or property resulting from any ideas, methods, instructions or products referred to in the content.