Article

Evaluation Method for Nitrogen Oxide Emission Reduction Using Hypothetical Automobile Model: A Case in Guangdong Province

1
School of Geography and Remote Sensing, Guangzhou University, Guangzhou 510006, China
2
Institute of Aerospace Remote Sensing Innovations, Guangzhou University, Guangzhou 510006, China
3
College of Science, Northeastern University, Boston, MA 02115, USA
4
Department of Biological, Geological, and Environmental Sciences, University of Bologna, 48123 Ravenna, Italy
*
Authors to whom correspondence should be addressed.
Sustainability 2025, 17(16), 7334; https://doi.org/10.3390/su17167334
Submission received: 21 July 2025 / Revised: 11 August 2025 / Accepted: 12 August 2025 / Published: 13 August 2025

Abstract

As a key precursor of tropospheric ozone and secondary particulate matter, nitrogen oxides (NOx) exert significant impacts on air quality. Traffic emissions represent a dominant source of near-surface NOx. The widespread adoption of new energy vehicles (NEVs) has progressively transformed the automobile fleet composition, leading to measurable reductions in NOx emissions. This study developed a NOx emission inventory model to quantify the impact of NEV penetration on emission trends in Guangdong (2013–2022), under the assumption that the emission shares of internal combustion engine vehicles (ICEVs) and NEVs have no significant change in adjacent years. Results demonstrate that total vehicular NOx emissions peaked in 2019 at 55.69 × 10⁴ tons (a 16.6% increase from 2018), followed by a consistent decline. ICEVs exhibited a declining emission share from 0.037 × 10⁴ tons/year in 2013 to 0.022 × 10⁴ tons/year in 2019—a 40.5% reduction, attributable to progressive technological advancements. Following a marginal increase (2019–2021), the emission share declined significantly to 0.019 × 10⁴ tons/year in 2022. In contrast, NEVs contributed to emissions reduction, with maximal mitigation observed in 2021 (−0.241 × 10⁴ tons). ICEVs initially demonstrated emission reductions (2014–2017), succeeded by a transient increase (11.7 × 10⁴ tons through 2021) before resuming decline in 2022. The NEV-driven mitigation effect intensified progressively from 2018 to 2021, with modest attenuation in 2022.

1. Introduction

The nitrogen oxide family (NOx = NO + NO2), primarily generated through combustion processes—including vehicular emissions, industrial activities, and fossil fuel power plants—also originates from natural sources such as lightning and biomass burning. NOx are key components that promote the formation of photochemical smog and precursors of PM2.5 and tropospheric ozone, which play a crucial role in atmospheric chemistry; they contribute significantly to environmental challenges like ozone pollution, haze formation, and acid rain [1,2]. Chronic exposure to elevated NOx concentrations is associated with severe health risks, including central nervous system damage, pulmonary edema, bronchial disorders, ocular irritation, and respiratory diseases. Their high toxicity underscores the urgency of emission control measures [3].
Automobile emissions constitute the predominant anthropogenic source of NOx in urban atmospheres. Continuous improvements in internal combustion engine (ICE) technology and exhaust aftertreatment systems have progressively reduced NOx emissions from ICE vehicle (ICEVs). Current mitigation strategies focus primarily on two approaches: optimizing engine combustion efficiency and implementing advanced exhaust filtration systems that incorporate catalytic converters and particulate filters [4]. Wang et al. [5] indicated that emissions at load rates below 30% during LLCs account for more than 67.5% of the total cycle emissions, particularly under idling and start–stop conditions. Vijai et al. [6] reported that exhaust gas recirculation (EGR) set at 15–25% resulted in the best emission control in Low-Temperature Combustion (LTC) engines. In contrast to ICEV, new energy vehicles (NEVs) utilize battery-powered propulsion systems, thereby eliminating direct NOx emissions from fuel combustion during operation [7]. The widespread adoption of NEVs offers dual environmental benefits: reducing ICEV emissions while significantly contributing to greenhouse gas mitigation. Projections indicate that achieving carbon neutrality in road transport by 2060 through NEV deployment could reduce cumulative greenhouse gas emissions by 48%, compared to 2020–2060 baseline scenarios [3]. Life cycle assessment using the Well-to-Wheels (WTW) methodology demonstrates substantially lower carbon emissions and reduced energy consumption for NEVs [8]. Furthermore, studies have identified significant co-benefits for air quality improvement, with NEVs showing marked reductions in multiple atmospheric pollutants (NOx, CO, NMHC, SO2, and PM10) and CO2 when replacing ICEVs [9]. The promotion of NEVs shows great potential for emission reduction.
The Chinese government has successively implemented supportive policies to promote the development of NEV industries. The Development Plan for New Energy Vehicle Industries (2021–2035) sets a target to significantly enhance the market competitiveness of NEVs by 2025. Regarding NOx emission control, China has established specific emission standards for six major industries, including thermal power, ironmaking, steel, cement, brick production, and boilers. Since 2015, the national ultra-low-emission standards have been progressively implemented for coal-fired power plants and steel industries. The Ministry of Ecology and Environment has formulated and issued one ambient air quality standard, one comprehensive standard, and eight industry-specific emission standards [10]. Guangdong Province, as a major market for new energy technologies, has actively supported NEV and renewable energy development through its 14th Five-Year Plan, and it serves as an ideal research area for investigating the NOx reduction effects resulting from rapid NEV adoption [10]. Quantifying the specific impacts of automobile fleet structure changes on NOx reduction provides crucial scientific references for pollution control measures and atmospheric environment improvement, while informing future policy optimization [11].
Many researchers have attempted to optimize models or upgrade configurations to explore the effectiveness of nitrogen oxide emission reduction. Zhou et al. [12] demonstrated how machine learning can model nonlinear relationships in emission processes, which is a methodology transferable to vehicle emission prediction where similar nonlinear dynamics exist between engine parameters and NOx output. Simpkins pointed out the potential of electric vehicles (EVs) as a critical pathway for nitrogen oxide (NOx) mitigation [13]. Feng et al. [14] comprehensively depicted global sectoral human-induced nitrous oxide (N2O) emissions by country, previewed the economic costs and social benefits from abating N2O emissions, and summarized roadblocks for achieving N2O emission reductions. Amin et al. discussed technologies for controlling NOx emissions from vehicular engines, such as exhaust gas recirculation and selective catalytic reduction, providing engine-level control techniques for internal combustion engine vehicles (ICEVs) [15]. Akopov et al. [16] simulated dynamic interactions between pollutants and urban ecosystems with an agent-based modeling framework. While the case focuses on stationary sources, its methodology provides valuable insights into simulating complex system-level interactions between emission sources and environmental factors. Current research reveals a vacancy in evaluating NOx reduction effects associated with NEV-induced transformations in automobile fleet structures. This study develops a multi-source data-driven NOx emission accounting model to quantify emission shares from both ICEVs and NEVs. Focusing on Guangdong Province as a demonstration area, we systematically assess the absolute reduction and proportional contributions of NOx emissions from these two automobile types during 2013–2022, thereby evaluating the NOx reduction effectiveness resulting from structural changes in the automobile industry. The rest of the paper is organized as follows: Section 2 presents the data and methods. Section 3 presents the results and discussion. Section 4 provide some conclusions and policy recommendations.

2. Data and Methods

2.1. General Situation

The near-surface NO2 concentration data obtained from the National Earth System Science Data Sharing Platform—Yangtze River Delta Science Data Center (http://geodata.nnu.edu.cn, accessed on 10 March 2025) [17] reveal a general declining trend in NO2 concentrations across Guangdong Province from 2013 to 2022. The provincial NO2 levels in 2022 were significantly lower than those recorded in 2013 (Figure 1) [18].
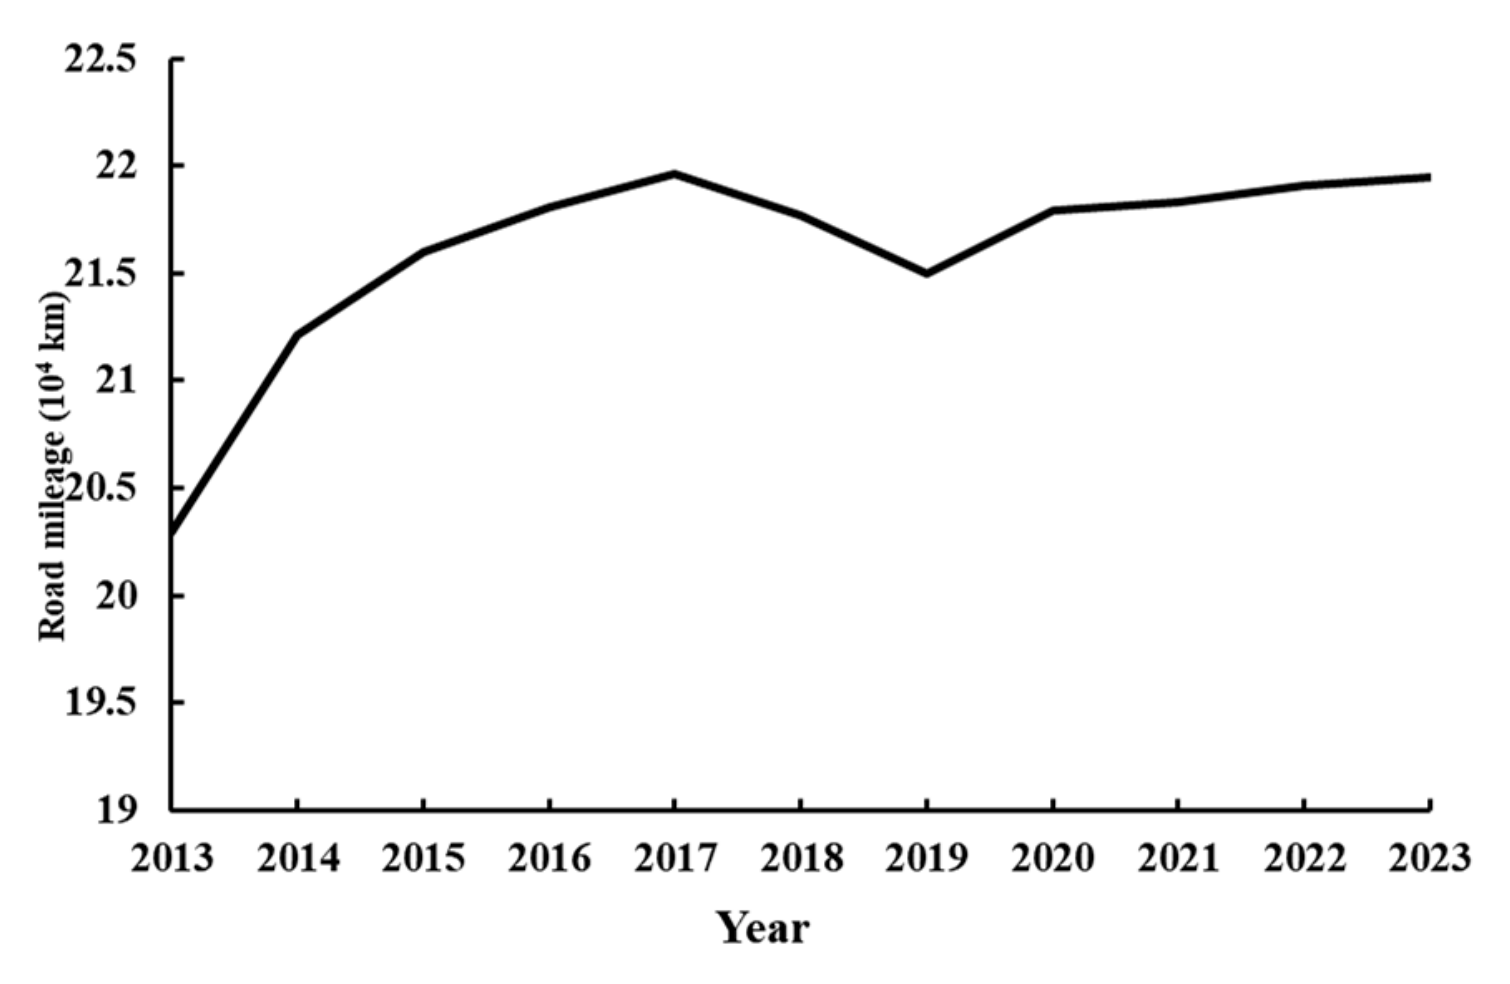
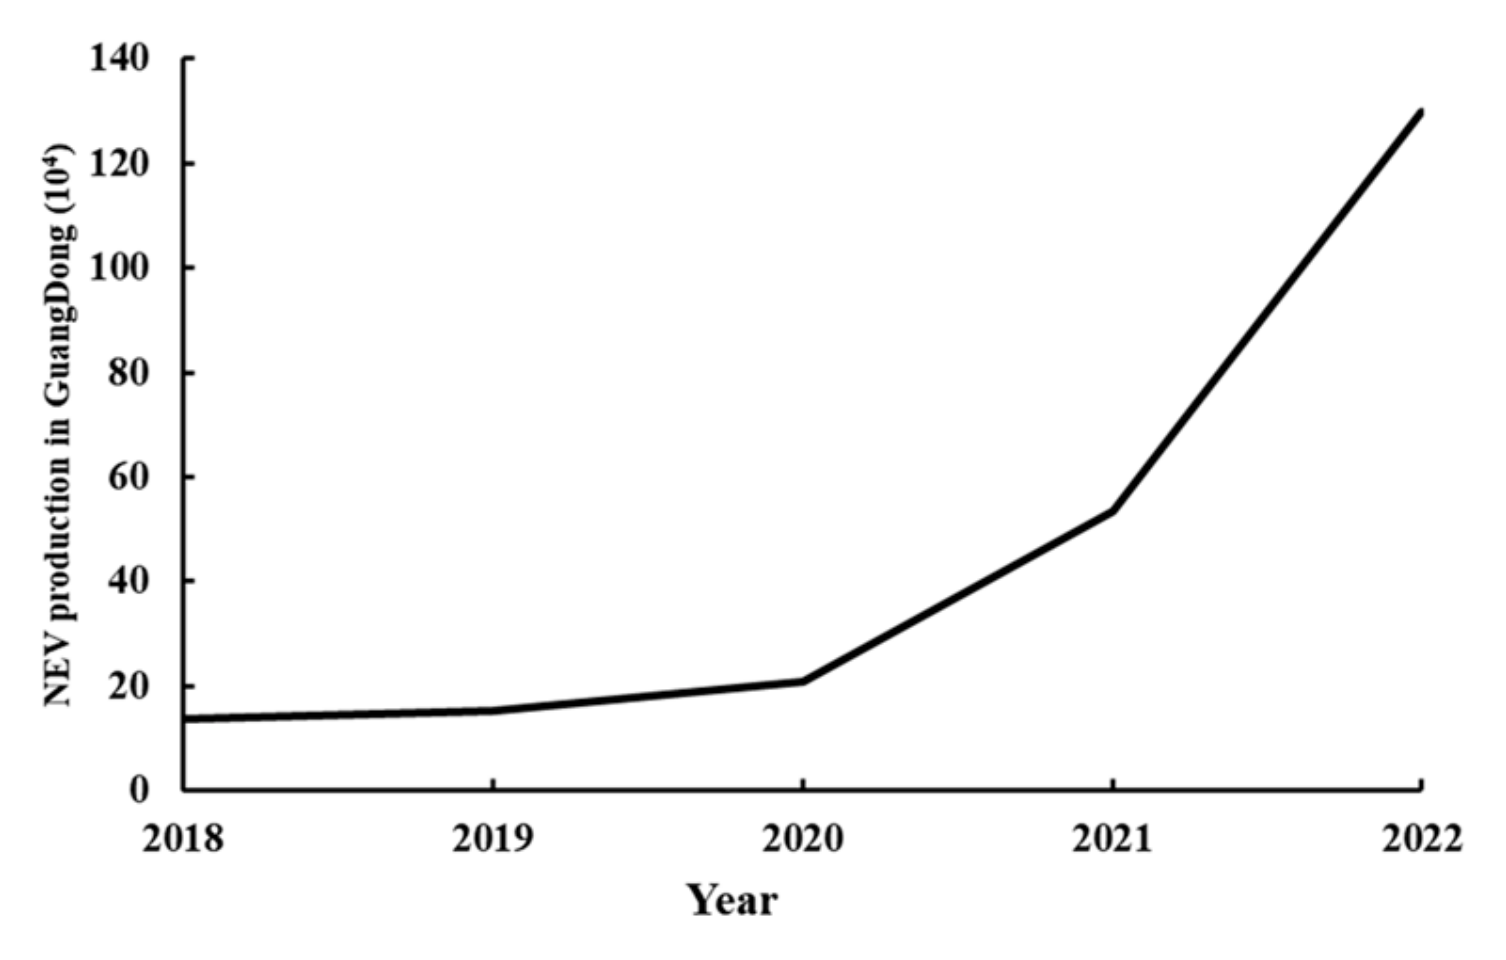
As of 2023, Guangdong Province had registered a total of 4174 × 104 automobiles. Figure 2 demonstrates the continuous expansion of road mileage in the province, indicating relatively high vehicular activity levels. As a key hub for the NEV industry in China, Guangdong has achieved remarkable progress in NEV development in recent years. According to the China Automobile Environmental Management Annual Report, NEV production in Guangdong shows consistent annual growth, with the most significant increase occurring between 2021 and 2022 (Figure 3). During the 13th Five-Year Plan period, Guangdong implemented vigorous measures to reduce automobile emissions. The provincial government issued the Implementation Opinions on Accelerating the Promotion and Application of New Energy Vehicles, which effectively boosted NEV adoption. By 2020, the electrification rate of public buses reached 97.5%, accompanied by a 27.6% growth in NEV production [19,20,21]. This growth momentum continued, with NEV production reaching 2.5318 million units in 2023, accounting for 26.8% of total NEV output. These developments underscore the crucial role of NEVs in reducing pollutant emissions [22].

2.2. Data Introduction

2.2.1. Number of ICEVs in Guangdong Province

According to the data released by the China Statistical Yearbook from 2014 to 2013, the number of various types of ICEVs in Guangdong Province during the past decade was obtained (Table 1).

2.2.2. Number of NEVs in Guangdong Province from 2018 to 2022

According to the annual reports on mobile source environment management and China’s new energy automobile industry, data on national NEV ownership and production, as well as NEV production in Guangdong Province from 2018 to 2022, were obtained (Table 2).

2.3. Method

2.3.1. Calculation of Number of NEVs in Guangdong Province

The number of NEVs in Guangdong Province was calculated according to Equation (1):
N E V _ n u m   = N E V _ y i e l d G D N E V _ y i e l d A L L × N E V A L L
In this equation, NEV_num represents the number of NEVs in Guangdong Province, N E V _ y i e l d G D represents the production of new energy automobiles in Guangdong Province, and N E V _ y i e l d A L L represents the national production of new energy automobiles.

2.3.2. Calculation of NOx Emissions from Automobiles in Guangdong Province

The NOx emissions of automobiles in Guangdong Province are calculated using Equation (2):
N O x _ e m i s s i o n G D = a u t o m o b i l e _ h o l d G D a u t o m o b i l e _ h o l d A L L × N O x _ e m i s s i o n A L L
In this equation, N O x _ e m i s s i o n G D represents the nitrogen oxide emissions of automobiles in Guangzhou, N O x _ e m i s s i o n A L L represents the nitrogen oxide emissions of automobiles in China, a u t o m o b i l e _ h o l d G D represents the number of automobiles in Guangzhou, and a u t o m o b i l e _ h o l d A L L represents the number of automobiles in China.

2.3.3. Accounting Model for NOx Emission from ICEVs and NEVs

This study establishes a NOx emission accounting model for both ICEVs and NEVs, operating under two fundamental assumptions:
(I) Hypothetical automobile equivalents are defined (representing compact or subcompact automobiles for both automobile types) to enable emission quantification based on numerical shares. This approach permits substitution of actual automobile types with their hypothetical equivalents. The NOx emission shares for ICEV and NEV hypothetical automobiles are denoted as p 1 and p 2 , respectively. A positive emission share ( p i > 0) indicates NOx emission contribution, while a negative value ( p i < 0) signifies NOx reduction contribution. These assumptions necessitate establishing conversion factors between actual automobile emissions and their hypothetical equivalents.
Per-kilometer fuel consumption for different ICEV types is derived from published studies on operational truck/passenger automobile fuel consumption patterns, small internal combustion engine technologies, and China Corporate Average Fuel Consumption (CAFC) standards with associated limits [23,24,25,26]. These data provide the foundation for calculating fuel mass consumption rates across automobile classifications.
Considering the emission share of micro and small cargo automobiles as p 1 , the emission share coefficient n of other types of ICEV was calculated by the mass ratio of fuel consumption per kilometer, referring to Table 3 [27,28]. Equation (3) is as follows:
n × p 1 = d 0.056
where n is the emission share coefficient of automobiles, p 1 is the emission share of micro and small cargo automobiles (Hypothetical automobile), and d is the consumption per kilometer of automobiles.
We obtained the emission shares of large trucks, medium trucks, small and micro trucks, large buses, and medium buses as 4.5 p 1 , 2.803   p 1 , 1.875 p 1 , 2.91 p 1 , and 2.91 p 1 , respectively. The coefficient was multiplied by the number of corresponding types of automobiles in each year to obtain a relatively accurate result.
(II) Assuming that there are no major breakthroughs in technological innovations such as internal combustion engines and electric motors between adjacent years, the hypothetical NOx emission shares p 1 and p 2 of ICEVs and NEVs remain basically unchanged between adjacent years.
NOx emission shares p 1 and p 2 were calculated using Equation (4):
I 1 × p 1 + N 1 × p 2 = N O x _ e m i s s i o n n I 2 × p 1 + N 2 × p 2 = N O x _ e m i s s i o n n + 1
In this equation, I 1 , N 1 , p 1 , and N O x _ e m i s s i o n n are the number of ICEVs, the number of NEVs, the share of NOx emissions, and the amount of NOx emissions in the n th year, respectively. I 2 , N 2 , p 2 , and N O x _ e m i s s i o n n + 1 are the number of ICEVs, the number of NEVs, the share of NOx emissions, and the amount of NOx emissions in the ( n + 1 ) th year, respectively.

2.3.4. Proportion of Emission Reductions for ICEVs and NEVs

By calculating p 1 and p 2 from the previous step and combining them with the number of ICEVs and NEVs in that year, the NOx emissions reductions of ICEVs and NEVs in that year were multiplied. Compared with the total emission reductions in that year, the proportion of emission reductions of ICEVs and NEVs to the total emission reductions was obtained. The formula is Equation (5):
R a t i o I C E V = I 2 × p 1 I 1 × p 1 N O x _ r e d u c t i o n t o t a l R a t i o N E V = N 2 × p 2 N 1 × p 2 N O x _ r e d u c t i o n t o t a l
In this equation, N O x _ r e d u c t i o n t o t a l represents the emission reduction during a certain two-year period; I 1 , N 1 , p 1 , and p 2 are the quantities of ICEVs and NEVs in the ( n 1 ) th year, respectively; I 2 , N 2 , p 1 , and p 2 are the number of ICEVs, the number of NEVs, the share of nitrogen oxide emissions from ICEVs, and the share of NOx emissions from NEVs in the n th year.

3. Results and Discussion

3.1. Annual Variation in Near-Surface NO2 in Guangdong Province

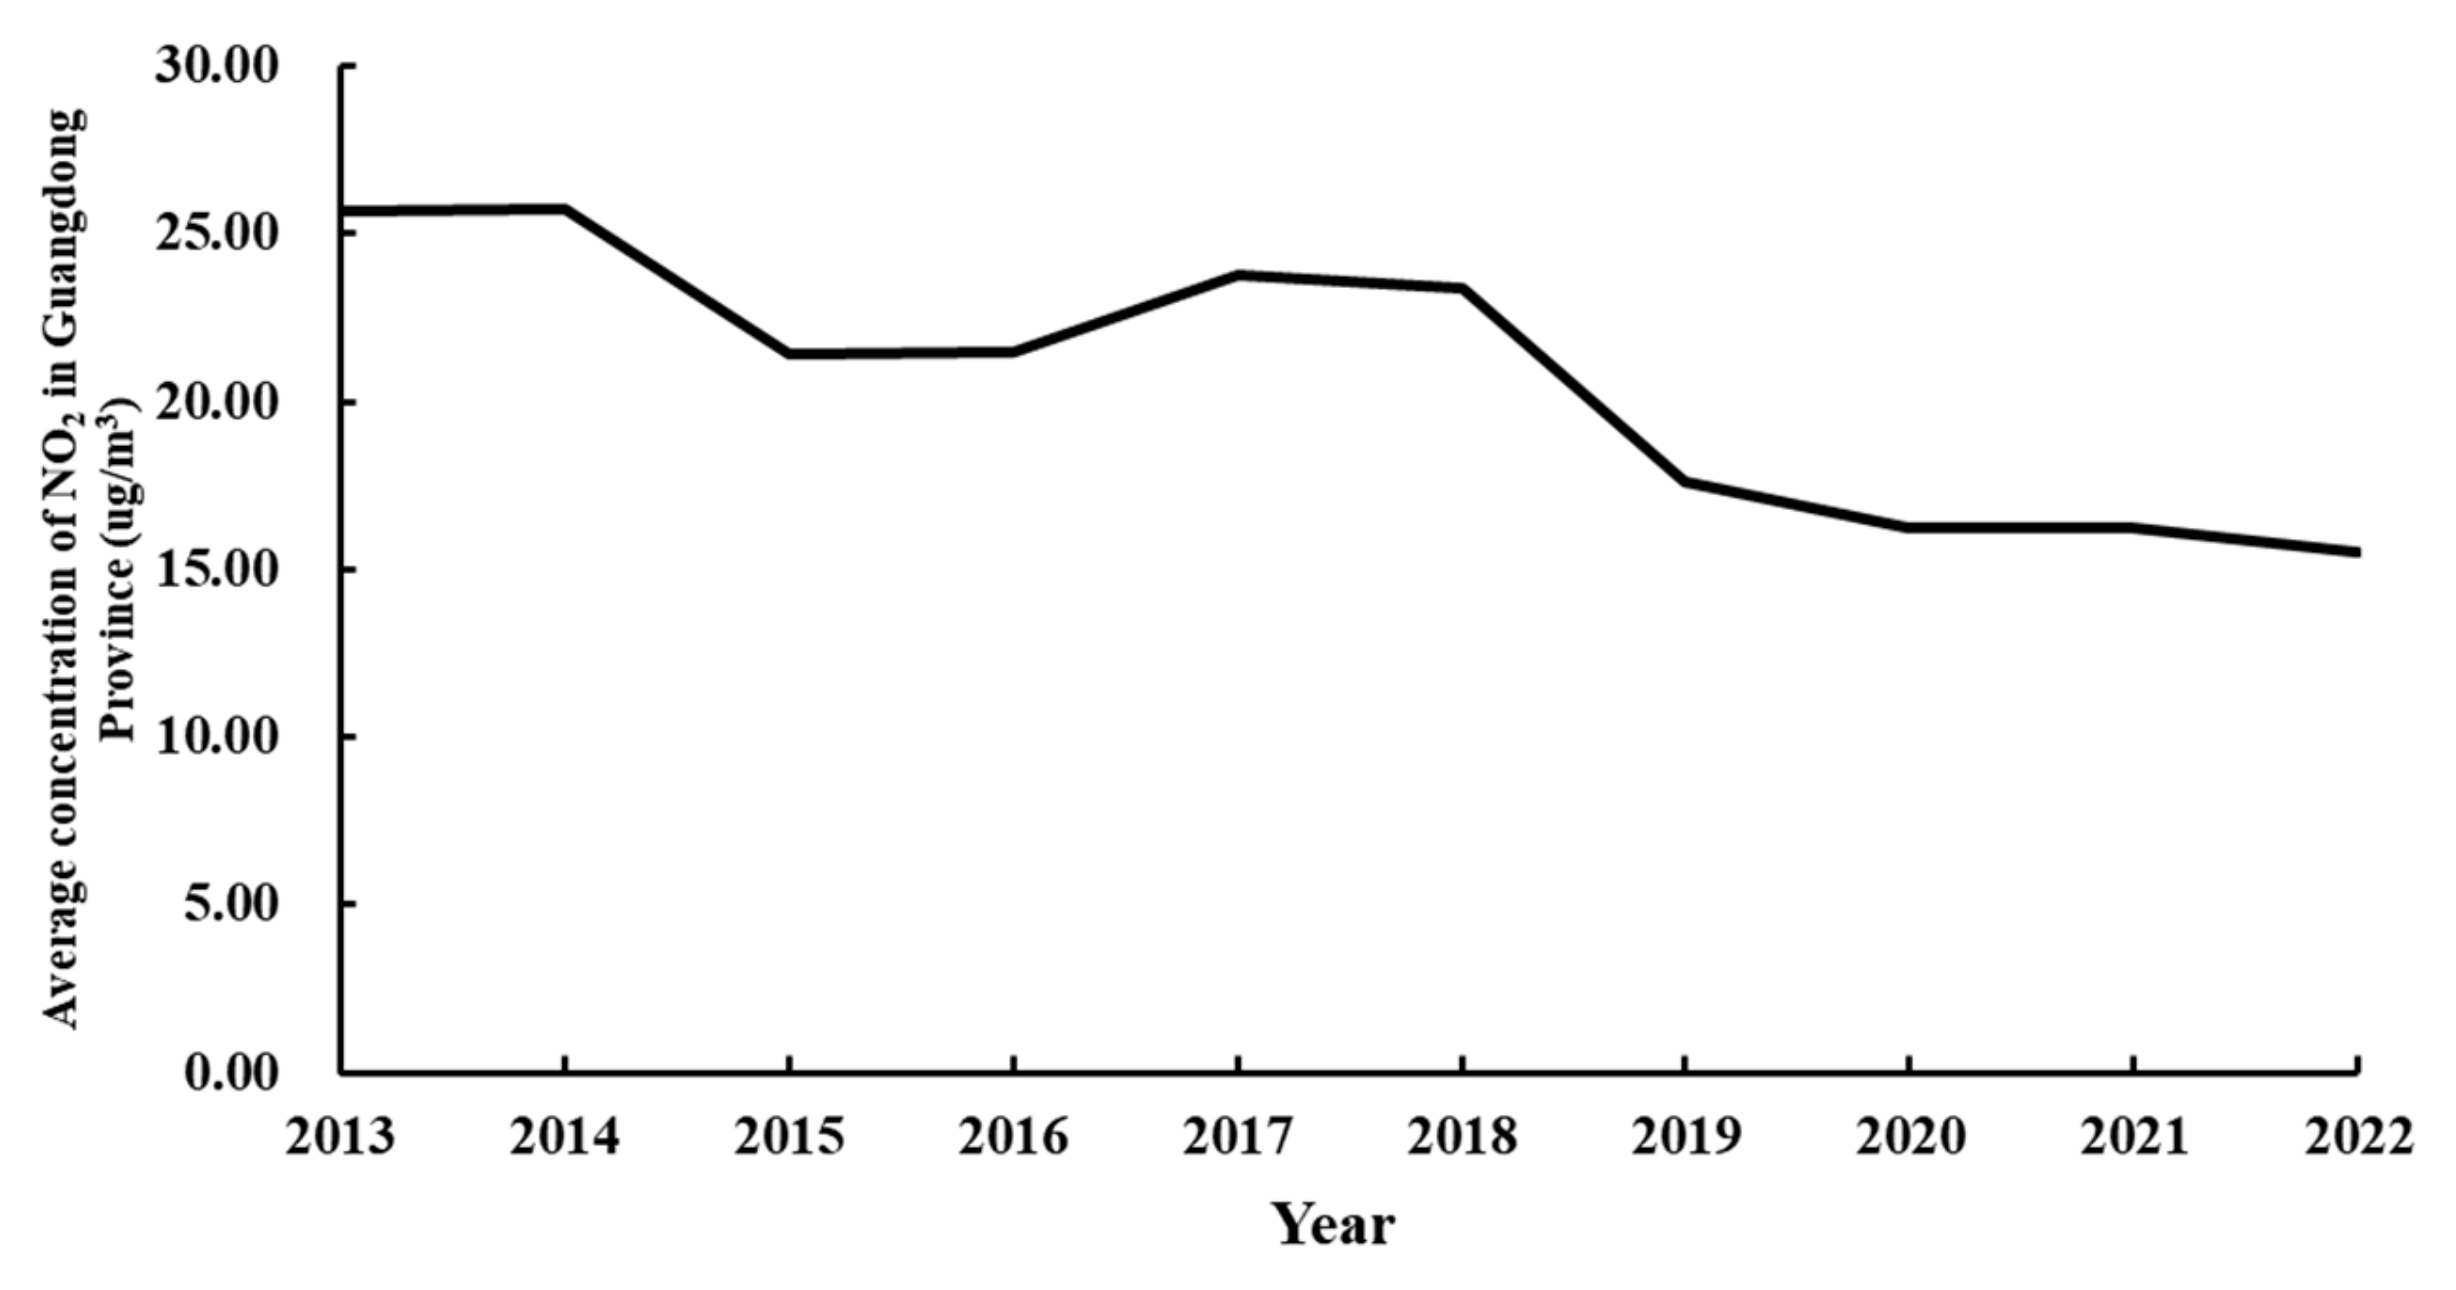
The statistical analysis of near-surface NO2 concentration data in Guangdong Province from 2013 to 2022 reveals distinct temporal trends. As shown in Table 4 and Figure 4, the annual average NO2 concentrations exhibited a continuous decline from 2013 to 2015. The 2015 average concentration of 21.44 μg/m3 represented a 16.4% reduction compared to 2013 levels. However, a moderate rebound occurred between 2016 and 2018, with the 2018 concentration increasing by approximately 8.9% relative to 2015. The most significant decrease was observed from 2018 to 2019, when NO2 levels dropped sharply by 24.6%. Following this rapid decline, the decreasing trend was moderated, with a further 12.1% reduction from 2019 to 2022 [29,30,31,32]. The interannual variation demonstrates an overall downward trend in provincial NO2 concentrations throughout the 2013–2022 period. This consistent reduction in average concentrations has correspondingly led to a progressive decrease in total nitrogen oxide emissions [24].

3.2. Accounting for NOx Automobile Emissions in Guangdong Province

3.2.1. The Number of NEVs in Guangdong Province from 2018 to 2022

Analysis of automobile registration data (Figure 5) in Guangdong Province over the past decade (2012–2022) reveals a consistent upward trend in total automobile ownership. Among all automobile categories, light passenger automobiles accounted for both the largest share and the most significant annual growth. Based on collected statistics and calculations using Equation (1), the registered NEV population in Guangdong increased from 280,900 units in 2018 to 1.183 million units in 2021. The most dramatic growth occurred between 2021 and 2022, when the NEV fleet expanded by 103.55% to reach 2.408 million units.

3.2.2. NOx Emissions from Automobiles in Guangdong Province from 2013 to 2022

Based on the statistical data released in the annual report on mobile source environmental management, the nitrogen oxide emissions in Guangdong Province were calculated using Equation (2), and the results are shown in Table 5.
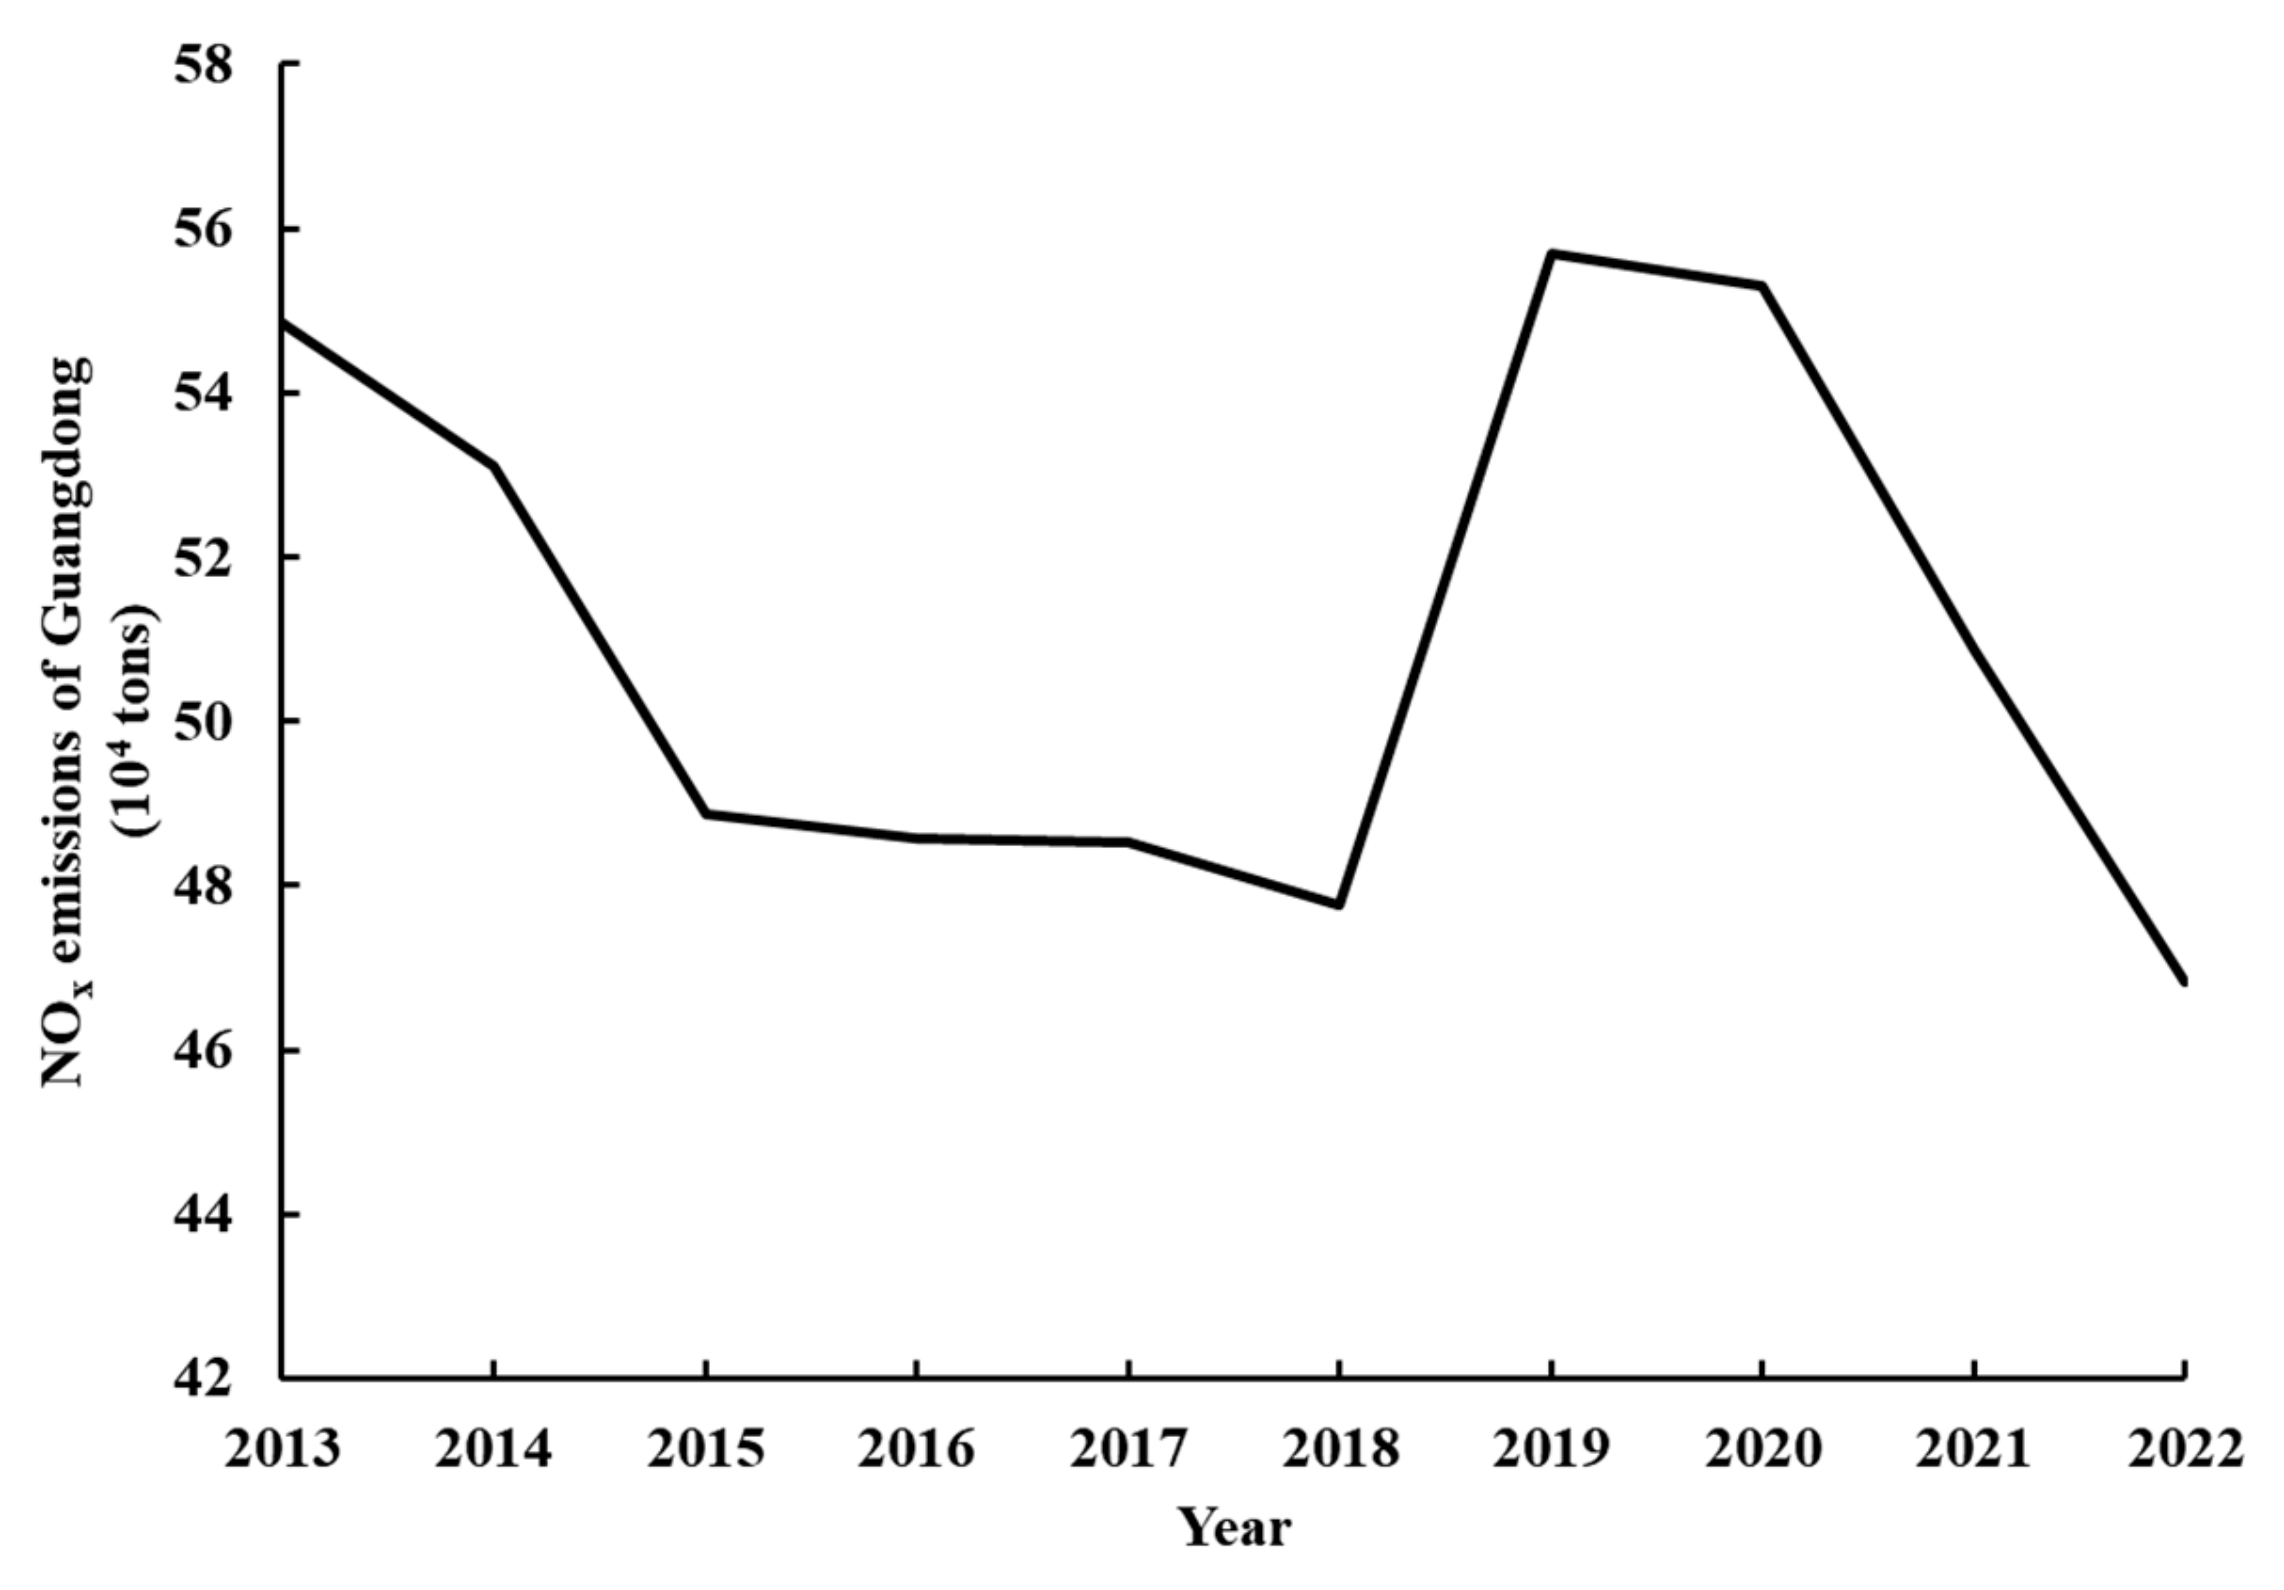
Analysis of the data presented in Table 5 and Figure 6 reveals distinct trends in NOx emissions in Guangdong Province from 2013 to 2022. In 2013, total automotive NOx emissions reached 548.5 thousand tons, followed by a gradual decline to 477.6 thousand tons by 2018—representing a 12.93% reduction over this five-year period. However, a notable emission rise occurred in 2019, with NOx levels rising to 556.9 thousand tons (a 16.6% increase compared to 2018), marking the peak emission year during the study period. Subsequently, emissions demonstrated a consistent year-on-year decrease. The Annual Report on Mobile Source Environmental Management in China confirms a transient increase in NOx emissions from the automotive sector in 2019. It is hypothesized that this may be attributable to a policy-driven surge in pre-compliance vehicle sales. As the phased implementation of the China 6 emission standards approached, manufacturers accelerated sales of China 5-compliant light-duty vehicles (LDVs) to clear inventory. Consistent with this hypothesis, annual report data reveal a substantial spike in China 5 LDV registrations during the first half of 2019, which likely contributed to elevated fleet-average NOx emissions. The overall decade-long trend shows a net reduction in vehicular NOx emissions. Prior to 2018, when NEV adoption remained limited, ICEVs dominated emission contributions. The post-2019 emission reductions correlate strongly with accelerated NEV market penetration in Guangdong Province.
These findings establish a clear temporal association between expanding NEV market share (particularly after 2018) and declining NOx emissions. This study therefore quantitatively evaluates the relative contributions of ICEVs and NEVs to NOx emission reductions, with particular focus on determining their respective proportional impacts.

3.3. Evaluation of Emission Reduction Effectiveness of NEVs and ICEVs

3.3.1. Accounting for the Share of NOx Emissions from NEVs and ICEVs

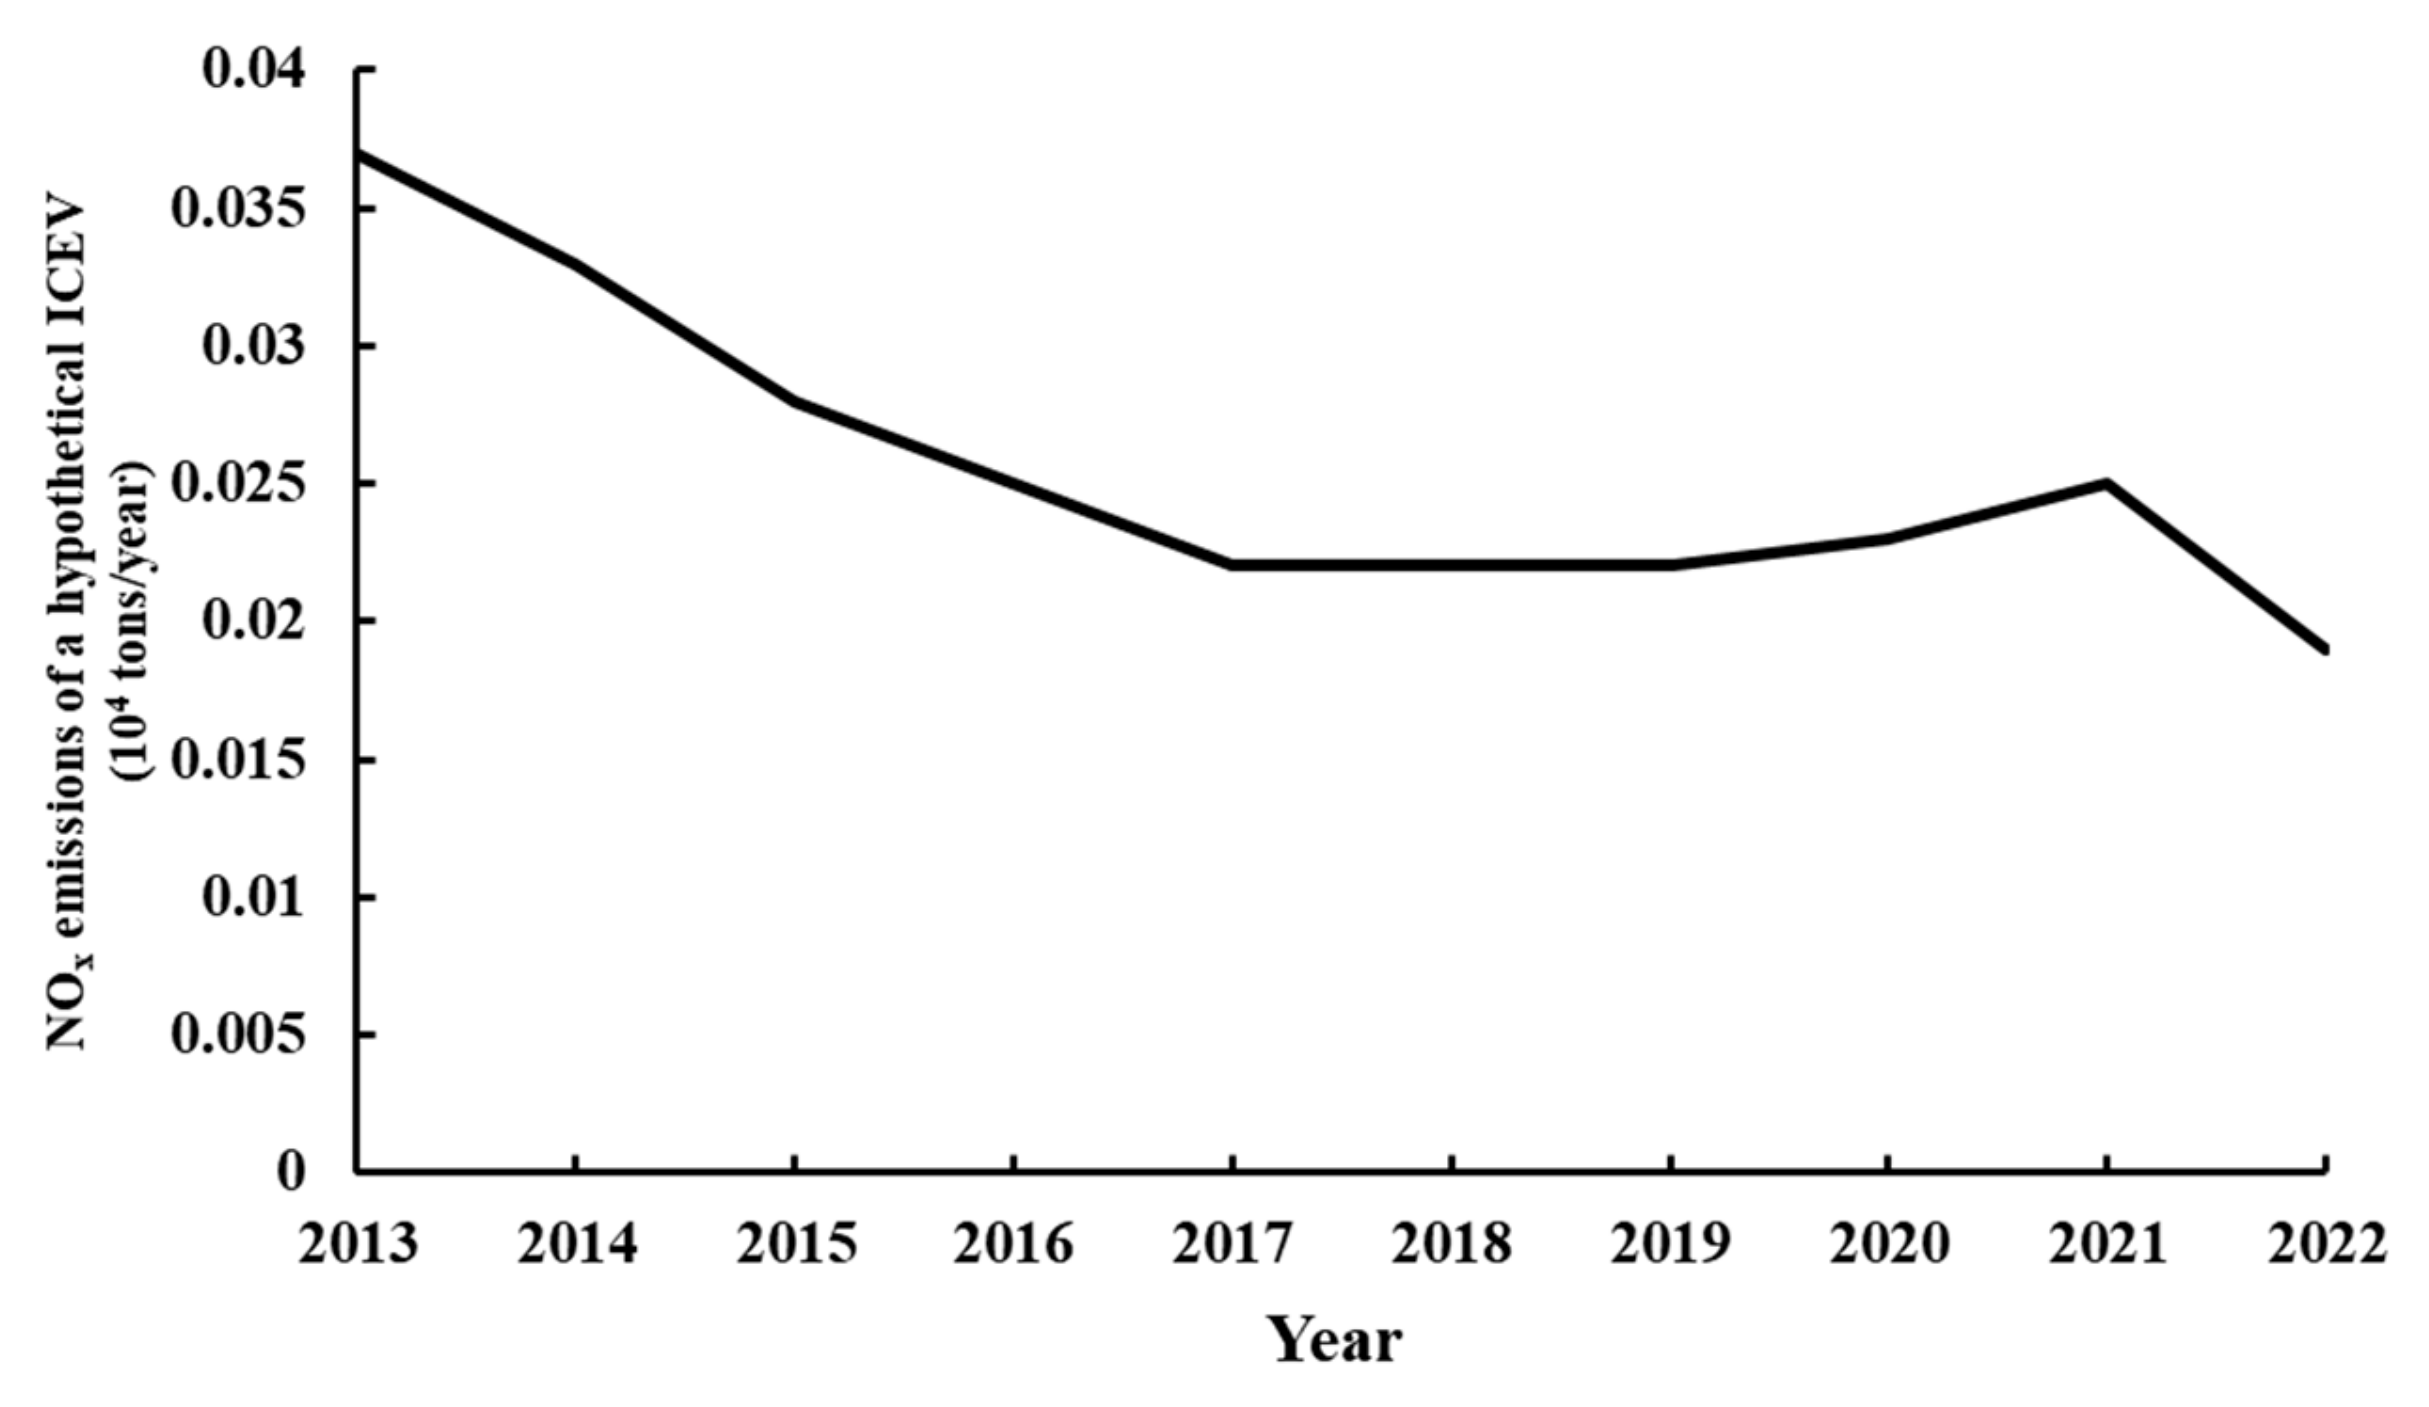
Through iterative validation of the NOx emission accounting model, we obtained the annual values of the parameters p 1 and p 2 . The close proximity of p 1 between adjacent years proves the validity of hypothesis II. The negative p 2 represents the contribution of NEVs to reducing emissions, which is in line with the key differences in combustion products between new energy technology and internal combustion engine technology. As presented in Table 6 and Figure 7, the p 1 values (representing conventional automobiles) exhibited a general declining trend from 2013 to 2019. The emission share peaked at 0.037 thousand tons/year in 2013 and decreased to 0.022 thousand tons/year by 2019, representing a 40.5% reduction. Between 2019 and 2021, the emission share showed a slight increase, followed by a notable decline to 0.019 thousand tons/year in 2022—a 17.4% decrease compared to 2020 levels. We simulated and calculated the confidence intervals (Table 6) for the direct outputs ( p 1 and p 2 ) of the model using Monte Carlo simulations with 1000 iterations, assuming that activity levels and emission factors follow a log-normal distribution [33]. The 95% confidence intervals for p 1 are (0.0254, 0.0261) and p 2 are (−0.169, −0.157).
Consistent reduction in per-automobile NOx emissions from ICEVs demonstrates the effectiveness of continuous engine upgrades and improved exhaust filtration systems implemented over the past decade. The findings suggest substantial remaining potential for conventional automobiles to further reduce NOx emissions, highlighting their continued importance in regional emission mitigation strategies [26,29].
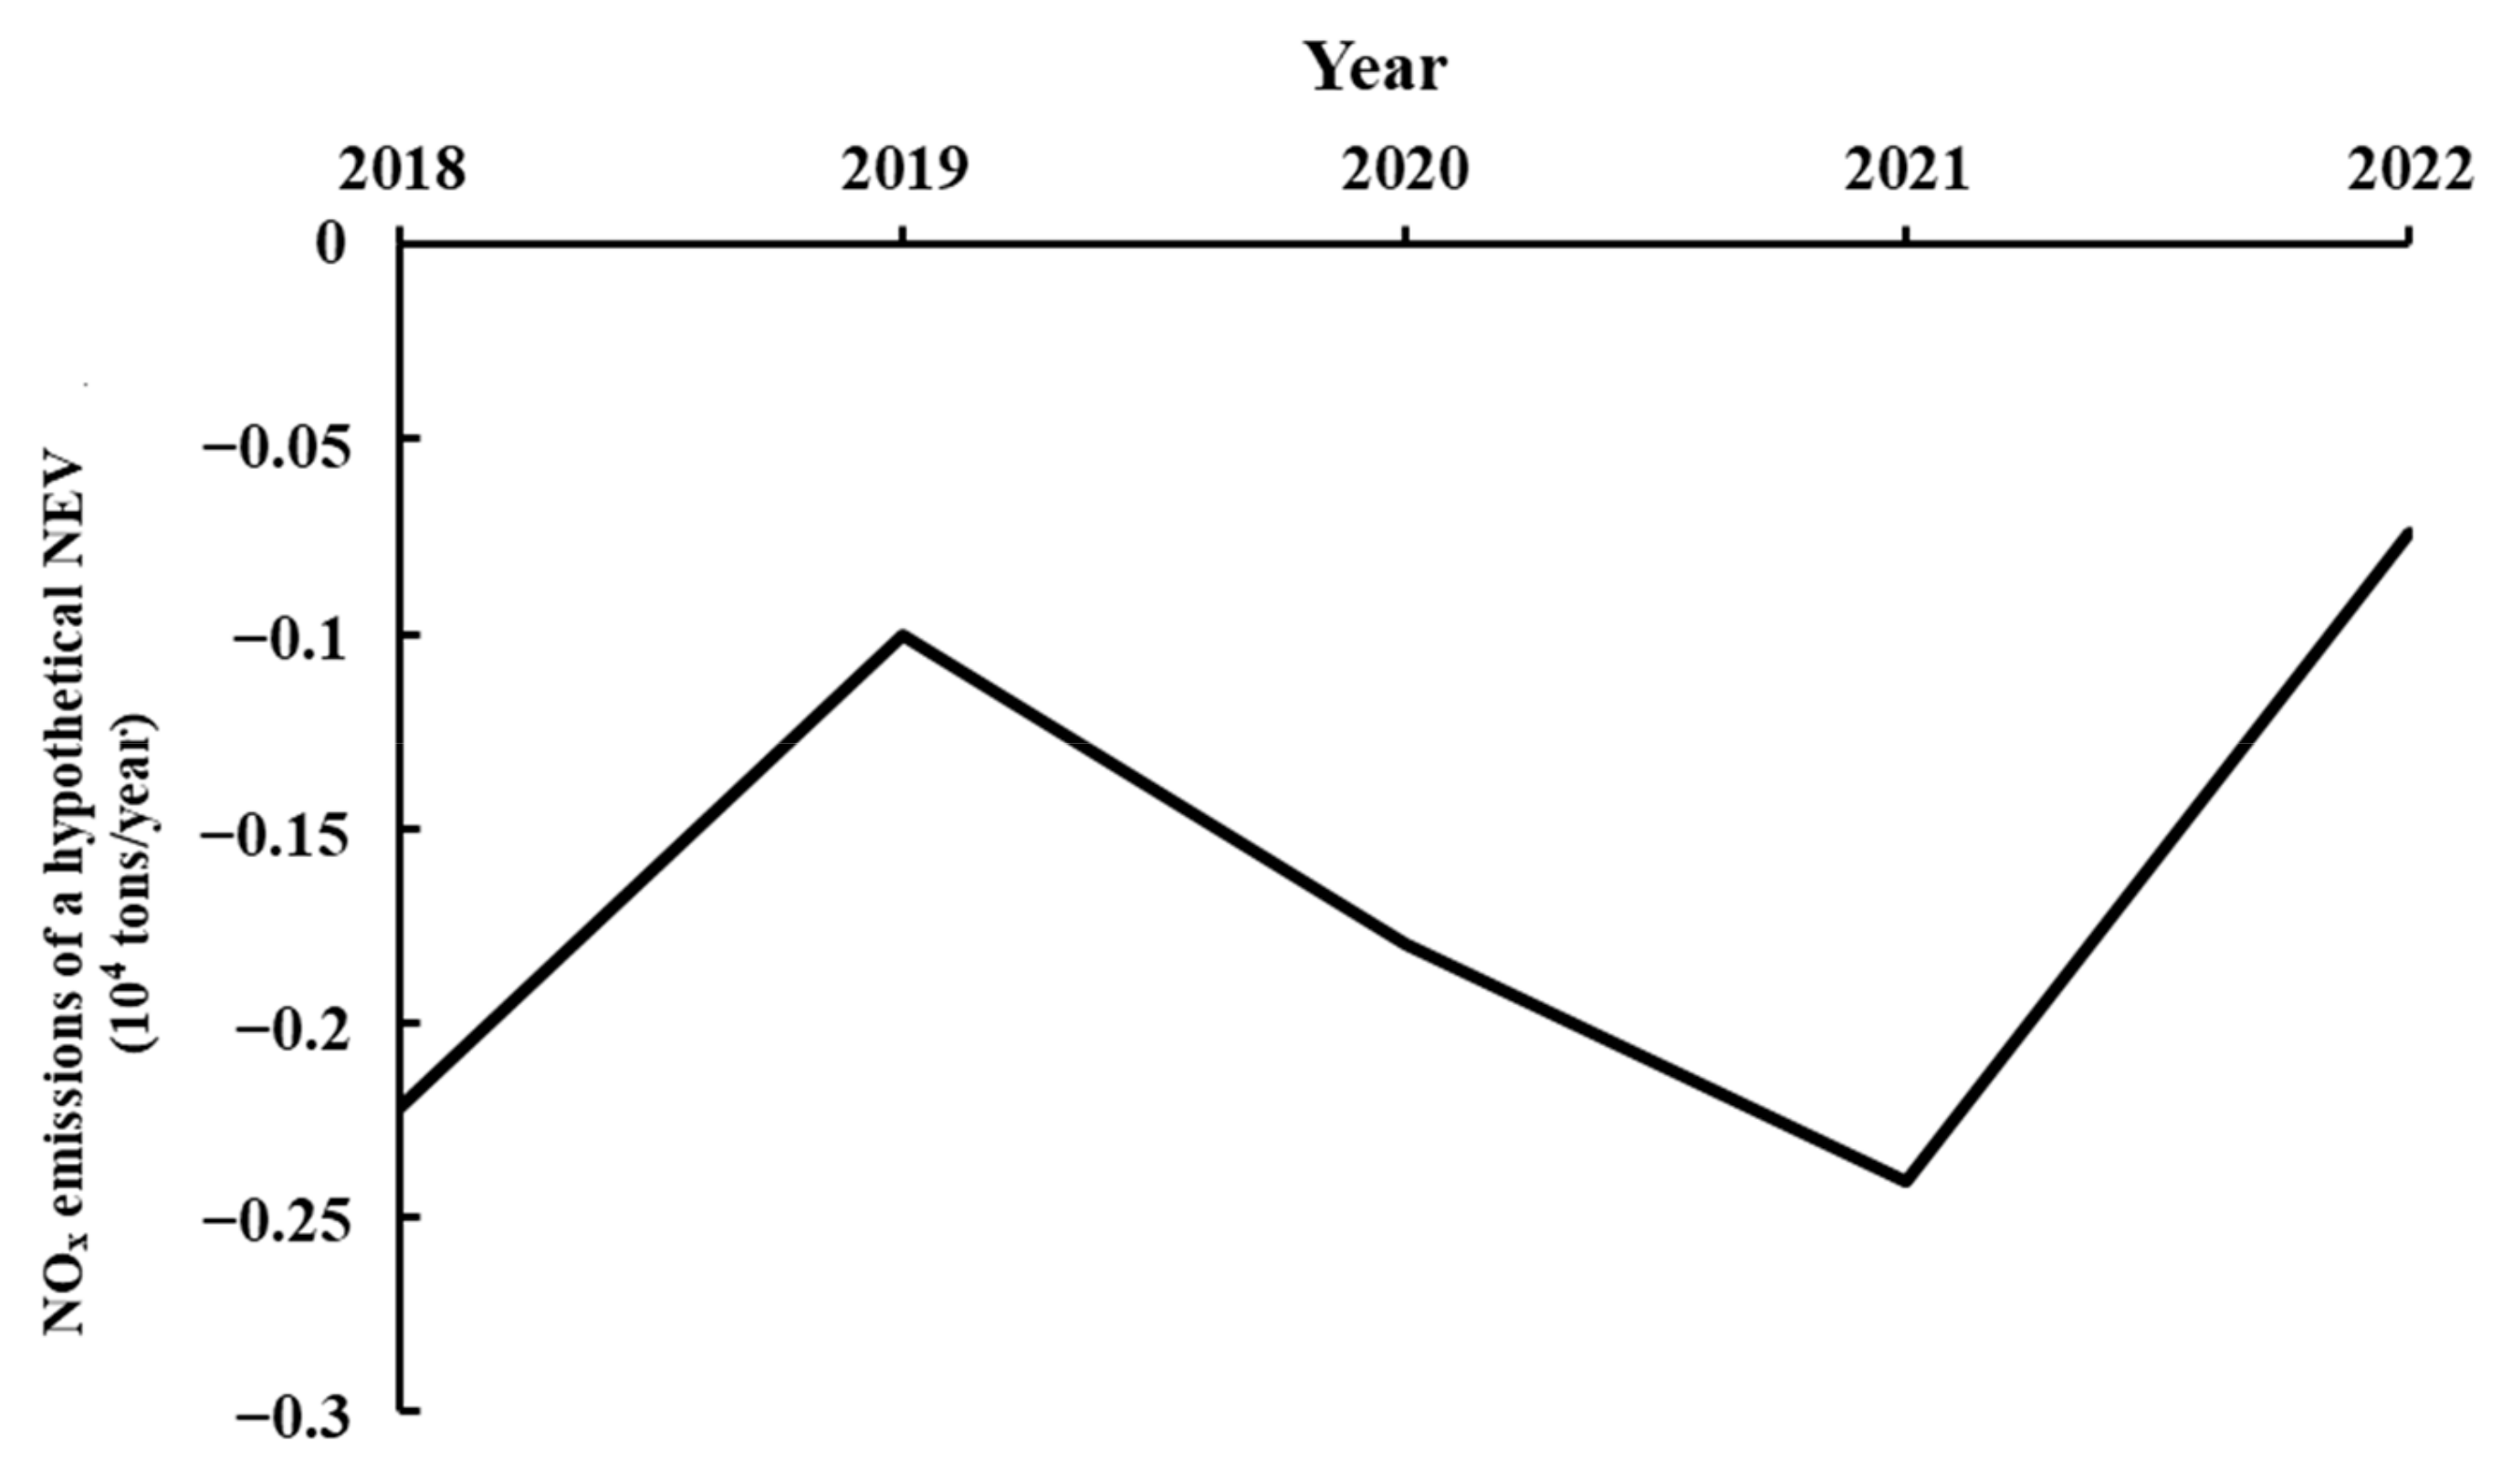
As presented in Table 6 and Figure 8, the emission share parameter for NEVs exhibits fluctuating yet consistently negative values (−0.001 to −0.241 × 10⁴ tons/year), quantitatively demonstrating their NOx reduction contribution. The maximum reduction reached −2410 tons/year (equivalent to −0.241 × 10⁴ tons/year) in 2021, representing the most effective annual mitigation performance. Although NEVs emerged later than conventional automobiles, they achieved substantial market penetration post-2018. The persistent negative emission shares align fundamentally with near-zero direct NOx emissions of NEVs. These results confirm that NEVs contribute significantly to NOx reduction, establishing NEVs as one of the primary drivers of transportation sector NOx mitigation since 2018 [15,34]. One reason for the decline in the impact of NEVs after 2021 may be that people have been keen on returning to their distant hometowns or traveling after COVID-19, and ICEVs are usually more suitable for long-distance travel, while another possibility is that the NEV market is gradually becoming saturated.
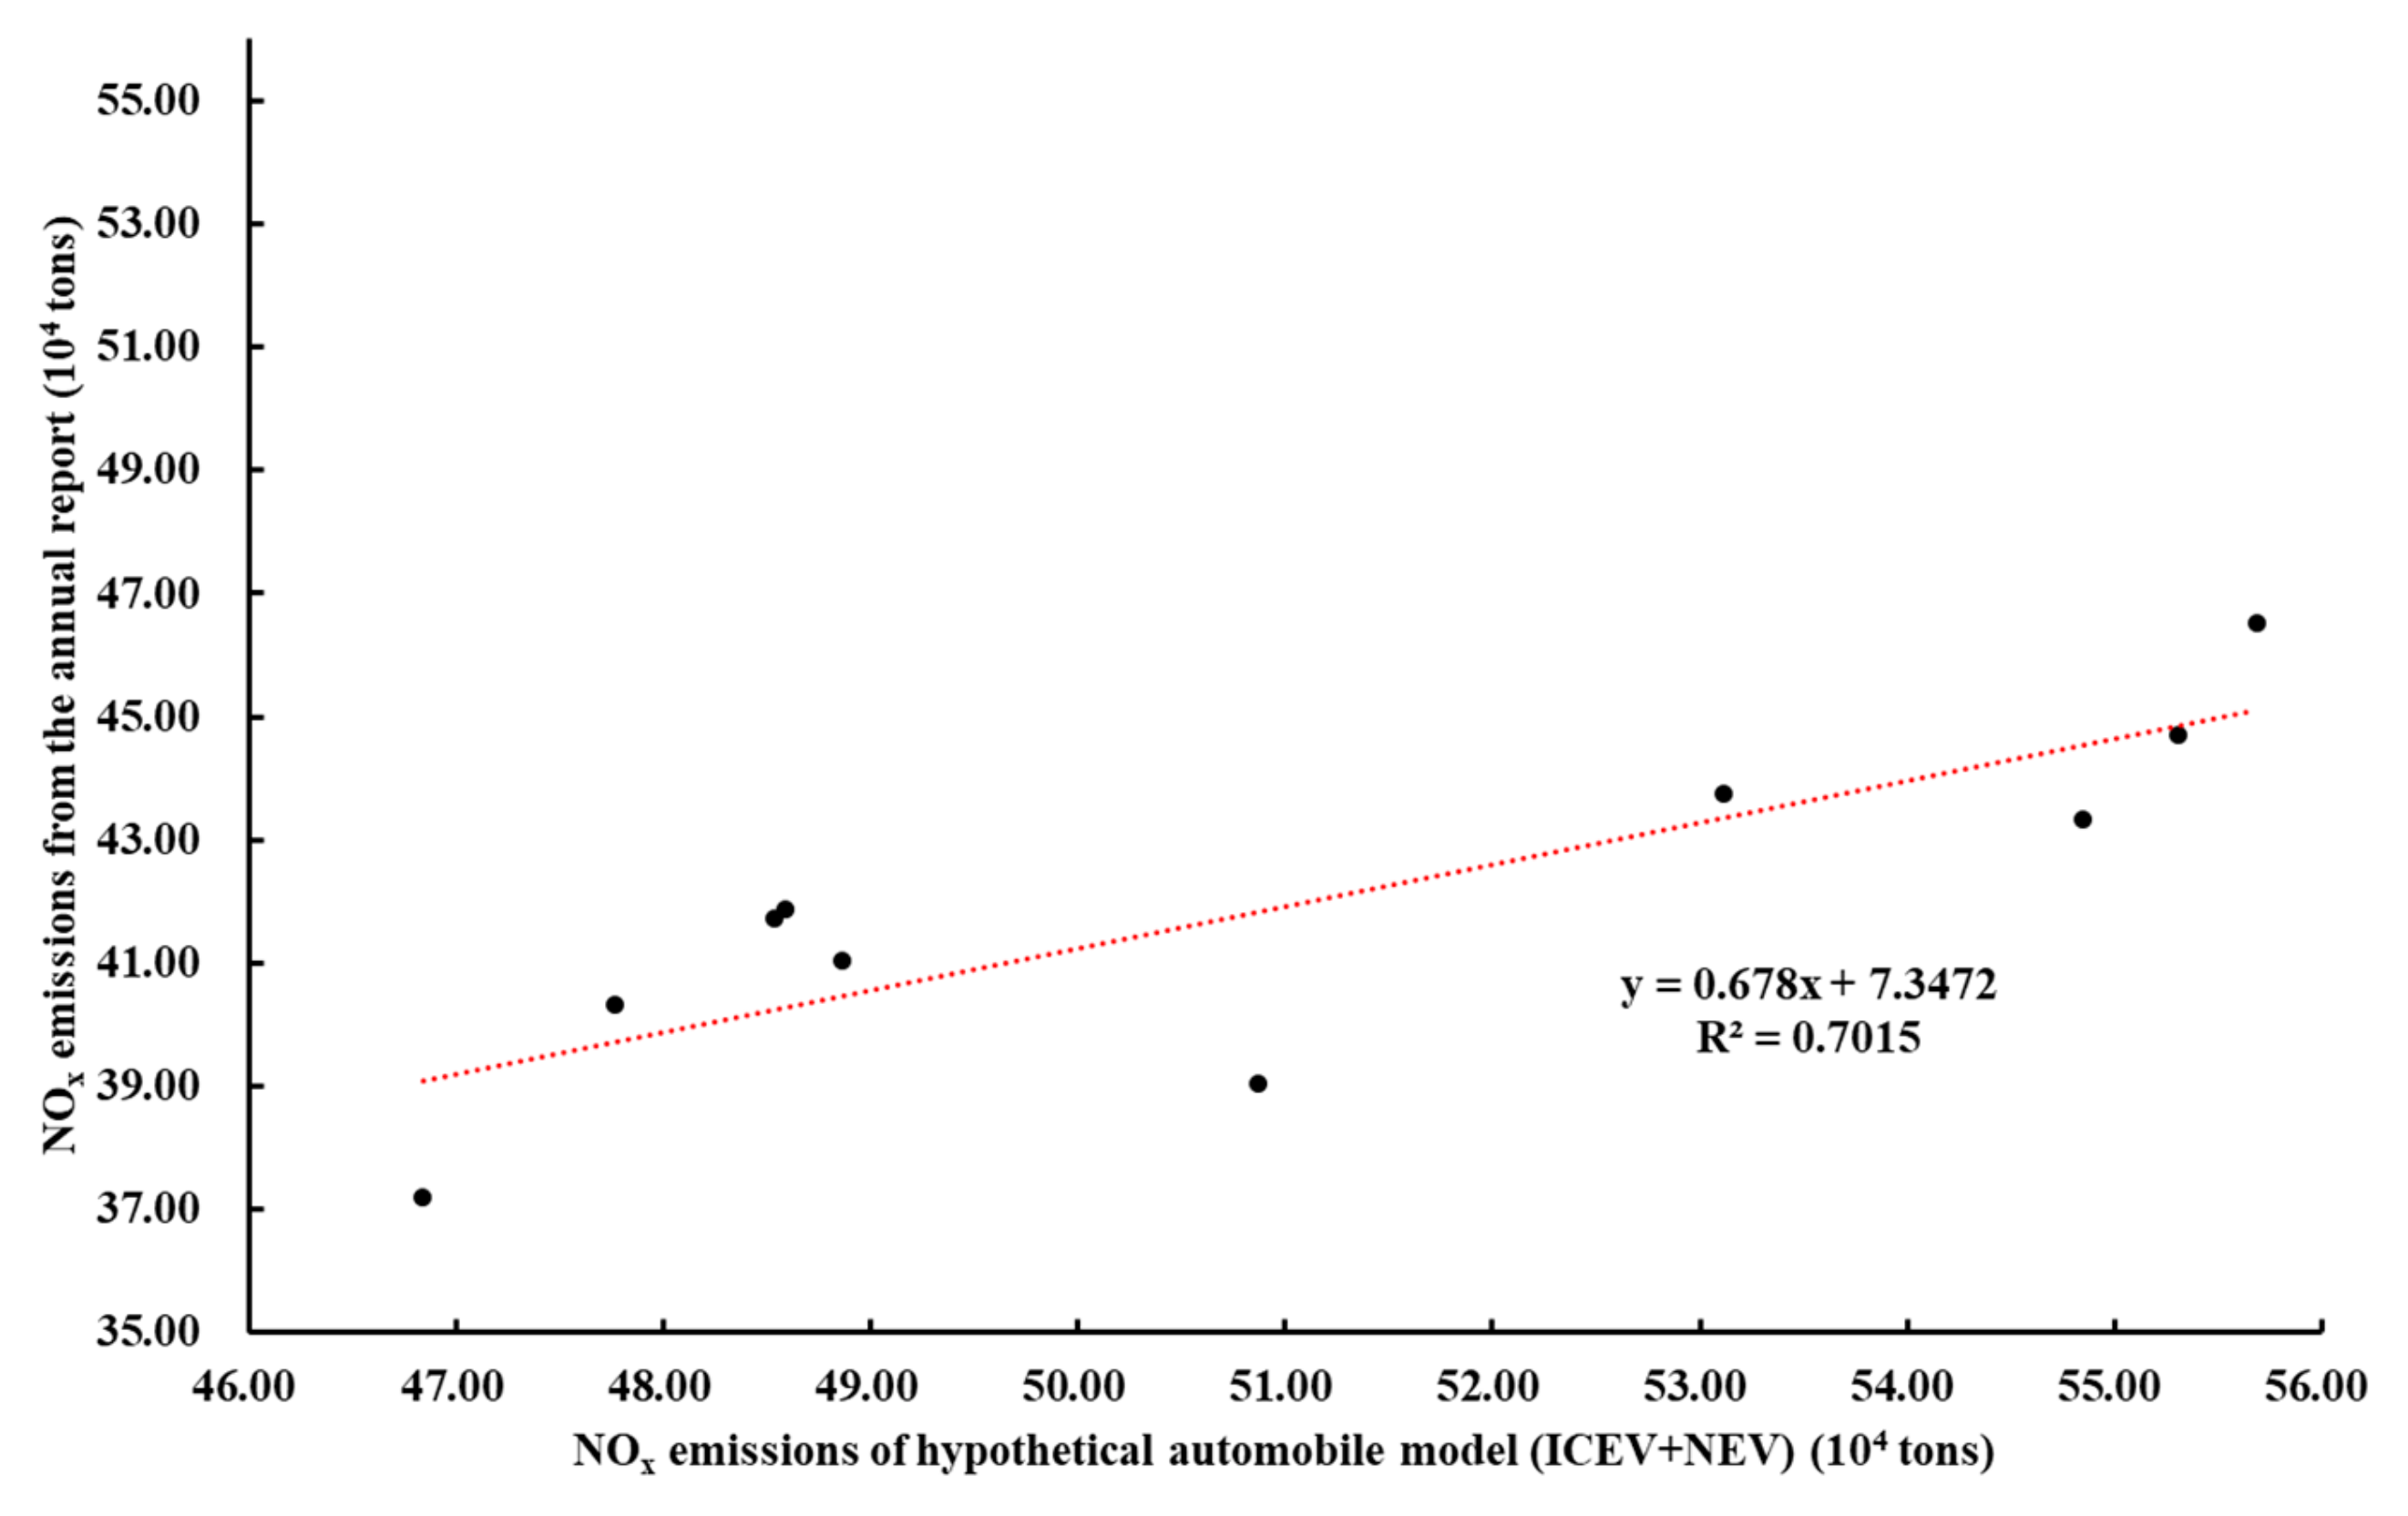
Figure 9 shows a comparison of NOx emissions from our hypothetical automobile model and NOx emissions calculated with Equation (2) using data from the annual report on mobile source environmental management, with correlation coefficient R2 reaching 0.7015, indicating that both exhibit consistent emission estimates overall. We likewise employed the Monte Carlo method to conduct 1000 simulations of NOx emissions from ICEVs and NEVs derived from the hypothetical automobile model, assessing the uncertainty in the computational results. The obtained 95% confidence intervals were (48.468, 49.528) for ICEVs and (−16.43, −14.626) for NEVs. Critically, it is essential to note that growth trajectories are not perpetually sustainable for ICEVs or NEVs; a gradual saturation trend is anticipated. Consequently, when calculating the emission shares attributable to ICEVs and NEVs, the hypothetical automobile model must incorporate uncertainties associated with key data from countries and regions, which include vehicle fleet size, total NOx emissions, and fuel consumption per kilometer.

3.3.2. Calculation of the Proportion of Emission Reduction Between NEVs and ICEVs

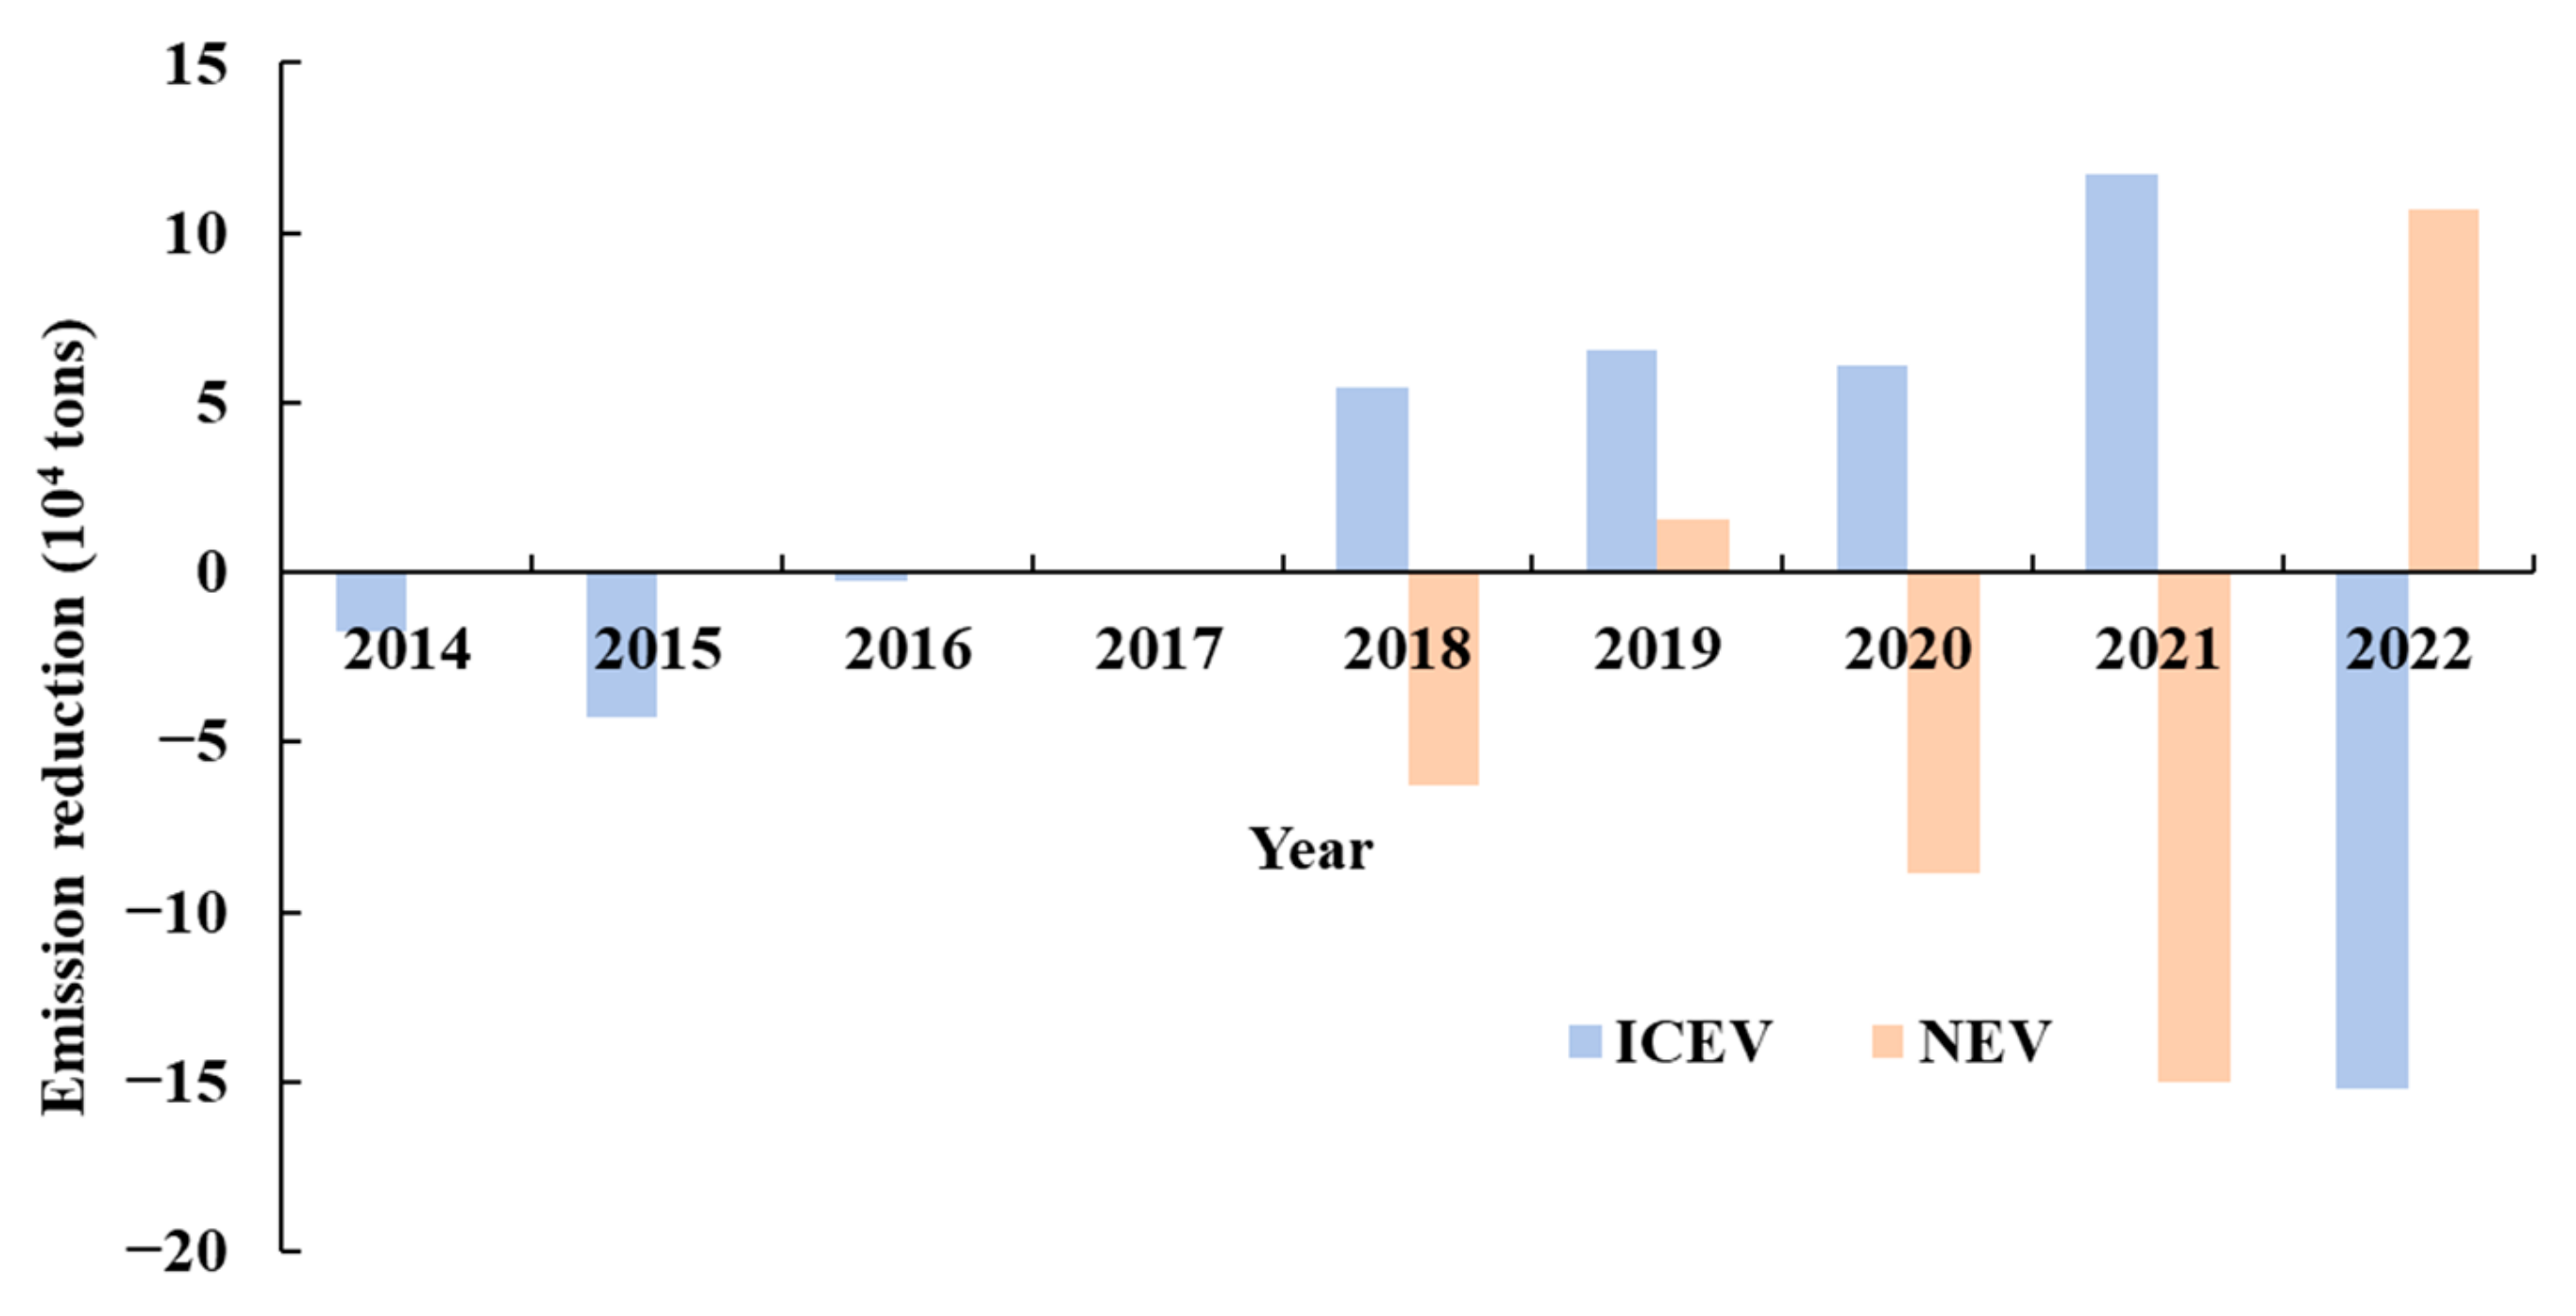
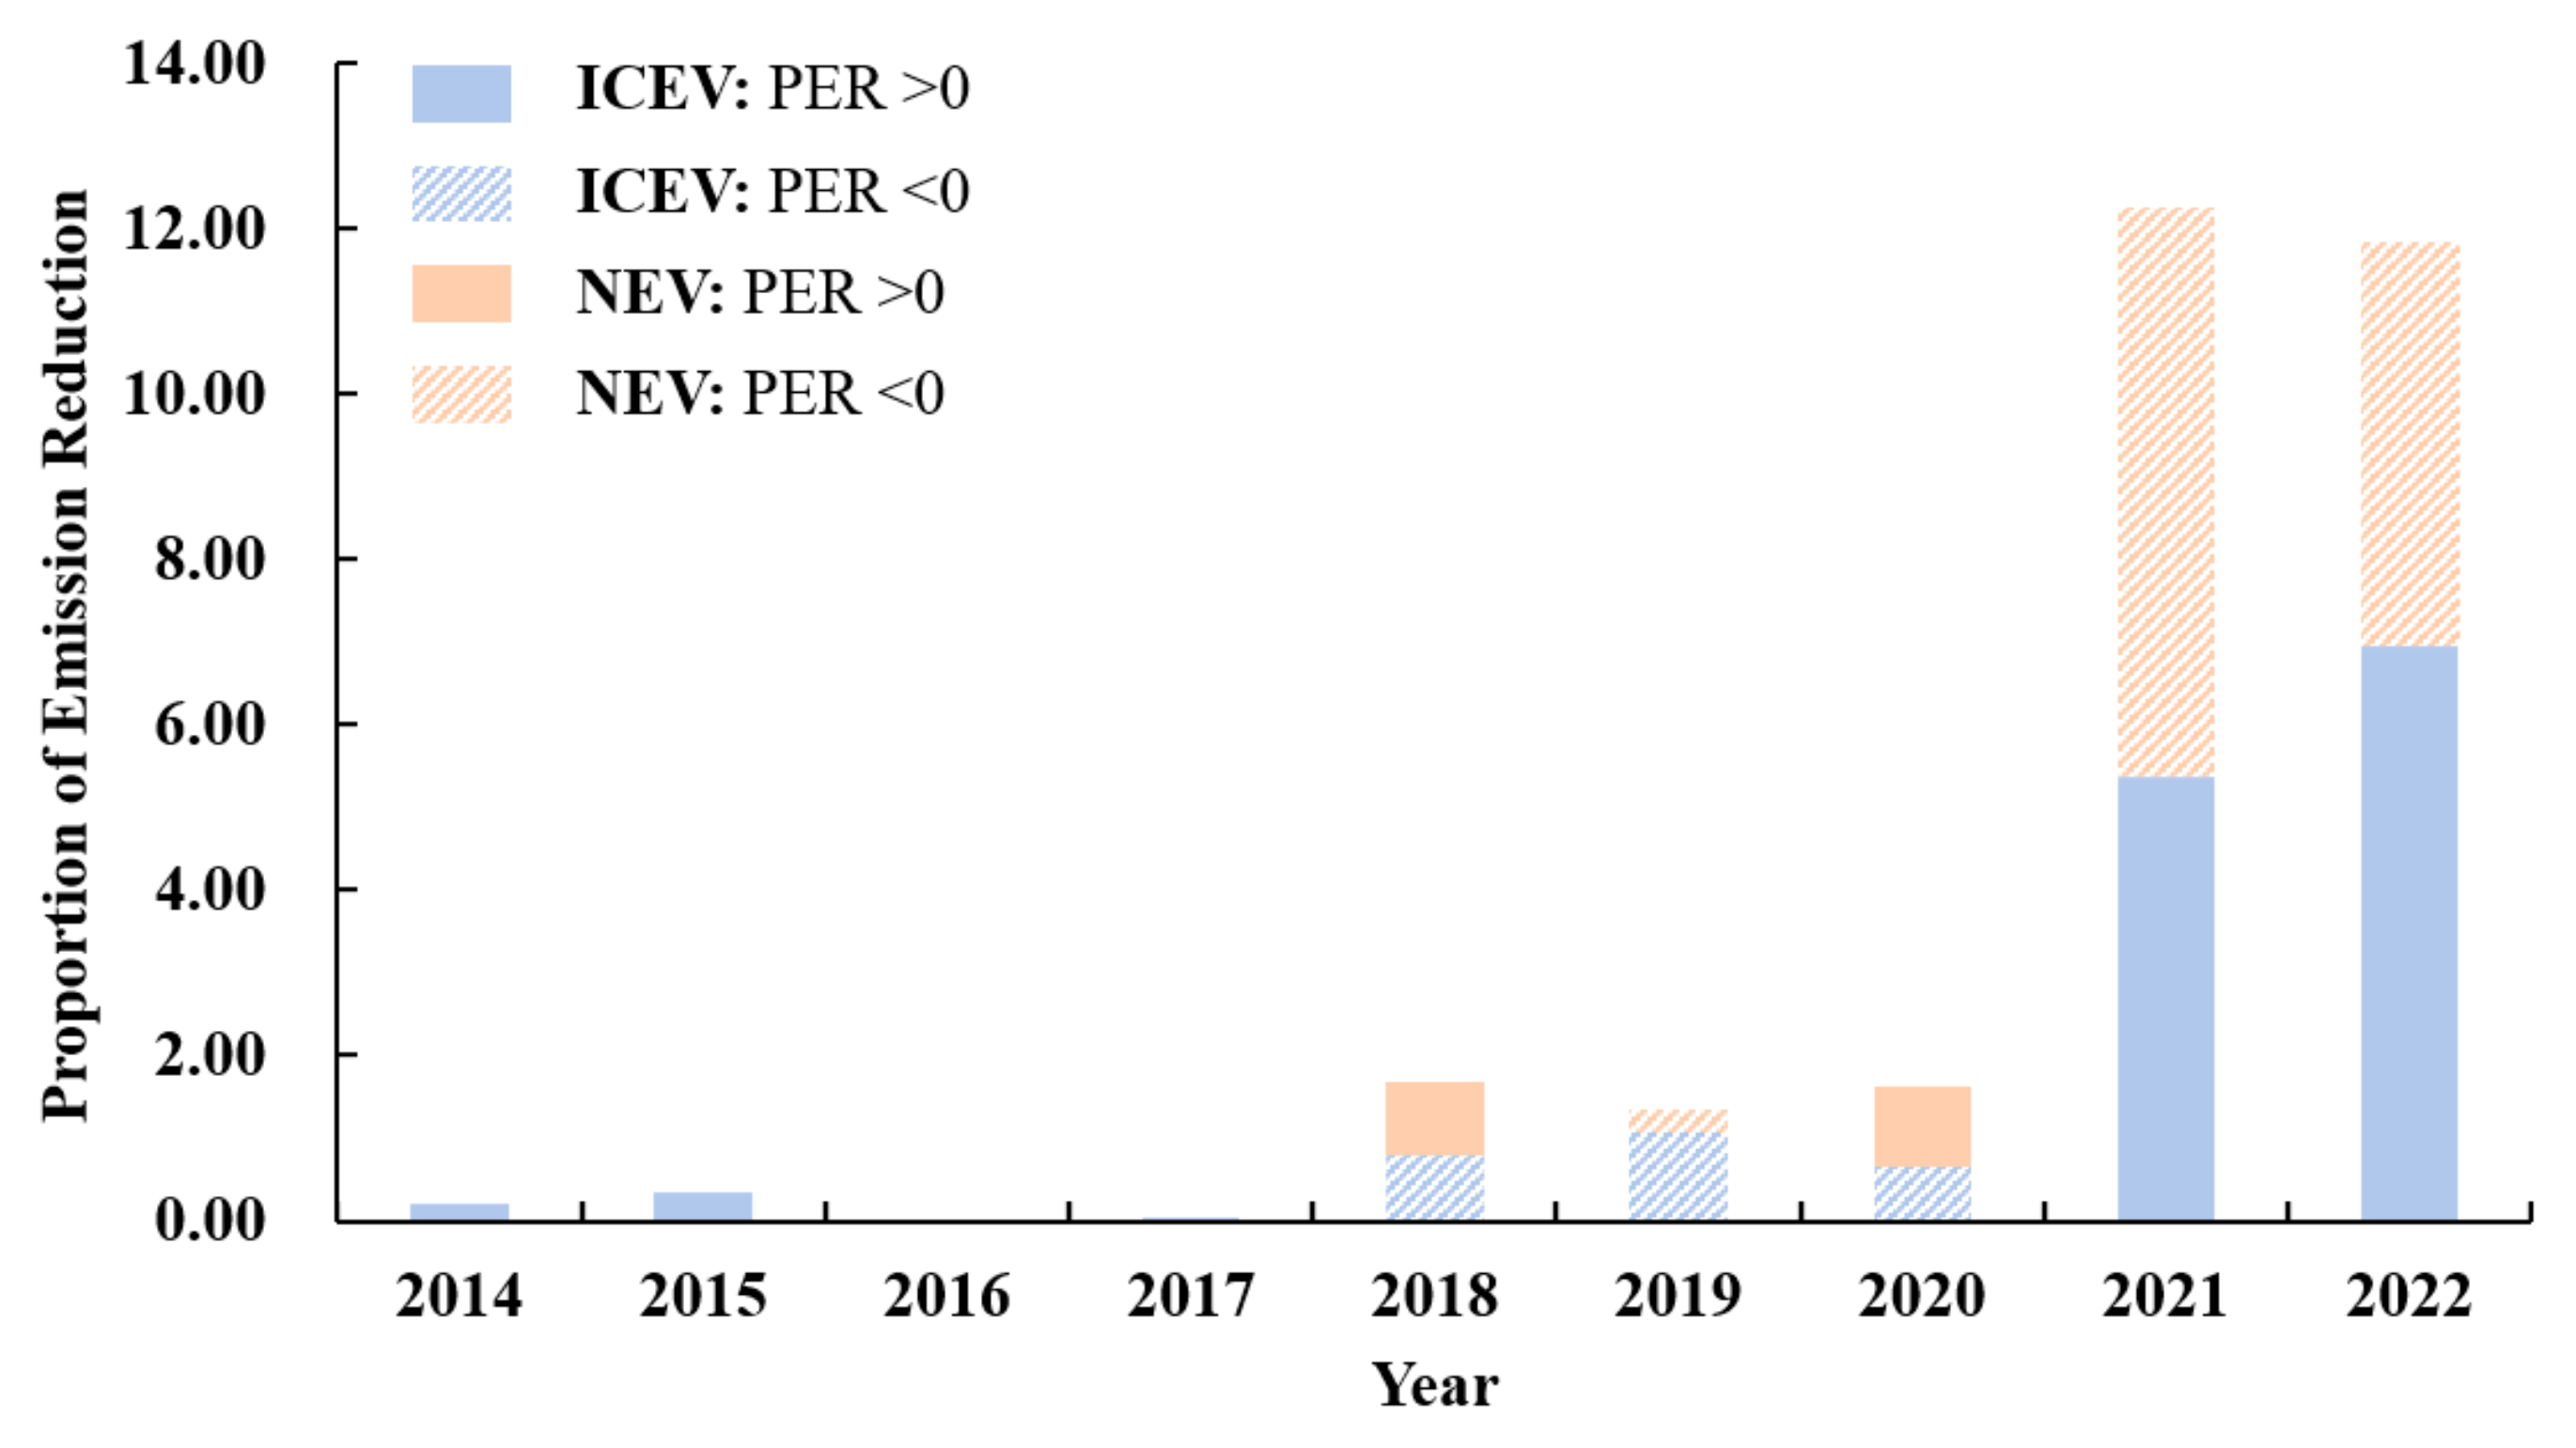
Quantitative assessment of emission reductions through formalized calculations reveals distinct temporal patterns in mitigation contributions from NEVs and ICEVs. As illustrated in Figure 10 and Figure 11, ICEVs demonstrated positive reduction effects during 2014–2017, though the magnitude decreased annually. Conversely, this automobile category exhibited emission increases from 2017 to 2021, peaking at 11.7 × 10⁴ tons in 2021, before returning to reduction status in 2022. Prior to 2020, conventional automobiles contributed minimally to provincial emission reductions, with relatively stable proportional contributions. Post-2020, their proportional contribution increased substantially. Meanwhile, NEVs displayed oscillatory mitigation patterns during 2018–2022. The mitigation effect strengthened progressively from 2018 to 2021, followed by a moderate decline in 2022 relative to 2021 levels. The proportional contribution of NEVs to provincial reductions remained comparatively low during 2018–2020, surged to its maximum in 2021, and experienced a slight decrease in 2022 relative to the previous year [35,36].

4. Conclusions and Policy Recommendations

4.1. Conclusions

This study quantifies the NOx mitigation effectiveness resulting from NEV adoption in Guangdong Province (2013–2022) through a novel NOx emission accounting framework.
Analysis reveals a consistent downward trajectory in annual mean NO2 concentrations during 2013–2015. The 2015 concentration (21.44 μg/m3) represented a 16.4% reduction relative to 2013 levels. Subsequently, a moderate rebound occurred (2016–2018), culminating in an 8.9% elevation compared to 2015. A sharp 24.6% decline followed during 2018–2019, transitioning to a gradual 12.1% reduction from 2019 to 2022, collectively demonstrating substantial atmospheric improvement.
ICEVs exhibited a declining emission share from 0.037 × 10⁴ tons/year in 2013 to 0.022 × 10⁴ tons/year in 2019, a 40.5% reduction, with maximum mitigation efficacy observed during 2017–2019. Following a marginal increase (2019–2021), the emission share declined significantly to 0.019 × 10⁴ tons/year in 2022, equivalent to a 17.4% decrease from 2020. NEVs demonstrated consistent negative emission shares with an oscillatory upward trajectory, confirming their growing mitigation capacity. The peak reduction magnitude reached −0.241 × 10⁴ tons/year in 2021, reflecting maximum annual mitigation performance [32,37].
Prior to 2018, when NEVs had limited market penetration, ICEVs dominated NOx reduction efforts. During 2014–2017, ICEVs achieved positive emission reductions, though the magnitude decreased annually. This trend reversed during 2017–2021, with net emissions increasing by 11.7 × 10⁴ tons by 2021. Concurrently, NEVs showed progressively stronger mitigation effects from 2018 to 2021, though 2022 saw a moderate decline compared to 2021. Proportional NEV contribution to provincial reductions remained relatively low during 2018–2020, peaked in 2021, and then experienced a slight decrease in 2022.
While NEVs demonstrate significant contributions to NOx reduction [38,39], ICEVs retain substantial potential for further emission reductions. This underscores the critical importance of transitioning the automobile fleet of Guangdong Province toward cleaner, more sustainable technologies [7,37,40,41,42,43].

4.2. Policy Recommendations

(I) Energy conservation and emission reduction require strong government–enterprise collaboration. Assessing the NOx emissions from Guangdong’s motor automobile industry structure provides a valuable window to evaluate emission reduction potential. The government should fully leverage its guiding role to promote increased corporate investment in advanced fuel technologies, exhaust treatment systems, and other related areas; intensify industrial renewal and technological investment efforts; and accelerate relevant industries’ low-carbon transformation.
(II) NEVs significantly contribute to NOx emission reduction. Therefore, the vigorous promotion of NEVs should be continued, as this is a key pathway for promoting green development in the transportation sector [44,45]. Simultaneously, supporting the retirement of outdated or non-compliant ICEVs is essential to fully realize the emission reduction potential of the existing ICEV fleet [44,45,46,47,48,49,50].
(III) There is a need for policy-driven clean energy transition and continuously deepened demand-side reform. Continuously optimize and implement consumer-oriented NEV purchase and usage subsidy policies and promote the development of hybrid energy automobiles. Prioritize strengthening the infrastructure layout, such as the planning, layout, and construction investment in public charging piles and fast-charging networks. Mobilize the enthusiasm of social capital participation through market incentive measures (e.g., electricity price discounts and construction subsidies).
(IV) Facing the carbon peaking and carbon neutrality goals and sustainable development, there is an urgent need to address the synergy between regional balanced development and energy transition [51]. Establish and improve a coordinated development mechanism for joint motor automobile pollution control. Strengthen communication and cooperation between cities, coordinate solutions to significant regional challenges in energy transition, and promote the rational flow and efficient allocation of resources. Construct a province-wide dynamic monitoring and scientific assessment system for motor automobile emissions, regularly monitor and evaluate regional energy consumption status, and provide a scientific basis for policy formulation.

Author Contributions

Conceptualization, D.W., Z.Z., J.S. and Z.L.; methodology, D.W., X.T. and J.S.; validation, Z.S.; formal analysis, Z.Z., H.X. and T.L.; investigation, Z.L.; resources, X.Y. and J.W.; data curation, C.Y.; writing—original draft preparation, D.W., J.S. and Z.L.; writing—review and editing, Z.Z., J.S. and Z.L.; visualization, J.S. and H.X.; supervision, X.Y. and J.W.; project administration, D.W.; funding acquisition, D.W. and J.W. All authors have read and agreed to the published version of the manuscript.

Funding

This research was funded by the National Natural Science Foundation of China (Grant No. 42401435) and Guangdong Provincial Science and Technology Program (2024B1212080004).

Institutional Review Board Statement

Not applicable.

Informed Consent Statement

Not applicable.

Data Availability Statement

Data will be made available on request.

Conflicts of Interest

The authors declare that they have no known competing financial interests or personal relationships that could have appeared to influence the work reported in this paper.

References

  1. Alvarado-Molina, M.; Curto, A.; Wheeler, A.J.; Tham, R.; Cerin, E.; Nieuwenhuijsen, M.; Vermeulen, R.; Donaire-Gonzalez, D. Improving traffic-related air pollution estimates by modelling minor road traffic volumes. Environ. Pollut. 2023, 338, 122657. [Google Scholar] [CrossRef]
  2. Emissions Control Technologies to Meet Current and Future European Vehicle Emissions Legislation; Association for Emissions Control by Catalyst: Brussels, Belgium, 2020.
  3. Yulong, S.; Yue, P.; Biwu, C. Control status and emission reduction strategies of nitrogen oxides in key industries in China. Res. Environ. Sci. 2023, 36, 431–438. [Google Scholar]
  4. Gao, X.L.; Hu, T.J.; Wang, K. Research on motor vehicle exhaust pollution monitoring technology. Appl. Mech. Mater. 2014, 620, 244–247. [Google Scholar] [CrossRef]
  5. Wang, F.; Zhao, J.; Li, T.; Guan, P.; Liu, S.; Wei, H.; Zhou, L. Research on NOx Emissions Testing and Optimization Strategies for Diesel Engines Under Low-Load Cycles. Atmosphere 2025, 16, 190. [Google Scholar] [CrossRef]
  6. Vijai, C.; Babu, M.D.; Babu, M.N.; Sathiyamoorthi, R.; Sathyanarayanan, S.; Sathya, V.; KamakshiPriya, K.; Alemayehu, H. Optimizing Combustion Efficiency and Emission Reduction in Low Temperature Combustion Engines Using Biodiesel-Nano Additive Alcohol Blends: A Review. Results Eng. 2025, 27, 106175. [Google Scholar] [CrossRef]
  7. Lu, C. Analysis of China’s New Energy Vehicle Industry. In Proceedings of the 2022 7th International Conference on Financial Innovation and Economic Development (ICFIED 2022), Online, 14–16 January 2022. [Google Scholar]
  8. Zheng; Li, W.; Cui, K.; Cheng, X.; Huang, J. Reevaluating the Impact of New Energy Vehicles: A Vehicle Substitution Pattern Analysis on Comprehensive Emission Reduction Effects. Energy 2025, 318, 134834. [Google Scholar] [CrossRef]
  9. Chen, A.; You, S. The Fuel Cycle Carbon Reduction Effects of New Energy Vehicles: Empirical Evidence Based on Regional Data in China. Sustainability 2022, 14, 16003. [Google Scholar] [CrossRef]
  10. Bishop, S. How We Can Reduce Vehicle Emissions and Air Pollution. 2024. Available online: https://www.clarity.io/blog/air-pollution-traffic-monitoring-strategies-for-reducing-emissions-in-big-cities (accessed on 5 April 2025).
  11. Manzueta, R.; Kumar, P.; Arino, A.H.; Martín-Gomez, C. Strategies to reduce air pollution emissions from urban residential buildings. Sci. Total Environ. 2024, 951, 175809. [Google Scholar] [CrossRef]
  12. Zhou, H.; Cen, K.; Fan, J. Modeling and optimization of the NOx emission characteristics of a tangentially fired boiler with artificial neural networks. Energy 2004, 29, 167–183. [Google Scholar] [CrossRef]
  13. Simpkins, G. Benefits of electric vehicle adoption. Nat. Rev. Earth Environ. 2023, 4, 432. [Google Scholar] [CrossRef]
  14. Feng, R.; Li, Z. Current investigations on global N2O emissions and reductions: Prospect and outlook. Environ. Pollut. 2023, 338, 122664. [Google Scholar] [CrossRef] [PubMed]
  15. Amin, L. Control of nitrogen oxide emission from vehicular engines: Brief perspectives. Austin Environ. Sci. 2019, 4, 1–2. [Google Scholar]
  16. Akopov, A.S.; Beklaryan, L.A.; Saghatelyan, A.K. Agent-based modelling of interactions between air pollutants and greenery using a case study of Yerevan, Armenia. Environ. Model. Softw. 2019, 116, 7–25. [Google Scholar] [CrossRef]
  17. Wei, J.; Li, Z.; Lyapustin, A.; Wang, J.; Dubovik, O.; Schwartz, J.; Sun, L.; Li, C.; Liu, S.; Zhu, T. First close insight into global daily gapless 1 km PM2.5 pollution, variability, and health impact. Nat. Commun. 2023, 14, 8349. [Google Scholar] [CrossRef]
  18. Han, L.; Wang, Y.; Li, J.; Fang, S. Investigations on Driving Factors of Coordination Development of Rural Infrastructure and Ecological Environment: The Case of Western China. Buildings 2024, 14, 858. [Google Scholar] [CrossRef]
  19. People’s Government of Guangdong Province. Buy a New Car and Enjoy a Maximum Subsidy of 20,000 yuan. 2024. Available online: https://www.gd.gov.cn/zwgk/zcjd/mtjd/content/post_4485665.html (accessed on 10 March 2025).
  20. Guangdong Provincial Energy Bureau. Notice from Guangdong Provincial Energy Bureau on Issuing the Construction Tasks for Electric Vehicle Charging Infrastructure in 2024. 2024. Available online: https://drc.gd.gov.cn/gdsnyj/gkmlpt/content/4/4357/mpost_4357571.html#4247 (accessed on 10 March 2025).
  21. People’s Government of Guangdong Province. Macroeconomic Performance of Guangdong Province in 2020. 2020. Available online: https://www.gd.gov.cn/zwgk/sjfb/sjkx/content/post_3184233.html (accessed on 10 March 2025).
  22. Guan, Y.; Shan, Y.; Hang, Y.; Nie, Q.; Liu, Y.; Hubacek, K. Unlocking global carbon reduction potential by embracing low-carbon lifestyles. Nat. Commun. 2025, 16, 1–16. [Google Scholar] [CrossRef]
  23. Wu, M. Analysis of fuel consumption limits and measurement methods for commercial trucks. Highw. Automot. Appl. 2010, 25–29. Available online: https://d.wanfangdata.com.cn/periodical/glyqy201005008 (accessed on 10 March 2025).
  24. Dong, M.A.; Feng, A.N.; Kang, L.; Earley, R. Corporate average fuel consumption (CAFC) and its limit standard of passenger vehicle in China. J. Automot. Saf. Energy Effic. 2012, 3, 364–370. [Google Scholar]
  25. Xun, S.; Wei, W. Testing the fuel consumption of operating buses based on JT/T 711-2016 standard. Small Intern. Combust. Engines Veh. Technol. 2022, 3, 68–72. Available online: https://www.nstl.gov.cn/paper_detail.html?id=5a66b17a0fe46b2f246cd94a92dd9803 (accessed on 10 March 2025).
  26. Transportation Standardization Information System. Limits and Measurement Methods of Fuel Consumption for Commercial Vehicle for Cargos Transportation. 2025. Available online: https://jtst.mot.gov.cn/hb/search/stdHBDetailed?id=ed3cb0cd88047a22e1dcab01fd963fb6 (accessed on 10 March 2025).
  27. Ouyang, T.; Wang, C.; Yu, Z.; Stach, R.; Mizaikoff, B.; Huang, G.B.; Wang, Q.J. NOx measurements in vehicle exhaust using advanced deep ELM networks. IEEE Trans. Instrum. Meas. 2020, 70, 1–10. [Google Scholar] [CrossRef]
  28. Zhang, W.; Zuo, C.; Liao, T.; Zhou, G.; Zhao, D. Research on improving the performance of motor vehicle exhaust gas detection system based on DOAS technology. In Proceedings of the Ninth Symposium on Novel Photoelectronic Detection Technology and Applications (NDTA 2022), Hefei, China, 21–23 April 2023; p. 12617. [Google Scholar]
  29. Li, Y.; Chen, Y. Development of an SBM-ML model for the measurement of green total factor productivity: The case of pearl river delta urban agglomeration. Renew. Sustain. Energy Rev. 2021, 145, 111131. [Google Scholar] [CrossRef]
  30. Wu, J.; Wang, Y.; Liang, J.; Yao, F. Exploring common factors influencing PM2.5 and O3 concentrations in the Pearl River Delta: Tradeoffs and synergies. Environ. Pollut. 2021, 285, 10.1016. [Google Scholar] [CrossRef]
  31. Li, Y.; Shi, G.; Chen, Z. Spatial and temporal distribution characteristics of ground-level nitrogen dioxide and ozone across China during 2015–2020. Environ. Res. Lett. 2021, 16, 124031. [Google Scholar] [CrossRef]
  32. Shen, Y.; Jiang, F.; Feng, S.; Zheng, Y.; Cai, Z.; Lyu, X. Impact of weather and emission changes on NO2 concentrations in China during 2014–2019. Environ. Pollut. 2021, 269, 116163. [Google Scholar] [CrossRef] [PubMed]
  33. Lu, T.; Wang, D.; Yang, X.; Li, Z.; Xia, H.; Song, Z.; Yang, Y.; Mo, Y.; Wang, J. Integrated modeling and quantitative analysis of N2O emission before and after COVID-19: A case in Guangdong Province. Sustain. Energy Technol. Assess. 2025, 77, 104313. [Google Scholar] [CrossRef]
  34. Yang, L.; Franco, V.; Campestrini, A.; German, J.; Mock, P. NOx Control Technologies for Euro 6 Diesel Passenger Cars; International Council on Clean Transportation: Berlin, Germany, 2015. [Google Scholar]
  35. Chen, H.; Sener, S.E.C.; Van Emburg, C.; Jones, M.; Bogucki, T.; Bonilla, N.; Ijeoma, M.W.; Wan, H.; Carbajales-Dale, M. Electric light-duty vehicles have decarbonization potential but may not reduce other environmental problems. Commun. Earth Environ. 2024, 5, 476. [Google Scholar] [CrossRef]
  36. Reichmuth, D. Today’s Electric Vehicles Can Greatly Reduce Emissions from Driving. 2023. Available online: https://blog.ucs.org/dave-reichmuth/todays-electric-vehicles-can-greatly-reduce-emissions-from-driving/ (accessed on 10 March 2025).
  37. Zhang, W.-B.; Xie, Z.-H.; Yu, C.-J. The Influence of Industrial Structure Adjustment on Carbon Emissions: An Analysis Based on the Threshold Effect of Green Innovation. Sustainability 2024, 16, 6935. [Google Scholar] [CrossRef]
  38. Adegbite, A.O.; Nwasike, C.N.; Nwaobia, N.K.; Gidiagba, J.O.; Enabor, O.T.; Dawodu, S.O.; Adefemi, A.; Ezeigweneme, C.A. Modern electric motors: A review of sustainable design and maintenance principles: Scrutinizing the latest trends focusing on motor efficiency, sustainability, recyclability, and reduced maintenance. World J. Adv. Res. Rev. 2023, 20, 1198–1211. [Google Scholar] [CrossRef]
  39. IDTechEx. The Role of Electric Motors in Sustainable Electric Vehicles. 2024. Available online: https://www.innovationnewsnetwork.com/the-role-of-electric-motors-in-sustainable-electric-vehicles/51854/ (accessed on 10 March 2025).
  40. Li, R.; Han, X.; Wang, Q. Do technical differences lead to a widening gap in China’s regional carbon emissions efficiency? Evidence from a combination of LMDI and PDA approach. Renew. Sustain. Energy Rev. 2023, 182, 113361. [Google Scholar] [CrossRef]
  41. Wang, Y.; Wang, R.; Tanaka, K.; Ciais, P.; Penuelas, J.; Balkanski, Y.; Zhang, R. Accelerating the energy transition towards photovoltaic and wind in China. Nature 2023, 619, 761–767. [Google Scholar] [CrossRef]
  42. Suman, D.; Rajak, S. Sustainable product design for electric vehicles. In Progress in Sustainable Manufacturing; Springer: Berlin/Heidelberg, Germany, 2023; pp. 31–44. [Google Scholar]
  43. Chinese Social Sciences Network. New Productive Forces to Invigorate Real Economy. 2024. Available online: http://english.cssn.cn/skw_research/economics/202401/t20240117_5729325.shtml (accessed on 10 March 2025).
  44. Rodrigues, A.L.; Seixas, S.R. Battery-electric buses and their implementation barriers: Analysis and prospects for sustainability. Sustain. Energy Technol. Assess. 2022, 51, 101896. [Google Scholar] [CrossRef]
  45. Liu, Y.; Ding, Y.; Jiang, P.; Jin, X.; Wu, X.; Zheng, Z. Joint Optimal Design of Electric Bus Service and Charging Facilities. Sustainability 2024, 16, 6155. [Google Scholar] [CrossRef]
  46. Department of Ecology and Environmental of Guangdong Province. The Implementation Plan for Ozone Pollution Prevention and Control (Coordinated Reduction of Nitrogen Oxides and Volatile Organic Compounds) in Guangdong Province from 2023 to 2025. 2023. Available online: https://gdee.gd.gov.cn/wj5666/content/post_4097395.html (accessed on 10 March 2025).
  47. Sayarshad, H.R. Optimization of electric charging infrastructure: Integrated model for routing and charging coordination with power-aware operations. NPJ Sustain. Mobil. Transp. 2024, 1, 4. [Google Scholar] [CrossRef]
  48. Mohammed, A.; Saif, O.; Abo-Adma, M.A.; Elazab, R. Multiobjective optimization for sizing and placing electric vehicle charging stations considering comprehensive uncertainties. Energy Inform. 2024, 7, 131. [Google Scholar] [CrossRef]
  49. People’s Government of Guangdong Province. Notice of the General Office of the People’s Government of Guangdong Province on Issuing the 14th Five Year Plan for Energy Development in Guangdong Province. 2022. Available online: https://www.gd.gov.cn/zwgk/wjk/qbwj/yfb/content/post_3909371.html (accessed on 10 March 2025).
  50. Muthusamy, T.; Meyyappan, U.; Thanikanti, S.B.; Khishe, M. Enhancing distribution system performance by optimizing electric vehicle charging station integration in smart grids using the honey badger algorithm. Sci. Rep. 2024, 14, 27341. [Google Scholar] [CrossRef]
  51. Li, Z.; Niu, S.; Wang, J.; Tan, Y.; Wang, Z. Multidimensional assessment of energy transition and policy implications. Renew. Energy 2025, 238, 121870. [Google Scholar] [CrossRef]
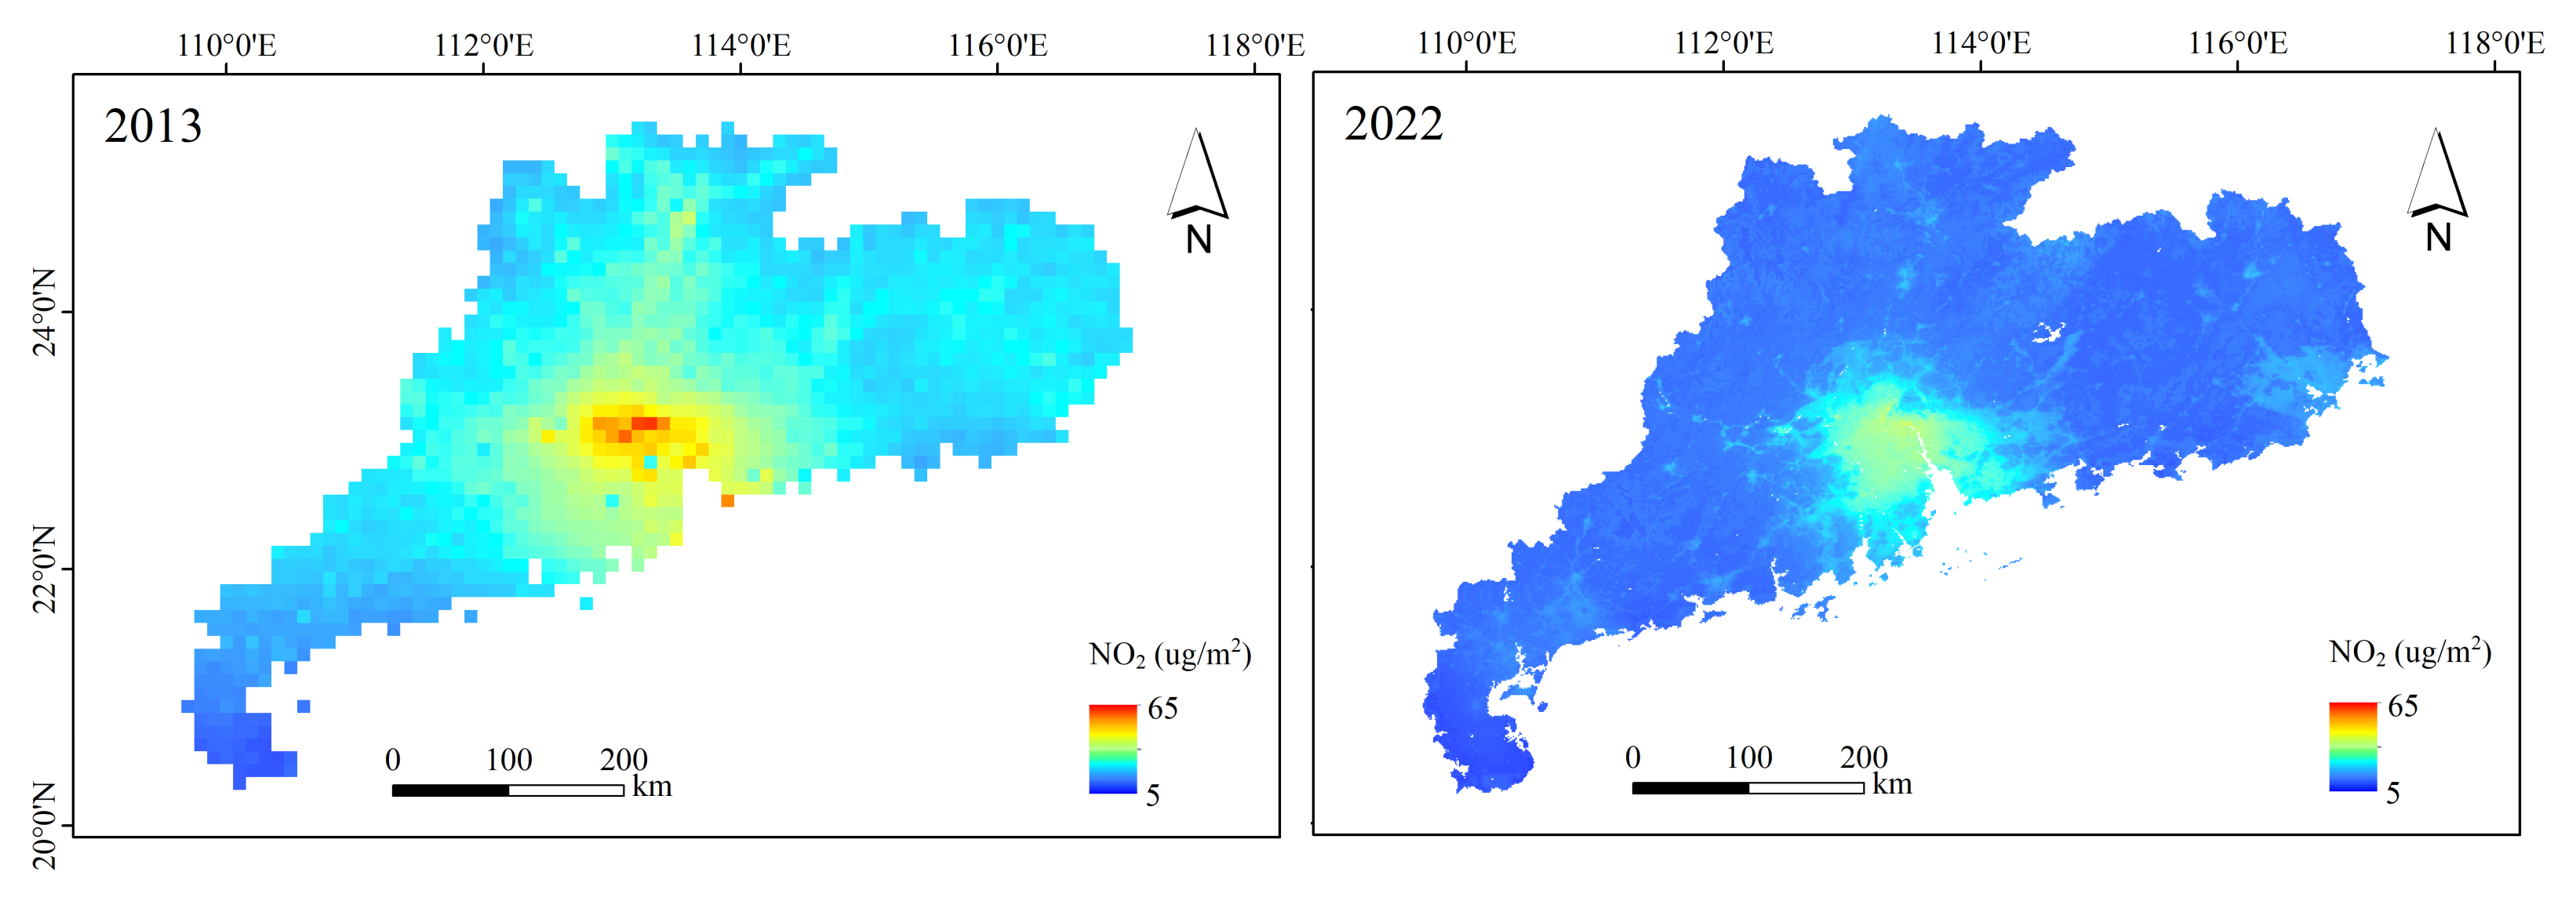
Figure 1. Spatial patterns of NO2 in Guangdong Province in 2013 ((left), spatial resolution of 10 km) and 2022 ((right), spatial resolution of 1 km).
Sustainability 17 07334 g001
Figure 2. Evolution of highway mileage in Guangdong Province.
Sustainability 17 07334 g002
Figure 3. Production of NEVs in Guangdong Province from 2018 to 2023.
Sustainability 17 07334 g003
Figure 4. Near-surface NO2 concentration of Guangdong Province from 2013 to 2022.
Sustainability 17 07334 g004
Figure 5. The number of NEVs in Guangdong Province from 2018 to 2022.
Sustainability 17 07334 g005
Figure 6. NOx emissions in Guangdong Province from 2013 to 2022.
Sustainability 17 07334 g006
Figure 7. Emissions shares of ICEVs in various years.
Sustainability 17 07334 g007
Figure 8. Emission shares of NEVs in various years.
Sustainability 17 07334 g008
Figure 9. Comparison of NOx emissions from hypothetical automobile model and NOx emissions calculated with Equation (2) using data from the annual report on mobile source environmental management.
Sustainability 17 07334 g009
Figure 10. Emission reduction of NEVs and ICEVs in Guangdong Province from 2014 to 2022.
Sustainability 17 07334 g010
Figure 11. Proportion of emission reduction (PER) of NEVs and ICEVs in Guangdong Province from 2014 to 2022.
Sustainability 17 07334 g011
Table 1. Number of various types of ICEVs in Guangdong Province (104).
Year/Type
Large
Large
Freight
Medium
Freight
Light
Freight
Mini
Freight
Large
Passenger
Medium
Passenger
Compact
Passenger
Mini
Passenger
201323.217.74134.573.3815.6216.88947.6912.21
201425.8315.83136.693.4915.4113.581103.6311.56
201526.3612.9132.23.4415.318.721256.2510.3
201629.0912.45138.582.9016.37.441453.458.46
201733.2511.81148.492.4517.476.491660.097.91
201837.7111.46166.452.2917.675.661860.017.96
201942.411.13181.952.0317.515.142050.777.55
202049.3610.78197.631.7216.644.672203.726.93
202156.5610.13213.751.3115.724.372384.046.34
202255.379.13219.670.8814.633.962576.325.65
Table 2. NEV ownership and production from 2018 to 2022 (104).
YearNational NEV
In-Use Stock
National NEV
Output
Guangzhou NEV
Output
201826112713.67
2019381124.215.26
2020492136.620.87
2021784354.553.5
20221310705.8129.73
Table 3. Mass-specific fuel consumption (g/km) by ICEV category.
YearAutomobile Stock b (104)Travel Distance c (104 km)Fuel Consumption d (kg/km)
Mini/compact2390.31.80.056
Medium4.363.130.163
Large8.945.80.163
Taxi5.4112/
Mini/light-duty213.7730.105
Medium-duty10.133.50.157
Heavy-duty56.567.50.252
Table 4. Annual average concentration of NO2 in Guangdong Province from 2013 to 2022.
YearNO2 Concentration (μg/m3)
201325.689
201425.714
201521.437
201621.474
201723.753
201823.368
201917.624
202016.239
202116.239
202215.487
Table 5. NOx emissions in Guangdong Province during the past decade.
YearNational Automobile Stock (104)Guangdong Automobile Stock (104)National NOx Emissions
(104 tons)
Guangdong NOx Emissions
(104 tons)
201312,572.41171.3588.754.84587748
201414,452.21326578.953.1145016
201516,169.71465.5539.148.85996957
201618,435.81675.5534.648.58602827
201720,8161896532.848.52943889
201823,121.82116521.947.76186975
201926,0002326.95622.255.68570346
202028,1002532.29613.755.30485313
202130,2002702568.550.86380795
202231,9002896515.946.83531034
Table 6. Results of p 1 and p 2 from 2013 to 2022.
Year p 1 (104 tons/Year) p 2 (104 tons/Year)
20130.037/
20140.033/
20150.028/
20160.025/
20170.022/
20180.022−0.222
20190.022−0.10
20200.023−0.18
20210.025−0.241
20220.019−0.074
Simulated Logarithmic
Mean
0.026−0.163
95%
Confidence Interval
(0.0254, 0.0261)(−0.169, −0.157)
Disclaimer/Publisher’s Note: The statements, opinions and data contained in all publications are solely those of the individual author(s) and contributor(s) and not of MDPI and/or the editor(s). MDPI and/or the editor(s) disclaim responsibility for any injury to people or property resulting from any ideas, methods, instructions or products referred to in the content.