Abstract
Understanding urban diversity is critical to inclusive planning for sustainable urban development. This study introduces a new Urban Diversity Index (UDI) based on global point-of-interest (POI) data for food-related establishments—defined here as facilities that offer food and beverage services, including various kinds of eating and drinking venues —covering 249 cities across 154 countries. The UDI integrates three components: Pielou’s Evenness Index (J′) to capture the balance of establishment types, a Coverage Ratio (C′) to measure global representativeness of establishment categories, and density () to reflect spatial concentration. By applying concentric buffer analysis around city centers, we evaluate the spatial profiles of diversity in each city. Results show that while cities like London and Istanbul have similar index components, they exhibit significant differences in the spatial extent and pattern of high-diversity zones, reflecting their unique morphological and regulatory contexts. Furthermore, the analysis of “Peak Distance Buffer Zones”—areas where UDI remains above 95% of its maximum—reveals diverse urban forms, particularly in Asian megacities. Scatterplots of standardized UDI and peak distances identify distinct typologies of urban diversity structures. Notably, urban population size showed no significant correlation with UDI values. Overall, this study demonstrates the utility of globally standardized POI-based metrics in capturing the spatial heterogeneity of urban qualitative diversity and offers new insights into cross-city comparisons of urban complexity.
1. Introduction
1.1. Research Background: Significance and Challenges in Capturing Urban Diversity
1.1.1. The Value and Role of Diversity in Urban Contexts
In the 21st century, cities have become increasingly central to the global economy. The international movement of people, goods, and information has accelerated at an unprecedented pace, driving the evolution of urban structures and functions toward greater complexity and sophistication [1,2,3,4]. As cities continue to evolve, their expected roles have expanded beyond being mere hubs of population agglomeration and economic production. They are now required to serve as inclusive and vibrant spaces that integrate diverse values such as culture, entertainment, creativity, and social inclusion [5,6].
A key factor that supports this growing multifunctionality of cities is “diversity.” Diversity refers to the heterogeneity and richness of people, functions, and activities within urban spaces. It has long been recognized as a source of urban attractiveness, competitiveness, and sustainability [7,8]. For example, when a variety of businesses and services are co-located, they can create opportunities for people from different cultural and social backgrounds to interact, sparking the emergence of new values and creative ideas [9,10].
Similarly, “mixed-use urban environments,” where residential, commercial, cultural, and public functions coexist spatially and functionally, are known to foster continuous interactions between people and diverse land uses. These interactions generate everyday opportunities for creative exchange and lifestyle innovation [11,12,13]. The multifaceted benefits of mixed-use development across social, environmental, and economic dimensions have also been empirically demonstrated in regional case studies in Italy [14]. This type of “diversity-induced innovation” is increasingly regarded as a critical factor in enhancing urban productivity [15].
Moreover, for urban residents, the richness of cultural amenities and the diversity of everyday choices play an essential role in improving quality of life (QoL). Several studies have empirically shown that greater accessibility to cultural facilities and a wider range of functional urban amenities directly contribute to higher QoL for city dwellers [16,17,18].
To quantitatively capture such urban diversity on a global scale, this study focuses on the category of food-related facilities, defined as facilities that offer food and beverage services, including various kinds of eating and drinking venues, within POI (point-of-interest) data. As described later, food-related facilities are not only one of the most ubiquitous and well-classified types of urban establishments globally, but also reflect a city’s cultural, social, and economic heterogeneity. Their spatial distribution spans a variety of urban functions—from commercial zones and tourist areas to residential neighborhoods—making them a practical and theoretically grounded proxy for measuring the qualitative complexity of urban environments. Throughout this paper, we refer to food-related facilities collectively as “restaurants” for brevity and clarity. The use of food-related facilities’ diversity as the basis for constructing the Urban Diversity Index (UDI) is further detailed in Section 1.4.
1.1.2. Limitations of Conventional Urban Indicators and Cross-City Comparison Challenges
While the significance of diversity in urban contexts is increasingly acknowledged, substantial challenges remain regarding how to capture it quantitatively and spatially. Traditional urban assessments have predominantly relied on macroeconomic indicators such as population size, gross domestic product (GDP), and labor market metrics. However, these quantitative measures often fall short of adequately reflecting the qualitative dimensions of urban life [19]. For instance, a megacity with a population of ten million may score highly in terms of size and economic output, yet if it offers a limited range of services and amenities, its diversity should arguably be rated low. Such nuances are typically invisible when viewed through the lens of conventional macro-level indicators.
Similarly, Giannetti et al. (2015) criticize overreliance on GDP and comparable metrics for failing to account for qualitative elements such as environmental quality, public health, equity, and subjective well-being [20].
A related and persistent issue in urban studies is the challenge of making meaningful cross-city comparisons across different national and regional contexts. Pumain et al. (2015), in their comparative study of urban demographics and growth patterns in China, India, Brazil, Europe, the United States, and South Africa, identified inconsistencies in urban definitions and national statistical standards as significant barriers to effective global urban analysis [21]. Csomós (2020) likewise highlights the difficulty of collecting and processing urban data with consistent scales and quality across cities, which continues to hinder efforts toward rigorous international comparisons [22]. These challenges stem from a complex interplay of factors, including variations in statistical systems, definitions of what constitutes a “city,” and differences in data collection methods and temporal resolutions among countries. As a result, a globally applicable and standardized framework for assessing the qualitative attributes of cities has yet to be fully established.
1.1.3. Difficulties in Acquiring Qualitative Data and Capturing Urban Dynamics
Acquiring qualitative urban data poses significant practical challenges—especially in countries or regions with limited statistical infrastructure. In such areas, up-to-date and detailed spatial data on urban amenities are often unavailable, which hinders planning and investment [23,24,25]. Even where systems exist, infrequent updates limit their relevance for tracking rapidly changing urban dynamics [26,27]. This issue is particularly acute in informal or low-income areas where data collection is impeded by institutional limitations and community resistance [28,29].
Moreover, conventional urban statistics generally focus on nighttime populations, limiting their capacity to capture the dynamic flows of commuters, tourists, or daytime users [30,31,32]. Cities with similar population sizes can differ significantly in vibrancy depending on tourism and cultural activity levels [33,34].
Urban diversity also varies by spatial structure. Monocentric cities, with functions concentrated in a core, differ from polycentric cities where functions are dispersed [35,36]. Thus, understanding diversity requires both localized and spatially extensive analysis.
To address these challenges, this study proposes a novel approach using globally harmonized point-of-interest (POI) data to construct the Urban Diversity Index (UDI). Specifically, the Foursquare Places OS dataset is employed to assess both quantitative and qualitative characteristics of cities at high resolution. POI data represent geolocated records of facilities that anchor human activity, including attributes such as location, category, and operational details [37]. Such datasets are increasingly used for assessing functional urban diversity [38,39].
1.2. Literature Review
Research aimed at understanding urban diversity and the qualitative characteristics of cities has been actively pursued across a wide range of disciplines, including urban planning, geographic information science, public policy, and sociology. Despite this multidisciplinary engagement, significant challenges remain—particularly regarding the availability of appropriate data and the development of robust evaluation methods. This section provides an overview of the existing literature, structured around the following key perspectives.
1.2.1. Attempts to Quantify Urban Qualitative Characteristics and Their Limitations
Efforts to assess qualitative urban aspects—such as quality of life (QoL), vitality, and attractiveness—have long relied on integrated indices combining environmental, infrastructural, safety, and cultural factors [32]. However, these indicators, often derived from government statistics and surveys, tend to reflect a residential perspective and overlook dynamic elements such as transient populations and spatial activity patterns. Scholars have emphasized the need to complement these with big data-based analyses [40,41,42], as traditional data suffer from coarse granularity and infrequent updates [43,44].
To address these gaps, recent studies have used image and geospatial big data. For instance, one study created a vitality index using heat maps and street imagery [32], while another compared OpenStreetMap and Google Maps POI data to evaluate accessibility and inequality within 15-min cities [45]. Despite offering dynamic insights, these approaches face issues of precision, limited coverage, cost, and technical constraints.
POI data have drawn increasing attention as tools for assessing urban functional diversity. For example, studies in London have analyzed facility distributions via POI density and entropy [46], and others used POIs and geotagged photos to examine spatial diversity’s relationship with vitality and satisfaction [47].
Nonetheless, most existing work remains city- or country-specific. The quality of POI analysis is highly dependent on dataset resolution and structure, which vary significantly across countries due to institutional and technological differences [37,48]. This heterogeneity impedes cross-national analysis and underlines the need for global standardization of POI data and methodologies.
1.2.2. Barriers to Global Comparative Research: Inconsistent Statistical Frameworks, Spatial Resolution, and Update Frequency
Cross-national urban studies often rely on official statistics, but inconsistent definitions of “urban areas,” aggregation units, and data update frequency undermine their comparability [49,50]. For example, in QoL studies in Europe, some countries aggregate data by administrative boundaries, while others use actual urban extents, complicating comparisons [51,52].
While developed countries have increasingly adopted digital systems enabling granular and frequent updates, many developing nations still lack neighborhood-level or facility-level data [53,54]. In fast-changing urban areas, where land use and structure evolve rapidly, such data gaps hinder the ability to monitor “living cities” [55].
Frequent changes in administrative boundaries further complicate analysis and generalization. Overall, institutional inconsistencies, outdated data, and poor spatial resolution pose major challenges to coherent international comparisons.
Although POI data avoid some of these problems—since they are not tied to fixed aggregation units—they still vary in data structure, attributes, and update cycles across countries. Thus, harmonizing POI datasets remains essential for robust global-scale analysis.
1.2.3. Challenges in Data Infrastructure in Developing and Peripheral Urban Areas
In many developing regions—such as Sub-Saharan Africa, South Asia, and Southeast Asia—urban data remain scarce and unreliable. Official statistics on land use and facility density are often incomplete, and peripheral cities suffer from low survey coverage and limited reliability [28,56,57]. Even satellite image-based methods can produce large errors due to spatial disparities in infrastructure and terrain conditions [58].
To compensate, traditional surveys are used, but they are labor-intensive, costly, and difficult to maintain. Issues include inexperienced personnel, limited outreach, and funding shortages, which lead to rapid data obsolescence in fast-growing cities [59,60].
Given these issues, conventional methods are poorly suited for capturing the rapid changes in developing cities. In contrast, POI data—updated through user contributions and geolocation—can detect qualitative urban shifts. While spatial coverage and update regularity remain concerns, POI datasets offer a valuable supplement in data-poor contexts.
1.2.4. Limitations of Researcher-Initiated Urban Data Collection: Cost, Scalability, and Sustainability
In data-scarce regions, researcher-led surveys and questionnaires have supported urban data collection but face major constraints in terms of cost, time, and staffing [61,62]. Ensuring consistent quality requires extensive training, while issues such as staff turnover and cultural or linguistic gaps hinder continuity [63,64]. Moreover, qualitative surveys are difficult to standardize and quickly become outdated in fast-changing cities [65].
These limitations are especially problematic for international comparisons that require scalability and replicability across diverse urban contexts. POI data, updated continuously by users and businesses, offer a scalable alternative for wide-area facility information without fieldwork. They often include metadata, such as business type, name, opening hours, and closure status, enabling insights into urban dynamics.
If globally standardized, POI datasets can provide sustainable, cross-regional tools for urban evaluation, addressing cost and scalability issues inherent in traditional data collection methods.
1.3. A New Opportunity: A Turning Point Enabled by Global-Scale POI Data
As highlighted in previous sections, comparative studies of cities across nations have long been hampered by institutional and technical inconsistencies—such as mismatched statistical frameworks, uneven spatial resolution, and infrequent data updates. In particular, developing countries and peripheral cities often lack sufficient official data, creating major challenges for spatially consistent analysis. While researcher-led field surveys can partially address these gaps, they are typically limited by high costs, labor demands, and poor scalability, making them ill-suited for global or long-term monitoring [28,56,57,59,61,62,63,64].
In this context, global-scale point-of-interest (POI) data has emerged as a promising alternative. POI datasets—such as those from Foursquare, Google Maps, and OpenStreetMap—consist of geolocated facility records (e.g., restaurants, retail stores, public institutions), often enriched with metadata such as names, business categories, addresses, and operating hours [37,66,67]. These datasets are continuously updated through user activity and mobile apps, enabling high-frequency, high-resolution observations of urban function and structure.
This study utilizes the Foursquare Places OS dataset, which provides extensive global coverage (over 200 countries) and offers standardized categorization of facilities by type (Figure 1). Its rich metadata and dynamic updating mechanisms make it well-suited for identifying patterns of urban functionality and diversity in near real time.
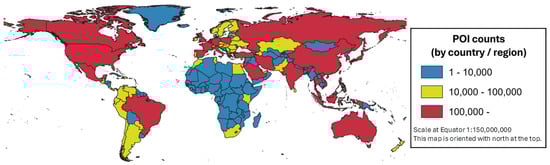
Figure 1.
Number of POIs per country or region in Foursquare Places OS Data (as of February 2025).
By leveraging these unique characteristics, this study introduces a globally scalable framework for measuring urban diversity. Rather than simply replacing conventional methods, the use of POI data offers a paradigm shift—building a foundation for cross-national benchmarking, spatial equity analysis, and digital-twin city applications. Through this approach, we aim to advance data-driven urban research and policy innovation in ways previously constrained by traditional data limitations.
1.4. Rationale for Emphasizing the Restaurant Category in Evaluating Urban Diversity
This study focuses on the “restaurant” category from the Foursquare Places OS dataset as a practical and theoretically valid proxy for urban diversity.
First, restaurants are highly concentrated in urban centers and reflect local economic activity and social demand. Their spatial distribution spans various land-use zones—commercial districts, residential areas, tourist sites—and mirrors cities’ functional complexity and lifestyle diversity [13,37,68,69,70,71,72,73,74]. Additionally, restaurants are among the most finely classified POI types within Foursquare’s hierarchy [75], making them effective for analyzing cultural and service diversity.
Second, prior studies have demonstrated that restaurant type and density serve as indirect indicators of urban vibrancy, such as external visitor frequency and daytime population [13,31,76]. Because restaurants often mediate interactions between residents and non-residents, their distribution provides insight into a city’s openness and cultural receptivity (Figure 2).
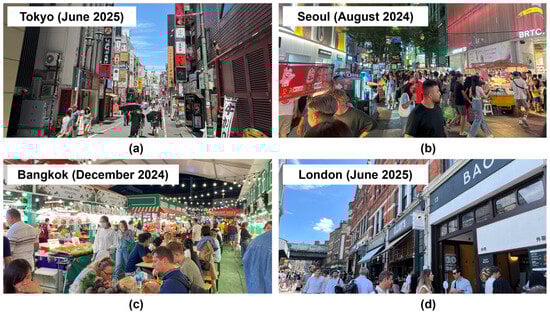
Figure 2.
Urban openness and vibrancy as illustrated by the diversity and spatial arrangement of dining establishments in different global cities: (a) Tokyo (June 2025); (b) Seoul (August 2024); (c) Bangkok (December 2024); (d) London (June 2025). All photos taken by the authors.
Third, restaurants are globally ubiquitous and classified more consistently than other POI types, such as educational or healthcare facilities. This makes them a suitable starting point for constructing internationally comparable diversity metrics.
For these reasons, this study centers on the restaurant category to build a foundation for measuring urban spatial and functional diversity and for enabling city-to-city comparisons. Rather than simply comparing the number of establishments, this approach targets the diversity of establishment types, aiming to construct a novel quantitative method that captures the sociocultural structures and spatial dynamics of cities.
1.5. Research Objective and Paper Outline
1.5.1. Research Objective
Building on the aforementioned discussion, the first objective of this study is to develop a quantitative indicator—the Urban Diversity Index (UDI)—designed to capture qualitative aspects of urban diversity through the lens of restaurant-type heterogeneity, using data from the Foursquare Places OS platform. Rather than measuring the abundance of all types of urban facilities, the UDI focuses on the diversity of restaurant categories as a proxy for the functional and cultural complexity of urban life. The Index incorporates multiple dimensions—such as the number of POIs, the variety of restaurant categories, the balance of their distribution, and their spatial dispersion—to enable meaningful cross-city comparisons.
The second objective is to calculate and compare UDI scores for cities across the globe and to identify spatial patterns and relationships with urban characteristics. Particular attention is given to differences in UDI trends between cities in developed and developing countries, as well as to the relative contributions of each UDI component, with the aim of empirically revealing global patterns in urban diversity.
1.5.2. Paper Outline
This paper is organized as follows.
Section 2: The Methods Section describes the source data, selection criteria for the target cities, and the methodological framework, including the definition and computation of the Urban Diversity Index (UDI) and its constituent indicators.
Section 3: The Results Section presents the outcomes of the inter-city comparisons and spatial pattern analyses derived from the UDI.
Section 4: The Discussion Section explores the conceptual significance of the UDI and its practical implications for real-world applications in urban planning and policy.
Section 5: The Conclusions Section summarizes the key findings of the study and outlines its current limitations as well as directions for future research.
2. Methods
This chapter provides a detailed explanation of the datasets and analytical methods used to construct the Urban Diversity Index (UDI), an original metric developed in this study.
2.1. Data
The primary data source used in this research is the “Foursquare Places OS Data.” In addition, metropolitan population data were utilized to capture the population scale of each city, along with ocean boundary data used for spatial preprocessing purposes.
2.1.1. Foursquare Places OS Data
This study utilizes the Foursquare Places OS dataset as its primary source for point-of-interest (POI) information. Released as open data in November 2024, the dataset contains detailed information on approximately 100 million POIs worldwide and is updated monthly. Each POI includes metadata, such as geographic coordinates, timestamps, and business categories, organized hierarchically.
We focus on restaurant-related POIs classified under the “Dining and Drinking” category. To enable more granular analysis, we reorganized Foursquare’s third-level categories into 173 specific restaurant types based on cuisine and region. This customized classification allows us to better assess the diversity of food-related establishments across cities. We refer to the resulting dataset as the “Fs POI dataset.” A complete list of the 173 restructured categories is provided in Appendix A.
2.1.2. Metropolitan Population Data
To identify urban centers and population sizes, we used the dataset “Population of Urban Agglomerations with 300,000 Inhabitants or More” [77], which is based on national census data. It includes historical and projected population figures from 1950 to 2035, as well as boundary polygons and centroid coordinates for each urban agglomeration. Using the 2025 projections, we selected up to two cities per country (with populations over 300,000 in 2018), provided that Foursquare POI data were available. Countries with no qualifying cities were excluded. This resulted in a final sample of 249 cities across 154 countries. The centroid coordinates of each urban agglomeration were used as reference points for spatial analysis.
2.1.3. Marine Area Data
Urban development has historically been closely linked to proximity to bodies of water, particularly for trade and resource access, and many cities are located along coasts and around ports [78,79]. As a result, several coastal cities in our dataset include substantial marine areas within their analytical boundaries. If these are not excluded, POI density may be underestimated due to the inclusion of uninhabitable water surfaces.
To avoid this distortion, we used water polygon data derived from OpenStreetMap’s coastline data—referred to as “Marine Area Data”—to exclude oceans and seas from the buffer zones around each city. This dataset does not include inland water bodies such as lakes or reservoirs. By restricting POI density calculations to land areas, we ensured more accurate and comparable measurements across cities.
2.2. Development of Evaluation Indicators
To evaluate the functional diversity of dining-related establishments within urban areas, this study developed a novel indicator called the Urban Diversity Index (UDI). The UDI was calculated through the following procedure.
2.2.1. Unit of Analysis
From the central coordinates of each target city, a series of concentric buffers were generated at 100-m intervals, extending up to a maximum radius of 50 km. All dining-related establishments located within each buffer zone were included in the analysis. The components of the UDI, described in subsequent sections, were computed for each of these buffer zones.
2.2.2. Definitions of the Indicators Constituting the UDI
The UDI is designed to provide a multifaceted assessment of the diversity of dining-related establishments within a city. Therefore, the UDI is defined as the product of three core indicators, each capturing a distinct aspect of urban diversity. The definitions and calculation methods for these indicators are detailed below.
- (1)
- Shannon–Wiener Index (H) and Pielou’s Evenness Index (J)
The Shannon–Wiener Index (H) is a widely used metric that captures diversity by integrating two components: richness (the number of distinct categories) and evenness (the balance of their occurrences) [80,81,82]. In this study, we apply H to assess the functional diversity of dining-related establishments in urban areas—specifically, how many types exist and how evenly they are distributed. H increases with a greater number of categories and more uniform distribution and decreases when fewer categories dominate the composition.
Let denote the total number of observed restaurant categories within a buffer around city α, and let represent the observed probability of category i. Then, the Shannon–Wiener Index is calculated using Equation (1):
Since is affected by the number of observed categories , it can be difficult to determine whether a high value results from richness or evenness. To address this, we employ Pielou’s Evenness Index , which normalizes relative to its theoretical maximum and enables meaningful inter-city comparisons [83,84]. It is calculated using Equation (2):
The value of ranges from 0 to 1, where values closer to 1 indicate a more perfectly even distribution across all observed categories.
- (2)
- Coverage ratio (C)
While Pielou’s Evenness Index () effectively captures how evenly the observed categories are distributed within a given area, it solely assesses the relative balance among the categories that are actually present. As such, it may overlook critical aspects necessary to fully characterize urban diversity. For example, consider City A, where 10 categories are distributed with perfect evenness ( = 1.0), and City B, where 100 categories are also distributed with perfect evenness ( = 1.0). Based on J′ alone, both cities appear equally diverse in terms of evenness. However, from the perspective of the complete universe of 173 restaurant categories defined in this study, it is evident that City B provides a significantly broader range of options for consumers and a more comprehensive representation of urban food diversity.
This limitation of evenness-based metrics as above has long been recognized in the ecological literature [84,85]. Since is constrained to the observed category set, an additional metric is required to assess absolute richness—specifically, the degree to which the observed categories cover the full category universe.
To address this, we introduce the Coverage Ratio (C) as an indicator of absolute category coverage. This metric represents the proportion of the total number of predefined restaurant categories (Stotal = 173) that are observed within a given area. Letting denote the number of unique categories observed in City α, the Coverage Ratio is defined using Equation (3):
While Pielou’s Evenness Index () captures the balance among observed categories, it does not account for how many of the total predefined categories are actually present. For instance, both City α and City β may have a perfect evenness score (( and are 1.0), but if City α includes only 10 restaurant categories and City β includes 100, the degree of diversity clearly differs. This limitation has been pointed out even in ecology, where evenness indices have long been widely used [84,85].
To address this issue, we introduce the Coverage Ratio (C′), which measures absolute richness by quantifying the proportion of predefined restaurant categories (Stotal = 173) observed in each city. Letting be the number of unique categories observed in city α, the Coverage Ratio is defined as Equation (3).
- (3)
- Dining and Restaurant Density ()
This indicator measures the number of dining-related establishments per unit land area within each buffer and serves as a proxy for the spatial concentration of food-related businesses. High restaurant density often reflects a combination of strong residential or visitor demand and agglomeration effects. Prior studies have shown that population density facilitates business clustering, particularly in sectors such as food and retail [72,86].
Let denote the number of dining-related establishments in buffer β of city α, and the land area (excluding marine regions). The density is calculated by Equation (4).
For each city α, the density value corresponding to the buffer where the UDI reaches its peak is used as the representative value. To normalize this metric, values exceeding the global 98th percentile across all buffers (from all cities) are capped at , and then all values are rescaled to the [0, 1] range. The normalized density is computed using Equation (5):
Here, represents the raw restaurant density for the buffer where the UDI reaches its peak in city α, and is the 98th percentile value of restaurant densities calculated across all 500 buffers from all 249 cities. Values exceeding are capped to reduce the influence of extreme outliers, a common issue when comparing cities of drastically different sizes and commercial intensities.
This percentile-based normalization approach ensures that the density metric remains robust and comparable across cities, especially between large metropolitan areas and smaller cities. The use of the 98th percentile is inspired by best practices in urban analytics and information systems research, such as the Winsorization method [87,88], which helps mitigate the skewing effect of a small number of abnormally high values.
To evaluate the robustness of this method, we compared it with alternative normalization techniques, including Min-Max scaling and Z-score normalization. While these methods produced slight variations in individual density values, the overall inter-city rankings and typological classifications based on the UDI remained largely consistent. Therefore, the 98th percentile global normalization was selected as a balanced and empirically validated approach for harmonizing density measures across global cities.
2.2.3. Definitions of the UDI
The UDI is calculated by integrating the three previously defined indicators: J′ (evenness), C′ (Coverage Ratio), and ρ′ (density). Each of these components captures a distinct dimension of the functional diversity of dining-related establishments: J′ reflects the richness and evenness of category distribution, C′ captures the comprehensiveness in terms of category coverage, and ρ′ represents the quantitative concentration of establishments. By taking the product of these three indicators, the UDI provides a balanced and comprehensive evaluation of urban diversity, highlighting cases where all aspects are simultaneously high. Since each component is normalized to a scale ranging from 0 to 1, the UDI is free from scale bias and allows for meaningful comparisons across different urban contexts. The UDI is formally defined by Equation (6).
The multiplicative formulation of the UDI was adopted to ensure that a low score in any one of the three dimensions—J′, C′, or ρ′—appropriately penalizes the overall urban diversity score. This approach reflects the concept that urban diversity requires a balanced presence across all dimensions. The use of a product also prevents the possibility of compensatory effects, where extremely high values in one dimension could mask deficiencies in others.
2.2.4. Peak Distance (d)
To evaluate the spatial extent and continuity of areas with high diversity in dining-related establishments, we introduce an additional indicator termed “Peak Distance (d)”. This metric identifies the contiguous range of concentric buffers in which the calculated UDI values are equal to or exceed 95% of the city’s maximum UDI. We define this contiguous range as the “high-diversity area” for each city. The indicator d thus quantifies the spatial persistence of functional diversity in dining-related establishments radiating from the city center, offering insight into how broadly such diversity is sustained within the urban core.
2.2.5. Defining Metropolitan Coverage Distances
Finally, to quantitatively delineate the spatial extent of functional diversity beyond core high-diversity zones, we introduce the Metropolitan Coverage Distance. This indicator measures how far the influence of dining-related functional diversity persists from the city center.
Previous studies have attempted to define metropolitan boundaries by fitting parametric models to the decay curves of urban indicators and identifying breakpoints based on maximum slope or inflection points [89,90,91,92]. However, our analysis revealed that the spatial patterns of UDI differ widely across cities—some display sharp declines near the center, others show gradual tapering or plateaus, and some exhibit local peaks at various distances. Due to such heterogeneity, parametric methods often fail to provide consistent or generalizable thresholds.
Therefore, this study adopts a non-parametric, threshold-based approach. Specifically, we define the Metropolitan Coverage Distance as the farthest buffer beyond the UDI peak where the UDI drops to 50% of its maximum value. This method avoids assumptions about the distributional form of diversity and is flexible enough to accommodate various urban morphologies. Unlike conventional definitions based on administrative boundaries or population density, our approach provides a function-based alternative for evaluating the spatial reach of urban complexity.
3. Results
This study applied the UDI, composed of the three indicators introduced in Section 2— (evenness),(Coverage Ratio), and (density)—to 249 cities across 154 countries worldwide.
This chapter first compares the characteristics of the three component indicators (, , and ) at the distance buffer where each city’s UDI reaches its maximum value, thereby identifying trends among the top-ranking cities. Next, it focuses on the overall UDI itself and examines the specific characteristics of the five cities with the highest UDI scores. Finally, for each city, the distance range where the UDI value exceeds 95% of its maximum is defined as the “Peak Distance Buffer Zone”, and the relationship between the UDI maximum value and its corresponding distance (Peak Distance) is visualized using a scatter plot to enable comparative analysis of diversity structures across cities.
3.1. Diversity Index of Food-Related Establishments in Urban Areas
3.1.1. Pielou’s Evenness Index ()
Pielou’s Evenness Index (J′) evaluates the evenness of the distribution of food-related establishments by type within concentric buffer zones centered on the urban core. A J′ value close to 1 indicates a balanced distribution across categories, whereas a value near 0 reflects skewness—namely, a dominance of particular categories over others. For instance, if a buffer zone contains one sushi restaurant, five fast food outlets, and four pizzerias, the uneven distribution results in a lower J′ value.
While some variation in establishment composition is typical in most cities, prior studies have shown that localized areas—such as low-income neighborhoods or districts with security concerns (e.g., slums)—may paradoxically exhibit high evenness due to constrained consumer options [93,94,95]. Similarly, suburban commercial zones or shopping complexes often feature homogenized tenant compositions, which can lead to relatively even distributions of establishment types. These findings are consistent with our results, where high J′ values (J′ = 1.0) are found in cities with otherwise low overall urban diversity.
Table 1 lists cities in which J′ reaches the maximum of 1.0, alongside their corresponding Urban Diversity Index (UDI) scores and Peak Distance Buffer Zones. While the high J′ suggests balanced distribution, these cities are typically ranked in the lower end of urban diversity (around the 200th place out of 249 cities). Moreover, their high-diversity zones are extremely narrow, often limited to within 0–100 m from the city center. This suggests that J′ = 1.0 is often driven by the limited number of food categories observed in small or narrowly defined urban cores.

Table 1.
Seven cities exhibiting the highest J′α values.
These results underscore a key limitation of using J′ as a standalone diversity measure—namely, that it evaluates the relative balance within observed categories but does not account for the completeness of category representation. This limitation is consistent with observations from the ecological sciences, where evenness measures have long been critiqued for failing to capture richness or compositional completeness [84,85]. Therefore, to obtain a comprehensive picture of urban functional diversity, J′ must be considered in conjunction with other indicators such as Coverage Ratio (C′) and density (ρ′), as proposed in our UDI framework.
In addition, we recognize that J′ may be artificially inflated in cities with sparse POI data, where only a few categories are recorded. In such cases, evenness may appear high not because of genuine diversity but due to statistical artifacts. To address this, future research should apply minimum POI count thresholds or sensitivity tests, as has been proposed in studies addressing data-sparse or under-mapped regions [76,77]. These approaches could enhance the robustness of inter-city comparisons. While we refrained from introducing a fixed cutoff in this study to avoid arbitrariness, we acknowledge that incorporating such data validation techniques will be crucial for future refinement of the methodology.
Overall, the results highlight both the analytical utility and the limitations of Pielou’s Index within urban diversity assessments, reinforcing the importance of a multidimensional approach like the UDI to capture urban complexity more holistically.
3.1.2. Coverage Ratio ()
The Coverage Ratio (C′) quantifies the extent to which the food-related establishments within a given buffer zone represent the full spectrum of 173 globally identified establishment categories. A higher C′ value indicates that a city offers a broader variety of globally recognized food-related categories within that spatial range, thereby reflecting a higher degree of categorical comprehensiveness or “coverage.” In essence, C′ evaluates how extensively the culinary landscape of a city mirrors global diversity in food-related services.
Table 2 presents the top 10 cities in terms of their C′ values at the buffer distances corresponding to peak UDI scores. These cities span multiple regions, including six from Asia—Hanoi, Istanbul, Tokyo, Jakarta, Bangkok, and Seoul—two from Europe—London and Paris—and two from North America—Mexico City and New York–Newark. This regional composition underscores that high coverage values are not limited to a single geographical area but are instead associated with various urban trajectories, including major global hubs (e.g., London, New York, Paris, Tokyo, Seoul), cultural and historical crossroads (e.g., Istanbul), post-colonial foodscapes (e.g., Hanoi), and multicultural urban agglomerations shaped by centuries of immigration (e.g., Mexico City).
Table 2.
Top 10 cities of and those profiles.
These findings align closely with prior research emphasizing that global cities tend to offer highly diverse and cosmopolitan food environments due to their roles as migration destinations, economic powerhouses, and cultural centers [10,13,31,37,68,69,70,71,72,73,74,76]. For instance, studies have shown that cities like New York and London serve as international culinary hotspots where a multitude of food cultures coexist and evolve [13,31,68]. Likewise, Tokyo and Paris have been identified as gastronomic capitals, where both traditional and global food categories are densely represented [10,70]. The inclusion of cities such as Hanoi and Jakarta also resonates with research highlighting the persistence of colonial legacies and the fusion of global and local food systems in shaping urban foodscapes [74,76].
Notably, all ten cities with the highest C′ values also rank within the top 35 in overall UDI scores, underscoring a strong empirical relationship between categorical coverage and overall functional diversity. This reinforces the notion that broad representation across food categories is a critical dimension of urban diversity, and C′ serves as a meaningful proxy for measuring the inclusiveness and vibrancy of a city’s dining landscape.
From a theoretical perspective, the C′ indicator complements the other components of the UDI framework by capturing not only how evenly or densely food establishments are distributed (J′ and ρ′), but also how extensively a city reflects global food typologies. This tripartite approach addresses critiques of earlier diversity metrics that often emphasized richness or evenness in isolation [37,72,86]. Thus, the Coverage Ratio C′ plays a key role in operationalizing a more holistic and internationally comparable measure of urban functional diversity.
3.1.3. Dining and Restaurant Density ()
The density indicator ρ′ quantifies the number of dining and restaurant establishments per unit area within each concentric buffer zone centered on the city core. This metric captures the spatial concentration of food-related establishments, where higher ρ′ values signify greater quantitative density. This concentration is often associated with enhanced human interaction, accessibility, and the potential for more dynamic and vibrant urban environments [10,13].
Our empirical results show that 69 out of 249 cities achieved the maximum possible density score of ρ′ = 1.000. However, the corresponding UDI scores among these cities exhibit substantial variability, ranging from a maximum of 0.7254 (ranked 1st) to a minimum of 0.237 (ranked 98th). This wide range of UDI rankings among high-density cities underscores a critical insight: high establishment density alone does not guarantee high urban diversity.
This finding is consistent with previous research, which has emphasized that while density can contribute to urban vibrancy and diversity by increasing the frequency of social interactions and the proximity of diverse functions [10,13,72], it is insufficient as a standalone indicator. For instance, cities with high density yet low category coverage or skewed distributions (i.e., low C′ or J′) may fail to exhibit meaningful functional diversity, even though they appear spatially concentrated. Thus, our results affirm that density must be understood as one component within a broader, multidimensional framework for evaluating urban diversity.
Theoretically, this highlights the contribution of the Urban Diversity Index (UDI), which integrates ρ′ with indicators of evenness (J′) and coverage (C′), providing a more comprehensive and balanced measure. Prior studies often relied on density as a proxy for diversity, particularly in the context of walkability, land use mix, or accessibility [10,13]. However, the variation in UDI scores among cities with identical ρ′ values illustrates the limitations of such an approach and underscores the need for composite indicators that reflect the multifaceted nature of urban diversity.
Moreover, the fact that ρ′ reaches its ceiling value (1.000) in many cities suggests potential ceiling effects, limiting its discriminatory power for inter-city comparisons in high-density environments. This observation invites further methodological refinement, including the use of continuous or non-linear scaling methods to enhance sensitivity. Nonetheless, the integration of ρ′ as a component within the UDI ensures that spatial concentration is appropriately reflected, without overemphasizing its role at the expense of other diversity dimensions.
3.2. UDI (Urban Diversity Index)
The Urban Diversity Index (UDI), introduced in this study, is a composite measure that synthesizes three key indicators of urban dining and restaurant diversity: evenness (J′), Coverage Ratio (C′), and density (ρ′). Each component captures a distinct dimension of functional urban diversity. J′ assesses the balance in establishment types, reflecting how evenly food-related categories are represented; C′ evaluates the extent to which a city encompasses the full global spectrum of restaurant categories; and ρ′ captures the spatial concentration of food establishments. Together, these three indicators, when combined through multiplicative synthesis, form a multidimensional metric—UDI—that enables a holistic and theoretically grounded assessment of urban functional diversity.
This framework addresses key limitations in existing research that tend to evaluate diversity through partial indicators such as land-use mix, entropy indices, or establishment counts [10,13,37]. By integrating balance, breadth, and spatial density, UDI overcomes the reductive tendencies of single-dimensional approaches and facilitates more nuanced inter-city comparisons across global contexts. Its conceptual alignment with theories of urban complexity and functional clustering lends theoretical significance to its design and application [72].
Figure 3 displays the global distribution of the 249 cities analyzed across 154 countries. The UDI values illustrated in the figure are further analyzed in Section 3.3. Table 3 highlights the top five cities ranked by UDI, along with their respective component indicator values, distance bands where peak UDI values occur, and characteristics of the Peak Distance Buffer Zone.
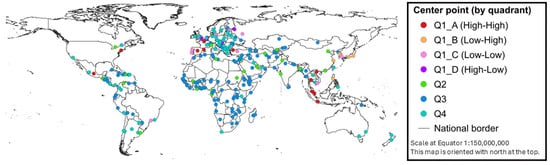
Figure 3.
Global distribution of 249 cities across 154 countries, classified by Urban Diversity Index (UDI) and peak distance.
Table 3.
Top 5 UDI rank cities and those profiles.
London (United Kingdom) ranks first globally in UDI, achieving a peak score of 0.7254 at 4600–4700 m from the city center. Although its Peak Distance Buffer Zone spans 1400 m—only 34th in length—it reflects a spatially balanced urban core with high functional diversity. This aligns with previous studies describing London as a polycentric, culturally layered metropolis, where regulatory flexibility and built form support diverse food-related land uses [13,72].
In contrast, Istanbul (Türkiye), ranked fifth with a UDI of 0.6567 at the 13,400–13,500 m band, has a much broader Peak Distance Buffer Zone of 9300 m—the second longest among all cities. This indicates a more dispersed yet sustained diversity over a wider urban radius. Although London and Istanbul have similar values for J′, C′, and ρ′, their spatial configurations differ significantly. In London, food establishments are commonly located in street-facing units with spacious commercial floorplates, supported by modern zoning and pedestrian-friendly design. Istanbul, by contrast, features organically evolved clusters such as bazaars and mixed-use corridors with densely layered vendors, often embedded in older urban fabrics shaped by historical and informal processes.
These structural distinctions, shaped by institutional, morphological, and historical trajectories, align with findings from comparative urban form studies, which suggest that the spatial manifestation of diversity is deeply influenced by local planning systems, economic informality, and street-level design [10,13,72]. The UDI framework is capable of capturing such complexities, offering a generalized yet context-sensitive approach for evaluating urban diversity.
The concept of the Peak Distance Buffer Zone—the spatial band where UDI remains above 95% of its maximum—serves as a valuable proxy for identifying concentrated zones of functional diversity. Furthermore, the Metropolitan Coverage Distance, defined as the furthest extent where UDI remains above 50% of its peak, provides insights into the breadth of diversity in urban peripheries. Together, these spatial diagnostics contribute to a richer interpretation of urban core structure, supporting theoretical debates on urban centrality and the spatial reach of functional clusters [72].
The spatial comparisons between London and Istanbul not only demonstrate the empirical sensitivity of UDI but also reinforce its theoretical relevance. By capturing both intensity and spatial extent, the Index offers a more comprehensive basis for analyzing the structure of urban diversity and its relationship to built form, planning regimes, and cultural geography.
3.3. Urban Diversity as Revealed by Peak Distance
This section focuses on characterizing cities based on their Peak Distance Buffer Zone—a metric introduced in Section 3.2 and demonstrated in the comparative analysis between London and Istanbul. Table 4 ranks the top 10 cities by the length of their Peak Distance Buffer Zones, alongside relevant urban diversity indicators. Geographically, these top-ranking cities are predominantly located in Asia—Seoul, Istanbul, Tokyo, Manila, Jakarta, Bangkok, Singapore, Kuala Lumpur, and Taipei—with only one exception from North America: New York–Newark. Among them, Seoul (KR) emerges as the city with the longest Peak Distance Buffer Zone. In contrast to Figure 4 and Figure 5, which represent London and Istanbul, respectively, Figure 6 reveals a strikingly extended Peak Distance Buffer Zone of 12.2 km in Seoul. As defined earlier, this zone refers to the distance range over which the UDI remains within 95% of its maximum value for a given city.
Table 4.
Top 10 Peak Distance Buffer Zone rank cities and profiles.
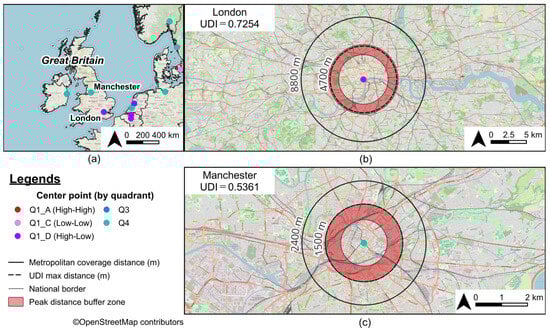
Figure 4.
National- and urban-scale maps of Great Britain with a focus on London and Manchester: (a) National-scale map of Great Britain and surrounding cities; (b) UDI values and extracted urban area in London; (c) UDI values and extracted urban area in Manchester.
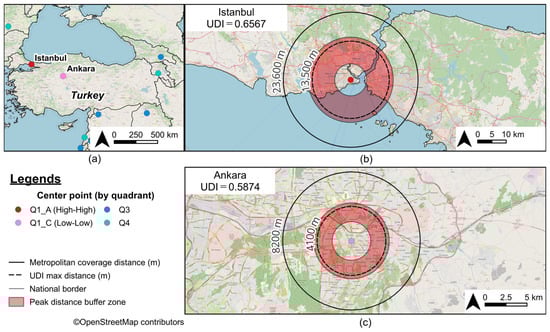
Figure 5.
National- and urban-scale maps of Türkiye with a focus on Istanbul and Ankara: (a) National-scale map of Republic of Türkiye; (b) UDI values and extracted urban area in Istanbul; (c) UDI values and extracted urban area in Ankara.
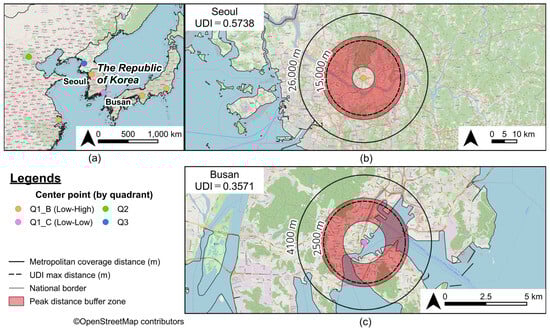
Figure 6.
National- and urban-scale maps of The Republic of Korea with a focus on Seoul and Busan: (a) National-scale map of The Republic of Korea; (b) UDI values and extracted urban area in Seoul; (c) UDI values and extracted urban area in Busan.
To further elucidate the variation across cities, Figure 4, Figure 5 and Figure 6 collectively illustrate the urban diversity profiles of London (ranked 1st), Istanbul (5th), and Seoul (35th). Table 5 summarizes their maximum UDI values, the three component indicators (J′, C′, and ρ′), and the corresponding 95% UDI thresholds. Notably, London’s 95% UDI threshold surpasses the maximum UDI of Paris (FR), ranked third at 0.6823. This finding aligns with previous studies portraying London as a polycentric and socioculturally layered metropolis, where spatial regulation and morphological diversity foster high functional heterogeneity. This diversity is also reflected in the built environment, where pubs and restaurants are commonly located on street-facing ground floors, contributing to walkability and visual accessibility (Figure 7). Conversely, Seoul—ranked 30th overall—achieves a UDI peak of 0.5738, with its 95% threshold extending over 12.2 km. While this absolute value does not exceed that of higher-ranked cities, the spatial extent of high-diversity areas in Seoul suggests that it sustains comparable levels of functional diversity to cities like Shanghai (ranked 39th, UDI max = 0.5451) over a significantly broader urban area.
Table 5.
Examples of UDI max and 95% thresholds of UDI max.
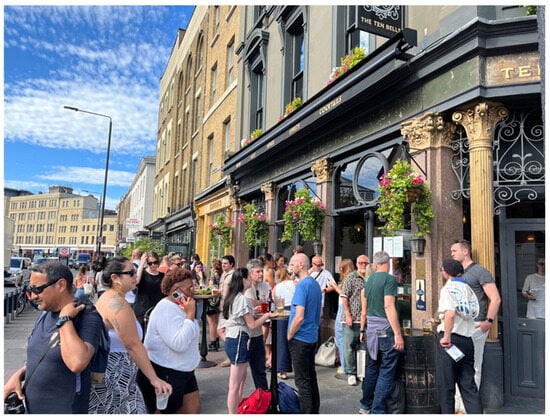
Figure 7.
A case observed in London, where food and beverage establishments such as pubs and restaurants are situated on the street-facing ground floors of buildings (Photographed by the authors, June 2025).
To examine the interplay between urban diversity and spatial extent, Figure 8 presents a standardized scatterplot of UDI and Peak Distance Buffer Zone lengths. Both metrics are normalized to a mean of 0 and standard deviation of 1; UDI is plotted on the x-axis and Peak Distance Buffer Zone on the y-axis. For interpretive clarity, the plot is divided into four quadrants, color-coded by the combination of UDI and buffer values. Figure 9 zooms into Quadrant 1, further dividing cities into sub-quadrants based on whether each metric is above or below its median. This nuanced classification helps identify cities that exhibit both high diversity and broad spatial coverage.
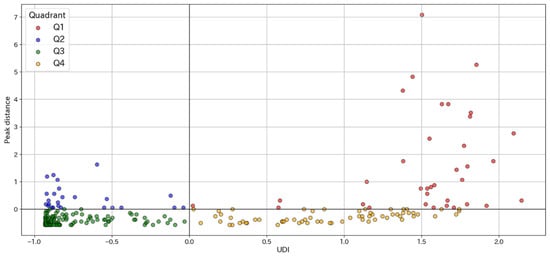
Figure 8.
Scatter plot of Urban Diversity Index (UDI) and peak distance for 249 cities (N = 249). Q1: N = 35, Q2: N = 25, Q3: N = 124, Q4: N = 65.
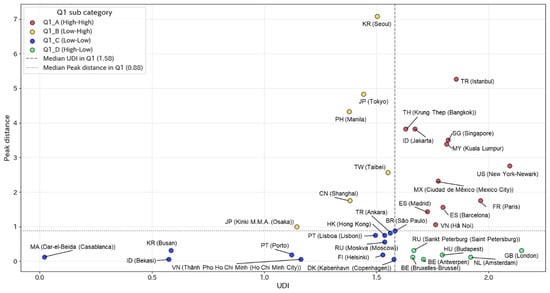
Figure 9.
Enlarged view of the first quadrant of the UDI–peak distance scatter plot for 35 cities (extracted from the full dataset in Figure 8). The number of cities in each sub-quadrant is as follows: Q1_A (High–High) = 11, Q1_B (Low–High) = 6, Q1_C (Low–Low) = 12, Q1_D (High–Low) = 6.
Within the scatterplot in Figure 8, standardized UDI values range from −1σ to +2σ, whereas the Peak Distance Buffer Zone shows a wider spread from −1σ to +7σ. Notably, cities in Q2 (N = 25) and Q3 (N = 124), which fall below the UDI mean, are clustered around −1σ, indicating a strong left-skew in the UDI distribution. Indeed, about half of the 249 cities analyzed (N = 127) record UDI scores more than 0.5σ below the mean (threshold = 0.10576; see Appendix A, Appendix B, Appendix C and Appendix D for UDI statistics). This suggests that a substantial portion of global cities exhibit relatively low functional diversity, a finding that reinforces concerns raised in the previous literature about uneven service accessibility across urban spaces.
Vertically, the Peak Distance Buffer Zone values show similar concentration below the mean: 124 cities fall into Q3 and 65 into Q4, representing approximately 76% of the sample. Only 60 cities exceed the average, but, among them, some display exceptionally large Peak Distance Buffer Zones (up to +7σ), revealing a considerable dispersion. These results underscore the UDI framework’s ability to distinguish between cities with compact, high-diversity cores and those with more dispersed, yet sustained, urban diversity.
From a global diversity perspective, 100 cities out of the 249 (approximately 40%) are classified as “diverse” under the UDI framework (UDI ≥ 0). These include 35 cities in Q1 (high UDI, high buffer zone) and 65 in Q4 (high UDI, low buffer zone). Within this set, several cities exhibit UDI scores that exceed +2σ, signifying exceptional levels of urban diversity. These findings offer empirical support for previous studies that advocate for multidimensional indicators when assessing functional diversity and inclusivity in cities.
Delving into Figure 9, we observe all five top-UDI cities are located in Quadrant 1. London (UK) and Amsterdam (NL) are situated in Q1_D (high UDI, low Peak Distance), indicative of concentrated high-diversity cores. In contrast, New York (US), Paris (FR), and Istanbul (TR) appear in Q1_A (high UDI, high Peak Distance), suggesting more spatially extended diversity. Seoul (KR), Tokyo (JP), and Manila (PH) fall into Q1_B (low UDI, high Peak Distance), representing cities with broad but lower-intensity diversity zones. Finally, cities like Casablanca (MA), Busan (KR), and Ho Chi Minh City (VN) in Q1_C (low UDI, low Peak Distance) exhibit relatively localized and limited diversity. These spatial groupings suggest that Asian cities, in particular, tend to exhibit greater heterogeneity in the extent of diversity rather than intensity—a pattern consistent with earlier cross-national studies of urban form and land use distribution.
Finally, Figure 10 explores whether urban population size—a proxy often associated with diversity—correlates with UDI values. Contrary to assumptions in earlier studies, our results reveal no consistent relationship. Cities with populations exceeding 300,000 are distributed across the entire UDI spectrum, demonstrating that sheer population size is insufficient to explain urban functional diversity. Instead, institutional, historical, and morphological factors—many of which are captured in our UDI framework—appear to be more determinative. This insight challenges traditional demographic assumptions and underscores the necessity of spatial-functional indicators in comparative urban research.
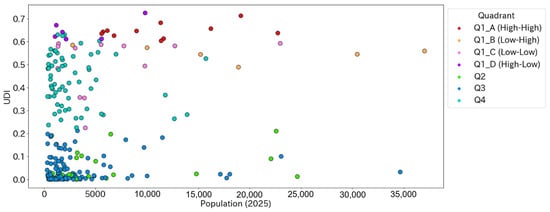
Figure 10.
Scatter plot of city population and UDI (N = 249).
4. Discussion
4.1. Significance of the UDI
The UDI proposed in this study represents a novel attempt to evaluate urban functional diversity on a global and scalable scale using POI data related to dining establishments. As a quantitative indicator of urban functional diversity, the UDI offers several critical advantages and innovations that are absent in existing evaluation frameworks. It is expected to contribute not only to theoretical advancements in urban studies but also to provide valuable practical insights for urban policy and regional planning. This section discusses the significance, uniqueness, and advantages of the UDI based on the results presented in Section 3.
First, the most distinctive feature of the UDI is its versatility and scalability, allowing for consistent and repeatable application across cities of varying geographic contexts and sizes. As discussed in Section 2 and Section 3, the UDI leverages the globally standardized Foursquare Places OS dataset, enabling real-time and sustained urban evaluation even in cities in developing countries. Unlike conventional urban assessment methods—which typically rely on labor-intensive and costly data collection processes—such as land use surveys, statistical censuses, or resident questionnaires—the UDI demonstrates the feasibility of implementing continuous urban monitoring through open data infrastructures. This is particularly advantageous for regions with limited financial and human resources.
Second, the UDI is one of the few indicators capable of visualizing qualitative aspects of cities, such as the quality of the living environment and opportunities for social interaction. Traditional urban metrics, such as population size, GDP, or population density, fail to capture intangible dimensions like urban appeal, cultural diversity, and openness. Our analysis in Section 3 shows that the diversity of dining establishments—both in terms of type and spatial distribution—serves as an indirect yet effective proxy for such qualitative characteristics. Dining venues function not only as everyday interaction points for both residents and non-residents but also as cultural and social symbols of inclusivity and vibrancy. The UDI thus provides a valuable lens through which to interpret the social fabric of cities.
Third, the UDI excels in terms of standardization and methodological reproducibility. Built on a unified category schema within the POI platform, the UDI allows for uniform data collection and analysis across cities worldwide, ensuring consistency and comparability. This methodological rigor facilitates cross-city benchmarking and longitudinal tracking independent of the research agency or data collection period—an invaluable asset for both academic research and professional practice.
Moreover, the UDI offers strong cost-effectiveness. Unlike conventional approaches that depend on fieldwork or large-scale surveys, the UDI relies on voluntarily maintained POI data submitted by users and businesses. This significantly reduces both financial and labor burdens and enhances sustainability, enabling its adoption regardless of city size or resource availability.
Finally, the UDI is expected to serve as a practical decision-support tool in urban policy and strategic planning. As shown in Section 3, spatial analysis of UDI enables the identification of areas rich in diversity versus those more homogeneous, informing targeted interventions to foster urban vibrancy. The UDI is also compatible with a range of policy domains, including cultural policy, tourism development, and socially inclusive urban design, making it a promising tool for interdisciplinary planning.
In sum, the UDI proposed in this study addresses many limitations inherent in conventional urban evaluation methods and represents an innovative framework for quantitatively capturing qualitative aspects of urban structure. The UDI holds promise for advancing urban theory while simultaneously offering a practical means for global urban comparison and policy implementation, with broad applicability across diverse planning contexts.
One limitation of the proposed method is the underlying assumption that the diversity of restaurant-related POIs serves as a valid proxy for broader dimensions of urban social diversity and inclusiveness. While, as discussed earlier, numerous existing studies suggest a link between culinary diversity and urban vibrancy, this assumption has not been explicitly tested in the present study against external benchmarks such as migration statistics or established indicators of social diversity. Future research should empirically assess the correlation between the proposed UDI and such external measures in order to further enhance the conceptual validity and interpretability of the Index.
4.2. Practical Applicability of the UDI in Society
The UDI proposed in this study serves as a novel indicator for evaluating the functional diversity of cities on a global scale and facilitating comparative analyses across cities. Although the current stage of this research does not yet enable fine-grained assessments of intra-city diversity or spatial distribution patterns within individual cities, the UDI holds strong potential for practical and strategic use in global-scale urban comparisons. This section outlines the real-world applicability of the UDI from both policy and planning perspectives.
First, the UDI can serve as a key benchmark in international city branding strategies and urban marketing policies. By objectively evaluating the diversity of dining establishments, the UDI captures qualitative dimensions of cities—such as vibrancy, attractiveness, and social openness—that are often difficult to measure directly. In the context of tourism strategies, a high UDI suggests a city possesses strong cultural and social appeal that is likely to attract external visitors and tourists. Urban policymakers can therefore use the UDI to quantitatively assess their city’s positioning in global competition and formulate targeted strategies to enhance competitiveness and promote international visibility.
Second, cross-city comparisons based on the UDI provide a valuable basis for identifying and sharing best practices in urban policy and regional planning. By examining cities that score highly on the UDI, it is possible to uncover what kinds of urban policies or planning interventions have contributed to greater diversity. This offers meaningful insights for policymakers in other cities aiming to foster diversity. For example, officials can use the UDI to explore successful case studies in zoning deregulation, urban design, or food and retail planning and adapt these strategies to fit their own local contexts.
Third, the UDI can also be utilized as a concrete indicator in formulating international investment promotion strategies and commercial development policies. Urban diversity—especially in the dining sector—reflects a city’s capacity to accommodate people from diverse cultural and social backgrounds. Cities with high UDI values are likely to be perceived as attractive markets by investors and global enterprises. Businesses and developers can refer to the UDI as a comparative index when making decisions on international expansion or site selection.
Fourth, the continuous monitoring and assessment of the UDI allow for tracking temporal changes in urban diversity. This makes the UDI a practical tool for evaluating the long-term impact of urban policies and investment initiatives. Longitudinal analysis of UDI trends provides objective, quantitative feedback on whether public interventions or development projects have enhanced a city’s diversity and overall livability—valuable information for urban managers and policy stakeholders.
Finally, the UDI has the potential to become a useful indicator for international organizations and development agencies promoting sustainable urban development and regional revitalization. Particularly in global development programs aimed at fostering social inclusion and urban vibrancy through diversity, the UDI could serve as a shared metric to assess the characteristics and latent challenges of participating cities. It may also support initiatives to promote inter-city collaboration and policy dialogue.
However, it is essential to recognize that the policy relevance and operationalization of urban diversity are not uniform, but are highly contingent on factors such as city scale, developmental stage, and regional context. For instance, in large metropolitan areas, diversity is often regarded as a driver of economic vitality and innovation, contributing to global competitiveness. In contrast, in smaller cities, ensuring diversity can be more closely tied to community resilience and residents’ quality of life. In developed countries, challenges tend to center on maintaining or revitalizing diversity within already mature urban structures, whereas in many developing countries, rapid urbanization and social fragmentation require tools to identify and address uneven or insufficient diversity. In such contexts, the UDI may serve as a useful mechanism for visualizing spatial disparities and guiding inclusive urban development. Cultural and spatial variations across regions also shape how the UDI should be interpreted and applied. For example, in high-density, transit-oriented Asian cities, concentrated diversity may be associated with urban appeal and economic productivity, while in more decentralized urban forms common in Western countries, the equitable distribution of diversity and accessibility are often more relevant concerns. In African cities, informal settlements and informal economies represent context-specific forms of diversity that must be carefully considered when applying the UDI. Therefore, the effective use of the UDI as a policy tool requires a flexible and context-sensitive approach that accounts for variations in urban scale, development stage, and regional characteristics. Future research should focus on developing context-aware methods of application and evaluation frameworks for the UDI.
In summary, while the current version of the UDI is not yet equipped for fine-grained intra-urban spatial analysis, it already offers significant practical value as a global urban benchmarking tool. Its applications span a wide range of domains, including city branding, urban planning, international investment promotion, and sustainable development assessment. Moreover, the UDI provides a robust platform for monitoring temporal changes in urban diversity and evaluating the long-term impact of public policy interventions. Importantly, however, the policy relevance and applicability of the UDI are not universal but must be carefully adapted to the specific characteristics of each urban context—such as city size, development stage, and regional socio-spatial structure. Future research should prioritize the development of context-sensitive application strategies and evaluation frameworks that enhance the operational utility and interpretability of the UDI across diverse urban settings. In this way, the UDI holds strong potential to serve not only as a comparative metric, but also as a strategic tool for supporting inclusive and sustainable urban development on a global scale.
4.3. Role and Potential of the UDI in Assessing Urban Sustainability
Sustainable urban development has become a central concern in contemporary urban planning and regional policy. In recent years, increasing attention has been given not only to quantitative dimensions, such as economic growth and population concentration, but also to qualitative elements, including social inclusion, quality of life (QoL), and cultural vibrancy [96,97]. However, the assessment of such qualitative aspects has often relied on subjective or case-specific approaches, with limited availability of standardized, quantitative indicators. Within this context, the UDI proposed in this study represents a promising metric for capturing the functional diversity of cities—a critical qualitative trait—through a globally scalable and data-driven methodology, thereby offering new potential for evaluating urban sustainability.
The UDI utilizes POI data on food-related establishments to provide an indirect yet informative measure of cultural and social diversity within cities. Diversity is a key dimension of urban sustainability, as it is associated with enhanced community resilience, long-term economic viability, and the promotion of social inclusion. As outlined in Section 1, cities that host a wide variety of services and facilities are more likely to foster interactions among people from different cultural and socioeconomic backgrounds, ultimately contributing to stronger social integration and more vibrant communities. The UDI thus offers a quantitative basis for evaluating social resilience and inclusiveness in urban settings, serving as a critical tool for policymakers and urban planners.
Moreover, the global applicability of the UDI positions it as a unique instrument for comparing urban sustainability across cities worldwide. Conventional sustainability indicators have largely focused on physical and quantitative characteristics such as population size, economic output, or infrastructure provision—metrics that often fail to capture the cultural or qualitative dimensions of urban life. By contrast, the UDI enables consistent evaluation of qualitative aspects across diverse urban contexts, offering a novel international benchmark for urban sustainability. For instance, monitoring UDI values over time and across regions can help establish new qualitative standards within sustainability assessment frameworks.
The UDI’s structural neutrality—its independence from specific institutional or cultural contexts—also enhances its utility for longitudinal tracking and international comparisons. This flexibility makes it particularly well-suited for addressing key global development issues such as reducing spatial inequalities and promoting inclusive urbanization. These goals align with the United Nations Sustainable Development Goals (SDGs), particularly Goal 11: “Make cities and human settlements inclusive, safe, resilient, and sustainable.” In this way, the UDI contributes to the broader information infrastructure required to support global efforts toward sustainable urbanization.
Integrating the UDI into existing sustainability assessment frameworks may also yield new insights into the interrelationships among economic, social, and environmental dimensions of sustainability. If cities with higher diversity—as measured by the UDI—are shown to demonstrate not only greater cultural vibrancy but also stronger economic and social outcomes, this would provide empirical support for the role of diversity as a foundational element of sustainable development. Consequently, the promotion of diversity could be positioned as a core policy objective within urban sustainability strategies.
Looking forward, a key area for future development involves extending the UDI framework to enable more detailed intra-urban analyses. While the current study focuses on inter-city comparisons, the ability to assess spatial patterns of diversity within cities would offer even more actionable insights for targeted policy interventions and urban design. As methodological advances continue, the UDI could evolve into a robust planning tool for neighborhood-scale assessments.
In sum, the UDI provides a novel means of quantifying urban qualities that have traditionally been difficult to measure. By making such attributes visible and comparable, it adds both conceptual and practical value to the field of urban sustainability assessment. The UDI is thus well-positioned to play a significant role in shaping future research, planning, and policy frameworks aimed at achieving more sustainable and inclusive cities.
The findings of this study present a new quantitative framework: the UDI for evaluating urban diversity on a global scale. However, the current analysis does not explicitly link UDI to intra-urban spatial inequities or socioeconomic disparities, such as those between affluent and disadvantaged neighborhoods or between urban cores and peripheral areas. The UDI serves as a comprehensive indicator for assessing the qualitative diversity of urban environments. With further refinement, this metric holds promise for integration with socioeconomic variables—such as income levels and population density—to reveal potential diversity gaps and spatial inequities. In particular, prior studies [98,99] suggesting that UDI values tend to be higher in city centers and that restaurant category coverage is generally broader in high-income areas lend support to the possibility of such disparities. The UDI framework proposed in this study thus has the potential to contribute not only to the evaluation of urban sustainability and inclusiveness, as emphasized in SDG 11, but also to the assessment of spatial equity in future research. Urban policymakers may use the UDI to identify areas lacking in functional diversity and to prioritize interventions such as strategic facility placement and neighborhood revitalization.
5. Conclusions
5.1. Summary of Key Findings and Contributions
This study proposed the Urban Diversity Index (UDI) as a novel metric to quantitatively and globally assess the functional diversity of cities. The UDI leverages global POI (point-of-interest) data related to food and beverage establishments to visualize the qualitative characteristics of cities, such as their social and cultural diversity. Unlike conventional quantitative indicators, such as population size, economic strength, or infrastructure development, the UDI captures aspects of urban vibrancy and appeal that are more closely aligned with residents’ lived experiences.
Using data from 249 cities across 154 countries, this study calculated the UDI to conduct an international comparative analysis of urban diversity. The findings revealed three key insights:
- (1)
- There are clear regional differences in the categorical composition and spatial distribution of food-related facilities across the globe.
- (2)
- Cities with high UDI values are primarily concentrated in Europe, North America, and East and Southeast Asia, with results suggesting that high urban diversity is closely associated with the structural characteristics of each city.
- (3)
- Analyzing the spatial decay of UDI values from the city center enabled measurement of the geographical extent of urban diversity.
Furthermore, the study introduced two novel metrics based on UDI—the “Peak Distance” and the “Metropolitan Coverage Distance”—to identify the spatial peaks of diversity and delineate the extent of their influence. These indicators offer an effective means of understanding the structural characteristics of urban core areas and their spillover effects on surrounding regions, thereby providing a new analytical perspective for urban morphology.
In summary, the UDI presents a robust framework for evaluating the qualitative diversity of cities from multiple dimensions. It holds significant practical and theoretical potential in the fields of urban studies, city planning, and regional policy. Particularly noteworthy is its applicability as an internationally comparable and continuously updatable indicator, which offers valuable contributions to contemporary urban challenges such as sustainability and inclusivity.
5.2. Future Directions
This study proposed the UDI as a new metric for quantifying the functional diversity of cities using food-related POI data and demonstrated its utility and applicability through a comparative analysis of cities across the globe. However, the current formulation of the UDI is primarily designed for inter-city comparisons, and several challenges remain in assessing intra-urban spatial distribution and local characteristics of diversity.
First, the UDI proposed in this study is calculated based on a radial buffer structure centered on the urban core, which limits its capacity to capture linear or corridor-like commercial concentrations along railways or arterial roads, as well as locally distinctive areas such as university districts, multicultural neighborhoods, or informal settlements. Future research should aim to extend the UDI framework by subdividing cities into finer spatial units (e.g., grids or meshes), thereby enabling a more detailed visualization of neighborhood-level diversity. This would allow policymakers to identify high-diversity or homogeneous zones within cities and develop more effective and targeted regional policies.
Second, the current UDI evaluation uses a concentric buffer approach centered on a fixed urban centroid, which may not fully capture the complexity of polycentric or irregularly structured cities. Indeed, many cities exhibit multiple activity centers or corridors along transportation infrastructures, such as railways and arterial roads [100,101], which can significantly affect urban diversity distribution. Although beyond the scope of this current paper, future studies should explicitly test how alternative definitions of urban centers or different spatial delineation methods (e.g., polycentric buffers, grid-based spatial units, or accessibility-based methods) influence the calculated UDI values. Such sensitivity analyses would further validate the robustness and applicability of the UDI across diverse urban morphologies and spatial configurations.
Third, refinement of the Urban Diversity Index (UDI) itself constitutes an important direction for future research. The current formulation of the UDI relies solely on the diversity of food-related POIs, and empirical validation regarding whether this single category sufficiently captures the broader spectrum of urban functional diversity has not yet been conducted. One major reason for this is the limited availability of internationally standardized and comparable POI or statistical data for other functional categories, such as healthcare, education, culture, entertainment, and retail. This lack of comprehensive global data hinders cross-national and large-scale empirical assessments. Given these limitations, future research should aim to evaluate the extent to which food-related POI diversity serves as a valid proxy for overall urban functional diversity, by comparing it with the diversity patterns of other POI categories. Such comparative analysis would not only strengthen the conceptual validity of the UDI but also contribute to the development of a more comprehensive and multidimensional indicator that integrates multiple functional domains. Ultimately, this expanded approach is expected to enhance the robustness and applicability of the UDI as a practical tool for monitoring progress toward sustainable urban development.
Additionally, the current formulation of the UDI is based on a multiplicative aggregation of three normalized components—J′ (evenness), C′ (coverage), and ρ′ (density)—reflecting the assumption that a balanced contribution across all dimensions is equally essential for capturing urban diversity. This approach is designed so that a low score in any single dimension significantly affects the overall UDI, thereby emphasizing the importance of multidimensional balance. However, this also entails a potential drawback: cities that perform well in certain dimensions may have their overall diversity underestimated if one component is extremely low. To address this issue and further enhance the robustness and interpretability of the UDI, it would be beneficial to explore alternative aggregation methods, such as geometric means or weighted additive models. Sensitivity analyses using these alternative formulations could help clarify the relative contribution of each component and support the development of a more stable and reliable indicator that better captures the complexity of diverse urban structures.
In addition to these structural aspects of the UDI, spatial representation in two dimensions also introduces limitations that warrant further attention. One limitation of the current methodology lies in its reliance on two-dimensional spatial analysis using concentric buffers. This approach inherently assumes that POIs are distributed on a flat horizontal plane and does not account for vertical spatial characteristics such as building height, topography, or functional stratification across multiple floors. Consequently, cities with dense clusters of high-rise buildings, steep terrain, or vertically integrated infrastructure—such as subway-connected commercial complexes—may exhibit distortions in the calculated horizontal POI densities. While this simplification was necessary to facilitate globally standardized comparisons using openly available POI data, it omits key three-dimensional aspects of urban form. In principle, integrating three-dimensional data—such as digital elevation models (DEMs), building height information, or floor-level POI classification—could significantly improve the accuracy and nuance of urban diversity assessments. However, openly accessible and globally consistent building height datasets are currently lacking. Among the existing open building footprint data, only a very limited subset contains reliable height attributes. To address this gap, we are currently developing a technique to estimate building heights from publicly available geospatial data sources [55]. We believe that integrating such estimation techniques into the UDI framework presents a promising avenue for future research. This would enable more realistic evaluations of functional diversity in vertically complex urban environments and could contribute to a more comprehensive understanding of spatial equity and service accessibility in high-density cities.
Moreover, an expanded UDI could contribute to the quantitative visualization of “diversity imbalances” or “inequities in service accessibility” within cities. This would be particularly valuable for the spatial assessment of inclusivity in urban development, aligning with Goal 11 of the United Nations Sustainable Development Goals (SDGs), which aims to “make cities and human settlements inclusive, safe, resilient, and sustainable.”
Furthermore, another important avenue for future exploration involves examining the relationship between urban diversity and underlying socioeconomic disparities. While the present study demonstrates the applicability of the UDI as a global indicator of urban functional diversity, it does not include a direct analysis linking UDI values to intra-urban spatial inequities or socioeconomic contrasts—such as those between affluent and disadvantaged neighborhoods or between urban cores and peripheral areas. Nevertheless, the UDI provides a scalable and transferable framework that can be further refined to explore such patterns. Prior empirical research has suggested that urban centers tend to exhibit higher levels of functional diversity, while peripheral or low-income areas often have more limited service options. These insights imply the potential for “diversity gaps” within cities. The UDI thus holds promise not only for global benchmarking but also as a foundation for detecting spatial disparities in access to urban functions. Urban policymakers could leverage the UDI to identify underserved areas and prioritize interventions aimed at promoting functional inclusivity and equitable service provision—objectives that align with the broader goals of SDG 11.
Taken together, these future directions suggest that the UDI has the potential to evolve from a tool for macro-level urban comparison into a highly versatile instrument for identifying micro-level issues and supporting evidence-based policymaking. The UDI introduced in this study is an innovative tool for visualizing functional and cultural diversity—dimensions that have often been overlooked by conventional quantitative indicators in urban sustainability assessments. Its potential applications range from global benchmarking of cities to the identification of intra-urban spatial inequalities, ultimately contributing to the realization of inclusive and sustainable cities envisioned by the SDGs. By placing diversity at the center of the evaluation framework, the UDI can serve as a powerful compass for guiding cities toward a more resilient and sustainable future.
Author Contributions
Conceptualization, writing—original draft preparation, and writing—review and editing, Y.A., C.M.A. and K.M.; methodology and investigation, Y.A., C.M.A., K.M. and T.S.; formal analysis, data curation, and visualization, K.M. and T.S.; resources, supervision, and project administration, Y.A.; funding acquisition, Y.A. and C.M.A. All authors have read and agreed to the published version of the manuscript.
Funding
This work was supported by JSPS KAKENHI Grant Numbers JP25K15557 and JP24K00243.
Institutional Review Board Statement
Not applicable.
Informed Consent Statement
Not applicable.
Data Availability Statement
The datasets presented in this article are not readily available because the data are part of an ongoing study. Requests to access the datasets should be directed to the corresponding author.
Acknowledgments
We acknowledge the use of Open-Source POI Data provided by Foursquare and data from OpenStreetMap in this research.
Conflicts of Interest
The author declares no conflicts of interest. The funders had no role in the design of the study; in the collection, analyses, or interpretation of data; in the writing of the manuscript; or in the decision to publish the results. Kotaro Mizutani is affiliated with Urban Spatial Research Institute, Inc. However, no funding was received from this corporation for the current work, and thus, it does not constitute a conflict of interest.
Abbreviations
The following abbreviations are used in this manuscript:
| Fs POI dataset | The POI dataset was created by reorganizing the Foursquare Places OS data into categories in Table A1 in Appendix A for this study. |
| OSM | OpenStreetMap |
| POI | Point-of-interest |
| UDI | Urban Diversity Index |
Appendix A
Appendix A provides a complete list of the restructured categories and their classification criteria.
Table A1.
Complete list of the restructured categories and classification criteria.
Table A1.
Complete list of the restructured categories and classification criteria.
| No. | The Restructured Categories | No. | The Restructured Categories | No. | The Restructured Categories |
|---|---|---|---|---|---|
| 1 | Snack Place | 33 | Seafood Restaurant | 65 | Food Truck |
| 2 | Restaurant | 34 | Beer Garden | 66 | Irish Pub |
| 3 | Diner | 35 | Distillery | 67 | Speakeasy |
| 4 | Spanish Restaurant | 36 | Italian Restaurant | 68 | Hookah Bar |
| 5 | Sports Bar | 37 | Lounge | 69 | Hot Dog Joint |
| 6 | Burger Joint | 38 | Steakhouse | 70 | Empanada Restaurant |
| 7 | Bar | 39 | Japanese Restaurant | 71 | Modern European Restaurant |
| 8 | Chinese Restaurant | 40 | Breakfast Spot | 72 | Belgian Restaurant |
| 9 | Gastropub | 41 | Mexican Restaurant | 73 | Karaoke Bar |
| 10 | Cafeteria | 42 | Creperie | 74 | Thai Restaurant |
| 11 | Café | 43 | Wings Joint | 75 | Rooftop Bar |
| 12 | Pizzeria | 44 | Asian Restaurant | 76 | Indian Restaurant |
| 13 | Piano Bar | 45 | Brewery | 77 | Pastry Shop |
| 14 | South American Restaurant | 46 | French Restaurant | 78 | Latin American Restaurant |
| 15 | Cocktail Bar | 47 | Molecular Gastronomy Restaurant | 79 | Swiss Restaurant |
| 16 | Hotel Bar | 48 | Filipino Restaurant | 80 | Frozen Yogurt Shop |
| 17 | Gay Bar | 49 | Eastern European Restaurant | 81 | Apres Ski Bar |
| 18 | Coffee Shop | 50 | Buffet | 82 | Moroccan Restaurant |
| 19 | Mediterranean Restaurant | 51 | Dive Bar | 83 | Bagel Shop |
| 20 | Fast Food Restaurant | 52 | Vegan and Vegetarian Restaurant | 84 | Ukrainian Restaurant |
| 21 | Pub | 53 | Ice Cream Parlor | 85 | Cafe, Coffee, and Tea House |
| 22 | Beer Bar | 54 | Bubble Tea Shop | 86 | Fondue Restaurant |
| 23 | Comfort Food Restaurant | 55 | Falafel Restaurant | 87 | Noodle Restaurant |
| 24 | Winery | 56 | Fried Chicken Joint | 88 | Kebab Restaurant |
| 25 | Bakery | 57 | Sandwich Spot | 89 | Gluten-Free Restaurant |
| 26 | Dutch Restaurant | 58 | Cupcake Shop | 90 | Arepa Restaurant |
| 27 | American Restaurant | 59 | German Restaurant | 91 | Korean Restaurant |
| 28 | Bistro | 60 | Theme Restaurant | 92 | Food Court |
| 29 | Wine Bar | 61 | Turkish Restaurant | 93 | African Restaurant |
| 30 | Portuguese Restaurant | 62 | Dessert Shop | 94 | Vineyard |
| 31 | BBQ Joint | 63 | Tea Room | 95 | Whisky Bar |
| 32 | Deli | 64 | Russian Restaurant | 96 | Middle Eastern Restaurant |
| No. | The Restructured Categories | No. | The Restructured Categories | No. | The Restructured Categories |
| 97 | Lebanese Restaurant | 123 | Egyptian Restaurant | 149 | Waffle Shop |
| 98 | Pakistani Restaurant | 124 | Hawaiian Restaurant | 150 | Champagne Bar |
| 99 | Shawarma Restaurant | 125 | Caucasian Restaurant | 151 | Austrian Restaurant |
| 100 | Afghan Restaurant | 126 | Indian Chinese Restaurant | 152 | Burmese Restaurant |
| 101 | Juice Bar | 127 | Sri Lankan Restaurant | 153 | Singaporean Restaurant |
| 102 | Greek Restaurant | 128 | Dumpling Restaurant | 154 | Mac and Cheese Joint |
| 103 | English Restaurant | 129 | Bosnian Restaurant | 155 | Jewish Restaurant |
| 104 | Persian Restaurant | 130 | Indonesian Restaurant | 156 | Slovak Restaurant |
| 105 | Caribbean Restaurant | 131 | Scandinavian Restaurant | 157 | Polish Restaurant |
| 106 | Australian Restaurant | 132 | Ethiopian Restaurant | 158 | Poutine Restaurant |
| 107 | Vietnamese Restaurant | 133 | Mongolian Restaurant | 159 | Dining and Drinking |
| 108 | Beach Bar | 134 | Night Market | 160 | Scottish Restaurant |
| 109 | Tiki Bar | 135 | Pie Shop | 161 | Cambodian Restaurant |
| 110 | Yemeni Restaurant | 136 | Pet Café | 162 | Cidery |
| 111 | Donut Shop | 137 | Hungarian Restaurant | 163 | Czech Restaurant |
| 112 | New American Restaurant | 138 | Soup Spot | 164 | Meadery |
| 113 | Smoothie Shop | 139 | Southern Food Restaurant | 165 | Israeli Restaurant |
| 114 | Ice Bar | 140 | Food Stand | 166 | Friterie |
| 115 | Fish and Chips Shop | 141 | Himalayan Restaurant | 167 | Bulgarian Restaurant |
| 116 | Malay Restaurant | 142 | Bangladeshi Restaurant | 168 | Mauritian Restaurant |
| 117 | Syrian Restaurant | 143 | Romanian Restaurant | 169 | Satay Restaurant |
| 118 | Salad Restaurant | 144 | Armenian Restaurant | 170 | Tatar Restaurant |
| 119 | Hotpot Restaurant | 145 | Sake Bar | 171 | Salvadoran Restaurant |
| 120 | Cajun and Creole Restaurant | 146 | Gelato Shop | 172 | Belarusian Restaurant |
| 121 | Iraqi Restaurant | 147 | Kurdish Restaurant | 173 | Honduran Restaurant |
| 122 | Halal Restaurant | 148 | Tibetan Restaurant |
Appendix B
Appendix B presents the complete set of indicator values for the 249 cities analyzed across 154 countries. The indicators comprise the UDI max value and its sub-indicators (, , and ), Metropolitan Coverage Distance, and Peak Distance Buffer Zone.
Table A2.
Complete indicator values for all 249 surveyed cities *.
Table A2.
Complete indicator values for all 249 surveyed cities *.
| UDI Rank | Peak Distance Rank | City | Country /Region | J′α | C′α | ρ′α | UDI Max | UDI Max Distance (m) | Metropolitan Coverage Distance (m) | Peak Distance Buffer Zone (m) |
|---|---|---|---|---|---|---|---|---|---|---|
| 1 | 34 | London | GB | 0.7746 | 0.9364 | 1.0000 | 0.7254 | 4700 | 8800 | 1400 |
| 2 | 9 | New York–Newark | US | 0.7709 | 0.9249 | 1.0000 | 0.7130 | 7200 | 12,500 | 5300 |
| 3 | 12 | Paris | FR | 0.7424 | 0.9191 | 1.0000 | 0.6823 | 4300 | 9700 | 3700 |
| 4 | 44 | Amsterdam | NL | 0.7961 | 0.8439 | 1.0000 | 0.6719 | 2800 | 4800 | 1100 |
| 5 | 2 | Istanbul | TR | 0.7013 | 0.9364 | 1.0000 | 0.6567 | 13,500 | 23,600 | 9300 |
| 6 | 7 | Singapore | SG | 0.7475 | 0.8671 | 1.0000 | 0.6481 | 7300 | 16,200 | 6500 |
| 7 | 8 | Kuala Lumpur | MY | 0.7510 | 0.8613 | 1.0000 | 0.6468 | 5100 | 16,700 | 6300 |
| 8 | 15 | Barcelona | ES | 0.7412 | 0.8671 | 1.0000 | 0.6427 | 5400 | 8900 | 3400 |
| 9 | 39 | Budapest | HU | 0.7713 | 0.8324 | 1.0000 | 0.6420 | 2900 | 5200 | 1200 |
| 10 | 11 | Ciudad de Mexico (Mexico City) | MX | 0.6852 | 0.9306 | 1.0000 | 0.6376 | 9000 | 16,800 | 4600 |
| 11 | 19 | Hanoi | VN | 0.6658 | 0.9538 | 1.0000 | 0.6350 | 4100 | 6800 | 2600 |
| 12 | 61 | Praha (Prague) | CZ | 0.7680 | 0.8208 | 1.0000 | 0.6304 | 2600 | 4800 | 900 |
| 13 | 74 | Wien (Vienna) | AT | 0.7572 | 0.8324 | 1.0000 | 0.6303 | 2800 | 5000 | 800 |
| 14 | 16 | Madrid | ES | 0.7272 | 0.8613 | 1.0000 | 0.6264 | 4400 | 7200 | 3200 |
| 15 | 90 | Warszawa (Warsaw) | PL | 0.7845 | 0.7977 | 1.0000 | 0.6258 | 2200 | 4200 | 600 |
| 16 | 49 | Antwerpen | BE | 0.8034 | 0.7746 | 1.0000 | 0.6223 | 2000 | 3400 | 1000 |
| 17 | 5 | Jakarta | ID | 0.6846 | 0.8960 | 1.0000 | 0.6134 | 10,100 | 25,200 | 7000 |
| 18 | 34 | Sankt Peterburg (Saint Petersburg) | RU | 0.7566 | 0.8092 | 1.0000 | 0.6123 | 3000 | 5400 | 1400 |
| 19 | 44 | Bruxelles-Brussel | BE | 0.7950 | 0.7688 | 1.0000 | 0.6112 | 2500 | 4900 | 1100 |
| 20 | 5 | Krung Thep (Bangkok) | TH | 0.6783 | 0.8902 | 1.0000 | 0.6038 | 8300 | 20,000 | 7000 |
| 21 | 61 | Melbourne | AU | 0.7822 | 0.7746 | 0.9955 | 0.6031 | 2000 | 3500 | 900 |
| 22 | 102 | Berlin | DE | 0.7959 | 0.7457 | 1.0000 | 0.5935 | 2000 | 6700 | 500 |
| 23 | 22 | São Paulo | BR | 0.7375 | 0.8035 | 1.0000 | 0.5926 | 3900 | 11,300 | 2300 |
| 24 | 49 | København (Copenhagen) | DK | 0.7929 | 0.7457 | 1.0000 | 0.5913 | 2500 | 4600 | 1000 |
| 25 | 23 | Ankara | TR | 0.7156 | 0.8208 | 1.0000 | 0.5874 | 4100 | 8200 | 2200 |
| 26 | 10 | Taibei | CN/TW | 0.7029 | 0.8324 | 1.0000 | 0.5851 | 5700 | 12,000 | 5000 |
| 27 | 27 | Moskva (Moscow) | RUI | 0.7624 | 0.7630 | 1.0000 | 0.5817 | 3100 | 6700 | 1800 |
| 28 | 24 | Hong Kong | CN/HK | 0.6890 | 0.8439 | 1.0000 | 0.5815 | 5500 | 9900 | 2100 |
| 29 | 39 | Helsinki | FI | 0.8021 | 0.7225 | 1.0000 | 0.5795 | 1900 | 4400 | 1200 |
| 30 | 1 | Seoul | KR | 0.6446 | 0.8902 | 1.0000 | 0.5738 | 15,000 | 26,000 | 12,200 |
| 31 | 24 | Lisboa (Lisbon) | PT | 0.7117 | 0.8035 | 1.0000 | 0.5718 | 3800 | 6500 | 2100 |
| 32 | 90 | Genève | CH | 0.7982 | 0.7110 | 1.0000 | 0.5675 | 1600 | 2700 | 600 |
| 33 | 102 | Rotterdam | NL | 0.8437 | 0.6647 | 1.0000 | 0.5609 | 1300 | 2500 | 500 |
| 34 | 81 | Oslo | NO | 0.7949 | 0.7052 | 1.0000 | 0.5605 | 2000 | 3300 | 700 |
| 35 | 3 | Tokyo | JP | 0.6086 | 0.9191 | 1.0000 | 0.5593 | 11,900 | 21,000 | 8600 |
| 36 | 81 | Sydney | AU | 0.7723 | 0.7168 | 1.0000 | 0.5535 | 2300 | 4200 | 700 |
| 37 | 61 | Sofia | BG | 0.7746 | 0.7110 | 1.0000 | 0.5508 | 1800 | 3400 | 900 |
| 38 | 61 | Santiago | CL | 0.7862 | 0.6936 | 1.0000 | 0.5453 | 3000 | 5900 | 900 |
| 39 | 12 | Shanghai | CN | 0.6736 | 0.8092 | 1.0000 | 0.5451 | 4100 | 8800 | 3700 |
| 40 | 81 | Tel Aviv-Yafo (Tel Aviv-Jaffa) | IL | 0.7926 | 0.6879 | 0.9991 | 0.5447 | 2400 | 4700 | 700 |
| 41 | 4 | Manila | PH | 0.7785 | 0.6994 | 1.0000 | 0.5445 | 2600 | 16,300 | 7800 |
| 42 | 137 | Riga | LV | 0.7901 | 0.6879 | 1.0000 | 0.5435 | 1500 | 3300 | 300 |
| 43 | 102 | Tallinn | EE | 0.7920 | 0.6821 | 1.0000 | 0.5402 | 1500 | 2700 | 500 |
| 44 | 90 | Manchester | GB | 0.7995 | 0.6705 | 1.0000 | 0.5361 | 1500 | 2400 | 600 |
| 45 | 90 | Stockholm | SE | 0.7206 | 0.7341 | 1.0000 | 0.5290 | 2600 | 4200 | 600 |
| 46 | 61 | Buenos Aires | AR | 0.7418 | 0.7225 | 0.9820 | 0.5263 | 2700 | 6700 | 900 |
| 47 | 120 | Hamburg | DE | 0.8189 | 0.6358 | 1.0000 | 0.5207 | 1400 | 3500 | 400 |
| 48 | 102 | Yerevan | AM | 0.7936 | 0.6474 | 1.0000 | 0.5138 | 1300 | 2000 | 500 |
| 49 | 137 | Wellington | NZ | 0.7970 | 0.6301 | 1.0000 | 0.5022 | 1200 | 1900 | 300 |
| 50 | 90 | Davao City | PH | 0.8050 | 0.6185 | 1.0000 | 0.4979 | 1700 | 3500 | 600 |
| 51 | 81 | Kraków (Cracow) | PL | 0.7646 | 0.6474 | 1.0000 | 0.4950 | 1500 | 3100 | 700 |
| 52 | 49 | Thành Pho Ho Chí Minh (Ho Chi Minh City) | VN | 0.6761 | 0.8382 | 0.8713 | 0.4938 | 5500 | 9600 | 1000 |
| 53 | 102 | Bucuresti (Bucharest) | RO | 0.7979 | 0.6185 | 1.0000 | 0.4935 | 1300 | 3500 | 500 |
| 54 | 161 | Vilnius | LT | 0.8381 | 0.5896 | 0.9965 | 0.4924 | 1000 | 2400 | 200 |
| 55 | 21 | Kinki M.M.A. (Osaka) | JP | 0.6003 | 0.8150 | 1.0000 | 0.4892 | 7000 | 12,500 | 2500 |
| 56 | 61 | Roma (Rome) | IT | 0.6484 | 0.7514 | 1.0000 | 0.4872 | 3200 | 6000 | 900 |
| 57 | 39 | Porto | PT | 0.7250 | 0.6705 | 0.9957 | 0.4840 | 1900 | 3100 | 1200 |
| 58 | 137 | Bratislava | SK | 0.7813 | 0.6185 | 1.0000 | 0.4832 | 1300 | 2500 | 300 |
| 59 | 102 | Brno | CZ | 0.7806 | 0.6185 | 1.0000 | 0.4828 | 1200 | 2300 | 500 |
| 60 | 102 | Montréal | CA | 0.8151 | 0.7168 | 0.8184 | 0.4782 | 2100 | 5000 | 500 |
| 61 | 74 | Beograd (Belgrade) | RS | 0.7383 | 0.6474 | 1.0000 | 0.4780 | 1800 | 3300 | 800 |
| 62 | 120 | Kyiv (Kiev) | UA | 0.7485 | 0.6243 | 0.9936 | 0.4643 | 1300 | 3200 | 400 |
| 63 | 161 | Göteborg | SE | 0.7525 | 0.6012 | 1.0000 | 0.4524 | 1300 | 2500 | 200 |
| 64 | 186 | Skopje | MK | 0.7850 | 0.5549 | 1.0000 | 0.4356 | 1000 | 2800 | 100 |
| 65 | 186 | Cape Town | ZA | 0.7896 | 0.5491 | 1.0000 | 0.4336 | 900 | 1900 | 100 |
| 66 | 61 | Al Kuwayt (Kuwait City) | KW | 0.7133 | 0.5954 | 1.0000 | 0.4247 | 1500 | 7600 | 900 |
| 67 | 161 | Phnum Pénh (Phnom Penh) | KH | 0.7825 | 0.6763 | 0.7941 | 0.4203 | 1900 | 3500 | 200 |
| 68 | 161 | Valparaíso | CL | 0.8059 | 0.5145 | 1.0000 | 0.4146 | 1200 | 2100 | 200 |
| 69 | 74 | Zagreb | HR | 0.7040 | 0.5780 | 1.0000 | 0.4069 | 1300 | 2800 | 800 |
| 70 | 120 | Lyon | FR | 0.7403 | 0.7110 | 0.7670 | 0.4037 | 2500 | 4300 | 400 |
| 71 | 186 | Vientiane | LA | 0.7962 | 0.5029 | 0.9966 | 0.3990 | 900 | 1600 | 100 |
| 72 | 137 | Xinbei | CN/TW | 0.7522 | 0.5260 | 1.0000 | 0.3957 | 1900 | 4300 | 300 |
| 73 | 61 | Thessaloniki | GR | 0.6753 | 0.5838 | 1.0000 | 0.3943 | 1900 | 3400 | 900 |
| 74 | 161 | San José | CR | 0.8152 | 0.4798 | 1.0000 | 0.3911 | 1000 | 3100 | 200 |
| 75 | 186 | Minsk | BY | 0.7959 | 0.6763 | 0.7186 | 0.3868 | 1400 | 3000 | 100 |
| 76 | 137 | Johor Bahru | MY | 0.7905 | 0.5838 | 0.8214 | 0.3791 | 1200 | 4400 | 300 |
| 77 | 137 | Bogotá | CO | 0.7765 | 0.6243 | 0.7579 | 0.3674 | 2000 | 4900 | 300 |
| 78 | 161 | Arequipa | PE | 0.8157 | 0.4451 | 1.0000 | 0.3631 | 700 | 1200 | 200 |
| 79 | 161 | Plovdiv | BG | 0.8329 | 0.4335 | 1.0000 | 0.3611 | 700 | 1700 | 200 |
| 80 | 161 | Tiranë (Tirana) | AL | 0.7434 | 0.4855 | 1.0000 | 0.3609 | 1100 | 2000 | 200 |
| 81 | 34 | Busan | KR | 0.6643 | 0.5376 | 1.0000 | 0.3571 | 2500 | 4100 | 1400 |
| 82 | 49 | Bekasi | ID | 0.7051 | 0.7052 | 0.7136 | 0.3548 | 3300 | 30,700 | 1000 |
| 83 | 213 | Bayrut (Beirut) | LB | 0.8274 | 0.4277 | 1.0000 | 0.3539 | 1100 | 6300 | 0 |
| 84 | 137 | Dublin | IE | 0.7868 | 0.6069 | 0.6825 | 0.3259 | 1900 | 3800 | 300 |
| 85 | 137 | Auckland | NZ | 0.7635 | 0.7052 | 0.5939 | 0.3198 | 2300 | 4600 | 300 |
| 86 | 186 | Medellín | CO | 0.7964 | 0.4162 | 0.9263 | 0.3070 | 800 | 1600 | 100 |
| 87 | 186 | San Juan | PR | 0.7900 | 0.4393 | 0.8816 | 0.3060 | 1400 | 4300 | 100 |
| 88 | 161 | Ciudad de Panamá (Panama City) | PA | 0.8409 | 0.6127 | 0.5836 | 0.3007 | 1700 | 4000 | 200 |
| 89 | 186 | Chon Buri | TH | 0.7551 | 0.3988 | 0.9843 | 0.2964 | 1000 | 2500 | 100 |
| 90 | 61 | Guadalajara | MX | 0.7188 | 0.6532 | 0.6074 | 0.2852 | 4000 | 11,500 | 900 |
| 91 | 213 | San Pedro Sula | HN | 0.8737 | 0.4335 | 0.7521 | 0.2849 | 800 | 2000 | 0 |
| 92 | 120 | Rio de Janeiro | BR | 0.7362 | 0.6358 | 0.6031 | 0.2823 | 3600 | 12,600 | 400 |
| 93 | 213 | Nairobi | KE | 0.7563 | 0.3757 | 0.9881 | 0.2808 | 700 | 1700 | 0 |
| 94 | 90 | Asunción | PY | 0.8036 | 0.6647 | 0.5011 | 0.2677 | 2400 | 5000 | 600 |
| 95 | 161 | Dubayy (Dubai) | AE | 0.8023 | 0.5145 | 0.6452 | 0.2663 | 1200 | 5900 | 200 |
| 96 | 74 | Los Angeles–Long Beach–Santa Ana | US | 0.7667 | 0.6590 | 0.5224 | 0.2639 | 2600 | 5900 | 800 |
| 97 | 102 | Córdoba | AR | 0.7862 | 0.4624 | 0.7126 | 0.2591 | 1300 | 2800 | 500 |
| 98 | 186 | Alajuela | CR | 0.8541 | 0.2775 | 1.0000 | 0.2370 | 500 | 1800 | 100 |
| 99 | 61 | Athínai (Athens) | GR | 0.6432 | 0.6763 | 0.5185 | 0.2255 | 3900 | 9800 | 900 |
| 100 | 44 | Dar-el-Beida (Casablanca) | MA | 0.7630 | 0.5318 | 0.5534 | 0.2245 | 1500 | 3900 | 1100 |
| 101 | 161 | Guayaquil | EC | 0.8388 | 0.5145 | 0.4910 | 0.2119 | 1300 | 4000 | 200 |
| 102 | 49 | Beijing | CN | 0.6384 | 0.7688 | 0.4282 | 0.2101 | 5400 | 12,600 | 1000 |
| 103 | 213 | Tampere | FI | 0.8173 | 0.5549 | 0.4357 | 0.1976 | 1200 | 2600 | 0 |
| 104 | 49 | Toronto | CA | 0.8038 | 0.8844 | 0.2768 | 0.1968 | 6900 | 12,200 | 1000 |
| 105 | 30 | Al-Manamah (Manama) | BH | 0.8074 | 0.6590 | 0.3585 | 0.1908 | 2600 | 7700 | 1700 |
| 106 | 137 | Ad-Dawhah (Doha) | QA | 0.8043 | 0.5954 | 0.3974 | 0.1903 | 1900 | 4600 | 300 |
| 107 | 186 | Colombo | LK | 0.8915 | 0.3295 | 0.6347 | 0.1864 | 600 | 4500 | 100 |
| 108 | 102 | Lima | PE | 0.8049 | 0.3410 | 0.6629 | 0.1820 | 800 | 13,800 | 500 |
| 109 | 161 | Ar-Riyadh (Riyadh) | SA | 0.7664 | 0.7110 | 0.3168 | 0.1726 | 3100 | 14,200 | 200 |
| 110 | 213 | Caracas | VE | 0.8945 | 0.3526 | 0.5209 | 0.1643 | 800 | 5100 | 0 |
| 111 | 161 | Ciudad del Este | PY | 0.8759 | 0.4451 | 0.3986 | 0.1554 | 1100 | 2300 | 200 |
| 112 | 186 | Hefa (Haifa) | IL | 0.8179 | 0.4451 | 0.4210 | 0.1533 | 1100 | 1900 | 100 |
| 113 | 120 | Bishkek | KG | 0.8354 | 0.3757 | 0.4829 | 0.1516 | 800 | 3100 | 400 |
| 114 | 213 | Rabat | MA | 0.8475 | 0.3237 | 0.5515 | 0.1513 | 600 | 2200 | 0 |
| 115 | 90 | Tehran | IR | 0.6475 | 0.5491 | 0.3903 | 0.1388 | 3000 | 11,800 | 600 |
| 116 | 137 | Zürich (Zurich) | CH | 0.7742 | 0.7457 | 0.2371 | 0.1369 | 3800 | 6200 | 300 |
| 117 | 137 | Kathmandu | NP | 0.7382 | 0.4971 | 0.3692 | 0.1355 | 2000 | 4200 | 300 |
| 118 | 90 | Almaty | KZ | 0.7974 | 0.6474 | 0.2549 | 0.1316 | 3100 | 6300 | 600 |
| 119 | 81 | Baku | AZ | 0.7288 | 0.7630 | 0.2324 | 0.1292 | 5600 | 9300 | 700 |
| 120 | 49 | Ciudad de Guatemala (Guatemala City) | GT | 0.8243 | 0.6069 | 0.2318 | 0.1160 | 3700 | 7000 | 1000 |
| 121 | 49 | Santo Domingo | DO | 0.8324 | 0.6358 | 0.1933 | 0.1023 | 4700 | 9800 | 1000 |
| 122 | 120 | Yangon | MM | 0.8009 | 0.5780 | 0.2205 | 0.1021 | 3700 | 6000 | 400 |
| 123 | 137 | Al-Qahirah (Cairo) | EG | 0.7767 | 0.3642 | 0.3530 | 0.0998 | 1300 | 6500 | 300 |
| 124 | 161 | Port of Spain | TT | 0.8612 | 0.3815 | 0.2937 | 0.0965 | 1300 | 3300 | 200 |
| 125 | 161 | Santiago | DO | 0.8612 | 0.3757 | 0.2972 | 0.0962 | 1200 | 3200 | 200 |
| 126 | 102 | Tunis | TN | 0.6756 | 0.5202 | 0.2714 | 0.0954 | 2700 | 6300 | 500 |
| 127 | 33 | Milano (Milan) | IT | 0.6725 | 0.8208 | 0.1699 | 0.0938 | 11,500 | 19,300 | 1500 |
| 128 | 213 | Kampala | UG | 0.7903 | 0.2890 | 0.4039 | 0.0922 | 800 | 2400 | 0 |
| 129 | 137 | Managua | NI | 0.8244 | 0.5029 | 0.2198 | 0.0911 | 2500 | 5300 | 300 |
| 130 | 137 | Ulaanbaatar | MN | 0.7936 | 0.5202 | 0.2177 | 0.0899 | 2400 | 5400 | 300 |
| 131 | 49 | Mumbai (Bombay) | IN | 0.7301 | 0.7110 | 0.1726 | 0.0896 | 6200 | 21,800 | 1000 |
| 132 | 137 | Kharkiv | UA | 0.7648 | 0.6127 | 0.1695 | 0.0794 | 3100 | 7100 | 300 |
| 133 | 14 | Jiddah | SA | 0.7735 | 0.7572 | 0.1346 | 0.0788 | 7100 | 20,100 | 3500 |
| 134 | 102 | Tegucigalpa | HN | 0.8253 | 0.5491 | 0.1730 | 0.0784 | 3100 | 5500 | 500 |
| 135 | 161 | Iasi | RO | 0.8382 | 0.4624 | 0.1870 | 0.0725 | 1700 | 3000 | 200 |
| 136 | 120 | Tbilisi | GE | 0.7651 | 0.6358 | 0.1426 | 0.0694 | 3100 | 7500 | 400 |
| 137 | 102 | Safaqis | TN | 0.7740 | 0.3642 | 0.2418 | 0.0682 | 1400 | 3600 | 500 |
| 138 | 137 | Santa Cruz | BO | 0.8327 | 0.4913 | 0.1605 | 0.0657 | 2400 | 7400 | 300 |
| 139 | 186 | Al-Iskandariyah (Alexandria) | EG | 0.7716 | 0.3353 | 0.2430 | 0.0629 | 1200 | 2500 | 100 |
| 140 | 90 | La Paz | BO | 0.8142 | 0.5376 | 0.1283 | 0.0562 | 3200 | 4900 | 600 |
| 141 | 161 | Maputo | MZ | 0.8179 | 0.4624 | 0.1453 | 0.0549 | 2000 | 4000 | 200 |
| 142 | 61 | Johannesburg | ZA | 0.8399 | 0.1908 | 0.3408 | 0.0546 | 600 | 3300 | 900 |
| 143 | 81 | San Salvador | SV | 0.8230 | 0.5896 | 0.0972 | 0.0472 | 6200 | 11,400 | 700 |
| 144 | 161 | Amman | JO | 0.7669 | 0.4335 | 0.1376 | 0.0457 | 2200 | 11,500 | 200 |
| 145 | 31 | Ash-Shariqah (Sharjah) | AE | 0.7225 | 0.8382 | 0.0743 | 0.0450 | 16,700 | 32,900 | 1600 |
| 146 | 186 | Mandalay | MM | 0.9321 | 0.2023 | 0.2274 | 0.0429 | 700 | 2200 | 100 |
| 147 | 90 | Quito | EC | 0.8051 | 0.6358 | 0.0823 | 0.0421 | 6200 | 14,400 | 600 |
| 148 | 213 | Aguadilla-Isabela-San Sebastian | PR | 0.9452 | 0.1965 | 0.2175 | 0.0404 | 700 | 1500 | 0 |
| 149 | 213 | Kigali | RW | 0.8941 | 0.1561 | 0.2772 | 0.0387 | 500 | 900 | 0 |
| 150 | 120 | Antananarivo | MG | 0.8181 | 0.3468 | 0.1142 | 0.0324 | 1800 | 3700 | 400 |
| 151 | 137 | Delhi | IN | 0.7232 | 0.5029 | 0.0881 | 0.0320 | 4200 | 18,500 | 300 |
| 152 | 90 | Mashhad | IR | 0.8055 | 0.3988 | 0.0989 | 0.0318 | 2200 | 4900 | 600 |
| 153 | 102 | Kingston | JM | 0.7840 | 0.4220 | 0.0889 | 0.0294 | 2400 | 7100 | 500 |
| 154 | 61 | Astana | KZ | 0.8161 | 0.4509 | 0.0783 | 0.0288 | 3100 | 9200 | 900 |
| 155 | 137 | Mombasa | KE | 0.8426 | 0.2486 | 0.1269 | 0.0266 | 1100 | 2800 | 300 |
| 156 | 90 | Accra | GH | 0.7566 | 0.3873 | 0.0903 | 0.0265 | 2400 | 8100 | 600 |
| 157 | 31 | Ar-Rayyan | QA | 0.7624 | 0.8150 | 0.0419 | 0.0260 | 12,500 | 21,400 | 1600 |
| 158 | 49 | Lahore | PK | 0.7890 | 0.5607 | 0.0536 | 0.0237 | 4400 | 8700 | 1000 |
| 159 | 213 | Karachi | PK | 0.9755 | 0.0347 | 0.6556 | 0.0222 | 100 | 600 | 0 |
| 160 | 213 | Lagos | NG | 0.9755 | 0.0347 | 0.6556 | 0.0222 | 100 | 200 | 0 |
| 161 | 24 | Maracaibo | VE | 0.8323 | 0.5145 | 0.0497 | 0.0213 | 6200 | 13,100 | 2100 |
| 162 | 120 | El Djazaïr (Algiers) | DZ | 0.8540 | 0.3410 | 0.0718 | 0.0209 | 2100 | 4100 | 400 |
| 163 | 213 | Samarkand | UZ | 0.8345 | 0.1965 | 0.1273 | 0.0209 | 800 | 3000 | 0 |
| 164 | 44 | Al-Khartum (Khartoum) | SD | 0.7460 | 0.5145 | 0.0518 | 0.0199 | 5400 | 10,900 | 1100 |
| 165 | 161 | Sarajevo | BA | 0.7117 | 0.5723 | 0.0485 | 0.0198 | 6200 | 9100 | 200 |
| 166 | 38 | Montevideo | UY | 0.7870 | 0.6416 | 0.0381 | 0.0193 | 9500 | 17,000 | 1300 |
| 167 | 186 | Bujumbura | BI | 0.9376 | 0.0809 | 0.2497 | 0.0189 | 300 | 700 | 100 |
| 168 | 74 | Chişinău | MD | 0.7931 | 0.3815 | 0.0614 | 0.0186 | 3200 | 6200 | 800 |
| 169 | 19 | Tashkent | UZ | 0.7720 | 0.6301 | 0.0381 | 0.0185 | 7400 | 15,400 | 2600 |
| 170 | 213 | Dimashq (Damascus) | SY | 0.7981 | 0.1387 | 0.1625 | 0.0180 | 700 | 4000 | 0 |
| 171 | 186 | Yaoundé | CM | 0.9655 | 0.0751 | 0.2289 | 0.0166 | 300 | 1700 | 100 |
| 172 | 81 | Dar es Salaam | TZ | 0.8210 | 0.4104 | 0.0482 | 0.0163 | 2600 | 10,300 | 700 |
| 173 | 213 | Port Moresby | PG | 0.9168 | 0.1676 | 0.1051 | 0.0162 | 700 | 1300 | 0 |
| 174 | 102 | Luanda | AO | 0.8166 | 0.3815 | 0.0467 | 0.0146 | 2700 | 5600 | 500 |
| 175 | 120 | Kabul | AF | 0.7849 | 0.1965 | 0.0937 | 0.0144 | 1100 | 2200 | 400 |
| 176 | 27 | Douala | CM | 0.7291 | 0.2139 | 0.0860 | 0.0134 | 1400 | 4500 | 1800 |
| 177 | 161 | Sumquayit | AZ | 0.8716 | 0.1734 | 0.0880 | 0.0133 | 1000 | 2200 | 200 |
| 178 | 213 | Harare | ZW | 0.9654 | 0.0751 | 0.1769 | 0.0128 | 300 | 1600 | 0 |
| 179 | 137 | La Habana (Havana) | CU | 0.6955 | 0.4046 | 0.0454 | 0.0128 | 3700 | 6900 | 300 |
| 180 | 17 | Dhaka | BD | 0.7806 | 0.7110 | 0.0221 | 0.0123 | 11,500 | 17,800 | 2900 |
| 181 | 102 | Masqat (Muscat) | OM | 0.7794 | 0.3699 | 0.0413 | 0.0119 | 5900 | 29,000 | 500 |
| 182 | 49 | Cotonou | BJ | 0.8354 | 0.3873 | 0.0362 | 0.0117 | 2700 | 5700 | 1000 |
| 183 | 102 | Dakar | SN | 0.8524 | 0.3931 | 0.0324 | 0.0109 | 3500 | 14,100 | 500 |
| 184 | 120 | Windhoek | NA | 0.8636 | 0.1965 | 0.0637 | 0.0108 | 1300 | 3200 | 400 |
| 185 | 49 | Tarabulus (Tripoli) | LY | 0.7467 | 0.2659 | 0.0502 | 0.0100 | 2600 | 6700 | 1000 |
| 186 | 186 | Port-au-Prince | HT | 0.9015 | 0.1387 | 0.0790 | 0.0099 | 800 | 2200 | 100 |
| 187 | 213 | Mwanza | TZ | 0.9258 | 0.0636 | 0.1665 | 0.0098 | 300 | 1200 | 0 |
| 188 | 161 | Pokhara | NP | 0.7526 | 0.3873 | 0.0318 | 0.0093 | 3800 | 5900 | 200 |
| 189 | 213 | Salahah (Salalah) | OM | 0.9121 | 0.1561 | 0.0647 | 0.0092 | 900 | 5000 | 0 |
| 190 | 137 | Gomel | BY | 0.8099 | 0.3064 | 0.0354 | 0.0088 | 2900 | 4800 | 300 |
| 191 | 213 | Bata | GQ | 0.9410 | 0.0405 | 0.2107 | 0.0080 | 200 | 300 | 0 |
| 192 | 61 | Addis Ababa | ET | 0.7756 | 0.4220 | 0.0226 | 0.0074 | 5600 | 9300 | 900 |
| 193 | 213 | Gaza (incl. Ash Shati Camp) | PS | 0.8177 | 0.2601 | 0.0317 | 0.0067 | 2300 | 4700 | 0 |
| 194 | 213 | Abomey-Calavi | BJ | 0.8842 | 0.3699 | 0.0189 | 0.0062 | 3300 | 4800 | 0 |
| 195 | 213 | Halab (Aleppo) | SY | 0.9025 | 0.0867 | 0.0754 | 0.0059 | 600 | 1100 | 0 |
| 196 | 120 | Kinshasa | CD | 0.8087 | 0.3064 | 0.0234 | 0.0058 | 3400 | 6200 | 400 |
| 197 | 161 | Chittagong | BD | 0.8167 | 0.2775 | 0.0246 | 0.0056 | 3200 | 6000 | 200 |
| 198 | 39 | Macao | CN/MO | 0.7966 | 0.3699 | 0.0186 | 0.0055 | 5400 | 9600 | 1200 |
| 199 | 186 | Blantyre-Limbe | MW | 0.9494 | 0.0925 | 0.0554 | 0.0049 | 700 | 1500 | 100 |
| 200 | 34 | Zarqa | JO | 0.7154 | 0.7803 | 0.0085 | 0.0048 | 25,800 | 38,900 | 1400 |
| 201 | 44 | Abidjan | CI | 0.7510 | 0.4855 | 0.0123 | 0.0045 | 8400 | 13,700 | 1100 |
| 202 | 74 | Baghdad | IQ | 0.7676 | 0.3642 | 0.0149 | 0.0042 | 6700 | 10,600 | 800 |
| 203 | 102 | Lomé | TG | 0.9002 | 0.1676 | 0.0271 | 0.0041 | 1500 | 4900 | 500 |
| 204 | 213 | Lubango | AO | 1.0000 | 0.0462 | 0.0832 | 0.0039 | 300 | 500 | 0 |
| 205 | 137 | Lusaka | ZM | 0.8930 | 0.1098 | 0.0387 | 0.0038 | 1100 | 9300 | 300 |
| 206 | 213 | Kumasi | GH | 0.8983 | 0.0405 | 0.1041 | 0.0038 | 300 | 1200 | 0 |
| 207 | 186 | Brazzaville | CG | 0.9483 | 0.1214 | 0.0312 | 0.0036 | 1200 | 2200 | 100 |
| 208 | 213 | Misratah | LY | 0.8000 | 0.0809 | 0.0468 | 0.0030 | 800 | 1300 | 0 |
| 209 | 161 | Wahran (Oran) | DZ | 0.8254 | 0.1503 | 0.0244 | 0.0030 | 1900 | 5800 | 200 |
| 210 | 81 | Dushanbe | TJ | 0.8274 | 0.3353 | 0.0102 | 0.0028 | 5400 | 8800 | 700 |
| 211 | 18 | Ashgabat | TM | 0.8450 | 0.1329 | 0.0249 | 0.0028 | 1300 | 8400 | 2800 |
| 212 | 186 | Matola | MZ | 0.9278 | 0.0867 | 0.0322 | 0.0026 | 800 | 1400 | 100 |
| 213 | 213 | Lilongwe | MW | 0.8056 | 0.2312 | 0.0128 | 0.0024 | 3500 | 5700 | 0 |
| 214 | 213 | Bulawayo | ZW | 0.9200 | 0.0925 | 0.0255 | 0.0022 | 1100 | 2200 | 0 |
| 215 | 186 | Djibouti | DJ | 0.9805 | 0.0925 | 0.0231 | 0.0021 | 900 | 6400 | 100 |
| 216 | 161 | Monrovia | LR | 0.9261 | 0.1503 | 0.0145 | 0.0020 | 2600 | 5400 | 200 |
| 217 | 186 | Asmara | ER | 0.9579 | 0.0578 | 0.0364 | 0.0020 | 600 | 1000 | 100 |
| 218 | 27 | Libreville | GA | 0.9039 | 0.2254 | 0.0094 | 0.0019 | 3300 | 6000 | 1800 |
| 219 | 120 | Nouakchott | MR | 0.8437 | 0.1965 | 0.0109 | 0.0018 | 2900 | 4500 | 400 |
| 220 | 120 | Banjul | GM | 0.7578 | 0.2370 | 0.0091 | 0.0016 | 4900 | 9000 | 400 |
| 221 | 120 | Ouagadougou | BF | 0.8904 | 0.1965 | 0.0083 | 0.0015 | 3000 | 7100 | 400 |
| 222 | 74 | Niamey | NE | 0.9006 | 0.1214 | 0.0127 | 0.0014 | 1900 | 3500 | 800 |
| 223 | 186 | Bissau | GW | 0.8937 | 0.1272 | 0.0120 | 0.0014 | 1700 | 3100 | 100 |
| 224 | 213 | Pointe-Noire | CG | 0.9338 | 0.1503 | 0.0077 | 0.0011 | 2900 | 6600 | 0 |
| 225 | 39 | Bamako | ML | 0.9175 | 0.2197 | 0.0053 | 0.0011 | 3800 | 6800 | 1200 |
| 226 | 186 | Hargeysa | SO | 0.8695 | 0.0462 | 0.0234 | 0.0009 | 800 | 1200 | 100 |
| 227 | 213 | Santiago de Cuba | CU | 0.8597 | 0.0809 | 0.0127 | 0.0009 | 1300 | 2400 | 0 |
| 228 | 213 | Mekele | ET | 0.9005 | 0.0636 | 0.0144 | 0.0008 | 1300 | 2000 | 0 |
| 229 | 186 | Kitwe | ZM | 0.9085 | 0.1214 | 0.0061 | 0.0007 | 2600 | 5000 | 100 |
| 230 | 137 | Juba | SS | 0.8811 | 0.1387 | 0.0052 | 0.0006 | 3400 | 5500 | 300 |
| 231 | 120 | Kano | NG | 0.8830 | 0.1792 | 0.0039 | 0.0006 | 5200 | 9400 | 400 |
| 232 | 186 | P’yongyang | KP | 1.0000 | 0.0173 | 0.0312 | 0.0005 | 300 | 600 | 100 |
| 233 | 213 | Bobo-Dioulasso | BF | 1.0000 | 0.0173 | 0.0312 | 0.0005 | 300 | 800 | 0 |
| 234 | 213 | Bangui | CF | 1.0000 | 0.0116 | 0.0468 | 0.0005 | 200 | 300 | 0 |
| 235 | 137 | Toamasina | MG | 0.8587 | 0.1329 | 0.0046 | 0.0005 | 4000 | 7200 | 300 |
| 236 | 81 | Sana’a’ | YE | 0.7817 | 0.1965 | 0.0032 | 0.0005 | 6400 | 9700 | 700 |
| 237 | 102 | Freetown | SL | 0.8191 | 0.1676 | 0.0034 | 0.0005 | 7300 | 11,700 | 500 |
| 238 | 213 | N’Djaména | TD | 0.9346 | 0.0751 | 0.0054 | 0.0004 | 1900 | 3400 | 0 |
| 239 | 213 | Herat | AF | 0.7395 | 0.0462 | 0.0110 | 0.0004 | 1400 | 2800 | 0 |
| 240 | 161 | Thies | SN | 0.9359 | 0.0347 | 0.0104 | 0.0003 | 900 | 1600 | 200 |
| 241 | 137 | Conakry | GN | 0.9322 | 0.1734 | 0.0018 | 0.0003 | 10,200 | 14,900 | 300 |
| 242 | 213 | Nyala | SD | 1.0000 | 0.0289 | 0.0073 | 0.0002 | 800 | 1700 | 0 |
| 243 | 186 | Bouake | CI | 0.9222 | 0.0520 | 0.0039 | 0.0002 | 1900 | 3400 | 100 |
| 244 | 213 | Al-Mawsil (Mosul) | IQ | 0.9740 | 0.0462 | 0.0029 | 0.0001 | 1800 | 2600 | 0 |
| 245 | 120 | Muqdisho (Mogadishu) | SO | 0.9381 | 0.0751 | 0.0011 | 0.0001 | 4900 | 8800 | 400 |
| 246 | 213 | Zinder | NE | 1.0000 | 0.0116 | 0.0029 | 0.0000 | 800 | 1200 | 0 |
| 247 | 213 | Adan (Aden) | YE | 0.9610 | 0.0231 | 0.0013 | 0.0000 | 2500 | 3800 | 0 |
| 248 | 186 | Mbuji-Mayi | CD | 0.9165 | 0.0289 | 0.0004 | 0.0000 | 4000 | 5700 | 100 |
| 249 | 186 | Sikasso | ML | 1.0000 | 0.0116 | 0.0001 | 0.0000 | 5600 | 8000 | 100 |
* The classification of ‘countries and areas’ in this table is established as a geographical and statistical unit of analysis, based on United Nations statistical practices.
Appendix C
Appendix C provides descriptive statistics and box plots for the indicators analyzed across the 249 cities in this study.
Table A3.
Descriptive statistics of indicators across 249 cities.
Table A3.
Descriptive statistics of indicators across 249 cities.
| J′α | C′α | ρ′α | UDI Max | UDI Max Distance (m) | Metropolitan Coverage Distance (m) | Peak Distance Buffer Zone (m) | |
|---|---|---|---|---|---|---|---|
| Average | 0.8092 | 0.4674 | 0.4549 | 0.2195 | 3024.4980 | 6634.5382 | 903.6145 |
| Std | 0.0822 | 0.2674 | 0.4199 | 0.2357 | 3038.4768 | 5972.3094 | 1595.0614 |
| Min | 0.6003 | 0.0116 | 0.0001 | 0.0000 | 100.0000 | 200.0000 | 0.0000 |
| Median | 0.7974 | 0.5029 | 0.2714 | 0.0962 | 2200.0000 | 4900.0000 | 400.0000 |
| Max | 1.0000 | 0.9538 | 1.0000 | 0.7254 | 25,800.0000 | 38,900.0000 | 12,200.0000 |

Figure A1.
Box plots of each indicator: (a) J′α, C′α, ρ′α, and UDI max; (b) UDI max distance (m); (c) Metropolitan Coverage Distance (m); (d) Peak Distance Buffer Zone (m).
Appendix D
Appendix D presents the National- and urban-scale maps for the following 16 sovereign G20 countries: Argentina, Australia, Brazil, Canada, China, France, Germany, India, Indonesia, Italy, Japan, Mexico, Russia, Saudi Arabia, South Africa, and the United States. The Republic of Korea, Türkiye, and the United Kingdom are excluded here, as they are already presented in Section 3. The European Union (EU) and the African Union (AU) are also excluded.

Figure A2.
National- and urban-scale maps of Argentina with a focus on Buenos Aires and Córdoba: (a) National-scale map of Argentina and surrounding cities; (b) UDI values and extracted urban area in Buenos Aires; (c) UDI values and extracted urban area in Córdoba.

Figure A3.
National- and urban-scale maps of Australia with a focus on Sydney and Melbourne: (a) National-scale map of Australia and surrounding cities; (b) UDI values and extracted urban area in Sydney; (c) UDI values and extracted urban area in Melbourne.

Figure A4.
National- and urban-scale maps of Brazil with a focus on São Paulo and Rio de Janeiro: (a) National-scale map of Brazil and surrounding cities; (b) UDI values and extracted urban area in São Paulo; (c) UDI values and extracted urban area in Rio de Janeiro.

Figure A5.
National- and urban-scale maps of Canada with a focus on Toronto and Montréal: (a) National-scale map of Canada and surrounding cities; (b) UDI values and extracted urban area in Toronto; (c) UDI values and extracted urban area in Montréal.

Figure A6.
National- and urban-scale maps of China with a focus on Beijing and Shanghai: (a) National-scale map of China and surrounding cities; (b) UDI values and extracted urban area in Beijing; (c) UDI values and extracted urban area in Shanghai.

Figure A7.
National- and urban-scale maps of France with a focus on Paris and Lyon: (a) National-scale map of France and surrounding cities; (b) UDI values and extracted urban area in Paris; (c) UDI values and extracted urban area in Lyon.

Figure A8.
National- and urban-scale maps of Germany with a focus on Berlin and Hamburg: (a) National-scale map of Germany and surrounding cities; (b) UDI values and extracted urban area in Berlin; (c) UDI values and extracted urban area in Hamburg.

Figure A9.
National- and urban-scale maps of India with a focus on Delhi and Mumbai (Bombay): (a) National-scale map of India and surrounding cities; (b) UDI values and extracted urban area in Delhi; (c) UDI values and extracted urban area in Mumbai (Bombay).

Figure A10.
National- and urban-scale maps of Indonesia with a focus on Jakarta and Bekasi: (a) National-scale map of Indonesia and surrounding cities; (b) UDI values and extracted urban area in Jakarta; (c) UDI values and extracted urban area in Bekasi.

Figure A11.
National- and urban-scale maps of Italy with a focus on Roma (Rome) and Milano (Milan): (a) National-scale map of Italy and surrounding cities; (b) UDI values and extracted urban area in Roma (Rome); (c) UDI values and extracted urban area in Milano (Milan).

Figure A12.
National- and urban-scale maps of Japan with a focus on Tokyo and Kinki M.M.A (Osaka): (a) National-scale map of Japan and surrounding cities; (b) UDI values and extracted urban area in Tokyo; (c) UDI values and extracted urban area in Kinki M.M.A.

Figure A13.
National- and urban-scale maps of Mexico with a focus on Ciudad de Mexico (Mexico City) and Guadalajara: (a) National-scale map of Mexico and surrounding cities; (b) UDI values and extracted urban area in Ciudad de Mexico (Mexico City); (c) UDI values and extracted urban area in Guadalajara.

Figure A14.
National- and urban-scale maps of Russia with a focus on Moskva (Moscow) and Sankt Peterburg (Saint Petersburg): (a) National-scale map of Russia and surrounding cities; (b) UDI values and extracted urban area in Moskva (Moscow); (c) UDI values and extracted urban area in Sankt Peterburg (Saint Petersburg).

Figure A15.
National- and urban-scale maps of Saudi Arabia with a focus on Ar-Riyadh (Riyadh) and Jiddah: (a) National-scale map of Saudi Arabia and surrounding cities; (b) UDI values and extracted urban area in Ar-Riyadh (Riyadh); (c) UDI values and extracted urban area in Jiddah.

Figure A16.
National- and urban-scale maps of South Africa with a focus on Cape Town and Johannesburg: (a) National-scale map of South Africa and surrounding cities; (b) UDI values and extracted urban area in Cape Town; (c) UDI values and extracted urban area in Johannesburg.

Figure A17.
National- and urban-scale maps of the United States with a focus on New York–Newark and Los Angeles–Long Beach–Santa Ana: (a) National-scale map of United States and surrounding cities; (b) UDI values and extracted urban area in New York–Newark; (c) UDI values and extracted urban area in Los Angeles–Long Beach–Santa Ana.
References
- Sassen, S. The Global City: New York, London, Tokyo; REV-Revised; Princeton University Press: Princeton, NJ, USA, 2001; ISBN 9780691070636. [Google Scholar]
- Moulaert, F.; Rodríguez, A.; Swyngedouw, E. The Globalized City: Economic Restructuring and Social Polarization in European Cities; Oxford Geographical and Environmental Studies; Oxford University Press: New York, NY, USA, 2003; ISBN 9780199260409. [Google Scholar]
- Murray, M.J. The Urbanism of Exception: The Dynamics of Global City Building in the Twenty-First Century; Cambridge University Press: Cambridge, UK, 2017; ISBN 9781107169241. [Google Scholar]
- Mohanty, M. Globalization and Cities. In Sustainable Cities and Communities; Leal Filho, W., Marisa Azul, A., Brandli, L., Gökçin Özuyar, P., Wall, T., Eds.; Springer International Publishing: Cham, Switzerland, 2020; pp. 204–215. ISBN 978-3-319-95717-3. [Google Scholar]
- Grodach, C. Urban Cultural Policy and Creative City Making. Cities 2017, 68, 82–91. [Google Scholar] [CrossRef]
- Duconseille, F.; Saner, R. Creative Placemaking for Inclusive Urban Landscapes. J. Arts Manag. Law Soc. 2020, 50, 137–154. [Google Scholar] [CrossRef]
- Jacobs, J. The Death and Life of Great American Cities; Random House: New York, NY, USA, 1961. [Google Scholar]
- Florida, R.L. The Rise of the Creative Class: And How It’s Transforming Work, Leisure, Community and Everyday Life; Basic Books: New York, NY, USA, 2002; ISBN 9780465024766. [Google Scholar]
- Bettencourt, L.M.A.; Samaniego, H.; Youn, H. Professional Diversity and the Productivity of Cities. Sci. Rep. 2014, 4, 5393. [Google Scholar] [CrossRef] [PubMed]
- Desrochers, P.; Leppälä, S.; Szurmak, J. Urban Diversity and Innovation. In The Elgar Companion to Innovation and Knowledge Creation; Edward Elgar Publishing: Cheltenham, UK, 2017. [Google Scholar]
- Manaugh, K.; Kreider, T. What Is Mixed Use? Presenting an Interaction Method for Measuring Land Use Mix. J. Transp. Land Use 2013, 6, 63–72. [Google Scholar] [CrossRef]
- Mbata, R. Urban Revitalization: Enhancing Quality of Life through Mixed-Use Developments. Int. J. Sci. Res. Arch. 2024, 11, 191–198. [Google Scholar] [CrossRef]
- Fan, Z.; Su, T.; Sun, M.; Noyman, A.; Zhang, F.; Pentland, A.; Moro, E. Diversity beyond Density: Experienced Social Mixing of Urban Streets. Proc. Natl. Acad. Sci. USA Nexus 2023, 2, pgad077. [Google Scholar] [CrossRef]
- Iannillo, A.; Fasolino, I. Land-Use Mix and Urban Sustainability: Benefits and Indicators Analysis. Sustainability 2021, 13, 13460. [Google Scholar] [CrossRef]
- Niebuhr, A. Migration and Innovation: Does Cultural Diversity Matter for Regional R&D Activity? Pap. Reg. Sci. 2010, 89, 563–586. [Google Scholar] [CrossRef]
- Mulligan, G.; Carruthers, J. Amenities, Quality of Life, and Regional Development. In Investigating Quality of Urban Life; Springer: Berlin/Heidelberg, Germany, 2011; Volume 45, pp. 107–133. ISBN 978-94-007-1741-1. [Google Scholar]
- Dobrowolska, E.; Kopczewska, K. Mapping Urban Well-Being with Quality Of Life Index (QOLI) at the Fine-Scale of Grid Data. Sci. Rep. 2024, 14, 9680. [Google Scholar] [CrossRef]
- Al-saedi, A.Z.M.; Rasul, H.Q. New Roadmap toward Social Sustainability, from Physical Structures to Perceived Spaces. Sustainability 2024, 16, 7716. [Google Scholar] [CrossRef]
- Stiglitz, J.; Sen, A.; Fitoussi, J. Report by the Commission on the Measurement of Economic Performance and Social Progress (CMEPSP). 2009. Available online: https://www.economie.gouv.fr/files/finances/presse/dossiers_de_presse/090914mesure_perf_eco_progres_social/synthese_ang.pdf (accessed on 30 July 2025).
- Giannetti, B.F.; Agostinho, F.; Almeida, C.M.V.B.; Huisingh, D. A Review of Limitations of GDP and Alternative Indices to Monitor Human Wellbeing and to Manage Eco-System Functionality. J. Clean. Prod. 2015, 87, 11–25. [Google Scholar] [CrossRef]
- Pumain, D.; Swerts, E.; Cottineau, C.; Vacchiani-Marcuzzo, C.; Ignazzi, C.A.; Bretagnolle, A.; Delisle, F.; Cura, R.; Lizzi, L.; Baffi, S. Multilevel Comparison of Large Urban Systems. Cybergeo Eur. J. Geogr. 2015, 706, 1–24. [Google Scholar] [CrossRef]
- Csomós, G. On the Challenges Ahead of Spatial Scientometrics Focusing on the City Level. Aslib J. Inf. Manag. 2020, 72, 67–87. [Google Scholar] [CrossRef]
- Manley, E.; Dennett, A. New Forms of Data for Understanding Urban Activity in Developing Countries. Appl. Spat. Anal. Policy 2019, 12, 45–70. [Google Scholar] [CrossRef]
- Amalan, T.P.; Du, B.; Kumarage, A.S.; Wickramasuriya, R.; Perez, P. High Frequency Data in Land Use and Transport Integrated Model: A Review of Sources and Application. Asian Transp. Stud. 2023, 9, 100092. [Google Scholar] [CrossRef]
- Evance, S.M. Examining Data Limitations and Technical Infrastructure in Urban Planning and Land Use: A Case of Kabwe Council Zambia. PM World J. 2025, 14, 2330–4480. [Google Scholar]
- Xiu, G.; Wang, J.; Gross, T.; Kwan, M.-P.; Peng, X.; Liu, Y. Mobility Census for Monitoring Rapid Urban Development. J. R. Soc. Interface 2024, 21, 20230495. [Google Scholar] [CrossRef]
- Earth Observation: Sustainable Urban Planning. Available online: https://initiatives.weforum.org/earth-observation/case-study-details/sustainable-urban-planning/aJYTG0000000P9h4AE (accessed on 29 June 2025).
- Kuffer, M.; Wang, J.; Thomson, D.R.; Georganos, S.; Abascal, A.; Owusu, M.; Vanhuysse, S. Spatial Information Gaps on Deprived Urban Areas (Slums) in Low-and-Middle-Income-Countries: A User-Centered Approach. Urban. Sci. 2021, 5, 72. [Google Scholar] [CrossRef]
- Maneepong, K.; Yamanotera, R.; Akiyama, Y.; Miyazaki, H.; Miyazawa, S.; Akiyama, C.M. Towards High-Resolution Population Mapping: Leveraging Open Data, Remote Sensing, and AI for Geospatial Analysis in Developing Country Cities—A Case Study of Bangkok. Remote Sens. 2025, 17, 1204. [Google Scholar] [CrossRef]
- Chen, Y.; Yu, B.; Shu, B.; Yang, L.; Wang, R. Exploring the Spatiotemporal Patterns and Correlates of Urban Vitality: Temporal and Spatial Heterogeneity. Sustain. Cities Soc. 2023, 91, 104440. [Google Scholar] [CrossRef]
- Gao, C.; Li, S.; Sun, M.; Zhao, X.; Liu, D. Exploring the Relationship between Urban Vibrancy and Built Environment Using Multi-Source Data: Case Study in Munich. Remote Sens. 2024, 16, 1107. [Google Scholar] [CrossRef]
- Lyu, G.; Angkawisittpan, N.; Fu, X.; Sonasang, S. Investigating the Relationship between Built Environment and Urban Vitality Using Big Data. Sci. Rep. 2025, 15, 579. [Google Scholar] [CrossRef]
- Sobolevsky, S.; Bojic, I.; Belyi, A.; Sitko, I.; Hawelka, B.; Arias, J.M.; Ratti, C. Scaling of City Attractiveness for Foreign Visitors through Big Data of Human Economical and Social Media Activity. In Proceedings of the 2015 IEEE International Congress on Big Data, New York, NY, USA, 27 June–2 July 2015; IEEE: Piscataway, NJ, USA; pp. 600–607. [Google Scholar]
- Pavković, V.; Karabašević, D.; Jević, J.; Jević, G. The Relationship between Cities’ Cultural Strength, Reputation, and Tourism Intensity: Empirical Evidence on a Sample of the Best-Reputable European Cities. Sustainability 2021, 13, 8806. [Google Scholar] [CrossRef]
- Abozeid, A.S.M.; AboElatta, T.A. Polycentric vs Monocentric Urban Structure Contribution to National Development. J. Eng. Appl. Sci. 2021, 68, 11. [Google Scholar] [CrossRef]
- Wang, M. Polycentric Urban Development and Urban Amenities: Evidence from Chinese Cities. Environ. Plan. B Urban. Anal. City Sci. 2020, 48, 400–416. [Google Scholar] [CrossRef]
- Psyllidis, A.; Gao, S.; Hu, Y.; Kim, E.-K.; McKenzie, G.; Purves, R.; Yuan, M.; Andris, C. Points of Interest (POI): A Commentary on the State of the Art, Challenges, and Prospects for the Future. Comput. Urban. Sci. 2022, 2, 20. [Google Scholar] [CrossRef] [PubMed]
- Hu, Y.; Han, Y. Identification of Urban Functional Areas Based on POI Data: A Case Study of the Guangzhou Economic and Technological Development Zone. Sustainability 2019, 11, 1385. [Google Scholar] [CrossRef]
- Luo, G.; Ye, J.; Wang, J.; Wei, Y. Urban Functional Zone Classification Based on POI Data and Machine Learning. Sustainability 2023, 15, 4631. [Google Scholar] [CrossRef]
- Wesz, J.G.B.; Miron, L.I.G.; Delsante, I.; Tzortzopoulos, P. Urban Quality of Life: A Systematic Literature Review. Urban. Sci. 2023, 7, 56. [Google Scholar] [CrossRef]
- Yu, D.; Fang, C. Urban Remote Sensing with Spatial Big Data: A Review and Renewed Perspective of Urban Studies in Recent Decades. Remote Sens. 2023, 15, 1307. [Google Scholar] [CrossRef]
- Kim, Y.-L. Urban Vitality Measurement Through Big Data and Internet of Things Technologies. ISPRS Int. J. Geo-Inf. 2025, 14, 14. [Google Scholar] [CrossRef]
- Glaeser, E.L.; Kominers, S.D.; Luca, M.; Naik, N. Big Data and Big Cities: The Promises and Limitations of Improved Measures of Urban Life. Econ. Inq. 2018, 56, 114–137. [Google Scholar] [CrossRef]
- Huang, B.; Wang, J. Big Spatial Data for Urban and Environmental Sustainability. Geo-Spat. Inf. Sci. 2020, 23, 125–140. [Google Scholar] [CrossRef]
- Rahman, F.; Oliver, R.; Buehler, R.; Lee, J.; Crawford, T.; Kim, J. Impacts of Point of Interest (POI) Data Selection on 15-Minute City (15-MC) Accessibility Scores and Inequality Assessments. Transp. Res. Part. A Policy Pract. 2025, 195, 104429. [Google Scholar] [CrossRef]
- Niu, H.; Silva, E.A. Delineating Urban Functional Use from Points of Interest Data with Neural Network Embedding: A Case Study in Greater London. Comput. Environ. Urban. Syst. 2021, 88, 101651. [Google Scholar] [CrossRef]
- He, Z.; Zhang, X. Towards More Reliable Measures for “Perceived Urban Diversity” Using Point of Interest (POI) and Geo-Tagged Photos. ISPRS Int. J. Geoinf. 2025, 14, 91. [Google Scholar] [CrossRef]
- Sun, W.H.; Xu, S.C.; Li, L.S. Reducing Vacant Houses Is More Important than the Implementation of Green Buildings. Adv. Mat. Res. 2011, 280, 250–254. [Google Scholar] [CrossRef]
- Arcaute, E.; Hatna, E.; Ferguson, P.; Youn, H.; Johansson, A.; Batty, M. Constructing Cities, Deconstructing Scaling Laws. J. R. Soc. Interface 2015, 12, 20140745. [Google Scholar] [CrossRef]
- Cottineau, C.; Hatna, E.; Arcaute, E.; Batty, M. Diverse Cities or the Systematic Paradox of Urban Scaling Laws. Comput. Environ. Urban. Syst. 2017, 63, 80–94. [Google Scholar] [CrossRef]
- Patacchini, E.; Zenou, Y.; Henderson, J.V.; Epple, D. Urban Sprawl in Europe. Brook.-Whart. Pap. Urban. Aff. 2009, 2009, 125–149. [Google Scholar] [CrossRef]
- European Commission: Directorate-General for Regional and Urban Policy; De Dominicis, L.; Berlingieri, F.; d’Hombres, B.; Gentile, C.; Mauri, C.; Stepanova, E.; Pontarollo, N. Report on the Quality of Life in European Cities, 2023; Publications Office of the European Union: Luxembourg City, Luxembourg, 2023; ISBN 978-92-68-07783-2. [Google Scholar]
- Bishop, I.D.; Escobar, F.J.; Karuppannan, S.; Williamson, I.P.; Yates, P.M.; Suwarnarat, K.; Yaqub, H.W. Spatial Data Infrastructures for Cities in Developing Countries: Lessons from the Bangkok Experience. Cities 2000, 17, 85–96. [Google Scholar] [CrossRef]
- Cardenas-Ritzert, O.S.E.; Vogeler, J.C.; Shah Heydari, S.; Fekety, P.A.; Laituri, M.; McHale, M.R. Effects of Land Use Data Spatial Resolution on SDG Indicator 11.3.1 (Urban Expansion) Assessments: A Case Study Across Ethiopia. Sustainability 2024, 16, 9698. [Google Scholar] [CrossRef]
- Maneepong, K.; Yamanotera, R.; Akiyama, Y.; Miyazaki, H.; Miyazawa, S.; Akiyama, C.M. Open Data-Driven 3D Building Models for Micro-Population Mapping in a Data-Limited Setting. Remote Sens. 2024, 16, 3922. [Google Scholar] [CrossRef]
- Nengroo, Z.A.; Bhat, M.S.; Za, N.; Ah, S.; Ms, B. Dynamics of Land Use Change in Rural-Urban Fringe: A Case Study of Srinagar City. Environ. Sci. Indian J. 2017, 13, 142. [Google Scholar]
- Weldegebriel, A.; Assefa, E.; Janusz, K.; Tekalign, M.; Van Rompaey, A. Spatial Analysis of Intra-Urban Land Use Dynamics in Sub-Saharan Africa: The Case of Addis Ababa (Ethiopia). Urban. Sci. 2021, 5, 57. [Google Scholar] [CrossRef]
- Oshri, B.; Hu, A.; Adelson, P.; Chen, X.; Dupas, P.; Weinstein, J.; Burke, M.; Lobell, D.; Ermon, S. Infrastructure Quality Assessment in Africa Using Satellite Imagery and Deep Learning. In Proceedings of the 24th ACM SIGKDD International Conference on Knowledge Discovery & Data Mining, London, UK, 19–23 August 2018; Association for Computing Machinery: New York, NY, USA, 2018; pp. 616–625. [Google Scholar]
- Panman, A. Surveys and the City: Three Challenges to Quality Data Collection in Urban Areas. Available online: https://www.oxfordurbanists.com/magazine/2019/4/17/surveys-and-the-city-three-challenges-to-quality-data-collection-in-urban-areas (accessed on 29 June 2025).
- Farrell, K. The Rapid Urban Growth Triad: A New Conceptual Framework for Examining the Urban Transition in Developing Countries. Sustainability 2017, 9, 1407. [Google Scholar] [CrossRef]
- Satterthwaite, D. Missing the Millennium Development Goal Targets for Water and Sanitation in Urban Areas. Environ. Urban. 2016, 28, 99–118. [Google Scholar] [CrossRef]
- Pfeiffer, D.; Cloutier, S. Planning for Happy Neighborhoods. J. Am. Plan. Assoc. 2016, 82, 267–279. [Google Scholar] [CrossRef]
- Hertel, S.; Singer, M.M.; Van Cott, D.L. Field Research in Developing Countries: Hitting the Road Running. PS—Political Sci. Politics 2009, 42, 305–309. [Google Scholar] [CrossRef]
- Cheema, A.R.; Abid, M.; Khan, F.A. Challenges of Research in Rural Poverty: Lessons from Large Field Surveys. Dev. Pract. 2018, 28, 714–719. [Google Scholar] [CrossRef]
- Rodriguez-Segura, D.; Schueler, B.E. Assessors Influence Results: Evidence on Enumerator Effects and Educational Impact Evaluations. J. Dev. Econ. 2023, 163, 103057. [Google Scholar] [CrossRef]
- Daggitt, M.L.; Noulas, A.; Shaw, B.; Mascolo, C. Tracking Urban Activity Growth Globally with Big Location Data. R. Soc. Open Sci. 2016, 3, 150688. [Google Scholar] [CrossRef] [PubMed]
- Yeow, L.W.; Low, R.; Tan, Y.X.; Cheah, L. Point-of-Interest (POI) Data Validation Methods: An Urban Case Study. ISPRS Int. J. Geo-Inf. 2021, 10, 735. [Google Scholar] [CrossRef]
- Harris, C.D.; Ullman, E.L. The Nature of Cities. Ann. Am. Acad. Political Soc. Sci. 1945, 242, 7–17. [Google Scholar] [CrossRef]
- Bell, T.L.; Lieber, S.R.; Rushton, G. Clustering of Services in Central Places. Ann. Assoc. Am. Geogr. 1974, 64, 214–225. [Google Scholar] [CrossRef]
- Smith, S.L.J. Location Patterns of Urban Restaurants. Ann. Tour. Res. 1985, 12, 581–602. [Google Scholar] [CrossRef]
- Walter, U.; Müller, D.K.; Långvall, A. The Spatial Distribution of Gourmet Restaurants. Scand. J. Hosp. Tour. 2022, 22, 285–302. [Google Scholar] [CrossRef]
- Leonardi, M.; Moretti, E. The Agglomeration of Urban Amenities: Evidence from Milan Restaurants. Am. Econ. Rev. Insights 2023, 5, 141–157. [Google Scholar] [CrossRef]
- Zhang, L.; Wang, P.; Zhou, J.; Zhao, Y. Exploring the Spatial Distribution Mechanisms of Restaurants Across Different Urban Morphologies: A Macau Case Study Using Space Syntax and Big Data. Land 2025, 14, 541. [Google Scholar] [CrossRef]
- Youn, H.; Bettencourt, L.M.A.; Lobo, J.; Strumsky, D.; Samaniego, H.; West, G.B. Scaling and Universality in Urban Economic Diversification. J. R. Soc. Interface 2016, 13, 20150937. [Google Scholar] [CrossRef]
- Foursquare. Places Categories. Available online: https://docs.foursquare.com/data-products/docs/categories (accessed on 29 June 2025).
- Yu, B.; Cui, X.; Li, H.; Luo, P.; Liu, R.; Yang, T. TOD and Vibrancy: The Spatio-Temporal Impacts of the Built Environment on Vibrancy. Front. Environ. Sci. 2022, 10, 1009094. [Google Scholar] [CrossRef]
- United Nations Population of Urban Agglomerations with 300,000 Inhabitants or More in 2018, by Country, 1950–2035. Available online: https://population.un.org/wup/downloads?tab=Urban%20Agglomerations (accessed on 29 June 2025).
- Borchert, J.R. American Metropolitan Evolution. Geogr. Rev. 1967, 57, 301–332. [Google Scholar] [CrossRef]
- Hein, C. Port Cities and Urban Waterfronts: How Localized Planning Ignores Water as a Connector. WIREs Water 2016, 3, 419–438. [Google Scholar] [CrossRef]
- Shannon, C.E. A Mathematical Theory of Communication. Bell Syst. Tech. J. 1948, 27, 379–423. [Google Scholar] [CrossRef]
- Biswas, S.R.; Mallik, A.U. Species Diversity and Functional Diversity Relationship Varies with Disturbance Intensity. Ecosphere 2011, 2, art52. [Google Scholar] [CrossRef]
- Galle, N.J.; Halpern, D.; Nitoslawski, S.; Duarte, F.; Ratti, C.; Pilla, F. Mapping the Diversity of Street Tree Inventories across Eight Cities Internationally Using Open Data. Urban For. Urban Green. 2021, 61, 127099. [Google Scholar] [CrossRef]
- Pielou, E.C. The Measurement of Diversity in Different Types of Biological Collections. J. Theor. Biol. 1966, 13, 131–144. [Google Scholar] [CrossRef]
- Daly, A.J.; Baetens, J.M.; De Baets, B. Ecological Diversity: Measuring the Unmeasurable. Mathematics 2018, 6, 119. [Google Scholar] [CrossRef]
- Hurlbert, S.H. The Nonconcept of Species Diversity: A Critique and Alternative Parameters. Ecology 1971, 52, 577–586. [Google Scholar] [CrossRef]
- Kopczewska, K.; Kubara, M.; Kopyt, M. Population Density as the Attractor of Business to the Place. Sci. Rep. 2024, 14, 22234. [Google Scholar] [CrossRef]
- Salkind, N.J. Winsorize. In Encyclopedia of Research Design; SAGE Publications: Thousand Oaks, CA, USA, 2010. [Google Scholar]
- Rousseeuw, P.J.; Hubert, M. Anomaly Detection by Robust Statistics. WIREs Data Min. Knowl. Discov. 2018, 8, e1236. [Google Scholar] [CrossRef]
- Clark, C. Urban Population Densities. J. R. Stat. Soc. Ser. A 1951, 114, 490–496. [Google Scholar] [CrossRef]
- Richardson, H.W. Studies in the Structure of the Urban Economy. Econ. J. 1973, 83, 289–291. [Google Scholar] [CrossRef]
- Dong, Q.; Qu, S.; Qin, J.; Yi, D.; Liu, Y.; Zhang, J. A Method to Identify Urban Fringe Area Based on the Industry Density of POI. ISPRS Int. J. Geo-Inf. 2022, 11, 128. [Google Scholar] [CrossRef]
- Wang, H.; Yu, X.; Luo, L.; Li, R. Urban–Rural Boundary Delineation Based on Population Spatialization: A Case Study of Guizhou Province, China. Sustainability 2024, 16, 1787. [Google Scholar] [CrossRef]
- Kimani-Murage, E.W.; Schofield, L.; Wekesah, F.; Mohamed, S.; Mberu, B.; Ettarh, R.; Egondi, T.; Kyobutungi, C.; Ezeh, A. Vulnerability to Food Insecurity in Urban Slums: Experiences from Nairobi, Kenya. J. Urban. Health 2014, 91, 1098–1113. [Google Scholar] [CrossRef]
- Sahasranaman, A.; Bettencourt, L.M.A. Life between the City and the Village: Scaling Analysis of Service Access in Indian Urban Slums. World Dev. 2021, 142, 105435. [Google Scholar] [CrossRef]
- Chege, C.G.K.; Wanyama, R.; Lundy, M.; Nguru, W.; Jäger, M. Does Retail Food Diversity in Urban Food Environments Influence Consumer Diets? Sustainability 2021, 13, 7666. [Google Scholar] [CrossRef]
- Dempsey, N.; Bramley, G.; Power, S.; Brown, C. The Social Dimension of Sustainable Development: Defining Urban Social Sustainability. Sustain. Dev. 2011, 19, 289–300. [Google Scholar] [CrossRef]
- Mirzoev, T.; Tull, K.I.; Winn, N.; Mir, G.; King, N.V.; Wright, J.M.; Gong, Y.Y. Systematic Review of the Role of Social Inclusion within Sustainable Urban Developments. Int. J. Sustain. Dev. World Ecol. 2022, 29, 3–17. [Google Scholar] [CrossRef]
- Chen, L.; Chen, M.; Zhang, X.; Xian, Y. Evaluating Inequality Divides in Urban Development Intensity between the Global North and South. Land Use Policy 2024, 145, 107291. [Google Scholar] [CrossRef]
- Kudas, D.; Wnęk, A.; Hudecová, L’.; Fencik, R. Spatial Diversity Changes in Land Use and Land Cover Mix in Central European Capitals and Their Commuting Zones from 2006 to 2018. Sustainability 2024, 16, 2224. [Google Scholar] [CrossRef]
- Lee, M.; Barbosa, H.; Youn, H.; Holme, P.; Ghoshal, G. Morphology of Travel Routes and the Organization of Cities. Nat. Commun. 2017, 8, 2229. [Google Scholar] [CrossRef]
- Berry, B.J.L. Recent studies concerning the role of transportation in the space economy. Ann. Assoc. Am. Geogr. 1959, 49, 328–342. [Google Scholar] [CrossRef]
Disclaimer/Publisher’s Note: The statements, opinions and data contained in all publications are solely those of the individual author(s) and contributor(s) and not of MDPI and/or the editor(s). MDPI and/or the editor(s) disclaim responsibility for any injury to people or property resulting from any ideas, methods, instructions or products referred to in the content. |
© 2025 by the authors. Licensee MDPI, Basel, Switzerland. This article is an open access article distributed under the terms and conditions of the Creative Commons Attribution (CC BY) license (https://creativecommons.org/licenses/by/4.0/).