Abstract
In the preceding two decades, blue entrepreneurship has emerged as a pivotal proposition for Europe’s coastal fishing communities, as these communities have sought to diversify and reinvigorate their local economies. The present paper seeks to shed light on the driving forces and obstacles to the development of blue entrepreneurship in fishing communities through an innovative entrepreneurial ecosystem approach. The results of a qualitative survey, conducted through a questionnaire addressed to representatives of 80 stakeholders (private companies, local authorities, development companies, Local Action Groups for Fisheries (FLAGs), organizations, NGOs, academic and research institutions) based in and around coastal fishing communities, are explored in order to identify the driving forces and barriers to the development of blue entrepreneurship. The research was conducted by selecting stakeholders from five distinct coastal regions of Greece. These regions are dependent on fishing and have local Community-Led Local Development (CLLD)/LEADER programs that were funded by the Operational Program Fisheries and Maritime Affairs 2014–2020 during the 2014–2020 programming period. Subsequently, adopting existing models through an entrepreneurial ecosystem approach, the driving forces and obstacles highlight the weaknesses of Greek blue entrepreneurial ecosystems in coastal fishing communities, focusing on the existing blue framework conditions and the existing blue systemic conditions. Finally, the primary conclusions of the research are emphasized, and policy proposals are advanced to encourage the establishment of blue entrepreneurial ecosystems in Greek coastal fishing areas.
1. Introduction
1.1. General
Historically, fishing has been the predominant economic activity of coastal European communities, providing livelihoods and revenue. This tradition persists in certain coastal communities within the European Union, where it plays a pivotal role in ensuring the provision of fresh fish and other seafood to European markets while minimizing the associated carbon footprint. The local economy of these coastal communities is dependent on specific fishing activities, in the absence of alternative employment and business opportunities in other economic sectors. At the same time, fishing constitutes an integral part of these communities’ cultural identity [1]. However, due to significant structural deficiencies, the fishing industry is incapable of providing adequate economic support to these local communities, resulting in a decline in both fishing income and employment. Consequently, many fishermen are compelled to depart from the industry, leading to their subsequent unemployment. The issues under discussion in this paper include the following: the fragmented nature of the small-scale fleet; its observed decline and aging; increased energy costs; the aging of the workforce; and the depletion of fish stocks due to marine pollution, overfishing by amateur, illegal, and unregulated fishing, the effects of marine fires and climate change, and the presence of mammals.
Consequently, there is an urgent need to diversify and revitalize these local economies with new economic activities that will also contribute to the conservation of marine biodiversity, thus allowing the enrichment of fish stocks and providing practical support for small-scale local fisheries. The term “diversification” is understood to denote the diversification of fishing activities through the implementation of novel fishing techniques, direct sales to consumers, or small-scale processing of fish, as well as the pursuit of complementary or new economic activities by local fishermen [1]. It is the opinion of numerous scholars that the promotion and development of local blue entrepreneurship in these coastal areas will achieve this dual objective [2]. The role of blue entrepreneurship in the blue economy is of crucial importance, as it is a driving force that combines the elements of innovation, i.e., continuous exploration of profit opportunities and risk-taking by adapting and exploiting available marine resources in the most sustainable way. In addition, it incorporates elements of sensitivity to social interests, thereby strengthening the local labor market and focusing on human and social capital.
In the past, endeavors have been made to diversify the local economy of EU coastal fishing communities into sectors of the blue economy, particularly over the last fifteen years, through the implementation of diversification strategies for fishing communities and Local CLLD/LEADER Programs funded by the European Maritime, Fisheries and Aquaculture Fund (EMFAF). Despite the ambiguity surrounding the precise impact of these programs on the diversification of the local economy during the 2014–2020 programming period, possibly attributable to the identified deficiencies in the impact measurement system [3], there is an emerging consensus that a limited proportion of the allocated resources reached the intended beneficiaries and facilitated the development of local fishing communities. This underperformance can be attributed to various factors, including bureaucracy, inadequate technical support for small-scale fishermen, and their under-representation in program management, as posited by [4,5,6,7].
It is imperative that a holistic approach be adopted in order to address the pressing need to diversify local economies and to provide support for sustainable local entrepreneurship in coastal fishing communities. These communities can be regarded as ecosystems that function and develop through interaction between different local actors. The ecosystem under discussion enables comprehension of the entire entrepreneurial environment and the needs of the fishermen themselves, as well as those of the structures that support them. It thus contributes to the design of targeted local business development strategies. The ecosystem is characterized by the promotion of cooperation and networking between local actors. This fosters a reduction in business uncertainty, facilitates the dissemination of knowledge, and enhances local innovation performance. This ecosystem is distinguished by its emphasis on the structures and relationships among local actors. It is designed to assist in the identification of both gaps and deficiencies in infrastructure and services, as well as opportunities for collaboration and innovation.
In this context, the present article proposes the blue entrepreneurial ecosystem approach as a holistic approach to analyzing the local business environment of coastal fishing communities with the aim of identifying and highlighting all the driving forces and barriers for the development of blue entrepreneurship. It is anticipated that this approach will contribute to the development of novel sustainable fishing activities through innovative fishing techniques, in the marketing or processing of fish, or complementary or new business activities by local fishermen in existing or emerging economic sectors of the local blue economy. This will create complementary or new income and jobs for the population of coastal fishing communities in the EU.
Firstly, the theoretical framework of the issue is presented, which defines and clarifies fundamental concepts such as the blue economy and blue entrepreneurship. The former is defined as the sustainable use of marine resources for economic benefit, while preserving the marine environment. The latter is defined as the practice of commercializing products and services that are derived from the sea. Both concepts have been shown to be beneficial in terms of boosting local income and creating new jobs while protecting the biodiversity of the marine environment and thus contributing to the enrichment of fish stocks. The concept of the marine business ecosystem is then presented. In the following section, the response to the following research questions is provided through qualitative research, which adopts a holistic approach to the need to diversify and revitalize fishing communities in blue economy activities.
RQ1:
Which blue ecosystem framework conditions and systemic conditions act as important drivers and barriers to the development of blue entrepreneurship in coastal fishing communities?
RQ2:
What are the structural deficiencies, gaps, and inconsistencies present within the blue entrepreneurial ecosystem in the Greek coastal fishing communities?
1.2. The Greek Fishing Communities
Greece has a long tradition and history of fishing, as evidenced by its extensive coastline of 15,021 km, which accounts for 13.89% of the total coastline of the EU [8]. This sector is of particular socio-economic importance at the local level, especially in coastal communities, despite its very limited contribution to GDP, estimated at 0.32% [9]. In these communities, fishing represents an integral facet of their identity, as it constitutes the primary economic activity that shapes the daily lives and cultural practices of the majority of the inhabitants. According to the most recent data, Greece produces approximately 223,000 tons of fish, with 131,000 tons being derived from aquaculture and 92,000 tons from fishing. This amount places Greece fourteenth among the EU-27 countries with the largest amount of fish, contributing 2% and 0.1% of the amount of fish in Europe and the world, respectively. Notwithstanding the substantial decline of 16.9% that has been witnessed over the past twelve years (2023: 12,039 vessels, in comparison to 2016: 14,485 vessels), the fishing fleet remains notable for its considerable size (representing the second largest in the EU—17.2% of the total). However, it is characterized by low capacity and low engine power (62,596 GT and 359,077 KW) [10,11,12].
The predominant form of fishing is small-scale, involving the use of static gear such as nets, longlines, and traps along the extensive coastline of the mainland and numerous islands. A significant proportion of the total 12,039 vessels are classified as 0–11 m in length, accounting for 96.2% of the total (11,579 vessels). Indeed, the EUMOFA (2025) [10] reports that 84% of all fishing jobs are small-scale fishing operations, with the number of jobs in this sector amounting to 8738 out of a total of 10,402 in 2022.
In recent years, coastal fishing communities in Greece have been confronted with considerable economic challenges, which have precipitated the observed decline in the fishing fleet. This has frequently precipitated a state of vulnerability for professional fishermen, often compelling them to seek alternative employment opportunities, and in some cases, to abandon their fishing activities. Figure 1 illustrates the decline in employment in Greek fisheries during the period 2016–2023, as indicated by the average annual employment in fisheries [13].
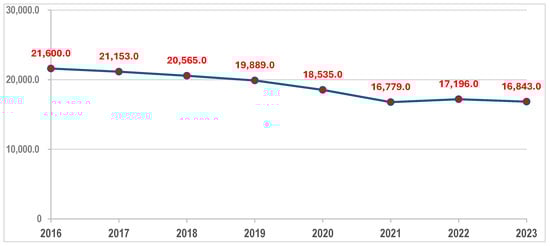
Figure 1.
Average annual employment in fisheries in Greece 2016–2023. Source: Hellenic Statistical Authority, 2025 [13].
The main difficulties include a decline in fish stocks and pollution, the latter of which contributes to the former, as well as the presence of mammals that destroy fishing gear and endemic species. Other difficulties include the activity of recreational fishermen, destructive fishing practices and illegal techniques, seasonal employment due to adverse weather conditions throughout the year, and increased energy costs [6,14,15]. Added to these are the now apparent threats of urbanization and climate change, such as coastal erosion, limited availability of clean water, changes to the marine ecosystem, and the presence of invasive species, which often cause endemic species to disappear [16]. At the same time, the profile of today’s Greek fishermen poses a barrier to modernization, restructuring, and change, as this occupation is a way of life for them. Sixty per cent are aged between 40 and 60, they have a low level of education, and 86 per cent live in the area where they were born (M.R.D.F., 2021) [15].
1.3. The Blue Economy
The blue economy is defined as the sum of all activities related to the ocean, including its natural resources and the associated economic activities that take place in coastal regions. In light of the observed depletion of Earth’s resources and the now apparent limitations on land-based economic activities, international organizations and national governments have been prompted to explore economic opportunities in and around the seas and oceans. This concept is referred to as the blue economy [17]. The term “blue economy” was first coined in the 1990s [18], yet its earliest appearance in the annals of international literature was in an article by Pauli, within the context of sustainable ocean development [19]. Subsequent to this, the concept was referenced in the U.N. Convention on Sustainable Development [16]. Corson, MacDonald, and Neimark (2013) posit that, akin to the green economy, the blue economy is predicated on the identification and exploitation of water-based opportunities, whilst concomitantly contributing to the optimal protection of biodiversity [20]. In 2017, the World Bank provided the following definition of the blue economy: “The sustainable economic use of marine resources in harmony with the protection of marine ecosystems and the enhancement of livelihoods and employment” [21] (part vi). Subsequent to this, the term has been extensively adopted in the design and implementation of international and national policy and governance.
Schutter et al. (2021) posit that the blue economy is constituted by a series of policies designed to fortify economic activities associated with the sea [22]. These activities, in turn, contribute to the advancement of both economic and social dimensions, as well as environmental development [22]. It is noteworthy that at the 2012 Rio+20 summit, the concept of the blue economy was presented as a concept consistent with sustainable development and inextricably linked to the green economy, constituting a sector thereof [23]. Despite extensive research, the academic community has yet to reach a consensus on a universally accepted definition of the blue economy, let alone establish a comprehensive list of the economic sectors encompassed by this concept [24]. However, a commonality among the definitions attributed to the blue economy is the emphasis on the dual significance of the sea. This is to say that the sea is considered both a critical ecosystem that must be protected and preserved at all costs, and an area of economic exploitation for the livelihood and prosperity of citizens. Furthermore, it is considered to be an area of new opportunities for entrepreneurial development [25].
1.4. Blue Entrepreneurship as a Distinct Sector of Sustainable Entrepreneurship
The confluence of technological progress and economic growth, with a focus on the blue economy, has given rise to a range of phenomena, including entrepreneurship, innovation, and the establishment of networks among relevant stakeholders. Indeed, in recent years, there has been a steadily increasing trend towards the creation and operation of incubators and accelerators, as well as the organization of entrepreneurship and innovation competitions, which support entrepreneurial initiatives focused on maritime activities [26,27,28]. This forms one category of sustainable entrepreneurship, alongside green or environmental entrepreneurship. These two categories are developing in the same direction and complement each other [29,30]. They both seek to achieve environmental and/or social goals through business [31].
Green entrepreneurship can be defined as the process of addressing environmental challenges whilst creating economic value. It encompasses both well-established enterprises that have adopted environmental management practices or cleaner production processes, and newly established enterprises that are founded on natural and ecological resources (e.g., solar energy and ecotourism companies) [32]. According to Senaratne et al. (2021) and Poza-Vilches et al., (2023), blue entrepreneurship, understood as a distinct and emerging means of supporting sustainable development linked to the economy, represents a significant opportunity to address the major socio-environmental challenges of the 21st century [24,33]. However, it should be noted that this differs from green entrepreneurship in that it addresses marine environmental challenges while concomitantly supporting the blue economy [27] (Table 1).

Table 1.
Key differences between green and blue type of sustainable entrepreneurship.
Recent literature in the field of entrepreneurship has begun to refer to blue entrepreneurship as a form of entrepreneurship that prioritizes the sustainability of seas and oceans. It encompasses a wide range of actions and initiatives that aim to ensure access to clean, high-quality water, as well as the protection and restoration of marine fauna [29]. These actions are associated with maritime transport and/or fishing activities, marine environment protection, energy from marine renewable sources, and marine biotechnology. Additionally, land and sea activities related to tools and equipment used in maritime activities are also included [30,34]. Dijkstra, van Beukering and Brower propose a definition of blue entrepreneurship as the process of establishing an economically viable business model that addresses marine environmental challenges while supporting the blue economy [27]. The role of blue entrepreneurship in the blue economy is of crucial importance, as it is a driving force that combines innovation, continuous exploration of profit opportunities, and risk-taking by adapting and exploiting available marine resources in the most sustainable way. It also incorporates elements of sensitivity to social interests, strengthening the local labor market, and focusing on human and social capital.
The inextricable link between blue entrepreneurship and sustainable entrepreneurship is highlighted by many researchers who argue that it offers opportunities for new approaches to economic activities in a fairer and more sustainable way, thus demonstrating the relevance of blue entrepreneurship to social entrepreneurship [33,35,36,37]. In their seminal study, Lechuga-Jiménez et al. (2024) [38] conducted a comprehensive review of the extant international literature on blue entrepreneurship as a field of sustainable entrepreneurship. This pioneering study identified three fundamental concepts that resonate with those of social entrepreneurship. Firstly, the concept of the entrepreneur who, in both forms of entrepreneurship, is able to innovate and adapt available resources while achieving significant social change. Secondly, the concept of social enterprise itself, which is primarily concerned with the pursuit of social good, places a strong emphasis on the strengthening of the local labor market, the provision of services to local communities, the cultivation of human and social capital, and the adoption of a flexible decision-making process. These characteristics are frequently observed in the realm of blue entrepreneurship. Thirdly, the concept attributed to the term “blue economy” has been identified as synonymous with a form of green, circular, and fair economy by several scholars [38].
Senaratne, Zimbroff, and Stevens (2021) [24] observe that there is a paucity of consensus in the international literature on the sectors that constitute the blue economy. They propose that marine resource extraction, shipping, goods transport, tourism, and recreation related to the sea be considered as integral components of the blue economy [24]. According to Doerr, Anderson, and Scorse (2023), the sectors of blue entrepreneurship concern the sustainable harvesting of wild seafood, carbon-neutral aquaculture, the production of plant- and cell-based seafood, and the production of energy from renewable sources (wave, offshore wind, tidal) [39]. The European Commission’s definition of the blue economy encompasses coastal tourism, the collection of marine living and non-living resources, port activities, shipbuilding and repair, and maritime transport [40]. Figueiredo, Soliman, and Al-Alawi (2023) further delineate the blue economy sectors, delineating them as including coastal tourism, the collection of living marine resources, the collection of non-living marine resources, port activities, shipbuilding and repair, and maritime transport [18]. Suris-Regueiro, Garza Gil and Varela-Lafuente (2013) proposed a classification of blue economy sectors into three groups: fully marine sectors, mainly marine sectors and partially marine sectors [41]. In 2015, The Economist attempted to categorize them into four groups: extraction or production of non-living resources, collection of living resources, trade within and around the oceans, and protection and management of marine ecosystems [42].
A salient distinction between blue economy sectors and other economic sectors pertains to their interconnected and interdependent character, a feature that arises from their inherent relationship with the sea. Blue economy businesses are particularly vulnerable to the negative impacts of the actions of businesses in other sectors, as all businesses use the sea [18]. This underscores the necessity for concerted planning to ensure the sustainable utilization of marine resources.
1.5. Blue Entrepreneurial Ecosystems
In view of the limited impact of initiatives undertaken to date with a view to diversifying the local economies of coastal fishing communities (due to fragmented and piecemeal actions, minimal involvement of small-scale fishermen directly affected, ineffective strategies), this paper proposes a novel entrepreneurial ecosystem model for the context of blue entrepreneurship as a holistic approach to exploring the driving forces and the existing barriers of blue entrepreneurship. The entrepreneurial ecosystem is a fundamental spatial concept consisting of different actors with different roles and environmental factors that interact and shape the entrepreneurial performance of a place or region [43]. The entrepreneur occupies a central position within this ecosystem, surrounded by various entities and actors, including prominent corporations, institutions of higher education, financial institutions, public organizations, support structures, regulatory bodies, and municipal or regional authorities [44]. When these elements are strategically aligned, they collectively foster the growth and development of new and emerging businesses, thereby generating a dynamic regional and local economy. In this context, entrepreneurship is not only an outcome of the ecosystem, but also a pivotal element in its establishment and preservation of favorable conditions [45].
To date, the international scientific community has not yet reached a consensus on a definition of entrepreneurial ecosystems that is accepted by all. According to Malecki (2018), the entrepreneurial ecosystem consists of local actors who encourage and support the creation and development of new businesses, as well as a set of social, institutional and cultural dynamics that take place at the local level [46]. Stam defines the ecosystem as the set of independent actors and factors that coordinate and shape the necessary conditions for the development of productive entrepreneurship [45]. Spigel (2017) [47] proposes the concept of the entrepreneurial ecosystem as the set of social, political, economic, and cultural characteristics of a region that contribute to the creation and development of innovative start-ups. These characteristics are not isolated from each other but have been created and reproduced through their interactions [47].
In the international literature, references to blue entrepreneurial ecosystems are very limited. Of particular note is the work of Cosimato and Vona, who, following the presentation of the key factors of a blue entrepreneurial ecosystem, proceeded to examine the role contribution of each of these factors, as well as their interaction. They then analyzed how blue growth strategies strengthen the long-term sustainability of the maritime entrepreneurial ecosystem, using the transnational entrepreneurial ecosystem of the Adriatic as a case study [48]. Concurrently with the works of Cosimato and Vona, Senaratne et al.—who are engaged in the study of blue entrepreneurial ecosystems—present in their paper a measurement tool based on both quantitative and qualitative data obtained through interviews with stakeholders, and piloting it in the Seychelles’ national blue entrepreneurship ecosystem [24].
The model is developed by adopting Stam’s (2015) [45] model in the present paper on entrepreneurial ecosystems and utilizing knowledge produced and presented in the literature on the blue economy and the marine and coastal environment. The model incorporates all aspects and levels that contribute to the development of blue entrepreneurship. The blue entrepreneurial ecosystem comprises four levels (blue framework conditions, blue systemic conditions, outputs, and outcomes), presenting causal depth as well as causal relationships upwards and downwards within the ecosystem. The bottom-up causal relationship demonstrates how fundamental causes, in combination with systemic conditions, initially engender blue entrepreneurial activity and subsequently generate overall value. The reverse top-down path illustrates how the results and outputs of the ecosystem enrich and enhance both the blue framework conditions and the blue systemic conditions over time. The following presentation will provide a more detailed exposition of the ecosystem, focusing firstly on the blue framework conditions. These relate to the fundamental causes of blue value creation, which are broken down into the following categories: environmental conditions, social conditions, physical conditions, and demand conditions.
The distinguishing feature of blue sustainable entrepreneurship is its environmental conditions, which differentiate it from general entrepreneurship and, by extension, blue entrepreneurial ecosystems from general entrepreneurial ecosystems. The quality of the marine environment is arguably the most critical condition of the blue framework, as it enables or prevents the development of blue economy activities (such as the conservation of fish stocks, marine pollution, wind potential, natural resources in the marine and coastal zone, etc.). The concept of social conditions encompasses the existence of formal institutions and their interventions, including central, regional, and local governments, as well as universities. Additionally, it incorporates the presence of informal institutions, such as social capital stock, as elucidated by [49]. The physical conditions of a region may be considered to include the physical infrastructure that facilitates or hinders the development of blue economy activities. Such characteristics of the coastal zone, available port infrastructure, available yachting infrastructure, marine cultural heritage stock, underwater cultural heritage stock, etc., may be taken as indicative of the physical conditions of a region. Finally, demand conditions refer to the ease or difficulty of access to a mainly exogenous demand for blue goods and services. This is more indicative of the relative geographical location of the ecosystem and the relationships it develops with external markets than of internal conditions of the ecosystem (such as distance from urban centers, road connections to urban centers, ferry connections to urban centers, size of the local market, over-tourism, etc.).
In order to understand how blue framework conditions influence the development of blue entrepreneurial activities, and by extension the creation of overall blue value, it is necessary to analyze and understand how blue systemic conditions lead to the strengthening of blue entrepreneurship. These systemic conditions include networks and relationships between local businesses and stakeholders, as well as leadership, financing, talent, knowledge, and support services. The presence of these factors, as well as their relationships and interactions, determines the success of a blue entrepreneurship ecosystem in creating value. Networks and cooperative relationships between local businesses and other actors facilitate the diffusion of knowledge and information while allowing for the rational allocation of labor and capital. This can include identifying creative consensus among local actors, the degree of conflict between maritime economic activities, cooperation between businesses and universities, and entrepreneurial networking with companies in urban centers. Leadership refers to large companies whose managers are interested in the region, promote strategic directions and business models, and contribute to creating healthy conditions for a blue entrepreneurial ecosystem (Figure 2). Taking into account maritime activities in Greece, such companies could come from the hotel or aquaculture sectors.
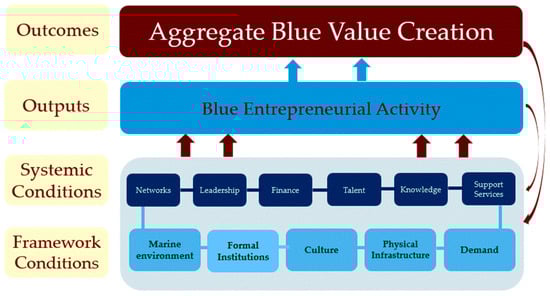
Figure 2.
The blue entrepreneurial ecosystem. Source: Author’s adaptation from Ref. [45].
Funding availability for businesses in the blue economy is a critical systemic factor in establishing or growing blue businesses. Perhaps the most important factor in a modern knowledge-based maritime business ecosystem is the availability of a young, educated workforce with an entrepreneurial mindset and skills—what we call “talent”. Characteristics of human resources include young age, education, skills, and an entrepreneurial culture. The local knowledge base is undoubtedly the systemic driving force behind a knowledge-based blue entrepreneurial ecosystem, beyond “talent”, and it often leads to value creation and the identification of profit opportunities (this includes research that produces scientific knowledge combined with sufficient awareness of blue entrepreneurial opportunities).
Finally, intermediaries that provide support services to local businesses often facilitate entry and play a very important role in developing blue business activities that create value and support the sustainability of start-ups in the local blue economy market. In this regard, it is very important to provide support services through local entrepreneurship support structures and raise awareness of blue entrepreneurship, as well as trends and developments in blue economy sectors. Developing a blue entrepreneurial ecosystem in Greek coastal fishing communities will create the conditions necessary for promoting blue entrepreneurship in sectors beyond fishing. This will achieve the desired diversification and stimulation of local economies, as well as the sustainable exploitation and protection of marine resources.
2. Materials and Methods
This article uses the proposed blue entrepreneurial ecosystem model, which takes into account blue framework conditions and blue systemic conditions, to explore the driving forces and barriers to the development of blue entrepreneurship on a pilot basis in five Greek coastal communities that depend on fishing. More specifically, a questionnaire based on the blue entrepreneurial ecosystem model was designed to examine aspects of the blue framework and systemic conditions. This was sent to eighty stakeholders based in the five coastal areas of Greece, whose communities depend on fishing. During the previous programming period (2014–2020), local CLLD/LEADER programs funded by the Greek Operational Program for Fisheries and the Sea 2014–2020 were implemented in these areas. These areas are the islands of the Regional Unit of Attica; the coastal areas of Eastern and Western Thessaloniki; the coastal area of Kavala; and the coastal area of the wider Thessaloniki region (see Figure 3). Participants in the survey were asked to assess the existence of blue ecosystem framework conditions and blue systemic conditions on a five-point Likert scale, and to decide whether these act as driving forces or barriers to blue entrepreneurship in coastal areas where communities depend on fishing for their economy.
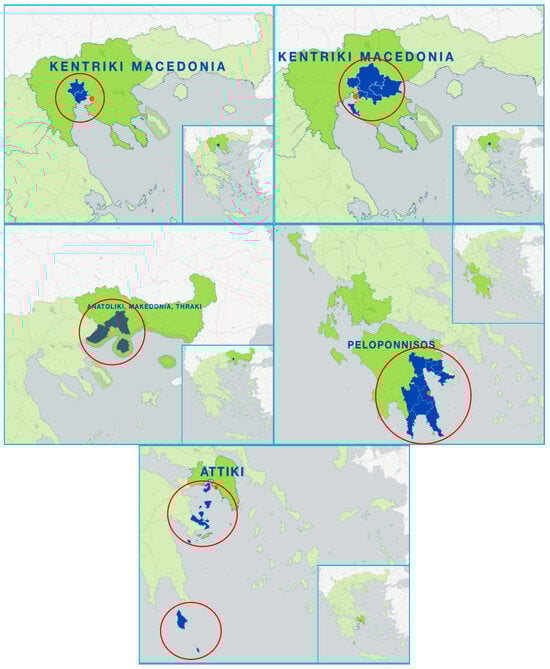
Figure 3.
Coastal fishing communities participating in the survey. Source: WWW.FARNET.ORG in [28].
Of those participating in the survey, 32% represented private companies, while NGOs were slightly less represented, accounting for 13%. Municipalities and professional associations and federations represented 10.0% and 10.0%, respectively. Government bodies (5%) and academics and development agencies (4%) were less well represented, while FLAGs were the least represented, accounting for 2% of the stakeholders who participated in the survey (Table 2).
Table 2.
The structure of the sample of stakeholders who participated in the survey.
The organizations participating in the survey were selected on the basis of their representativeness of the majority of stakeholders and actors involved in and forming part of the respective local blue entrepreneurial ecosystem. These entities comprise representatives who are cognizant of the concept of the blue economy and the policies at both national and European levels that support it. These representatives are either directly or indirectly associated with local business activities. In accordance with the aforementioned points, the following entities are to be considered: private companies, professional associations and unions (including those representing fishermen), universities and research centers, municipalities, central government, development companies and organizations implementing local development programs, FLAGs, and NGOs. The investigation and final selection of the local actors who participated in the research was mostly carried out by the administrations of the Development Companies and Organizations that participated in the Project (Network of Attica Islands, Parnonas Development Organization S.A., Thessaloniki Development Company S.A., Kavala Development Company S.A.), as they had and still have a complete picture of the local actors that can contribute to the research.
The questionnaire employed in the quantitative research comprised predominantly closed questions that could be answered using a five-point Likert scale (1—Strongly disagree, 2—Disagree, 3—Neither agree nor disagree, 4—Agree, and 5—Strongly agree). The development of a questionnaire was informed by the blue entrepreneurial ecosystem approach and the elements that comprise it. The purpose of the questionnaire was to examine every aspect of both the blue ecosystem framework conditions and the systemic conditions of the ecosystem. In order to achieve this, closed questions relating to driving forces or obstacles were incorporated.
To elaborate further, the initial category of inquiries within the blue ecosystem framework conditions in the marine environment encompasses questions concerning the coastal nature of the coastal area (Q1), the presence of sufficient fish stocks (Q5), and the existence of significant wind potential (Q12) as driving forces. In addition, inquiries address environmental pollution caused by blue economy activities (Q23), limited fish stocks (Q5), and the absence of natural resources in the marine and coastal zone that could be commercially exploited (Q16) as barriers to blue entrepreneurship. The second factor, formal institutions, included questions concerning the presence of a university or research center in the intervention area (Q11) as a driving force and the lack of state incentives to support the blue economy (Q10) and the inconsistency of local and regional policies with blue growth policies (Q21) as barriers to blue entrepreneurship. A question was appended to the culture factor regarding the availability of elevated levels of social capital (sense of consensus on a common vision) (Q7) as a driving force for local blue entrepreneurship and the paucity of entrepreneurial culture in the local community (Q2) as an impediment to local maritime entrepreneurship. In consideration of the physical infrastructure as a foundational condition for blue entrepreneurship, inquiries were posed pertaining to the following aspects: the status quo of existing port infrastructure (Q3), the existence of port infrastructure designated for recreational boating (Q6), the presence of substantial land-based cultural heritage within the intervention area (Q14), and the existence of significant underwater cultural heritage in the intervention area (Q15), as potential catalysts for blue local entrepreneurship. Additionally, the absence of cultural resources in the marine and coastal zone that could be commercially exploited (Q17) was identified as a concomitant impediment. The “demand” category comprised questions concerning the short distance from urban centers (Q8), the very good road connection with urban centers (Q9), and the very good ferry connection of the intervention area (Q10) as driving forces for local maritime entrepreneurship, and the long distance from urban centers (Q7) and the small size of the local market (Q13) as obstacles to local blue entrepreneurship.
The second category of questions focused on the systemic conditions of the blue entrepreneurial ecosystem, encompassing networks and the existing cooperation relationships between actors in the Intervention Area and Universities or Research Centers (Q13). This category also addressed as barriers to blue local entrepreneurship the identified conflict between economic activities in the marine and coastal areas (Q8) and the lack of networking with other businesses based in urban centres (Q19).
In relation to the systemic condition of leadership, the inquiry encompassed the substantial local stock of hotel infrastructure (Q2) and the existence of aquaculture units (Q4) as pivotal driving forces. With regard to the systemic condition of financing, the dearth of financial resources for investment in blue growth sectors (Q11) was identified as an impediment to blue local entrepreneurship. In relation to the systemic condition of “talent,” enquiries were made regarding the aging of the local population (Q4), the limited educational attainment of the local population (Q9), and the absence of skilled labor required in blue economy sectors (Q12) as impediments to local blue entrepreneurship. In relation to the systemic condition “Knowledge”, the following questions were posed: first, an inquiry into the awareness of profit opportunities in emerging sectors of the blue economy (Q1); secondly, an examination of the performance of research and innovation at the local level (Q15); and thirdly, a discussion of the paucity of research in emerging sectors of the blue economy (e.g., biotechnology, extraction of precious minerals, and marine energy) (Q18). These factors were identified as impediments to local blue entrepreneurship. Finally, with regard to the “support services” condition, questions were included on topics such as fragmented and incomplete information on current trends and developments in the blue economy sectors (Q3), the lack of public bodies supporting local entrepreneurship (Q14), and ignorance of opportunities through which locally available natural resources can be exploited in emerging sectors of the blue economy (e.g., biotechnology-microalgae, mining of precious minerals, and marine wave or wind energy) (Q20) as obstacles to the development of local blue entrepreneurship.
Firstly, the most significant driving forces and barriers to blue entrepreneurship are presented, according to the responses of the stakeholders who participated in the survey. In the subsequent phase of the study, the responses collected were analyzed and subsequently grouped. The degree of agreement on the contribution of factors as driving forces of blue entrepreneurship was then determined using the average value of the responses on a five-point Likert scale. This process resulted in the creation of a table. The presence of high agreement between responses is indicated by an average value above 4.0, moderate agreement when the value is between 3 and 4, and low agreement when the average value is 3 or below. Finally, the degree of correlation between the responses to different questions was checked by calculating Spearman’s correlation coefficients and discussing mainly the strong positive and negative correlations (where Spearman’s correlation exceeded 0.6).
3. Survey-Based Findings and Their Implications
Table A1 (Appendix A), which is based on the responses of 80 stakeholders and a blue business ecosystem approach, presents the development prospects of Greek coastal areas dependent on fishing, through supporting blue entrepreneurship. Representatives were asked to evaluate the positive or negative impact of the characteristics of Greek coastal regions on the growth or decline of activities beyond fishing. These responses are presented both in aggregate and categorized by stakeholder type: local government representatives, academics, development company and organization representatives, local fisheries action group representatives, business representatives, central government representatives, and professional association and union representatives.
The analysis of the survey participants’ responses revealed a number of local factors that act as driving forces for the development of blue entrepreneurship in Greek coastal fishing communities (Table 3). The coastal nature of coastal fishing communities (agreed upon by 85.0%) combined with their proximity to urban centers (agreed upon by 63.8%) and easy access to them by road (agreed upon by 58.2%) and ferry transport (50%) are key geographical advantages that facilitate access to external markets. Concurrently, the existence of locally available natural and cultural capital, including fish stocks (53.2% agreement), land, and underwater cultural heritage sites (78.8% and 56.4% agreement, respectively), respectively, demonstrates the potential for developing new blue activities in parallel to fishing (maritime tourism, fish processing, coastal tourism, etc.). The survey participants further posit that the existing port infrastructure (56.3% agree) and the existing stock of hotel infrastructure (53.8% agree) are conducive to the development of maritime and coastal tourism activities (Table A1, Appendix A, Figure 4).
Table 3.
Total responses on coastal fisheries communities’ drivers of blue entrepreneurship.
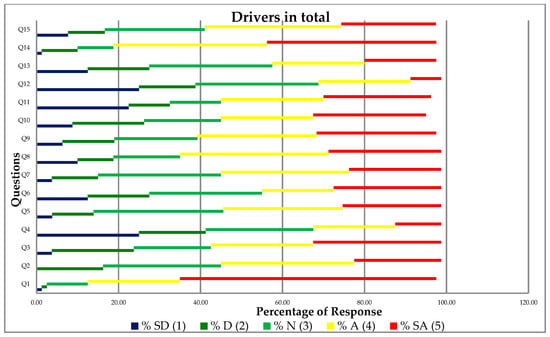
Figure 4.
Total responses on coastal fisheries communities’ drivers of blue entrepreneurship. (SD: Strongly disagree, D: Disagree, N: None, A: Agree, SA: Strongly agree). Source: Own elaboration of the author, 2025.
It is worth noting the disagreement between local stakeholders: on the one hand, representatives of the academic community who believe that wind power and the presence of aquaculture units are the natural driving forces for new blue economy activities (100% of academics agree in both cases) and, on the other hand, local entrepreneurs (only 21.9% and 25% agree, respectively), municipal representatives (only 40% and 20% agree, respectively), and NGO representatives (only 30.8% and 15.4% agree, respectively). The caution shown by entities such as municipalities, NGOs, and local entrepreneurs is possibly due the difficulties faced by small local businesses in entering the aquaculture and wind energy production markets, as well as the reservations of local communities about these specific activities.
Despite the compelling evidence from coastal fishing communities, there are also a number of institutional barriers that must be considered in regional and local planning to support blue entrepreneurship. The absence of any state support for blue entrepreneurship, whether in the form of state incentives, financial, tax, etc. (73.1% agree), or in the form of advisory support, as there are no support structures for local entrepreneurship (such as entrepreneurial incubators, entrepreneurial accelerators, technology transfer offices, etc.) (72.2% agree), stands out as one of the main obstacles. The majority of participants (57%) asserted that the government, in its various national, regional, and local manifestations, has not merely been absent but has frequently been in conflict with European blue growth policies, thereby giving rise to an incompatible institutional framework that engenders heightened business uncertainty and acts as a deterrent to blue investments (Table 4).
Table 4.
Total responses on coastal fisheries communities’ barriers to blue entrepreneurship (Likert scale response contribution 1–5).
Concurrently, the survey emphasizes the prevalence of financial constraints as a significant impediment to blue entrepreneurship. The preponderance of respondents (74.7%) identified the scarcity of financial resources as a significant impediment, as this hinders the implementation of even the most innovative blue economy business concepts. According to the survey results, Greek coastal fishing areas are affected by demographic decline, aging, and migration of younger people to urban centers, with very limited talent pools. The existing human resources are characterized by advanced age (67.1% agree) and a lack of specific skills (76% agree) that could support business development in sectors of the blue economy. At the same time, similar to the broader characteristics of the Greek countryside [50], it is characterized by a lack of entrepreneurial mindset and culture (64.1% agree), further reducing the chances of implementing innovative entrepreneurial ideas that would create blue value. The information received by the local population in coastal fishing communities is fragmentary and incomplete regarding modern trends in blue economy sectors (86.1% agree), which obviously means they are unaware of business opportunities in emerging blue economy sectors (73.4% agree), mainly as a result of institutional barriers and, in particular, the perceived absence of state structures to support local entrepreneurship (72.2% agree).
The findings of this study indicate that private initiative is unable to substitute for the necessary information and knowledge. The data demonstrate that local businesses target a small local market (64.6% agree), while their links with wider networks of businesses based in urban centers are limited (65.8% agree). Concurrently, the emerging conflict of interest between local businesses in different sectors of the blue economy (47.4% agree) is not negligible, which, when combined with the lack of creative consensus among local actors on promoting blue growth (68.4% agree), demonstrates an inherent weakness in taking initiatives to support blue entrepreneurship in a coordinated manner.
Despite the documented proximity of coastal fishing communities to universities and research centers, this potential has not been adequately exploited. The regions demonstrate low levels of innovation at the local level (70.5% agree), and research in emerging sectors of the blue economy (e.g., biotechnology, extraction of precious minerals, marine wave, thermal, or tidal energy, etc.) is also limited (59.5% agree). It is noteworthy that the representatives of the academic community have reached a unanimous consensus that the relevant research produced is limited (100% of academics agree).
Finally, it is important to note the constraints associated with the marine environment, which often prevent the development of blue economy activities in coastal fishing communities. The participants of the survey specifically identified the following barriers, albeit with less emphasis:
- -
- Reduced fish stocks (47.4% agree);
- -
- Environmental pressures on coastal fishing communities from existing blue economy activities (30.4% agree);
- -
- Pressures from local tourism, which often exceeds their carrying capacity (32.9% agree (Figure 5).
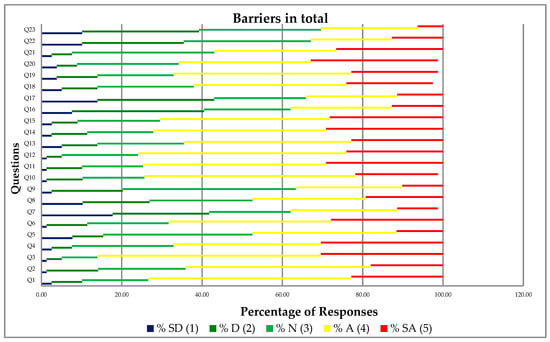 Figure 5. Total responses on coastal fisheries communities’ barriers to blue entrepreneurship (Likert scale response contribution 1–5) (SD: Strongly disagree, D: Disagree, N: None, A: Agree, SA: Strongly agree). Source: Own elaboration of the author, 2025.
The responses were grouped and the degree of agreement on the motivating factors contributing to local blue entrepreneurship was checked. The mean of the responses on a 5-point Likert scale was used to create Table 5. It is noteworthy that responses exhibiting high agreement are characterized by an average value that exceeds 4, moderate agreement is indicated by an average value ranging between 3 and 4, and low agreement is evident when the average value is 3 or below. Among all participating stakeholders, there is a high level of agreement and, by extension, strong support and consensus that the coastal character (Q1) and the significant terrestrial cultural heritage of the fishing community areas (Q14) can be key drivers of local blue entrepreneurship. There is low agreement among the responses referring to the expressed concerns and reservations of all stakeholders that factors such as the presence of aquaculture units (Q4) and significant wind potential (Q12) can act as driving forces for promoting local blue entrepreneurship, reflecting the general caution of the local community about the broader impacts of these blue activities.
Table 5.
Average agreement rating per question—driving force of blue entrepreneurship in Greek coastal fishing communities (mean of five-point Likert scale).
Table 6 displays the level of consensus amongst the stakeholders who participated in the survey, as determined by the mean of their responses on a five-point Likert scale. Among all participating stakeholders, there is high agreement and, by extension, consensus that the fragmented and incomplete information on current trends and developments in blue economy sectors (Q3) is a very significant barrier to the promotion of blue entrepreneurship in fishing communities. Conversely, stakeholders in coastal fishing communities have expressed a lack of consensus in their responses, articulating caution and concern regarding the role of factors such as the absence of commercially viable marine and coastal cultural resources (Q17), the fact that local tourism exceeds the area’s carrying capacity (Q22), and the pollution caused by blue economy activities (Q23).
Table 6.
Average agreement rating per question—barriers to blue entrepreneurship in Greek coastal fishing communities (mean of five-point Likert scale).
The study of the correlation tables (Spearman correlation) of the responses of local stakeholders’ representatives on both the driving forces and the obstacles yielded particularly interesting conclusions. These conclusions support the need for an ecosystem approach to blue entrepreneurship in coastal fishing areas. A robust positive correlation has been identified between stakeholders’ responses to questions E2 (concerning the substantial local stock of hotel infrastructure) and E6. The presence of port infrastructure for recreational boating (which amounts to 0.65) has been identified as a driving force of business entrepreneurship in coastal fishing communities. This strong positive correlation indicates that individuals who perceive significant hotel infrastructure to be a driving force for blue entrepreneurship are also likely to regard the existing port infrastructure as a driving force.
This finding presents these two infrastructures as complementary driving forces and as key infrastructures of an attractive blue entrepreneurship ecosystem. A highly significant positive Spearman correlation is evident in the responses of stakeholders to question Q3. The existing port infrastructure and Q6. The infrastructure pertinent to recreational boating; the coefficient is measured at 0.77. This correlation suggests that the survey participants viewed the two as inextricably linked and potentially complementary port infrastructures. It is evident that the responses of stakeholders recorded in questions Q6 (concerning port infrastructure for recreational boating) and Q7 exhibit an equally high Spearman positive correlation (Table 7).
Table 7.
Correlation analysis of factors that may act as driving forces for blue entrepreneurship in coastal fishing communities, according to the responses of local stakeholders (Spearman correlation matrix).
The findings of this study indicate a positive correlation between high social capital and port infrastructure, emphasizing the coexistence and complementarity of these elements. The analysis suggests that high social capital fosters an active spirit of cooperation, which in turn influences the management of port infrastructure. This study highlights the necessity for combined investments in port infrastructure, underscoring the importance of a collaborative approach to managing and developing these critical assets. The Spearman correlation coefficient was calculated between the responses to question 6. The present paper sets out the case for the development of port infrastructure for the purpose of recreational boating, as well as the allocation of Q13. The existing cooperation between the relevant stakeholders in the intervention area and the universities or research centers (0.61) is also strongly positive. This finding indicates that where adequate tourist port infrastructure is found, there is a high probability of strong links between local stakeholders and the academic and research community. This suggests the presence of a mature business ecosystem that combines infrastructure and scientific support. A highly significant positive Spearman correlation is also observed in the responses to question Q6. The infrastructure for recreational boating and Q10 is to be considered. The intervention area exhibits commendable ferry connections (0.62). This suggests that when survey participants find the maritime tourism port infrastructure adequate, they are very likely to report positive ferry connections in the area. This in turn highlights the attractiveness of the area as a tourist and functional hub for blue entrepreneurship. A robust and significant positive Spearman correlation is observed between responses to Q11. The existence of a university department or research center within the designated assisted area is a prerequisite for the allocation of Q13. The existing cooperation between the actors in the intervention area and the universities or research centers (0.69) demonstrates an expected yet significant link, thereby showing that the presence of a university or research institution has a catalytic effect on networking and joint action with the local community, whilst also enhancing local innovation performance.
A strong positive Spearman’s rank correlation coefficient is evident in the responses of stakeholders to questions about the barriers to blue entrepreneurship that they have identified in coastal fishing areas (see Table 8). A prime example is the positive correlation between responses to questions Q3, which asks about fragmented and incomplete information on current trends and developments in blue economy sectors, and Q10, which asks about the absence of government incentives to support the blue economy (a positive correlation of 0.53). This demonstrates an institutional absence of initiatives at both the national and regional levels to promote the blue economy and entrepreneurship. This results in a lack of information and incentives, thus weakening the basis for its development.
Table 8.
Correlation analysis of factors acting as barriers to blue entrepreneurship in coastal fishing communities according to the responses of local stakeholders (Spearman correlation matrix).
Furthermore, the strong positive correlation between the responses of stakeholders to questions Q6 (Lack of creative consensus among local stakeholders to promote Blue Growth) and Q12 (Lack of skilled labour needed in Blue Economy sectors) (a positive correlation of 0.62) reveals the structural problems of the blue entrepreneurship ecosystem concerning the existing human resources, which are characterized by a lack of social (spirit of cooperation) and technical skills (low specialization).
A strong positive Spearman correlation is also observed in the participants’ responses to question Q6. (lack of consensus exists among local stakeholders with regard to the promotion of blue growth) and Q14 (The absence of public institutions providing support for local entrepreneurship) (a positive correlation of 0.54) unequivocally evidences both the structural relationship and the necessity for coordination and support for collaborative initiatives to formulate a strategy to promote the blue economy through structures that support local entrepreneurship. A highly significant positive Spearman correlation is evident in the responses to question Q10. The absence of government incentives to support the blue economy is a matter of concern (Q11). The absence of financial resources for investment in blue growth sectors (0.78) demonstrates that stakeholders strongly associate public support (incentives) with the availability of financial instruments and resources. This suggests that the absence of state support is the primary factor hindering investment in blue entrepreneurship. It is evident from the data that a strong positive Spearman correlation exists between the responses to question Q11. The absence of financial resources for investment in blue growth sectors and Q12 is a matter of concern. The absence of skilled labor in blue economy sectors (0.6) indicates that survey respondents recognize a correlation between financial limitations and the dearth of skilled personnel. It is evident that investment in the blue economy will generate employment opportunities by attracting skilled professionals. The presence of skilled professionals, in turn, serves as a catalyst for investment capital, thereby underscoring the interdependence between financial resources and skilled personnel in a functional entrepreneurial ecosystem.
A similarly robust positive Spearman correlation is documented in the responses of stakeholders to question Q14. The absence of public institutions that could provide support for local entrepreneurship is a key issue, as is the lack of Q15. The local level exhibited substandard performance in research and innovation (0.64), indicative of their perception of public structures that support entrepreneurship through enhancing research and elevating innovation performance as interconnected components of the business environment. Concurrently, it underscores the necessity for local entrepreneurial support frameworks to provide guidance, establish connections, and disseminate knowledge, thereby enhancing research and augmenting local innovation performance. The subsequent investigation focused on the Spearman positive correlation between the responses to question Q15, which revealed a continuation of the previously observed strong positive correlation. The present study explores the correlation between low research and innovation performance at the local level and Q19. The absence of networking with other businesses in urban centers was found to be a contributing factor (0.66). Participants who evaluate local research and innovation performance as unsatisfactory are highly likely to perceive networking with businesses based in urban centers as deficient. This finding indicates that in order to enhance research and innovation in the blue economy within local business ecosystems, it is necessary to establish interconnectedness with established entrepreneurship ecosystems in urban centers. The present study has demonstrated a robust and significant positive Spearman correlation between the responses of local stakeholders in the survey to question Q16. The absence of marine and coastal natural resources that have the potential for commercial exploitation is a matter of concern (Q17). The absence of marine and coastal cultural resources with commercial viability (0.7) indicates that individuals who perceive the area to be deficient in natural tourism resources are highly likely to conclude that it is also deficient in cultural resources. This is due to the perception of natural and cultural resources as a unified entity, thereby demonstrating a cohesive perception of the limited potential of local resources for the development of the blue entrepreneurship.
4. Conclusions and Policy Recommendations
Exploring the development prospects of blue entrepreneurship in coastal fishing communities is undoubtedly a complex issue requiring a holistic approach and assessment. This article presented the concept of the blue entrepreneurial ecosystem, along with the specific and systemic conditions for blue entrepreneurship. Subsequently, the entrepreneurial ecosystem approach was piloted to assess the growth prospects of blue entrepreneurship in Greek coastal communities dependent on fishing. This highlighted a number of driving forces and obstacles. Examining the driving forces and barriers identified above through a business ecosystem perspective reveals that a combination of systemic conditions in the ecosystem prevents the favorable conditions created by the framework conditions from promoting blue entrepreneurship and, by extension, creating blue value.
Specifically, there is institutional density, with a significant presence of institutions such as universities, research centers, professional associations, clubs, development companies, FLAGs, and active municipalities in close proximity to coastal fishing communities. The existing physical infrastructure, including the characteristics of the coastal zone, available port infrastructure, and land and underwater cultural heritage monuments, is conducive to promoting new blue economy business activities. Additionally, prospects for increased demand exist as access to larger external markets is facilitated by easy access via established road and ferry connections. Culture refers to informal social ties, i.e., a measurable stock of social capital in coastal fishing communities that can contribute to designing and implementing a common vision at the local level under certain conditions.
However, the marine environment appears to be suffering significant damage from existing blue economy activities. Examples include the reduction in fish stocks and environmental pressures on coastal fishing communities, as well as pressure from local tourism, which often exceeds the area’s carrying capacity. In addition to these environmental concerns, stakeholders have expressed systemic weaknesses hindering the development of blue entrepreneurship.
Specifically, existing cooperation networks are limited, as evidenced by the identified conflicts between the activities of existing blue local businesses, the reduced cooperation of local businesses with businesses located in urban centers, and the limited cooperation with nearby universities or research centers. This demonstrates the weak or absent interconnection between systemic factors such as local businesses and other stakeholders with framework conditions, i.e., the presence of formal institutions based in or near coastal fishing communities. Furthermore, the systemic condition factor “networks” exhibits an inadequate correlation with the framework condition factor “demand.” To elaborate, while the presence of well-developed road and ferry networks facilitates access to larger external markets, there is a paucity of interconnection between local businesses and stakeholders and the broader entrepreneurial networks centered in urban areas.
With regard to the “leadership” factor, although there are significant hotel and aquaculture businesses, they do not seem to be able to “draw in” other blue economy initiatives, partly due to the reluctance and caution of the local population towards these specific activities. Furthermore, there is an absence of links with local businesses and other relevant stakeholders. Funding and support services for blue entrepreneurship are found to be among the most problematic systemic conditions, as there is a lack of funding opportunities, regional and local policies are often not aligned with blue growth policies, and there is a complete lack of support structures for local entrepreneurship, which hinders and effectively leads any local blue entrepreneurship initiative to either postponement or failure. Consequently, there is a weak or non-existent link between contextual factors, such as the marine environment and available physical infrastructure, and systemic factors, such as “financing” and “support services”, which are either absent or do not focus on supporting blue entrepreneurship.
Knowledge and information are also weak systemic conditions, as the local population is unaware of entrepreneurial opportunities in emerging blue economy sectors and receives fragmented and incomplete information on current developments in blue economy sectors. Concurrently, the generation of “new” knowledge through research in emerging sectors of the blue economy (e.g., biotechnology, microalgae, the extraction of precious minerals, and sustainable energy) is conducted by proximate universities and research centers. However, local innovation performance is also low, once again demonstrating the weak or incomplete link between framework conditions—in this case, typical university and research center institutions—and the marine environment, as well as systemic factors, knowledge, and networks.
Finally, participants frequently cited the limited talent pool available in coastal fishing communities. The phenomenon under scrutiny in this study is linked to an aging local population, a paucity of an entrepreneurial mindset and culture, and limited specialization in the skills required for businesses in the blue economy, as well as the education provided. This observation once again highlights the inadequate or incomplete correlation between framework factors—in this case, formal university institutions—and systemic factors pertaining to talent and networks. Consequently, while the blue economy ecosystem is generally favorable in coastal fishing communities, the marine environment is heavily polluted. The hypothesis that the systemic conditions are weak and do not allow for the development of blue entrepreneurial activity is one that merits consideration. Furthermore, the existence of gaps and inconsistencies in how the factors interact is another potential contributing factor that should be taken into account.
Undoubtedly, institutional-level initiatives and interventions would boost blue entrepreneurship in coastal fishing areas and provide alternative sources of employment and income for the local population. More specifically, regional and local policies should be harmonized with European policy on supporting the blue economy. This has resulted in the introduction of specific incentives to promote blue entrepreneurship, such as grants and tax relief. Drawing on the experience of Greek coastal fishing communities, local LEADER/CLLD programs could be designed and implemented to promote blue entrepreneurship, with the participation of local stakeholders and fishermen. A change in regional and local policies in favor of blue entrepreneurship would also result in the creation of local support structures, such as blue entrepreneurship incubators [28], blue entrepreneurship accelerators, and blue entrepreneurship support offices, thereby enriching the local support services offered to existing and new blue businesses.
The promotion of maritime spatial planning at regional and local level will contribute to the protection and sustainable use of the marine environment by directly addressing the factors that burden it (such as overfishing and over-tourism). At the same time, it will provide guidelines for addressing any conflicts between maritime economic activities, thereby contributing significantly to strengthening the spirit of cooperation between all stakeholders, while proposing ways to sustainably exploit the coastal and underwater cultural heritage.
The dissemination of information on extant financial instruments and tools (see microcredit, blue “business angels,” blue venture capital, investment law, etc.) beyond the scope of local development programs, potentially through the aforementioned support structures, will provide new avenues for financial support for local blue entrepreneurship.
The enhancement of human resources through training and practical experience in subjects related to new blue economy professions, as well as in subjects that will enhance entrepreneurial culture and entrepreneurial knowledge and skills, will contribute to the enrichment of local talent pools.
Concurrently, within the paradigm of fortifying local entrepreneurial collaboration with academic institutions and research centers, it is imperative to devise incentives to investigate the significance of each distinct blue sector for the local economy [51] and to emphasize local resources that can be utilized commercially through blue entrepreneurship initiatives.
Finally, it is imperative that initiatives and institutional interventions are taken to strengthen networking and cooperation between local stakeholders in the blue economy. The model of blue entrepreneurial clusters has the potential to be a valuable asset, given its capacity to facilitate enhanced collaboration between local businesses, universities, research centers, and other relevant stakeholders. Additionally, it can also foster cooperation between local businesses and businesses located in urban centers.
It is evident that the limited number of participating organizations, despite their selection based on relevance, constitutes a substantial study limitation. Nevertheless, this constitutes a preliminary investigation into the potential of blue entrepreneurship as a means of addressing the necessity for effective diversification strategies for coastal fishing communities. Concurrently, this article proposes a novel holistic approach addressing the fundamental challenge facing coastal fishing communities, namely the need to diversify their local economies. It is acknowledged that the flourishing of local entrepreneurship is the result of numerous local factors, and the adoption and implementation of the blue entrepreneurial ecosystem model I proposed. This novel approach will facilitate the identification of both the factors and their interactions between them, thereby establishing the requisite conditions for the design of the new, effective local strategies.
Funding
The survey was conducted as part of the ‘Blue Growth Incubator Network, Interlocal Cooperation’ Project, funded by LEADER/CLLD Measure 4.3 of the Fisheries and Maritime Affairs Operational Program (OP) 2014–2020 and administered by the Attica Islands Network. The following organizations also participated in the implementation of the project: the Development Organization Parnonas S.A., the Development Agency of Thessaloniki S.A., the Development Agency of Kavala S.A., the Development Agency of Messinia S.A., and the F.L.A.G. of Burgas (Bulgaria).
Institutional Review Board Statement
Ethical review and approval were waived for this study due to Greek Law 4624/2019 (Government Gazette A’137/29.08.2019) which implements and supplements EU General Data Protection Regulation (Regulation (EU) 2016/679-GDPR).
Informed Consent Statement
Informed consent was obtained from all subjects involved in the study.
Data Availability Statement
The original contributions presented in this study are included in the article. Further inquiries can be directed to the corresponding author.
Acknowledgments
The author would like to thank Marinos Beretsos, the administrator of Attica Islands Network, for approving the publication of the survey’s findings. The survey was conducted within the framework of the ‘Blue Growth Incubator Network, Interlocal Cooperation: Blue Growth Incubator Network’, LEADER/CLLD Measure 4.3, Fisheries and Maritime Affairs Operational Program 2014–2020. During the preparation of this manuscript, the author used DeepL Write (free version) and ChatGPT (ver.4.0) in the domains of linguistic enhancement and table and figure preparation. The author has reviewed and edited the output and takes full responsibility for the content of this publication.
Conflicts of Interest
The author declares no conflicts of interest.
Abbreviations
The following abbreviations are used in this manuscript:
| F.A.O. | Food and Agriculture Organization |
| M.R.D.F. | Ministry of Rural Development and Food |
| E.U. | European Union |
| GT | Gross Tonnage |
| kW | kilowatt of engine power |
| E.M.F.F. | European Maritime and Fisheries Fund |
| C.L.L.D. | Community-Led Local Development |
| E.U.M.O.F.A. | European Market Observatory for Fisheries and Aquaculture |
| O.E.C.D. | Organisation for Economic Co-operation and Development |
| U.N.A.P. | United Nations Environment Programme |
| N.G.O. | Non-governmental Organization |
| F.L.A.G. | Fisheries Local Action Group |
Appendix A
Table A1.
Total responses on fisheries communities’ drivers of blue entrepreneurship.
Table A1.
Total responses on fisheries communities’ drivers of blue entrepreneurship.
| Government | |||||||||
| Mean | Sd | % SD (1) | % D (2) | % N (3) | % A (4) | % SA (5) | Disagree (1 + 2) | Agree (4 + 5) | |
| Q1 | 3.33 | 1.51 | 16.67 | 0.00 | 50.00 | 0.00 | 33.33 | 16.67 | 33.33 |
| Q2 | 3.50 | 1.05 | 0.00 | 16.67 | 33.33 | 33.33 | 16.67 | 16.67 | 50.00 |
| Q3 | 3.50 | 1.38 | 0.00 | 33.33 | 16.67 | 16.67 | 33.33 | 33.33 | 50.00 |
| Q4 | 3.67 | 0.82 | 0.00 | 0.00 | 50.00 | 33.33 | 16.67 | 0.00 | 50.00 |
| Q5 | 3.17 | 1.17 | 16.67 | 0.00 | 33.33 | 50.00 | 0.00 | 16.67 | 50.00 |
| Q6 | 3.00 | 1.26 | 16.67 | 0.00 | 66.67 | 0.00 | 16.67 | 16.67 | 16.67 |
| Q7 | 3.33 | 1.03 | 0.00 | 16.67 | 50.00 | 16.67 | 16.67 | 16.67 | 33.33 |
| Q8 | 3.67 | 1.21 | 0.00 | 16.67 | 33.33 | 16.67 | 33.33 | 16.67 | 50.00 |
| Q9 | 4.00 | 1.10 | 0.00 | 16.67 | 0.00 | 50.00 | 33.33 | 16.67 | 83.33 |
| Q10 | 2.17 | 0.75 | 16.67 | 50.00 | 33.33 | 0.00 | 0.00 | 66.67 | 0.00 |
| Q11 | 3.17 | 1.47 | 16.67 | 16.67 | 16.67 | 33.33 | 16.67 | 33.33 | 50.00 |
| Q12 | 2.17 | 1.33 | 50.00 | 0.00 | 33.33 | 16.67 | 0.00 | 50.00 | 16.67 |
| Q13 | 2.67 | 1.03 | 16.67 | 16.67 | 50.00 | 16.67 | 0.00 | 33.33 | 16.67 |
| Q14 | 3.50 | 0.84 | 0.00 | 16.67 | 16.67 | 66.67 | 0.00 | 16.67 | 66.67 |
| Q15 | 3.00 | 1.10 | 16.67 | 0.00 | 50.00 | 33.33 | 0.00 | 16.67 | 33.33 |
| Academics | |||||||||
| Mean | Sd | % SD (1) | % D (2) | % N (3) | % A (4) | % SA (5) | Disagree (1 + 2) | Agree (4 + 5) | |
| Q1 | 4.75 | 0.50 | 0.0 | 0.0 | 0.0 | 25.0 | 75.0 | 0.0 | 100.0 |
| Q2 | 4.25 | 1.50 | 0.0 | 25.0 | 0.0 | 0.0 | 75.0 | 25.0 | 75.0 |
| Q3 | 4.25 | 0.96 | 0.0 | 0.0 | 25.0 | 25.0 | 50.0 | 0.0 | 75.0 |
| Q4 | 4.25 | 0.50 | 0.0 | 0.0 | 0.0 | 75.0 | 25.0 | 0.0 | 100.0 |
| Q5 | 4.75 | 0.50 | 0.0 | 0.0 | 0.0 | 25.0 | 75.0 | 0.0 | 100.0 |
| Q6 | 3.50 | 1.29 | 0.0 | 25.0 | 25.0 | 25.0 | 25.0 | 25.0 | 50.0 |
| Q7 | 3.00 | 1.63 | 25.0 | 0.0 | 50.0 | 0.0 | 25.0 | 25.0 | 25.0 |
| Q8 | 4.00 | 0.82 | 0.0 | 0.0 | 25.0 | 50.0 | 25.0 | 0.0 | 75.0 |
| Q9 | 4.75 | 0.50 | 0.0 | 0.0 | 0.0 | 25.0 | 75.0 | 0.0 | 100.0 |
| Q10 | 3.75 | 1.26 | 0.0 | 25.0 | 0.0 | 50.0 | 25.0 | 25.0 | 75.0 |
| Q11 | 4.50 | 0.58 | 0.0 | 0.0 | 0.0 | 50.0 | 50.0 | 0.0 | 100.0 |
| Q12 | 3.50 | 0.58 | 0.0 | 0.0 | 50.0 | 50.0 | 0.0 | 0.0 | 50.0 |
| Q13 | 3.25 | 1.26 | 0.0 | 25.0 | 50.0 | 0.0 | 25.0 | 25.0 | 25.0 |
| Q14 | 4.50 | 1.00 | 0.0 | 0.0 | 25.0 | 0.0 | 75.0 | 0.0 | 75.0 |
| Q15 | 4.00 | 1.00 | 0.0 | 0.0 | 33.3 | 33.3 | 33.3 | 0.0 | 66.7 |
| NGOs | |||||||||
| Mean | Sd | % SD (1) | % D (2) | % N (3) | % A (4) | % SA (5) | Disagree (1 + 2) | Agree (4 + 5) | |
| Q1 | 4.85 | 0.38 | 0.00 | 0.00 | 0.00 | 15.38 | 84.62 | 0.0 | 100.0 |
| Q2 | 3.31 | 1.03 | 0.00 | 23.08 | 38.46 | 23.08 | 15.38 | 23.1 | 38.5 |
| Q3 | 3.46 | 1.33 | 7.69 | 15.38 | 30.77 | 15.38 | 30.77 | 23.1 | 46.2 |
| Q4 | 2.31 | 1.25 | 30.77 | 30.77 | 23.08 | 7.69 | 7.69 | 61.5 | 15.4 |
| Q5 | 3.85 | 0.90 | 0.00 | 0.00 | 46.15 | 23.08 | 30.77 | 0.0 | 53.8 |
| Q6 | 3.00 | 1.35 | 15.38 | 23.08 | 23.08 | 23.08 | 15.38 | 38.5 | 38.5 |
| Q7 | 3.38 | 1.04 | 0.00 | 23.08 | 30.77 | 30.77 | 15.38 | 23.1 | 46.2 |
| Q8 | 3.54 | 1.66 | 15.38 | 23.08 | 0.00 | 15.38 | 46.15 | 38.5 | 61.5 |
| Q9 | 3.42 | 1.24 | 0.00 | 33.33 | 16.67 | 25.00 | 25.00 | 33.3 | 50.0 |
| Q10 | 3.38 | 1.19 | 7.69 | 15.38 | 23.08 | 38.46 | 15.38 | 23.1 | 53.8 |
| Q11 | 2.08 | 1.19 | 46.15 | 15.38 | 23.08 | 15.38 | 0.00 | 61.5 | 15.4 |
| Q12 | 2.46 | 1.27 | 30.77 | 23.08 | 15.38 | 30.77 | 0.00 | 53.8 | 30.8 |
| Q13 | 2.62 | 0.87 | 7.69 | 38.46 | 38.46 | 15.38 | 0.00 | 46.2 | 15.4 |
| Q14 | 3.92 | 1.26 | 7.69 | 7.69 | 7.69 | 38.46 | 38.46 | 15.4 | 76.9 |
| Q15 | 3.69 | 1.25 | 7.69 | 7.69 | 23.08 | 30.77 | 30.77 | 15.4 | 61.5 |
| Local Entrepreneurs | |||||||||
| Mean | Sd | % SD (1) | % D (2) | % N (3) | % A (4) | % SA (5) | Disagree (1 + 2) | Agree (4 + 5) | |
| Q1 | 4.4 | 1.01 | 0.0 | 0.0 | 6.3 | 28.1 | 62.5 | 0.0 | 90.6 |
| Q2 | 3.6 | 0.87 | 0.0 | 9.4 | 37.5 | 37.5 | 15.6 | 9.4 | 53.1 |
| Q3 | 3.3 | 1.21 | 3.1 | 28.1 | 21.9 | 25.0 | 21.9 | 31.3 | 46.9 |
| Q4 | 2.6 | 1.36 | 28.1 | 21.9 | 25.0 | 12.5 | 12.5 | 50.0 | 25.0 |
| Q5 | 3.5 | 1.12 | 3.2 | 16.1 | 35.5 | 22.6 | 22.6 | 19.4 | 45.2 |
| Q6 | 3.2 | 1.51 | 18.8 | 15.6 | 28.1 | 6.3 | 31.3 | 34.4 | 37.5 |
| Q7 | 3.6 | 1.22 | 6.3 | 12.5 | 28.1 | 25.0 | 28.1 | 18.8 | 53.1 |
| Q8 | 3.5 | 1.37 | 15.6 | 6.3 | 18.8 | 34.4 | 25.0 | 21.9 | 59.4 |
| Q9 | 3.2 | 1.49 | 15.6 | 9.4 | 28.1 | 18.8 | 25.0 | 25.0 | 43.8 |
| Q10 | 3.4 | 1.52 | 12.5 | 9.4 | 25.0 | 15.6 | 34.4 | 21.9 | 50.0 |
| Q11 | 3.0 | 1.61 | 25.0 | 9.4 | 15.6 | 25.0 | 21.9 | 34.4 | 46.9 |
| Q12 | 2.6 | 1.32 | 31.3 | 9.4 | 37.5 | 12.5 | 9.4 | 40.6 | 21.9 |
| Q13 | 3.0 | 1.51 | 18.8 | 15.6 | 25.0 | 15.6 | 21.9 | 34.4 | 37.5 |
| Q14 | 4.1 | 1.03 | 0.0 | 12.5 | 9.4 | 34.4 | 43.8 | 12.5 | 78.1 |
| Q15 | 3.6 | 1.31 | 9.7 | 12.9 | 16.1 | 32.3 | 29.0 | 22.6 | 61.3 |
| Professional Associations and Federations | |||||||||
| Mean | Sd | % SD (1) | % D (2) | % N (3) | % A (4) | % SA (5) | Disagree (1 + 2) | Agree (4 + 5) | |
| Q1 | 4.1 | 0.93 | 0.0 | 0.0 | 33.3 | 22.2 | 44.4 | 0.0 | 66.7 |
| Q2 | 3.9 | 0.93 | 0.0 | 11.1 | 11.1 | 55.6 | 22.2 | 11.1 | 77.8 |
| Q3 | 4.3 | 0.71 | 0.0 | 0.0 | 11.1 | 44.4 | 44.4 | 0.0 | 88.9 |
| Q4 | 2.9 | 1.36 | 22.2 | 11.1 | 33.3 | 22.2 | 11.1 | 33.3 | 33.3 |
| Q5 | 3.4 | 1.13 | 0.0 | 22.2 | 33.3 | 22.2 | 22.2 | 22.2 | 44.4 |
| Q6 | 4.3 | 0.87 | 0.0 | 0.0 | 22.2 | 22.2 | 55.6 | 0.0 | 77.8 |
| Q7 | 4.2 | 0.67 | 0.0 | 0.0 | 11.1 | 55.6 | 33.3 | 0.0 | 88.9 |
| Q8 | 3.2 | 1.20 | 11.1 | 11.1 | 33.3 | 33.3 | 11.1 | 22.2 | 44.4 |
| Q9 | 4.1 | 1.05 | 0.0 | 11.1 | 11.1 | 33.3 | 44.4 | 11.1 | 77.8 |
| Q10 | 3.7 | 1.73 | 0.0 | 11.1 | 11.1 | 22.2 | 44.4 | 11.1 | 66.7 |
| Q11 | 3.8 | 1.79 | 0.0 | 11.1 | 11.1 | 11.1 | 55.6 | 11.1 | 66.7 |
| Q12 | 3.3 | 1.00 | 0.0 | 22.2 | 33.3 | 33.3 | 11.1 | 22.2 | 44.4 |
| Q13 | 4.2 | 0.83 | 0.0 | 0.0 | 22.2 | 33.3 | 44.4 | 0.0 | 77.8 |
| Q14 | 3.8 | 1.56 | 0.0 | 0.0 | 11.1 | 44.4 | 33.3 | 0.0 | 77.8 |
| Q15 | 3.8 | 1.48 | 0.0 | 0.0 | 0.0 | 66.7 | 22.2 | 0.0 | 88.9 |
| Development Agencies/FLAGs | |||||||||
| Mean | Sd | % SD (1) | % D (2) | % N (3) | % A (4) | % SA (5) | Disagree (1 + 2) | Agree (4 + 5) | |
| Q1 | 3.33 | 1.51 | 16.67 | 0.00 | 50.00 | 0.00 | 33.33 | 16.7 | 33.3 |
| Q2 | 3.50 | 1.05 | 0.00 | 16.67 | 33.33 | 33.33 | 16.67 | 16.7 | 50.0 |
| Q3 | 3.50 | 1.38 | 0.00 | 33.33 | 16.67 | 16.67 | 33.33 | 33.3 | 50.0 |
| Q4 | 3.67 | 0.82 | 0.00 | 0.00 | 50.00 | 33.33 | 16.67 | 0.0 | 50.0 |
| Q5 | 3.17 | 1.17 | 16.67 | 0.00 | 33.33 | 50.00 | 0.00 | 16.7 | 50.0 |
| Q6 | 3.00 | 1.26 | 16.67 | 0.00 | 66.67 | 0.00 | 16.67 | 16.7 | 16.7 |
| Q7 | 3.33 | 1.03 | 0.00 | 16.67 | 50.00 | 16.67 | 16.67 | 16.7 | 33.3 |
| Q8 | 3.67 | 1.21 | 0.00 | 16.67 | 33.33 | 16.67 | 33.33 | 16.7 | 50.0 |
| Q9 | 4.00 | 1.10 | 0.00 | 16.67 | 0.00 | 50.00 | 33.33 | 16.7 | 83.3 |
| Q10 | 2.17 | 0.75 | 16.67 | 50.00 | 33.33 | 0.00 | 0.00 | 66.7 | 0.0 |
| Q11 | 3.17 | 1.47 | 16.67 | 16.67 | 16.67 | 33.33 | 16.67 | 33.3 | 50.0 |
| Q12 | 2.17 | 1.33 | 50.00 | 0.00 | 33.33 | 16.67 | 0.00 | 50.0 | 16.7 |
| Q13 | 2.67 | 1.03 | 16.67 | 16.67 | 50.00 | 16.67 | 0.00 | 33.3 | 16.7 |
| Q14 | 3.50 | 0.84 | 0.00 | 16.67 | 16.67 | 66.67 | 0.00 | 16.7 | 66.7 |
| Q15 | 3.00 | 1.10 | 16.67 | 0.00 | 50.00 | 33.33 | 0.00 | 16.7 | 33.3 |
| Municipalities | |||||||||
| Mean | Sd | % SD (1) | % D (2) | % N (3) | % A (4) | % SA (5) | Disagree (1 + 2) | Agree (4 + 5) | |
| Q1 | 4.70 | 0.48 | 0.0 | 0.0 | 0.0 | 30.0 | 70.0 | 0.0 | 100.0 |
| Q2 | 3.70 | 1.34 | 0.0 | 30.0 | 10.0 | 20.0 | 40.0 | 30.0 | 60.0 |
| Q3 | 3.80 | 1.40 | 0.0 | 30.0 | 10.0 | 10.0 | 50.0 | 30.0 | 60.0 |
| Q4 | 2.40 | 1.43 | 40.0 | 10.0 | 30.0 | 10.0 | 10.0 | 50.0 | 20.0 |
| Q5 | 3.50 | 1.27 | 10.0 | 10.0 | 20.0 | 40.0 | 20.0 | 20.0 | 60.0 |
| Q6 | 3.40 | 1.17 | 0.0 | 30.0 | 20.0 | 30.0 | 20.0 | 30.0 | 50.0 |
| Q7 | 3.60 | 0.84 | 0.0 | 10.0 | 30.0 | 50.0 | 10.0 | 10.0 | 60.0 |
| Q8 | 4.30 | 0.67 | 0.0 | 0.0 | 10.0 | 50.0 | 40.0 | 0.0 | 90.0 |
| Q9 | 3.70 | 0.95 | 0.0 | 10.0 | 30.0 | 40.0 | 20.0 | 10.0 | 60.0 |
| Q10 | 3.40 | 1.35 | 0.0 | 40.0 | 10.0 | 20.0 | 30.0 | 40.0 | 50.0 |
| Q11 | 3.60 | 1.65 | 20.0 | 10.0 | 0.0 | 30.0 | 40.0 | 30.0 | 70.0 |
| Q12 | 2.90 | 1.60 | 30.0 | 10.0 | 20.0 | 20.0 | 20.0 | 40.0 | 40.0 |
| Q13 | 3.30 | 1.42 | 20.0 | 0.0 | 30.0 | 30.0 | 20.0 | 20.0 | 50.0 |
| Q14 | 4.40 | 0.97 | 0.0 | 10.0 | 0.0 | 30.0 | 60.0 | 10.0 | 90.0 |
| Q15 | 3.20 | 0.92 | 0.0 | 20.0 | 50.0 | 20.0 | 10.0 | 20.0 | 30.0 |
| Total | |||||||||
| Mean | Sd | % SD (1) | % D (2) | % N (3) | % A (4) | % SA (5) | Disagree (1 + 2) | Agree (4 + 5) | |
| Q1 | 4.37 | 0.97 | 1.25 | 1.25 | 10.00 | 22.50 | 62.50 | 2.5 | 85.0 |
| Q2 | 3.56 | 1.01 | 0.00 | 16.25 | 28.75 | 32.50 | 21.25 | 16.3 | 53.8 |
| Q3 | 3.58 | 1.23 | 3.75 | 20.00 | 18.75 | 25.00 | 31.25 | 23.8 | 56.3 |
| Q4 | 2.74 | 1.34 | 25.00 | 16.25 | 26.25 | 20.00 | 11.25 | 41.3 | 31.3 |
| Q5 | 3.57 | 1.09 | 3.80 | 10.13 | 31.65 | 29.11 | 24.05 | 13.9 | 53.2 |
| Q6 | 3.28 | 1.35 | 12.50 | 15.00 | 27.50 | 17.50 | 26.25 | 27.5 | 43.8 |
| Q7 | 3.55 | 1.08 | 3.75 | 11.25 | 30.00 | 31.25 | 22.50 | 15.0 | 53.8 |
| Q8 | 3.60 | 1.26 | 10.00 | 8.75 | 16.25 | 36.25 | 27.50 | 18.8 | 63.8 |
| Q9 | 3.56 | 1.28 | 6.33 | 12.66 | 20.25 | 29.11 | 29.11 | 19.0 | 58.2 |
| Q10 | 3.29 | 1.46 | 8.75 | 17.50 | 18.75 | 22.50 | 27.50 | 26.3 | 50.0 |
| Q11 | 3.13 | 1.60 | 22.50 | 10.00 | 12.50 | 25.00 | 26.25 | 32.5 | 51.3 |
| Q12 | 2.72 | 1.28 | 25.00 | 13.75 | 30.00 | 22.50 | 7.50 | 38.8 | 30.0 |
| Q13 | 3.12 | 1.31 | 12.50 | 15.00 | 30.00 | 22.50 | 17.50 | 27.5 | 40.0 |
| Q14 | 4.03 | 1.09 | 1.25 | 8.75 | 8.75 | 37.50 | 41.25 | 10.0 | 78.8 |
| Q15 | 3.49 | 1.24 | 7.69 | 8.97 | 24.36 | 33.33 | 23.08 | 16.7 | 56.4 |
(Sd: Standard deviation, SD: Strongly disagree, D: Disagree, N: None, A: Agree, SA: Strongly agree). Source: Own elaboration of the author, 2025.
Table A2.
Total responses on fisheries communities’ barriers to blue entrepreneurship.
Table A2.
Total responses on fisheries communities’ barriers to blue entrepreneurship.
| Government | |||||||||
| Mean | Sd | % SD (1) | % D (2) | % N (3) | % A (4) | % SA (5) | Disagree (1 + 2) | Agree (4 + 5) | |
| Q1 | 3.75 | 0.50 | 0.00 | 0.00 | 25.00 | 75.00 | 0.00 | 0.00 | 75.00 |
| Q2 | 3.50 | 1.00 | 0.00 | 0.00 | 75.00 | 0.00 | 25.00 | 0.00 | 25.00 |
| Q3 | 3.50 | 1.29 | 0.00 | 25.00 | 25.00 | 25.00 | 25.00 | 25.00 | 50.00 |
| Q4 | 3.50 | 1.73 | 0.00 | 50.00 | 0.00 | 0.00 | 50.00 | 50.00 | 50.00 |
| Q5 | 2.50 | 1.29 | 25.00 | 25.00 | 25.00 | 25.00 | 0.00 | 50.00 | 25.00 |
| Q6 | 3.25 | 0.50 | 0.00 | 0.00 | 75.00 | 25.00 | 0.00 | 0.00 | 25.00 |
| Q7 | 1.75 | 0.96 | 50.00 | 25.00 | 25.00 | 0.00 | 0.00 | 75.00 | 0.00 |
| Q8 | 3.25 | 0.96 | 0.00 | 25.00 | 25.00 | 50.00 | 0.00 | 25.00 | 50.00 |
| Q9 | 2.75 | 1.26 | 25.00 | 0.00 | 50.00 | 25.00 | 0.00 | 25.00 | 25.00 |
| Q10 | 3.25 | 0.96 | 0.00 | 25.00 | 25.00 | 50.00 | 0.00 | 25.00 | 50.00 |
| Q11 | 3.25 | 0.96 | 0.00 | 25.00 | 25.00 | 50.00 | 0.00 | 25.00 | 50.00 |
| Q12 | 3.25 | 0.96 | 0.00 | 25.00 | 25.00 | 50.00 | 0.00 | 25.00 | 50.00 |
| Q13 | 2.25 | 1.26 | 25.00 | 50.00 | 0.00 | 25.00 | 0.00 | 75.00 | 25.00 |
| Q14 | 3.00 | 1.41 | 25.00 | 0.00 | 25.00 | 50.00 | 0.00 | 25.00 | 50.00 |
| Q15 | 2.75 | 0.96 | 0.00 | 50.00 | 25.00 | 25.00 | 0.00 | 50.00 | 25.00 |
| Q16 | 2.25 | 1.26 | 25.00 | 50.00 | 0.00 | 25.00 | 0.00 | 75.00 | 25.00 |
| Q17 | 1.75 | 0.50 | 25.00 | 75.00 | 0.00 | 0.00 | 0.00 | 100.00 | 0.00 |
| Q18 | 2.50 | 1.00 | 25.00 | 0.00 | 75.00 | 0.00 | 0.00 | 25.00 | 0.00 |
| Q19 | 2.75 | 0.50 | 0.00 | 25.00 | 75.00 | 0.00 | 0.00 | 25.00 | 0.00 |
| Q20 | 3.00 | 1.41 | 25.00 | 0.00 | 25.00 | 50.00 | 0.00 | 25.00 | 50.00 |
| Q21 | 3.25 | 0.50 | 0.00 | 0.00 | 75.00 | 25.00 | 0.00 | 0.00 | 25.00 |
| Q22 | 2.75 | 1.71 | 25.00 | 25.00 | 25.00 | 0.00 | 25.00 | 50.00 | 25.00 |
| Q23 | 3.25 | 0.96 | 0.00 | 25.00 | 25.00 | 50.00 | 0.00 | 25.00 | 50.00 |
| Academics | |||||||||
| Mean | Sd | % SD (1) | % D (2) | % N (3) | % A (4) | % SA (5) | Disagree (1 + 2) | Agree (4 + 5) | |
| Q1 | 3.75 | 0.50 | 0.00 | 0.00 | 25.00 | 75.00 | 0.00 | 0.00 | 75.00 |
| Q2 | 4.00 | 0.82 | 0.00 | 0.00 | 25.00 | 50.00 | 25.00 | 0.00 | 75.00 |
| Q3 | 4.25 | 0.50 | 0.00 | 0.00 | 0.00 | 75.00 | 25.00 | 0.00 | 100.00 |
| Q4 | 4.00 | 1.15 | 0.00 | 0.00 | 50.00 | 0.00 | 50.00 | 0.00 | 50.00 |
| Q5 | 2.25 | 0.96 | 25.00 | 25.00 | 50.00 | 0.00 | 0.00 | 50.00 | 0.00 |
| Q6 | 4.00 | 0.82 | 0.00 | 0.00 | 25.00 | 50.00 | 25.00 | 0.00 | 75.00 |
| Q7 | 2.75 | 1.26 | 25.00 | 0.00 | 50.00 | 25.00 | 0.00 | 25.00 | 25.00 |
| Q8 | 3.75 | 0.50 | 0.00 | 0.00 | 25.00 | 75.00 | 0.00 | 0.00 | 75.00 |
| Q9 | 2.75 | 0.96 | 0.00 | 50.00 | 25.00 | 25.00 | 0.00 | 50.00 | 25.00 |
| Q10 | 3.75 | 0.50 | 0.00 | 0.00 | 25.00 | 75.00 | 0.00 | 0.00 | 75.00 |
| Q11 | 3.75 | 0.50 | 0.00 | 0.00 | 25.00 | 75.00 | 0.00 | 0.00 | 75.00 |
| Q12 | 4.25 | 0.50 | 0.00 | 0.00 | 0.00 | 75.00 | 25.00 | 0.00 | 100.00 |
| Q13 | 4.50 | 0.58 | 0.00 | 0.00 | 0.00 | 50.00 | 50.00 | 0.00 | 100.00 |
| Q14 | 4.50 | 0.58 | 0.00 | 0.00 | 0.00 | 50.00 | 50.00 | 0.00 | 100.00 |
| Q15 | 4.25 | 0.50 | 0.00 | 0.00 | 0.00 | 75.00 | 25.00 | 0.00 | 100.00 |
| Q16 | 2.50 | 1.73 | 25.00 | 50.00 | 0.00 | 0.00 | 25.00 | 75.00 | 25.00 |
| Q17 | 2.25 | 1.26 | 25.00 | 50.00 | 0.00 | 25.00 | 0.00 | 75.00 | 25.00 |
| Q18 | 4.50 | 0.58 | 0.00 | 0.00 | 0.00 | 50.00 | 50.00 | 0.00 | 100.00 |
| Q19 | 4.25 | 0.50 | 0.00 | 0.00 | 0.00 | 75.00 | 25.00 | 0.00 | 100.00 |
| Q20 | 4.25 | 0.50 | 0.00 | 0.00 | 0.00 | 75.00 | 25.00 | 0.00 | 100.00 |
| Q21 | 4.75 | 0.50 | 0.00 | 0.00 | 0.00 | 25.00 | 75.00 | 0.00 | 100.00 |
| Q22 | 3.00 | 1.41 | 0.00 | 50.00 | 25.00 | 0.00 | 25.00 | 50.00 | 25.00 |
| Q23 | 3.75 | 0.50 | 0.00 | 0.00 | 25.00 | 75.00 | 0.00 | 0.00 | 75.00 |
| NGOs | |||||||||
| Mean | Sd | % SD (1) | % D (2) | % N (3) | % A (4) | % SA (5) | Disagree (1 + 2) | Agree (4 + 5) | |
| Q1 | 3.77 | 1.01 | 0.00 | 15.38 | 15.38 | 46.15 | 23.08 | 15.38 | 69.23 |
| Q2 | 3.58 | 0.79 | 0.00 | 8.33 | 33.33 | 50.00 | 8.33 | 8.33 | 58.33 |
| Q3 | 4.15 | 0.55 | 0.00 | 0.00 | 7.69 | 69.23 | 23.08 | 0.00 | 92.31 |
| Q4 | 4.31 | 0.75 | 0.00 | 0.00 | 15.38 | 38.46 | 46.15 | 0.00 | 84.62 |
| Q5 | 3.38 | 0.96 | 7.69 | 0.00 | 46.15 | 38.46 | 7.69 | 7.69 | 46.15 |
| Q6 | 3.62 | 0.96 | 0.00 | 15.38 | 23.08 | 46.15 | 15.38 | 15.38 | 61.54 |
| Q7 | 2.85 | 1.52 | 23.08 | 30.77 | 0.00 | 30.77 | 15.38 | 53.85 | 46.15 |
| Q8 | 2.85 | 1.57 | 23.08 | 30.77 | 7.69 | 15.38 | 23.08 | 53.85 | 38.46 |
| Q9 | 3.08 | 1.04 | 0.00 | 30.77 | 46.15 | 7.69 | 15.38 | 30.77 | 23.08 |
| Q10 | 3.85 | 0.80 | 0.00 | 7.69 | 15.38 | 61.54 | 15.38 | 7.69 | 76.92 |
| Q11 | 3.62 | 0.96 | 0.00 | 15.38 | 23.08 | 46.15 | 15.38 | 15.38 | 61.54 |
| Q12 | 3.85 | 0.55 | 0.00 | 7.69 | 0.00 | 92.31 | 0.00 | 7.69 | 92.31 |
| Q13 | 3.85 | 0.90 | 0.00 | 7.69 | 23.08 | 46.15 | 23.08 | 7.69 | 69.23 |
| Q14 | 4.00 | 0.82 | 0.00 | 7.69 | 7.69 | 61.54 | 23.08 | 7.69 | 84.62 |
| Q15 | 3.85 | 0.69 | 0.00 | 0.00 | 30.77 | 53.85 | 15.38 | 0.00 | 69.23 |
| Q16 | 2.85 | 1.34 | 15.38 | 30.77 | 23.08 | 15.38 | 15.38 | 46.15 | 30.77 |
| Q17 | 2.77 | 1.36 | 23.08 | 23.08 | 15.38 | 30.77 | 7.69 | 46.15 | 38.46 |
| Q18 | 3.54 | 1.05 | 0.00 | 23.08 | 15.38 | 46.15 | 15.38 | 23.08 | 61.54 |
| Q19 | 3.54 | 1.13 | 0.00 | 23.08 | 23.08 | 30.77 | 23.08 | 23.08 | 53.85 |
| Q20 | 3.77 | 1.01 | 0.00 | 7.69 | 38.46 | 23.08 | 30.77 | 7.69 | 53.85 |
| Q21 | 3.92 | 0.86 | 0.00 | 7.69 | 15.38 | 53.85 | 23.08 | 7.69 | 76.92 |
| Q22 | 3.31 | 1.32 | 7.69 | 23.08 | 23.08 | 23.08 | 23.08 | 30.77 | 46.15 |
| Q23 | 2.62 | 1.04 | 15.38 | 30.77 | 30.77 | 23.08 | 0.00 | 46.15 | 23.08 |
| Local Entrepreneurs | |||||||||
| Mean | Sd | % SD (1) | % D (2) | % N (3) | % A (4) | % SA (5) | Disagree (1 + 2) | Agree (4 + 5) | |
| Q1 | 4.38 | 0.85 | 0.00 | 0.00 | 0.00 | 62.50 | 37.50 | 0.00 | 100.00 |
| Q2 | 4.00 | 0.75 | 0.00 | 0.00 | 37.50 | 25.00 | 37.50 | 0.00 | 62.50 |
| Q3 | 4.00 | 0.81 | 0.00 | 12.50 | 0.00 | 62.50 | 25.00 | 12.50 | 87.50 |
| Q4 | 3.50 | 1.10 | 0.00 | 12.50 | 37.50 | 37.50 | 12.50 | 12.50 | 50.00 |
| Q5 | 3.00 | 1.08 | 12.50 | 25.00 | 25.00 | 25.00 | 12.50 | 37.50 | 37.50 |
| Q6 | 4.00 | 1.00 | 0.00 | 12.50 | 12.50 | 37.50 | 37.50 | 12.50 | 75.00 |
| Q7 | 3.25 | 1.36 | 25.00 | 0.00 | 25.00 | 25.00 | 25.00 | 25.00 | 50.00 |
| Q8 | 2.86 | 1.12 | 14.29 | 28.57 | 28.57 | 14.29 | 14.29 | 42.86 | 28.57 |
| Q9 | 3.63 | 0.80 | 0.00 | 12.50 | 25.00 | 50.00 | 12.50 | 12.50 | 62.50 |
| Q10 | 3.13 | 1.31 | 0.00 | 25.00 | 12.50 | 25.00 | 25.00 | 25.00 | 50.00 |
| Q11 | 4.13 | 0.88 | 0.00 | 12.50 | 12.50 | 25.00 | 50.00 | 12.50 | 75.00 |
| Q12 | 4.13 | 0.86 | 0.00 | 0.00 | 25.00 | 37.50 | 37.50 | 0.00 | 75.00 |
| Q13 | 3.50 | 1.10 | 0.00 | 25.00 | 12.50 | 50.00 | 12.50 | 25.00 | 62.50 |
| Q14 | 4.25 | 1.12 | 0.00 | 12.50 | 0.00 | 37.50 | 50.00 | 12.50 | 87.50 |
| Q15 | 3.88 | 1.25 | 12.50 | 12.50 | 0.00 | 25.00 | 50.00 | 25.00 | 75.00 |
| Q16 | 3.00 | 1.12 | 12.50 | 25.00 | 12.50 | 50.00 | 0.00 | 37.50 | 50.00 |
| Q17 | 3.00 | 1.15 | 12.50 | 12.50 | 37.50 | 37.50 | 0.00 | 25.00 | 37.50 |
| Q18 | 3.13 | 1.50 | 12.50 | 0.00 | 25.00 | 25.00 | 25.00 | 12.50 | 50.00 |
| Q19 | 3.50 | 1.50 | 12.50 | 0.00 | 0.00 | 37.50 | 37.50 | 12.50 | 75.00 |
| Q20 | 3.38 | 1.43 | 0.00 | 12.50 | 25.00 | 12.50 | 37.50 | 12.50 | 50.00 |
| Q21 | 3.50 | 1.32 | 12.50 | 0.00 | 37.50 | 25.00 | 25.00 | 12.50 | 50.00 |
| Q22 | 2.88 | 1.26 | 12.50 | 12.50 | 50.00 | 25.00 | 0.00 | 25.00 | 25.00 |
| Q23 | 2.00 | 1.29 | 37.50 | 37.50 | 12.50 | 12.50 | 0.00 | 75.00 | 12.50 |
| Professional Associations and Federations | |||||||||
| Mean | Sd | % SD (1) | % D (2) | % N (3) | % A (4) | % SA (5) | Disagree (1 + 2) | Agree (4 + 5) | |
| Q1 | 3.67 | 0.82 | 0.00 | 0.00 | 50.00 | 33.33 | 16.67 | 0.00 | 50.00 |
| Q2 | 4.00 | 0.63 | 0.00 | 0.00 | 16.67 | 66.67 | 16.67 | 0.00 | 83.33 |
| Q3 | 4.17 | 0.41 | 0.00 | 0.00 | 0.00 | 83.33 | 16.67 | 0.00 | 100.00 |
| Q4 | 3.67 | 0.52 | 0.00 | 0.00 | 33.33 | 66.67 | 0.00 | 0.00 | 66.67 |
| Q5 | 4.00 | 0.63 | 0.00 | 0.00 | 16.67 | 66.67 | 16.67 | 0.00 | 83.33 |
| Q6 | 3.83 | 1.17 | 0.00 | 16.67 | 16.67 | 33.33 | 33.33 | 16.67 | 66.67 |
| Q7 | 2.67 | 0.82 | 0.00 | 50.00 | 33.33 | 16.67 | 0.00 | 50.00 | 16.67 |
| Q8 | 3.50 | 1.05 | 0.00 | 16.67 | 33.33 | 33.33 | 16.67 | 16.67 | 50.00 |
| Q9 | 3.00 | 0.00 | 0.00 | 0.00 | 100.00 | 0.00 | 0.00 | 0.00 | 0.00 |
| Q10 | 4.17 | 0.75 | 0.00 | 0.00 | 16.67 | 50.00 | 33.33 | 0.00 | 83.33 |
| Q11 | 4.00 | 1.10 | 0.00 | 16.67 | 0.00 | 50.00 | 33.33 | 16.67 | 83.33 |
| Q12 | 4.00 | 0.63 | 0.00 | 0.00 | 16.67 | 66.67 | 16.67 | 0.00 | 83.33 |
| Q13 | 4.00 | 0.63 | 0.00 | 0.00 | 16.67 | 66.67 | 16.67 | 0.00 | 83.33 |
| Q14 | 4.33 | 0.52 | 0.00 | 0.00 | 0.00 | 66.67 | 33.33 | 0.00 | 100.00 |
| Q15 | 4.20 | 0.84 | 0.00 | 0.00 | 20.00 | 40.00 | 40.00 | 0.00 | 80.00 |
| Q16 | 2.83 | 0.98 | 0.00 | 50.00 | 16.67 | 33.33 | 0.00 | 50.00 | 33.33 |
| Q17 | 3.00 | 1.26 | 0.00 | 50.00 | 16.67 | 16.67 | 16.67 | 50.00 | 33.33 |
| Q18 | 3.17 | 1.72 | 0.00 | 0.00 | 33.33 | 33.33 | 16.67 | 0.00 | 50.00 |
| Q19 | 3.50 | 0.84 | 0.00 | 16.67 | 16.67 | 66.67 | 0.00 | 16.67 | 66.67 |
| Q20 | 4.33 | 0.52 | 0.00 | 0.00 | 0.00 | 66.67 | 33.33 | 0.00 | 100.00 |
| Q21 | 4.00 | 0.89 | 0.00 | 0.00 | 33.33 | 33.33 | 33.33 | 0.00 | 66.67 |
| Q22 | 2.17 | 0.75 | 16.67 | 50.00 | 33.33 | 0.00 | 0.00 | 66.67 | 0.00 |
| Q23 | 3.17 | 1.17 | 0.00 | 33.33 | 33.33 | 16.67 | 16.67 | 33.33 | 33.33 |
| Development Agencies/FLAGs | |||||||||
| Mean | Sd | % SD (1) | % D (2) | % N (3) | % A (4) | % SA (5) | Disagree (1 + 2) | Agree (4 + 5) | |
| Q1 | 3.67 | 1.37 | 16.67 | 0.00 | 0.00 | 66.67 | 16.67 | 16.67 | 83.33 |
| Q2 | 3.50 | 1.22 | 0.00 | 33.33 | 0.00 | 50.00 | 16.67 | 33.33 | 66.67 |
| Q3 | 3.83 | 1.47 | 16.67 | 0.00 | 0.00 | 50.00 | 33.33 | 16.67 | 83.33 |
| Q4 | 3.17 | 1.17 | 16.67 | 0.00 | 33.33 | 50.00 | 0.00 | 16.67 | 50.00 |
| Q5 | 2.67 | 1.03 | 16.67 | 16.67 | 50.00 | 16.67 | 0.00 | 33.33 | 16.67 |
| Q6 | 3.50 | 1.38 | 16.67 | 0.00 | 16.67 | 50.00 | 16.67 | 16.67 | 66.67 |
| Q7 | 1.67 | 1.37 | 33.33 | 33.33 | 0.00 | 16.67 | 0.00 | 66.67 | 16.67 |
| Q8 | 2.83 | 1.47 | 16.67 | 33.33 | 16.67 | 16.67 | 16.67 | 50.00 | 33.33 |
| Q9 | 2.83 | 0.98 | 0.00 | 50.00 | 16.67 | 33.33 | 0.00 | 50.00 | 33.33 |
| Q10 | 3.17 | 1.33 | 16.67 | 16.67 | 0.00 | 66.67 | 0.00 | 33.33 | 66.67 |
| Q11 | 3.00 | 1.55 | 16.67 | 33.33 | 0.00 | 33.33 | 16.67 | 50.00 | 50.00 |
| Q12 | 3.33 | 1.37 | 16.67 | 0.00 | 33.33 | 33.33 | 16.67 | 16.67 | 50.00 |
| Q13 | 2.50 | 1.38 | 33.33 | 16.67 | 16.67 | 33.33 | 0.00 | 50.00 | 33.33 |
| Q14 | 2.67 | 1.21 | 16.67 | 33.33 | 16.67 | 33.33 | 0.00 | 50.00 | 33.33 |
| Q15 | 3.17 | 1.17 | 16.67 | 0.00 | 33.33 | 50.00 | 0.00 | 16.67 | 50.00 |
| Q16 | 2.83 | 1.17 | 0.00 | 50.00 | 33.33 | 0.00 | 16.67 | 50.00 | 16.67 |
| Q17 | 3.17 | 1.17 | 0.00 | 33.33 | 33.33 | 16.67 | 16.67 | 33.33 | 33.33 |
| Q18 | 3.50 | 1.38 | 16.67 | 0.00 | 16.67 | 50.00 | 16.67 | 16.67 | 66.67 |
| Q19 | 3.50 | 1.38 | 16.67 | 0.00 | 16.67 | 50.00 | 16.67 | 16.67 | 66.67 |
| Q20 | 3.33 | 1.63 | 16.67 | 16.67 | 16.67 | 16.67 | 33.33 | 33.33 | 50.00 |
| Q21 | 3.83 | 0.98 | 0.00 | 0.00 | 50.00 | 16.67 | 33.33 | 0.00 | 50.00 |
| Q22 | 3.00 | 0.89 | 0.00 | 33.33 | 33.33 | 33.33 | 0.00 | 33.33 | 33.33 |
| Q23 | 2.33 | 0.52 | 0.00 | 66.67 | 33.33 | 0.00 | 0.00 | 66.67 | 0.00 |
| Municipalities | |||||||||
| Mean | Sd | % SD (1) | % D (2) | % N (3) | % A (4) | % SA (5) | Disagree (1 + 2) | Agree (4 + 5) | |
| Q1 | 3.60 | 1.07 | 0.00 | 20.00 | 20.00 | 40.00 | 20.00 | 20.00 | 60.00 |
| Q2 | 2.90 | 0.99 | 0.00 | 50.00 | 10.00 | 40.00 | 0.00 | 50.00 | 40.00 |
| Q3 | 4.10 | 1.10 | 0.00 | 10.00 | 20.00 | 20.00 | 50.00 | 10.00 | 70.00 |
| Q4 | 4.00 | 1.05 | 0.00 | 10.00 | 20.00 | 30.00 | 40.00 | 10.00 | 70.00 |
| Q5 | 3.80 | 0.63 | 0.00 | 0.00 | 30.00 | 60.00 | 10.00 | 0.00 | 70.00 |
| Q6 | 3.80 | 1.14 | 0.00 | 20.00 | 10.00 | 40.00 | 30.00 | 20.00 | 70.00 |
| Q7 | 2.50 | 1.27 | 30.00 | 20.00 | 20.00 | 30.00 | 0.00 | 50.00 | 30.00 |
| Q8 | 3.60 | 1.58 | 10.00 | 20.00 | 20.00 | 0.00 | 50.00 | 30.00 | 50.00 |
| Q9 | 3.20 | 1.23 | 10.00 | 20.00 | 20.00 | 40.00 | 10.00 | 30.00 | 50.00 |
| Q10 | 4.30 | 0.48 | 0.00 | 0.00 | 0.00 | 70.00 | 30.00 | 0.00 | 100.00 |
| Q11 | 4.20 | 0.63 | 0.00 | 0.00 | 10.00 | 60.00 | 30.00 | 0.00 | 90.00 |
| Q12 | 4.10 | 0.99 | 0.00 | 10.00 | 10.00 | 40.00 | 40.00 | 10.00 | 80.00 |
| Q13 | 3.80 | 0.92 | 0.00 | 10.00 | 20.00 | 50.00 | 20.00 | 10.00 | 70.00 |
| Q14 | 3.90 | 0.88 | 0.00 | 10.00 | 10.00 | 60.00 | 20.00 | 10.00 | 80.00 |
| Q15 | 4.30 | 0.48 | 0.00 | 0.00 | 0.00 | 70.00 | 30.00 | 0.00 | 100.00 |
| Q16 | 3.40 | 0.97 | 0.00 | 20.00 | 30.00 | 40.00 | 10.00 | 20.00 | 50.00 |
| Q17 | 2.80 | 1.48 | 20.00 | 30.00 | 20.00 | 10.00 | 20.00 | 50.00 | 30.00 |
| Q18 | 3.90 | 0.74 | 0.00 | 0.00 | 30.00 | 50.00 | 20.00 | 0.00 | 70.00 |
| Q19 | 3.80 | 0.79 | 0.00 | 10.00 | 10.00 | 70.00 | 10.00 | 10.00 | 80.00 |
| Q20 | 4.10 | 0.99 | 0.00 | 10.00 | 10.00 | 40.00 | 40.00 | 10.00 | 80.00 |
| Q21 | 3.50 | 0.71 | 0.00 | 10.00 | 30.00 | 60.00 | 0.00 | 10.00 | 60.00 |
| Q22 | 2.50 | 1.18 | 10.00 | 60.00 | 10.00 | 10.00 | 10.00 | 70.00 | 20.00 |
| Q23 | 3.50 | 1.08 | 0.00 | 20.00 | 30.00 | 30.00 | 20.00 | 20.00 | 50.00 |
| Total | |||||||||
| Mean | Sd | % SD (1) | % D (2) | % N (3) | % A (4) | % SA (5) | Disagree (1 + 2) | Agree (4 + 5) | |
| Q1 | 3.84 | 0.95 | 2.53 | 7.59 | 16.46 | 50.63 | 22.78 | 10.13 | 73.42 |
| Q2 | 3.67 | 0.96 | 1.28 | 12.82 | 21.79 | 46.15 | 17.95 | 14.10 | 64.10 |
| Q3 | 4.10 | 0.81 | 1.27 | 3.80 | 8.86 | 55.70 | 30.38 | 5.06 | 86.08 |
| Q4 | 3.87 | 0.99 | 2.53 | 5.06 | 25.32 | 36.71 | 30.38 | 7.59 | 67.09 |
| Q5 | 3.36 | 1.04 | 7.69 | 7.69 | 37.18 | 35.90 | 11.54 | 15.38 | 47.44 |
| Q6 | 3.84 | 0.99 | 1.27 | 10.13 | 20.25 | 40.51 | 27.85 | 11.39 | 68.35 |
| Q7 | 2.84 | 1.31 | 17.72 | 24.05 | 20.25 | 26.58 | 10.13 | 41.77 | 36.71 |
| Q8 | 3.29 | 1.25 | 10.26 | 16.67 | 25.64 | 28.21 | 19.23 | 26.92 | 47.44 |
| Q9 | 3.24 | 0.95 | 2.53 | 17.72 | 43.04 | 26.58 | 10.13 | 20.25 | 36.71 |
| Q10 | 3.78 | 1.00 | 1.28 | 8.97 | 15.38 | 52.56 | 20.51 | 10.26 | 73.08 |
| Q11 | 3.92 | 0.96 | 1.27 | 8.86 | 15.19 | 45.57 | 29.11 | 10.13 | 74.68 |
| Q12 | 3.94 | 0.84 | 1.27 | 3.80 | 18.99 | 51.90 | 24.05 | 5.06 | 75.95 |
| Q13 | 3.68 | 1.08 | 5.06 | 8.86 | 21.52 | 41.77 | 22.78 | 13.92 | 64.56 |
| Q14 | 3.87 | 1.02 | 2.53 | 8.86 | 16.46 | 43.04 | 29.11 | 11.39 | 72.15 |
| Q15 | 3.87 | 0.99 | 2.56 | 6.41 | 20.51 | 42.31 | 28.21 | 8.97 | 70.51 |
| Q16 | 3.03 | 1.19 | 7.59 | 32.91 | 21.52 | 25.32 | 12.66 | 40.51 | 37.97 |
| Q17 | 2.89 | 1.24 | 13.92 | 29.11 | 22.78 | 22.78 | 11.39 | 43.04 | 34.18 |
| Q18 | 3.54 | 1.22 | 5.06 | 8.86 | 24.05 | 37.97 | 21.52 | 13.92 | 59.49 |
| Q19 | 3.66 | 1.12 | 3.80 | 10.13 | 18.99 | 44.30 | 21.52 | 13.92 | 65.82 |
| Q20 | 3.80 | 1.14 | 3.80 | 5.06 | 25.32 | 32.91 | 31.65 | 8.86 | 64.56 |
| Q21 | 3.73 | 1.00 | 2.53 | 5.06 | 35.44 | 30.38 | 26.58 | 7.59 | 56.96 |
| Q22 | 3.00 | 1.18 | 10.13 | 25.32 | 31.65 | 20.25 | 12.66 | 35.44 | 32.91 |
| Q23 | 2.87 | 1.09 | 10.13 | 29.11 | 30.38 | 24.05 | 6.33 | 39.24 | 30.38 |
(Sd: Standard deviation, SD: Strongly disagree, D: Disagree, N: None, A: Agree, SA: Strongly agree). Source: Own elaboration of the author, 2025.

Figure A1.
Diverging bar chart of total responses on coastal fisheries communities’ drivers of blue entrepreneurship. Source: Own elaboration of the author, 2025.

Figure A2.
Diverging bar chart of total responses on coastal fisheries communities’ barriers of blue entrepreneurship. Source: Own elaboration of the author, 2025.
References
- European Union. Basic Questions About Diversification, Farnet-Fisheries Areas Network, Farnet Guide 5—Diversification of Fisheries Areas; FARNET Support Unit: Bruxelles, Belgium, 2011. [Google Scholar]
- European Commission. The EU Blue Economy Report; Publications Office of the European Union: Luxembourg, 2024. [Google Scholar]
- Miret-Pastor, L.; Svels, K.; Freeman, R. Towards territorial development in fisheries areas: A typology of projects funded by Fisheries Local Action Groups. Mar. Policy 2020, 119, 104111. [Google Scholar] [CrossRef]
- Mihara, N.; Donback, N.; Torsello, V. ‘We Ask to Be Recognised’: Small Fishers Claim €12bn EU Fund Favours Big Players, Seascape: The State of Our Oceans. The Guardian, 21 January 2025. Available online: https://www.theguardian.com/environment/2025/jan/21/eu-artisanal-shellfish-fishers-spain-italy-warming-seas-climate (accessed on 25 June 2025).
- Salmi, P.; Linke, S.; Siegrist, N.; Svels, K. A new hope for small-scale fisheries through local action groups? Comparing Finnish and Swedish experiences. Marit. Stud. 2022, 21, 309–323. [Google Scholar] [CrossRef]
- Kyvelou, S.S.; Ierapetritis, D.G.; Chiotinis, M. The future of fisheries co-management in the context of the sustainable blue economy and the green deal: There is no green without blue. Sustainability 2023, 15, 7784. [Google Scholar] [CrossRef]
- European Commission. FAMENET Report on CLLD in Fisheries and Coastal Communities—Achievements and Lessons, Directorate-General for Maritime Affairs and Fisheries; Unit D.3: Brussels, Belgium, 2025. [Google Scholar]
- European Commission. European Maritime and Fisheries Fund (EMFF), Greece-overview, Maritime Affaires and Fisheries. 2016. Available online: https://oceans-and-fisheries.ec.europa.eu/system/files/2016-09/op-greece-fact-sheet_en.pdf (accessed on 10 August 2025).
- F.A.O. Fishery and Aquaculture Country Profiles. 2024. In Fisheries and Aquaculture; F.A.O.: Rome, Italy, 2025; Updated 19 July 2024; Available online: https://www.fao.org/fishery/en/facp/grc?lang=en (accessed on 19 May 2025).
- E.U.M.O.F.A. European Market Observatory for Fisheries and Aquaculture Products; Country Profile; E.U.M.O.F.A: Brussels, Belgium, 2025. [Google Scholar]
- Hellenic Statistical Authority. Marine Fisheries Survey with Motorized Vessels: Year 2023. 2024. Available online: https://www.statistics.gr/en/statistics/-/publication/SPA03/2023 (accessed on 10 August 2025).
- Hellenic Statistical Authority. Marine Fisheries Survey with Motorized Vessels: Year 2016. 2017. Available online: https://www.statistics.gr/el/statistics/-/publication/SPA03/2017-M01 (accessed on 10 August 2025).
- Hellenic Statistical Authority. Marine Fisheries Survey with Motorized Vessels: Year 2017–2023. 2008–2024. Available online: https://www.statistics.gr/el/statistics/-/publication/SPA03/- (accessed on 10 August 2025).
- Kyvelou, S.S.I.; Ierapetritis, D.G. Fisheries Sustainability through Soft Multi-Use Maritime Spatial Planning and Local Development Co-Management: Potentials and Challenges in Greece. Sustainability 2020, 12, 2026. [Google Scholar] [CrossRef]
- Ministry of Rural Development and Food. Small Scale Fisheries in Greece: A Development Pillar in the Context of the Common Fisheries Policy with a Horizon to 2030; General Directorate of Fisheries: Athens, Greece, 2021. (In Greek) [Google Scholar]
- United Nations Environment Programme (UNEP). Green Economy in a Blue World Synthesis Report. 2012. Available online: https://www.unep.org/resources/report/green-economy-blue-world-synthesis-report (accessed on 10 August 2025).
- O.E.C.D. The Ocean Economy in 2030; OECD Publishing: Paris, Italy, 2016. [Google Scholar] [CrossRef]
- Figueiredo, R.; Soliman, M.; Al-Alawi, A.N. Deep Blue Entrepreneurship: Ocean Venturing and Infinite Opportunity. In Bleeding-Edge Entrepreneurship: Digitalization, Blockchains, Space, the Ocean, and Artificial Intelligence; Emerald Publishing Limited: Leeds, UK, 2023; pp. 5–17. [Google Scholar]
- Pauli, G.A. The Blue Economy: 10 Years, 100 Innovations, 100 Million Jobs; Paradigm Publications: Taos, NM, USA, 2010. [Google Scholar]
- Corson, C.; MacDonald, K.I.; Neimark, B. Grabbing “green”: Markets, environmental governance and the materialization of natural capital. Hum. Geogr. 2013, 6, 1–15. [Google Scholar] [CrossRef]
- World Bank and United Nations Department of Economic and Social Affairs. The Potential of the Blue Economy: Increasing Long-term Benefits of the Sustainable Use of Marine Resources for Small Island Developing States and Coastal Least Developed Countries; World Bank: Washington, DC, USA, 2017. [Google Scholar]
- Schutter, M.S.; Hicks, C.C.; Phelps, J.; Waterton, C. The blue economy as a boundary object for hegemony across scales. Mar. Policy 2021, 132, 104673. [Google Scholar] [CrossRef]
- Schutter, M.S.; Hicks, C.C. Networking the blue economy in Seychelles: Pioneers, resistance, and the power of influence. J. Political Ecol. 2019, 26, 425–447. [Google Scholar]
- Senaratne, M.; Zimbroff, A.; Stevens, J.T. An instrument to assess blue economy entrepreneurship ecosystems: A case study from the Seychelles. J. Indian Ocean Reg. 2021, 17, 205–223. [Google Scholar] [CrossRef]
- Voyer, M.; Quirk, G.; McIlgorm, A.; Azmi, K. Shades of blue: What do competing interpretations of the Blue Economy mean for oceans governance? J. Environ. Policy Plan. 2018, 20, 595–616. [Google Scholar] [CrossRef]
- Dijkstra, H.; van Beukering, P.; Brouwer, R. In the business of dirty oceans: Overview of startups and entrepreneurs managing marine plastic. Mar. Pollut. Bull. 2021, 162, 111880. [Google Scholar] [CrossRef]
- Dijkstra, H.; van Beukering, P.; Brouwer, R. Marine plastic entrepreneurship; Exploring drivers, barriers and value creation in the blue economy. Sustain. Technol. Entrep. 2022, 1, 100018. [Google Scholar] [CrossRef]
- Ierapetritis, D.G. Business Plan & Road Map of the Blue Growth Incubator Network, Interlocal Cooperation. Blue Growth Incubator Network”, (Epixeirimatiko Sxedio & Odikos Chartis tou Diktiou Thermokoitidon Gal;azias Anaptixis) Attica Islands Network, Development Organization Parnonas S.A., Development Agency of Thessaloniki S.A., Development Agency of Kavala S.A., Development Agency of Messinia S.A., FLAG Burgas, 2023, LEADER/CLLD Measure 4.3, Fisheries and Maritime Affairs OP 2014–2020. (In Greek)
- Crecente, F.; Sarabia, M.; del Val, M.T. Sustainable Entrepreneurship in The 2030 Horizon. Sustainability 2021, 13, 909–920. [Google Scholar] [CrossRef]
- Habip, E.; Doğan, E. Blue Entrepreneurship: A New Agenda for Sustainability of Seas and Oceans. J. Manag. Econ. Res. 2022, 20, 159–177. [Google Scholar] [CrossRef]
- Burch, S.; Andrachuk, M.; Carey, D.; Frantzeskaki, N.; Schroeder, H.; Mischkowski, N.; Loorbach, D. Governing and accelerating transformative entrepreneurship: Exploring the potential for small business innovation on urban sustainability transitions. Curr. Opin. Environ. Sustain. 2016, 22, 26–32. [Google Scholar] [CrossRef]
- Nikolaou, E.I.; Ierapetritis, D.; Tsagarakis, K.P. An evaluation of the prospects of green entrepreneurship development using a SWOT analysis. Int. J. Sustain. Dev. World Ecol. 2011, 18, 1–16. [Google Scholar] [CrossRef]
- Poza-Vilches, F.; Arjona-Romero, J.J.; Martín-Jaime, J.J. Diagnosis of blue and sustainable entrepreneurship in university education in Spain: A case study. J. Teach. Educ. Sustain. 2023, 25, 98–115. [Google Scholar] [CrossRef]
- Kontakos, P. Blue Growth and Entrepreneurship: Opportunities and Challenges in Cyprus. In Proceedings of the 10th International Conference in International Business (ICIB), Thessalonki, Greece, 23–26 May 2019; pp. 165–172. [Google Scholar]
- Pauli, G.A. The Blue Economy 3.0: The Marriage of Science, Innovation and Entrepreneurship Creates a New Business Model That Transforms Society; Xlibris: Bloomington, IN, USA, 2017. [Google Scholar]
- Smith-Godfrey, S. Defining the blue economy, maritime affairs. Marit. Aff. 2016, 12, 58–64. [Google Scholar] [CrossRef]
- Bennett, N.J.; Cisneros-Montemayor, A.M.; Blythe, J.; Silver, J.J.; Singh, G.; Andrews, N.; Calò, A.; Christie, P.; Di Franco, A.; Finkbeiner, E.M.; et al. Towards a sustainable and equitable blue economy. Nat. Sustain. 2019, 2, 991–993. [Google Scholar] [CrossRef]
- Lechuga-Jimenez, C.; Barroso, M.-B.; Alastor, E.; Tójar-Hurtado, J.-C. Promoting social and blue entrepreneurship and sustainability skills in higher education by transversal competencies. Cogent Educ. 2024, 11, 2309412. [Google Scholar] [CrossRef]
- Doerr, A.N.; Anderson, L.; Scorse, J. Marine Entrepreneurship. In Oceans and Society; Routledge: Oxfordshire, UK, 2023; pp. 244–259. ISBN 9781003058151. Available online: https://www.taylorfrancis.com/chapters/edit/10.4324/9781003058151-18/marine-entrepreneurship-doerr-anderson-scorse (accessed on 10 August 2025).
- European Commission. Blue Growth—Scenarios and Drivers for Sustainable Growth from the Oceans, Seas and Coasts. DG MARE. 2013. Available online: https://maritime-forum.ec.europa.eu/document/download/dd6e0bfd-bd35-44f4-9a44-603190abbd31_en?filename=Blue%20Growth%20Final%20Report%2013092012.pdf (accessed on 10 August 2025).
- Surís-Regueiro, J.C.; Garza-Gil, M.D.; Varela-Lafuente, M.M. Marine economy: A proposal for its definition in the European Union. Mar. Policy 2013, 42, 111–124. [Google Scholar] [CrossRef]
- The Economist. The Blue Economy: Growth, Opportunity and a Sustainable Ocean Economy; An Economist Intelligence Unit Briefing Paper for the World Ocean Summit; The Economist: London, UK, 2015. [Google Scholar]
- Spilling, O.R. The entrepreneurial system: On entrepreneurship in the context of a mega-event. J. Bus. Res. 1996, 36, 91–103. [Google Scholar] [CrossRef]
- Ierapetritis, D.G. Discussing the role of universities in fostering regional entrepreneurial ecosystems. Economies 2019, 7, 119. [Google Scholar] [CrossRef]
- Stam, E. Entrepreneurial ecosystems and regional policy: A sympathetic critique. Eur. Plan. Stud. 2015, 23, 1759–1769. [Google Scholar] [CrossRef]
- Malecki, E.J. Entrepreneurship and entrepreneurial ecosystems. Geogr. Compass 2018, 12, e12359. [Google Scholar] [CrossRef]
- Spigel, B. The relational organization of entrepreneurial ecosystems. Entrep. Theory Pract. 2017, 41, 49–72. [Google Scholar] [CrossRef]
- Cosimato, S.; Vona, R. Blue Economy Potential for Shaping a Marine Entrepreneurship Ecosystem: The Case of the Adriatic Sea. In Proceedings of the EISIC 25th Conference, Visby, Sweden, 25–26 August 2022; 2022. Available online: https://sites.les.univr.it/eisic/wp-content/uploads/2022/10/Cosimato-Vona.pdf (accessed on 10 August 2025).
- Ierapetritis, D.G. Social capital, regional development and innovation in Greece: An interregional analysis. Int. J. Innov. Reg. Dev. 2019, 9, 22–58. [Google Scholar] [CrossRef]
- Ierapetritis, D.G.; Lagos, D. Building Rural Entrepreneurship in Greece: Lessons from Lifelong Learning Programmes. In Entrepreneurship, Social Capital and Governance, Directions for the Sustainable Development and Competitiveness of Regions; Karlsson, C., Johansson, B., Stough, R., Eds.; Elgar Publishing, New Horizons in Regional Science: Cheltenham, UK, 2012; pp. 281–301. [Google Scholar] [CrossRef]
- Kyvelou, S.S.I.; Ierapetritis, D.G. How to make blue growth operational? A local and regional stakeholders perspective in Greece. WMU J. Marit. Aff. 2019, 18, 249–280. [Google Scholar] [CrossRef]
Disclaimer/Publisher’s Note: The statements, opinions and data contained in all publications are solely those of the individual author(s) and contributor(s) and not of MDPI and/or the editor(s). MDPI and/or the editor(s) disclaim responsibility for any injury to people or property resulting from any ideas, methods, instructions or products referred to in the content. |
© 2025 by the author. Licensee MDPI, Basel, Switzerland. This article is an open access article distributed under the terms and conditions of the Creative Commons Attribution (CC BY) license (https://creativecommons.org/licenses/by/4.0/).