Abstract
Lactic acid (LA) synthesis through fermentation of food waste (FW) is an emerging techniques for utilizing perishable organic wastes with high value. Using food waste collected from a cafeteria as the substrate for fermentation, the current study was conducted by applying a micro electric field to the conventional LA fermentation process and performing open-ended electro-fermentation (EF) without sterilization and lactobacilli inoculation. Furthermore, the effects of pH adjustment on LA production were examined. The findings demonstrated that electrical stimulation enhances the electron transfer rate within the system, accelerates REDOX reactions, and thereby intensifies the lactic acid production process. The pH-regulated group produced LA and dissolved organic materials at considerably higher rates than the control group, which did not receive any pH modification. The maximum LA concentration and organic matter dissolution in the experimental group, where the pH was set to 7 every 12 h of fermentation, were 33.9 and 38.4 g/L, respectively. These values were 208 and 203% higher than those in the control group, indicating that the pH adjustment greatly aided the solubilization and hydrolysis of macromolecules. Among the several hydrolyzing bacteria (Actinobacteriota) that were enriched, Lactobacillus predominated, but Bifidobacterium also became a major genus in the neutral-acidic environment, and its abundance grew dramatically. This study provides a scientific basis for optimizing the LA process of FW.
1. Introduction
About half of China’s urban garbage is made up of food waste (FW) [1], and in recent years, the amount of FW produced has increased at a rate of over 10% each year [2]. FW can decay and decompose if it is not properly treated, contaminating water and soil, releasing foul odors, spreading illnesses, and posing a threat to public health [3,4].
Anaerobic fermentation can turn FW into valuable products like methane, hydrogen, and organic acids [5,6]. This process has a much lower environmental impact and has great advantages and development potential [7,8]. FW is rich in nutrients and water, making it suitable to be used as a fermentation substrate [9,10].
“Self-driven fermentation with polarized electrodes as driving tools” is the most basic definition of electro-fermentation (EF), a technique that uses tiny voltages or currents in the fermentation system to speed up microbial metabolism and encourage cell growth. It offers the advantages of using less electric energy, not creating dangerous compounds, having a simple reactor, and being simpler to operate when compared to other electrochemical technologies. There have been reports of EF for the production of electricity, hydrogen, methane, ethanol, and volatile fatty acid (VFA) [11,12,13,14], and the studies’ findings have shown that combining the electrochemical system with the anaerobic fermentation system can enhance the fermentation effect in comparison to the conventional anaerobic fermentation process.
Lactic acid (LA) is a significant organic acid that finds extensive application in the food, cosmetics, and medical industries [15,16,17]. Lactic acid is also an important platform compound that can be used as a monomer to manufacture other chemicals [18]. For instance, LA can be used as the primary raw material to create polylactic acid (PLA), a biodegradable plastic that promotes green and sustainable development. The market for PLA is growing [19,20,21], which is helping to fuel the ongoing rise in LA demand [22].
In a traditional LA fermentation system, some researchers have investigated the fermentation effect after applying an electric field. Xue et al. [23] used a mixed microflora with activated sludge and food waste as a mixed substrate to perform cathodic EF for LA production. The maximum concentration of LA at 50 °C was 32.7 g/L, which was 124% higher than the control. However, there was a later depletion of LA, which was ascribed to the fact that other acid-producing bacteria in the activated sludge consumed the LA. LA synthesis via EF with food waste as the sole substrate, however, has not been documented.
Further research is being conducted by our research group on the fermentation of LA from organic wastes as raw materials, including FW [24], vinesse [25], straw [26], and Sophora flavescens residues [27]. For pure chemicals, sterilizing the fermentation substrate is frequently required. The non-open fermentation mode, which involves external LA bacteria, is a more laborious and energy-intensive procedure that also necessitates a sterile environment. The term “open fermentation mode” describes a straightforward and energy-efficient method of fermentation that can lower the cost of producing LA without sterilizing the fermentation substrate or requiring rigorous aseptic operation. Sterilization and other processes can be skipped when using FW as a complex substrate for LA production. LA fermentation can be carried out using LA bacteria from native microorganisms, and fermentation expenses can be further decreased by not inoculating exogenous LA bacteria. Our study’s findings also demonstrated that it is possible to use a single FW in open fermentation without sterilizing the raw materials. The native LA bacteria found in FW will eventually take over as the predominant strains during the fermentation process [28], and their production of LA will equal or surpass that of non-open fermentation performed with raw material sterilization.
In the process of LA production by EF, in addition to the factor of adding electricity, the influence of process parameters such as pH on the effect of EF also needs to be considered [29]. The enzymatic breakdown of the substrate’s fermentable components, the microbial community’s structure, and the product composition are all impacted by pH, which in turn influences the outcome of LA fermentation [30,31,32]. In this study, we therefore applied a microelectric field to a conventional LA fermentation system using FW as the sole substrate in order to address the issue of the easy acidification of the system during the fermentation process. We also conducted an open EF without sterilization or LA bacterial inoculation, compared the effects of pH adjustment or not on LA production during the EF process, and established the appropriate frequency of pH adjustment. Finally, we investigated the effects of various pH regulation values on the yield of LA and the distribution of the product. Additionally, the effects of varying pH values on the generation of LA and the distribution of the product were examined. A theoretical foundation for improving the LA EF process of FW was offered, along with the examination of the microbial community and electrochemical characteristics.
2. Materials and Methods
2.1. Nature of FW
The FW used in this study was collected from a student cafeteria at the University of Science and Technology Beijing. After collection, it was first sorted out to remove large bones, plastics, glass, and other impurities unfavorable to crushing and fermentation, and then the sorted FW was made into a slurry using a grinder, and then stored in a sealed bag in a −20 °C environment. Table 1 displays its fundamental attributes. The food waste was taken out of the refrigerator, allowed to thaw at room temperature (25 ± 3 °C), mixed with deionized water at a 1:1 (w/w) ratio, and then used without further processing.

Table 1.
Properties of food waste used in the experiment.
2.2. EF System
The reactor employed in this investigation was an H-type double-chamber electrolytic cell with a single chamber volume of 250 mL, as illustrated in Figure 1. A carbon cloth (4 cm × 2 cm, WOS 1011, CeTech CO., Ltd., Taichung, China) was utilized as the cathode electrode. It was cleaned prior to usage, submerged in strong nitric acid, and heated and treated for three hours at 60 °C. Following removal, it was cleaned with ethanol and then submerged in deionized water for usage. The carbon brush (Φ 3 cm × 4 cm) that serves as the anode electrode is submerged in acetone solution for 24 h before usage, and it is then burned for 30 min at 450 °C in a muffle furnace before being taken out for use. A titanium metal wire was used to link the carbon brushes to the power supply. An Ag/AgCl electrode (+197 mV versus SHE, 25 °C) was used as an extra reference electrode in the cathode chamber. It was submerged in saturated potassium chloride solution for four hours prior to usage. The carbon brush electrode was linked to the power supply’s positive terminal, while the carbon cloth electrode was attached to the power supply’s negative terminal for the EF tests. Before being used, a cation exchange membrane (CMI-7000, Membranes International Inc., Ringwood, NJ, USA) was washed with diluted acid and deionized water, and then it was soaked in deionized water to separate the electrolysis cell. FW slurry and a stirring device were introduced to the cathode chamber, while Na2SO4 (0.5 mol/L) was put to the anode chamber as the electrolyte solution. A stabilized power supply provided steady pressure to the system.
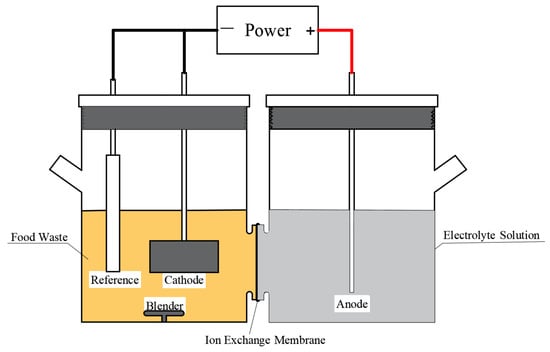
Figure 1.
Schematic diagram of the EF reactor.
2.3. LA Production by EF in Different pH Regulation Modes
To compare the effect of pH adjustment frequency on EF, three experimental groups were set up, namely, pH adjustment to 7 (F-24 h) every 24 h, pH adjustment to 7 (F-12 h) every 12 h, and control group without pH adjustment (Blank). In addition, four experimental groups were set up to investigate the effect of different pH regulation values on lactic acid production by adjusting the system pH to 5 (pH 5), 6 (pH 6), 7 (pH 7), and 8 (pH 8) every 12 h. The applied voltage was all −1.0 V. The fermentation temperature was 37 °C, the reactor stirring rate was 120 rpm, and the pH was adjusted using 10 mol/L NaOH solution. Samples were taken every 24 h. A portion of each sample was centrifuged, and the supernatant was taken, filtered through 0.22 μm filter membrane, and then stored at −20 °C for testing. All experiments were performed in three parallel experiments.
2.4. Analytical Methods
Total solids (TS) and volatile solids (VS) were determined using gravimetric method. The elemental content of C, H, N, and O was determined using an elemental analyzer (Elementar Vario EL, Frankfurt, Germany). Soluble carbohydrates were determined using the phenol–sulfuric acid method. Soluble proteins were determined using the Thomas Brilliant Blue method. The pH value was determined using a pH meter PHS-3C (Shanghai Jingmi Scientific Instrument Co., Ltd., Shanghai, China). Oxidation reduction potential (ORP) was determined by the same instrument. The concentrations of LA, acetic acid, propionic acid, and ethanol were determined using high performance liquid chromatography (HPLC-20AT, Shimadzu; Kyoto, Japan) equipped with a ShodexSH1011 column and a refractive index detector (RID). The column temperature was set at 60 °C, and the mobile phase was 5 mM H2SO4 at a flow rate of 1 mL/min, with an injection volume of 10 μL.
The electrochemical characteristics were determined and analyzed using an electrochemical workstation (CHI 660E, Chenhua Instrument Co., Shanghai, China). The reactor was connected to the electrochemical workstation, and the software was started for hardware detection. To test the cyclic voltammetric curve (CV), the initial potential, maximum potential, minimum potential, and termination potential were set at 1.5 V, 1.5 V, −1.5 V and 1.5 V, respectively, and the scanning rate was 0.015 V/s. To test the Tafel curve (Tafel), the initial and termination potentials were set at −1.0 V and 1.0 V, respectively, and the scanning rate was 0.01 V/s. The initial and termination potentials were set at −1.0 V and 1.0 V, respectively, and the scanning rate was set at 0.01 V/s. The initial and termination potentials were set at −1.0 V and 1.0 V, respectively.
The main processes of microbial community analysis included DNA extraction, polymerase chain reaction (PCR) amplification, Illumina MiSeq sequencing and sequencing data processing. Total genomic DNA was first extracted, and the extracted DNA was amplified by PCR using primers 338F (5′-ACTCCTACGGGGAGGCAGCAG-3′) and 806R (5′-GGACTACHVGGGGTWTCTAAT-3′) in the V3 region. Subsequently, Illumina Miseq pyrophosphate sequencing was performed to assess the microbial community structure, and the related work was performed by Shanghai Meiji Biomedical Science and Technology Co., Ltd. (Shanghai, China). Subsequently, the functional classification of microbial communities was predicted based on gene sequences, and the possible functional genes in the samples were predicted by PICRUSt2, and the functions of the predicted genes were categorized and compared according to the KEGG database.
2.5. Statistical Analysis of Data
Statistical analysis of the data was performed using IBM SPSS Statistics 25 and for all data analysis, p < 0.05 was considered statistically significant.
3. Results and Discussion
3.1. Effect of pH Regulation on LA Production by EF
The pH of the LA fermentation system is too low, which will prevent LA bacteria and other naturally occurring hydrolytic acidifying bacteria from being active. This will prevent insoluble macromolecules from being broken down into soluble small molecules, which means that there are not enough nutrients for the LA bacteria to grow and produce acid. The impacts of pH adjustment frequency and pH regulation value on LA fermentation were examined in order to shed light on the function of controlling the system’s pH during EF’s generation of LA.
- (1)
- Effect of pH regulation frequency on LA production
The pH of the system was adjusted to 7 at intervals of 24 h and 12 h, respectively, during the fermentation process (referred to as F-24 h and F-12 h groups) and fermented under the same conditions as the control group without pH adjustment. The changes in each index of the fermentation process in the three groups of experiments are shown in Figure 2.
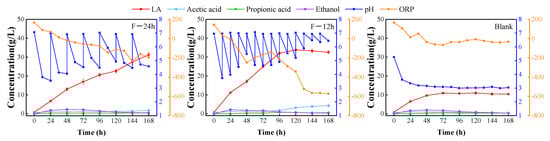
Figure 2.
LA fermentation at different pH regulation frequencies.
The maximum LA concentration of both groups with pH adjusted to 7 at 24 h and 12 h intervals (31.3 g/L and 33.9 g/L) was significantly higher than that of the control group without pH adjustment (11.0 g/L). Compared to the control group, the highest LA concentration was 184.5% and 208.2% greater, respectively. Furthermore, the F-12 h group outperformed the F-24 h group in terms of LA production rate, achieving the maximum concentration in 120 h—at least 48 h faster than the F-24 h group to achieve the same concentration—and increased the efficiency of LA production.
Because different types of hydrolytic and LA-producing bacteria coexist in the EF system without sterilization and LA bacteria inoculation, our research group’s previous research also confirmed that adjusting pH at specific intervals can improve LA production [29]. The hydrolytic bacteria can secrete a variety of enzymes that break down the macromolecules in the solid phase into soluble small molecule sugars and other sugars that the LA bacteria can use, allowing the LA bacteria to convert the soluble sugars back into LA. The hydrolyzing bacteria can also decompose proteins into amino acids to provide nitrogen source for the growth of LA bacteria and other microorganisms, but the suitable pH range of the hydrolyzing acidifying bacteria is usually between 5.5 and 6.5. In practical applications, it is required to maintain a proper environment by altering the pH or adding buffers since the pH is either too high or too low to affect its activity. In order to decompose complex macromolecules into soluble small molecules for the use of LA bacteria, it is necessary to periodically adjust the pH so that it oscillates between acidic and neutral. This can inhibit the activity of some hydrolyzing bacteria when the pH is acidic, allowing the acid-resistant native lactobacilli to continue to proliferate and become the dominant strains. In addition, it also enables hydrolyzing and acidifying bacteria to regain their activity when the pH is neutral.
Furthermore, the system’s redox state can be described by the oxidation reduction potential (ORP) value. In general, a lower ORP value means that the substances in the system are more likely to lose electrons and are therefore more reduced, which facilitates the reduction in the soluble sugar to lactic acid by pyruvate, a byproduct of glycolysis.
C6H12O6 (glucose) + 2NAD+ → 2C3H4O3 (pyruvate) + 2NADH + 2H+ (glycolysis reaction)
C3H4O3 (pyruvate) + NADH + H+ → C3H6O3 (lactate) + NAD+ (reduction reaction)
NAD+ can be regenerated to NADH by obtaining electrons at the cathode (NAD+ + H+ + 2e− → NADH), leading to more NADH accumulation and thus promoting more pyruvate conversion towards LA production. The ORP of the two pH-adjusted systems was also lower than that of the control group throughout the cycle, in which the pH-adjusted group at 12 h intervals significantly increased the LA concentration and shortened the time to reach the end point of fermentation, so that pH-adjustment at every 12 h was chosen as one of the most suitable fermentation conditions.
- (2)
- The effect of pH on LA production
In this study, LA bacteria were not added additionally but only relied on the fermentation of indigenous hydrolyzing bacteria and LA bacteria from food waste, each of which has its own optimal pH for growth, so it is necessary to explore the optimal pH for a mixed system in which hydrolyzing bacteria and LA bacteria coexist [33]. The literature has demonstrated that an alkaline atmosphere is not conducive to the fermentation of LA. This is due to the fact that in an alkaline environment, bacteria’s activity is restricted, and their cell membranes may be damaged, which compromises the breakdown of organic matter and the process of producing acid [31]. In order to compare the EF experiments with the control group (Blank) without adjusting the pH, the pH of each EF system was adjusted to the target values of 5, 6, 7, and 8 (referred to as pH 5, pH 6, pH 7, and pH 8 groups) at 12 h intervals. Figure 3 shows the changes in LA concentration and the amount of the main fermentation products (LA, acetic acid, ethanol, and propionic acid) when reaching the maximum LA during the fermentation process.
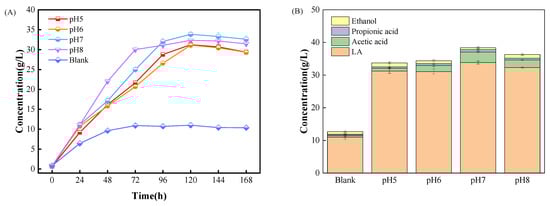
Figure 3.
LA fermentation at different pH values. (A): Concentration of LA. (B): Concentration of major organic products.
LA production was significantly higher in all pH-adjusted groups than in the control group without pH adjustment, and all of them showed a rapid increase in LA concentration during the first 96 h of fermentation, with the maximum concentration occurring at the 120th h of fermentation. pH 7 group showed the highest maximum LA concentration of 33.9 g/L, which was three times higher than that of the control group, and the maximum LA production rate was the highest in pH 8 group at 72 h, with a maximum LA production rate of 0.456 g/(L·h). In addition to LA concentration and production rate, the four pH-adjusted experimental groups also had higher concentrations of major organic products than the Blank group, with the concentration of major organic products in the pH 7 group and reached 38.4 g/L, which was 203% higher than that of Blank (12.7 g/L), suggesting that adjusting the pH also greatly facilitated the dissolution of organic matter.
The variations in soluble carbohydrates at 24 h are displayed in Figure 4A. The reduction in soluble carbohydrates at 24 h of fermentation was 23.1% in the pH 5 group and 22.0% in the control group, suggesting that the pH 5 group’s reduction in carbohydrates was marginally greater than the Blank group’s. The pH 7 and pH 8 groups showed a reduction in soluble carbohydrates of more than 32%, which is consistent with the pattern of rising LA concentration in Figure 3A. Furthermore, the degradation rate of all four groups with adjusted pH increased significantly at the 24th h of fermentation, with the pH 7 group reaching 46.9%, which was 4.08 times higher than the control group’s reduction rate of soluble protein, which was only 11.5% in the control group (Figure 4B).
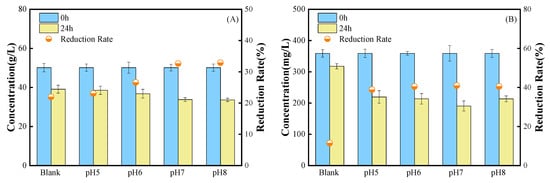
Figure 4.
Changes in indicators related to metabolic pathways. (A): Soluble carbohydrates. (B): Soluble proteins.
Following each pH change, the system’s pH will drop to varying degrees over the next 12 h, putting it in an oscillatory fluctuation state. The lowest pH value for each group prior to the modification is compared in each 12 h period, as illustrated in Figure 5.
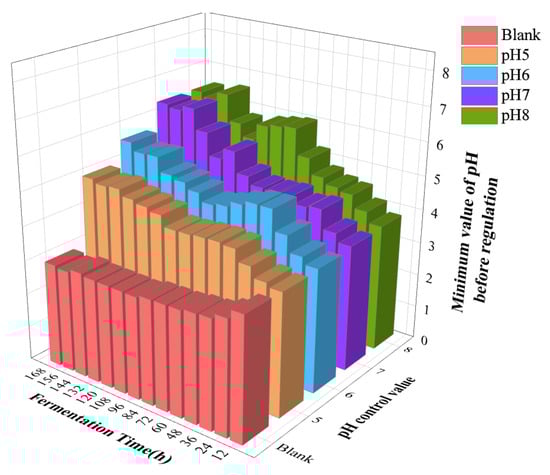
Figure 5.
Minimum value of pH before adjusting pH every 12 h in each experimental group.
The pH of the control group without adjustment steadily dropped as fermentation went on, as shown in Figure 5. After 72 h of fermentation, the system would produce excessive amounts of acid, which inhibited the activity of the LA bacteria themselves and halted the production of LA (i.e., product inhibition). This is in line with the findings of Figure 3A. Additionally, the lowest pH value progressively rose with fermentation after the four adjustment groups changed the pH every 12 h. The reason for this is that during the early fermentation phase, the process of acid production occurs at a relatively high speed, while, in the later phase, the substrate presents in the system is gradually depleted, preventing further production of LA. The LA production for the pH regulation values of groups 7 and 8 was comparable. Nevertheless, the quantity of extra alkali required for the pH8 group was greater than that for the pH 7 group. Taking into account the fermentation effect and the expense of pH adjusting agent, a pH control value of 7 is suitable.
3.2. Effect of pH Regulation on Microbial Community Changes During EF
The application of negative voltages in EF systems has a significant impact on microbial interspecies interactions [34], which in turn influences the selection of dominant populations in mixed substrates [35]. In addition to promoting electron transfer, negative voltages also modulate the structure of the microbial community and stimulate their metabolic activities [19]. The percentage of dominant lactic acid-producing strains will have a substantial impact on the lactic acid production effect because the substrate in this experiment was not sterilized and was not further injected with any microorganisms. The microbial community structure was analyzed for the initial material before the experiment (INI group) and for the four experimental groups after 168 h of fermentation, and the following experimental groups were selected: the Blank group, which did not adjust the pH resulting in a faster acidification of the system; the pH 5 group, which intermittently adjusted the pH to acidic; the pH 8 group, which intermittently adjusted the pH to weakly alkaline; and the pH 7 group, which had the best fermentation effect. The results are shown in Figure 6.
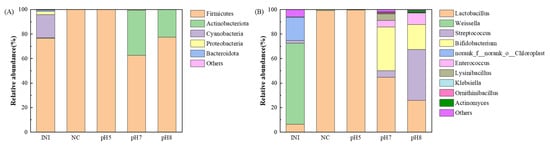
Figure 6.
Comparison of the microbial community structure of the system at 168 h of EF at different pH. (A): Phylum level. (B): Genus level.
At the phylum level (Figure 6A), the largest percentage of Firmicutes was present in the initial material before fermentation (76.7%), followed by Cyanobacteria (18.8%). After adding voltage, the four groups experienced a different circumstance. When the pH of the system was low (Blank and pH 5 groups), the relative abundance of Firmicutes increased significantly (both exceeded 99.9%), and Firmicutes contained a variety of LA bacteria genera, such as Lactobacillus, as well as a variety of hydrolyzers, which can produce proteases and other substances for degradation of large organic molecules. It is highly tolerant to low pH [36], and it has recently been shown that some LA-producing bacteria in Firmicutes may undergo the phenomenon of extracellular electron transfer (EET), which is also frequently found in bioelectrochemical systems [37], but the specific mechanisms and electron transfer pathways still need to be further explored. Firmicutes also contain a variety of electroactive microorganisms that can participate in the electron transfer process of fermentation [38] but were not enriched in this experiment.
The abundance of Firmicutes was significantly lower (62.5%) than the initial material of fermentation in the pH 7 group, but in the pH 8 group, where the pH was alkaline, the abundance of Firmicutes did not change significantly (77.4%). On the other hand, the abundance of Actinobacteriota was significantly higher in the two groups of pH 7 and pH 8 (36.8% and 22.6%), which is similar to the results of Li [39]. Actinobacteriota also has the ability to hydrolyze sugars and proteins [40], and this hydrolyzing bacterium was clearly enriched, which could enhance the ability to hydrolyze large molecules into soluble small molecules and facilitate subsequent LA fermentation.
At the Genus level (Figure 6B), the largest proportion (66.1%) of the initial substrate before fermentation was Weissella in the Firmicutes, a LA-producing bacterial genus commonly found in FW [41,42]. The relative abundance of Lactobacillus in the Firmicutes was more than 99% in both cases when the pH of the fermentation system was low (Blank and pH 5 groups), and this genus is an indigenous microorganism that was enriched during natural fermentation without any bacterial additions, which may be due to the fact that this genus contains electroactive bacteria, and electrical stimulation promotes the enriched of them. Additionally, after the system was stabilized, Andersen et al. [43] demonstrated that adding electric current to the fermentation system led to a noticeably greater relative abundance of Lactobacillus than the control.
At the pH 7 group, the four most common bacteria in the Firmicutes that produce LA were Lactobacillus (44.6%), Streptococcus (5.4%), Enterococcus (5.4%), and Lysinibacillus (5.2%). Lactobacillus was dominant, while the predominant genus in the Actinobacteriota was Bifidobacterium (35.6%), which showed a significant increase in abundance. This bacterium is suitable for value-addition and lactic acid production from substrates in pH environments above 5.5 [44] and has also become a predominant genus in neutral to acidic environments. In the Firmicutes, the pH 8 group exhibited comparatively higher abundances of Streptococcus and Enterococcus and lower abundances of Lactobacillus and Bifidobacterium than the pH 7 group. This suggests that the latter two species are more suited to alkaline environments and play a larger role in the production of L-LA [17]. Additionally, Bifidobacterium in the Actinobacteriota will become much more abundant in the pH 7 group, suggesting that this bacterium can also grow in neutral or neutral-alkaline conditions. Sakai et al. [45] also found that intermittent adjustment of pH to neutral can effectively enrich the LA-producing bacterial population in open LA fermentation without sterilization of food waste.
Following clarification of the community composition, correlation analysis was used to examine the association between environmental conditions and microbial populations.
In the RDA plot of environmental factors, the greater the distance between two experimental groups, the less similar their microbial community structures. Figure 7A shows that the community composition of the Blank and pH 5 groups is more similar, while the microbial community structure of the pH 7 and pH 8 groups is similar. They both differed significantly from the initial material before the experiment (INI group), indicating that the microbial community structure was significantly different in the electrically fermented versus not electrically fermented groups. If the points of an experimental group are further from the origin of a straight line that represents an environmental factor, then the environmental factor has a stronger influence on that experimental group. This indicates the degree of influence of environmental factors. The microbial community is more affected by two environmental parameters, pH and ORP. The angle at which the various influencing elements are situated is used to assess their relationship; if the angle is greater than 90°, then there is a negative correlation between the two environmental factors. It is possible to identify a negative association between the two environmental parameters, ORP and pH. For ORP, the relative influence of the community distribution of the initial substrate group (INI) is the largest, while the community distribution of the pH 7 group is most affected by pH. Figure 7B illustrates the correlation and significance of different species with environmental factors. The abundance of genera decreases from bottom to top, and the top five genera in abundance are, in order, Lactobacillus, Weissella, Bifidobacterium, Streptococcus, and norank_f_norank_o_Chloroplast. For the top ten genera, the correlation between pH and the abundance of the remaining nine genera, except Lysinibacillus, was large. There was a statistically significant positive correlation between pH and Actinomyces and a negative correlation with Weissella, while ORP had a large correlation with the abundance of the genera except Lactobacillus, and a large correlation with the abundance of Weissella, Bifidobacterium, norank_f_norank_o_Chloroplast, Ornithinibacillus, and Neoscardovia.
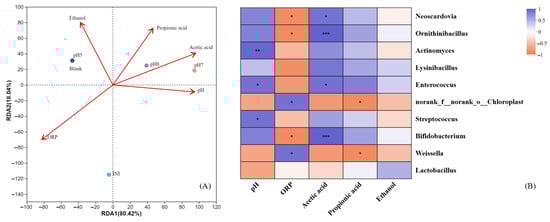
Figure 7.
Correlation analysis between environmental factors and microbial communities. (A): Redundancy analysis plot. (B): Correlation heat map (* represents p ≤ 0.05, ** represents p ≤ 0.01, *** represents p ≤ 0.001).
3.3. Effect of pH Regulation on the Electrochemical Properties of the EF Process
In order to clarify the effect of applied voltage on the system, the electrochemical properties of the system were determined. Figure 8 shows the CV and Tafel curves for each group.
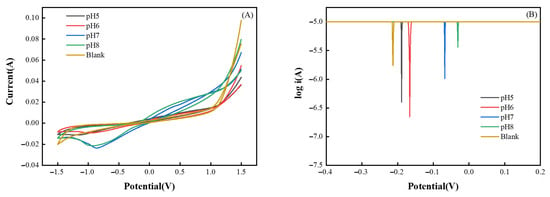
Figure 8.
Electrochemical curves. (A): CV curve; (B): Tafel curve.
The CV curves can effectively represent the electrochemical properties of the system and to some extent characterize the electrochemical activity and stability of the biofilm [46]. As can be seen from Figure 8A, no obvious reduction peaks appeared in the Blank, pH 5 and pH 6 groups [1]. Only the pH 7 and pH 8 groups showed obvious reduction peaks around −0.86 V and −0.95 V, respectively, which indicated that the electrochemical activity of the system was higher in the pH 7 and pH 8 groups [47,48], with the higher the peak current in the CV curve, the higher the electron transfer efficiency of the system. The pH 7 group had the best electron transfer efficiency and the largest peak current, measuring −0.0236 A [46]. Between the electrodes and the connected biofilm, a double-layer capacitive structure that can store more electrons is created; the area of the CV curves indicates how many electrons this structure can store [49]. Since the pH 7 group’s curves have the largest area, it also has the largest double-layer capacitance area and the highest electron storage capacity.
Figure 8B shows the Tafel curves of the five experimental groups, the absolute value of the voltage corresponding to the tip of the curve of the control group is the largest, then the corrosion potential of the system is the largest, indicating that the reaction resistance of this group is the largest, and the reaction requires a higher potential. While the corrosion potentials of the four pH-adjusted groups were reduced, the pH 8 group had the smallest corrosion potential, indicating that the reaction was more likely to occur in this group.
In conclusion, the electrochemical activity of the pH 7 and pH 8 groups was stronger, but the pH 7 group’s peak current (0.0236 A) had a higher absolute value than the pH 8 group’s (0.0214 A). This indicates that the pH 7 group had a higher electron transfer efficiency and the capacity to store electrons. Additionally, the pH 7 group had a better fermentation effect and a lower cost of acid consumption for pH adjustment than the pH 8 group, which led to the conclusion that pH 7 is a better pH regulation value for EF.
4. Conclusions
In this study, to address the problem of acidification and inhibition of LA production due to the decreasing pH value of the EF process, we investigated the effects of pH adjustment frequency and pH regulation value on LA production, organic macromolecule solubilization and hydrolysis, microbial community changes, and electrochemical properties in the EF LA production process coupled with an anaerobic digestion system. The findings demonstrated that the four groups of EF with pH adjustment had significantly higher levels of LA production and organic matter dissolution than the control group without pH adjustment. Of these, the experimental group with pH adjusted to 7 for every 12 h of fermentation had the highest levels of LA concentration and organic matter dissolution, reaching 33.9 g/L and 38.4 g/L, respectively, which were 208% and 203% higher than those in the control group. This suggested that the pH adjustment aided in the process of macromolecule dissolution and hydrolysis. The pH 7 group had the maximum electron transfer efficiency according to the electrochemical curves. Analysis of the microbial community revealed that many LA bacteria (Firmicutes) and hydrolyzing bacteria (Actinobacteriota) were enriched, with Lactobacillus predominating. In contrast, Bifidobacterium became a dominant bacterial genus in the neutral acidic environment and saw a significant increase in abundance. In addition, the microbial community structure of the electro-fermentation group changed significantly after fermentation. Among various environmental factors, pH had a greater impact on the microbial community of the electro-fermentation group and was highly correlated with the abundance of most bacterial genera. The results of this study will provide a feasible and effective method for the efficient production of lactic acid from kitchen waste. It is not only an effective means of resource utilization of kitchen waste, but also offers certain technical support and scientific basis for promoting the development of an environmentally friendly bio-fermentation industry.
Author Contributions
Conceptualization, N.W. and Q.W.; methodology, N.W., J.L. and X.W.; validation, N.W.; formal analysis, N.W., J.L. and T.Z.; investigation, N.W., Y.L., Y.R. and Q.W.; resources, J.L. and T.Z.; data curation, N.W.; writing—original draft preparation, N.W.; writing–review and editing, J.L., Y.L., Y.R., X.W., T.Z. and Q.W.; visualization, N.W.; supervision, Y.L., Y.R. and Q.W.; project administration, Q.W.; funding acquisition, Q.W. All authors have read and agreed to the published version of the manuscript.
Funding
This research was funded by the National Natural Science Foundation of China grant number 52170121 and 52470137.
Institutional Review Board Statement
Not applicable.
Informed Consent Statement
Not applicable.
Data Availability Statement
The raw data supporting the conclusions of this article will be made available by the authors on request.
Conflicts of Interest
The authors declare no conflicts of interest.
References
- Zhou, Y.; Engler, N.; Nelles, M. Symbiotic relationship between hydrothermal carbonization technology and anaerobic digestion for food waste in China. Bioresour. Technol. 2018, 260, 404–412. [Google Scholar] [CrossRef] [PubMed]
- Yu, Q.; Yang, Y.; Wang, M.; Zhu, Y.; Sun, C.; Zhang, Y.; Zhao, Z. Enhancing anaerobic digestion of kitchen wastes via combining ethanol-type fermentation with magnetite: Potential for stimulating secretion of extracellular polymeric substances. Waste Manag. 2021, 127, 10–17. [Google Scholar] [CrossRef] [PubMed]
- Yu, D.; Yu, Y.; Tang, J.; Li, X.; Ke, C.; Yao, Z. Application fields of kitchen waste biochar and its prospects as catalytic material: A review. Sci. Total Env. 2022, 810, 152171. [Google Scholar] [CrossRef] [PubMed]
- Zhang, C.; Yang, R.; Sun, M.; Zhang, S.; He, M.; Tsang, D.C.W.; Luo, G. Wood waste biochar promoted anaerobic digestion of food waste: Focusing on the characteristics of biochar and microbial community analysis. Biochar 2022, 4, 62. [Google Scholar] [CrossRef]
- Chen, G.; Li, H.; Song, Y.; Mu, L.; Pei, L.; Zhou, T.; Qing, Z.; Zeng, Y. Optimization of food-to-microorganism ratio and addition of Tween 80 to enhance biohythane production via two-stage anaerobic digestion of food waste. J. Chem. Technol. Biotechnol. 2023, 98, 2477–2488. [Google Scholar] [CrossRef]
- Wei, W.; Wang, N.; Zhang, Z.; Zhang, X. The Comparison of Biotreatment and Chemical Treatment for Odor Control during Kitchen Waste Aerobic Composting. Separations 2022, 9, 348. [Google Scholar] [CrossRef]
- Jin, C.; Sun, S.; Yang, D.; Sheng, W.; Ma, Y.; He, W.; Li, G. Anaerobic digestion: An alternative resource treatment option for food waste in China. Sci. Total Environ. 2021, 779, 146397. [Google Scholar] [CrossRef]
- Zhang, W.; Xu, X.; Yu, P.; Zuo, P.; He, Y.; Chen, H.; Liu, Y.; Xue, G.; Li, X.; Alvarez, P.J.J. Ammonium Enhances Food Waste Fermentation to High-Value Optically Active l-Lactic acid. ACS Sustain. Chem. Eng. 2020, 8, 669–677. [Google Scholar] [CrossRef]
- Ajay, C.M.; Mohan, S.; Dinesha, P. Decentralized energy from portable biogas digesters using domestic kitchen waste: A review. Waste Manag. 2021, 125, 10–26. [Google Scholar] [CrossRef]
- Gbiete, D.; Narra, S.; Mani Kongnine, D.; Narra, M.-M.; Nelles, M. Insights into Biohydrogen Production Through Dark Fermentation of Food Waste: Substrate Properties, Inocula, and Pretreatment Strategies. Energies 2024, 17, 6350. [Google Scholar] [CrossRef]
- Ding, L.; Wang, Y.; Lin, H.; van Lierop, L.; Hu, B. Facilitating solid-state anaerobic digestion of food waste via bio-electrochemical treatment. Renew. Sustain. Energy Rev. 2022, 166, 112637. [Google Scholar] [CrossRef]
- Li, K.; Zhang, J.; Li, F.; Zhao, X.; Bai, F.; Song, H.; Liu, C. Electrochemical Control of Cell Metabolism Improves Ethanol Production of Zymomonas mobilis in an Electro-Fermentation System. ACS Sustain. Chem. Eng. 2023, 11, 2364–2374. [Google Scholar] [CrossRef]
- Tahir, K.; Ali, A.S.; Ghani, A.A.; Hussain, M.; Kim, B.; Lim, Y.; Lee, D.S. Enhanced bio-electrochemical performance of microbially catalysed anode and cathode in a microbial electrosynthesis system. Chemosphere 2023, 317, 137770. [Google Scholar] [CrossRef]
- Zhang, T.; Zhang, P.; Liu, C.; Zheng, Y.; Chen, X. Feasibility of hydrogen recovery and optimization of gas production from protein-rich food waste by bio-electrochemical system. Int. J. Hydrogen Energy 2022, 47, 31241–31254. [Google Scholar] [CrossRef]
- Chen, H.; Chen, B.; Su, Z.; Wang, K.; Wang, B.; Wang, Y.; Si, Z.; Wu, Y.; Cai, D.; Qin, P. Efficient lactic acid production from cassava bagasse by mixed culture of Bacillus coagulans and Lactobacillus rhamnosus using stepwise pH controlled simultaneous saccharification and co-fermentation. Ind. Crop. Prod. 2020, 146, 112175. [Google Scholar] [CrossRef]
- Kwan, T.H.; Hu, Y.; Lin, C.S.K. Techno-economic analysis of a food waste valorisation process for lactic acid, lactide and poly(lactic acid) production. J. Clean. Prod. 2018, 181, 72–87. [Google Scholar] [CrossRef]
- Zhang, W.; Li, X.; Zhang, T.; Li, J.; Lai, S.; Chen, H.; Gao, P.; Xue, G. High-rate lactic acid production from food waste and waste activated sludge via interactive control of pH adjustment and fermentation temperature. Chem. Eng. J. 2017, 328, 197–206. [Google Scholar] [CrossRef]
- Kadam, S.R.; Patil, S.; Bastawde, K.B.; Khire, J.M.; Gokhale, D.V. Strain improvement of Lactobacillus delbrueckii NCIM 2365 for lactic acid production. Process. Biochem. 2006, 41, 120–126. [Google Scholar] [CrossRef]
- Liu, S.; Wang, Q.; Li, Y.; Ma, X.; Zhu, W.; Wang, N.; Sun, H.; Gao, M. Highly efficient oriented bioconversion of food waste to lactic acid in an open system: Microbial community analysis and biological carbon fixation evaluation. Bioresour. Technol. 2023, 370, 128398. [Google Scholar] [CrossRef]
- Senila, L.; Cadar, O.; Kovacs, E.; Gal, E.; Dan, M.; Stupar, Z.; Simedru, D.; Senila, M.; Roman, C. L-Poly(lactic acid) Production by Microwave Irradiation of Lactic Acid Obtained from Lignocellulosic Wastes. Int. J. Mol. Sci. 2023, 24, 9817. [Google Scholar] [CrossRef]
- Swetha, T.A.; Ananthi, V.; Bora, A.; Sengottuvelan, N.; Ponnuchamy, K.; Muthusamy, G.; Arun, A. A review on biodegradable polylactic acid (PLA) production from fermentative food waste—Its applications and degradation. Int. J. Biol. Macromol. 2023, 234, 123703. [Google Scholar] [CrossRef]
- López-Gómez, J.P.; Alexandri, M.; Schneider, R.; Venus, J. A review on the current developments in continuous lactic acid fermentations and case studies utilising inexpensive raw materials. Process. Biochem. 2019, 79, 1–10. [Google Scholar] [CrossRef]
- Xue, G.; Lai, S.; Li, X.; Zhang, W.; You, J.; Chen, H.; Qian, Y.; Gao, P.; Liu, Z.; Liu, Y. Efficient bioconversion of organic wastes to high optical activity of l-lactic acid stimulated by cathode in mixed microbial consortium. Water Res. 2018, 131, 1–10. [Google Scholar] [CrossRef] [PubMed]
- Gao, M.; Ma, X.; Song, N.; Wang, Q.; Wu, C. A newly isolated strain, Lactobacillus paracasei subsp. 2, producesl-lactic acid from pilot-scale fermentation of food waste under sterile and nonsterile conditions. J. Chem. Technol. Biotechnol. 2020, 95, 3193–3201. [Google Scholar] [CrossRef]
- Liu, J.; Wang, Q.; Wang, S.; Zou, D.; Sonomoto, K. Utilisation of microwave-NaOH pretreatment technology to improve performance and l-lactic acid yield from vinasse. Biosyst. Eng. 2012, 112, 6–13. [Google Scholar] [CrossRef]
- Wang, J.; Wang, Q.; Xu, Z.; Zhang, W.; Xiang, J. Effect of Fermentation Conditions on L-Lactic Acid Production from Soybean Straw Hydrolysate. J. Microbiol. Biotechnol. 2015, 25, 26–32. [Google Scholar] [CrossRef]
- Zheng, J.; Gao, M.; Wang, Q.; Wang, J.; Sun, X.; Chang, Q.; Tashiro, Y. Enhancement of l -lactic acid production via synergism in open co-fermentation of Sophora flavescens residues and food waste. Bioresour. Technol. 2017, 225, 159–164. [Google Scholar] [CrossRef]
- Zheng, J.; Liu, Y.; Sun, X.; Wang, Q.; Zou, H.; Wang, J.; Gao, M. Open Fermentative Production of L-Lactic Acid from Distillers’ Grains by Lactobacillus casei CICC 6056. Bioresources 2017, 12, 393–406. [Google Scholar] [CrossRef]
- Ma, X.; Wang, J.; Gao, M.; Wang, N.; Li, C.; Wang, Q. Effect of pH regulation mode on byproduct ethanol generated from the lactic acid fermentation of Sophora flavescens residues. J. Clean. Prod. 2021, 279, 123536. [Google Scholar] [CrossRef]
- Li, X.; Chen, Y.; Zhao, S.; Chen, H.; Zheng, X.; Luo, J.; Liu, Y. Efficient production of optically pure l-lactic acid from food waste at ambient temperature by regulating key enzyme activity. Water Res. 2015, 70, 148–157. [Google Scholar] [CrossRef]
- Tang, J.; Wang, X.; Hu, Y.; Zhang, Y.; Li, Y. Lactic acid fermentation from food waste with indigenous microbiota: Effects of pH, temperature and high OLR. Waste Manag. 2016, 52, 278–285. [Google Scholar] [CrossRef]
- Tang, J.; Wang, X.C.; Hu, Y.; Zhang, Y.; Li, Y. Effect of pH on lactic acid production from acidogenic fermentation of food waste with different types of inocula. Bioresour. Technol. 2017, 224, 544–552. [Google Scholar] [CrossRef] [PubMed]
- Yang, L.; Chen, L.; Li, H.; Deng, Z.; Liu, J. Lactic acid production from mesophilic and thermophilic fermentation of food waste at different pH. J. Environ. Manag. 2022, 304, 114312. [Google Scholar] [CrossRef] [PubMed]
- Schievano, A.; Pepé Sciarria, T.; Vanbroekhoven, K.; De Wever, H.; Puig, S.; Andersen, S.J.; Rabaey, K.; Pant, D. Electro-Fermentation—Merging Electrochemistry with Fermentation in Industrial Applications. Trends Biotechnol. 2016, 34, 866–878. [Google Scholar] [CrossRef] [PubMed]
- Kumar, P.; Chandrasekhar, K.; Kumari, A.; Sathiyamoorthi, E.; Kim, B. Electro-Fermentation in Aid of Bioenergy and Biopolymers. Energies 2018, 11, 343. [Google Scholar] [CrossRef]
- Lim, J.W.; Chiam, J.A.; Wang, J. Microbial community structure reveals how microaeration improves fermentation during anaerobic co-digestion of brown water and food waste. Bioresour. Technol. 2014, 171, 132–138. [Google Scholar] [CrossRef]
- Han, E.J.Y.; Olias, L.G.; Wuertz, S.; Hinks, J. Bioelectroanalytical Detection of Lactic Acid Bacteria. Appl. Sci. 2022, 12, 1257. [Google Scholar] [CrossRef]
- Flores-Rodriguez, C.; Min, B. Enrichment of specific microbial communities by optimum applied voltages for enhanced methane production by microbial electrosynthesis in anaerobic digestion. Bioresour. Technol. 2020, 300, 122624. [Google Scholar] [CrossRef]
- Li, H.; Yao, J.; Min, N.; Sunahara, G.; Duran, R. New insights on the effect of non-ferrous metal mining and smelting activities on microbial activity characteristics and bacterial community structure. J. Hazard. Mater. 2023, 453, 131301. [Google Scholar] [CrossRef]
- Wang, Q.; Yang, L.; Feng, K.; Li, H.; Deng, Z.; Liu, J. Promote lactic acid production from food waste fermentation using biogas slurry recirculation. Bioresour. Technol. 2021, 337, 125393. [Google Scholar] [CrossRef]
- Im, S.; Lee, M.; Yun, Y.; Cho, S.; Kim, D. Effect of storage time and temperature on hydrogen fermentation of food waste. Int. J. Hydrogen Energy 2020, 45, 3769–3775. [Google Scholar] [CrossRef]
- Wu, S.; Xu, S.; Chen, X.; Sun, H.; Hu, M.; Bai, Z.; Zhuang, G.; Zhuang, X. Bacterial Communities Changes during Food Waste Spoilage. Sci. Rep. 2018, 8, 8220. [Google Scholar] [CrossRef] [PubMed]
- Andersen, S.J.; Candry, P.; Basadre, T.; Khor, W.C.; Roume, H.; Hernandez-Sanabria, E.; Coma, M.; Rabaey, K. Electrolytic extraction drives volatile fatty acid chain elongation through lactic acid and replaces chemical pH control in thin stillage fermentation. Biotechnol. Biofuels 2015, 8, 221. [Google Scholar] [CrossRef] [PubMed]
- Ali, N.; Gong, H.; Giwa, A.S.; Yuan, Q.; Wang, K. Metagenomic analysis and characterization of acidogenic microbiome and effect of pH on organic acid production. Arch. Microbiol. 2019, 201, 1163–1171. [Google Scholar] [CrossRef] [PubMed]
- Sakai, K.; Mori, M.; Fujii, A.; Iwami, Y.; Chukeatirote, E.; Shirai, Y. Fluorescent in situ hybridization analysis of open lactic acid fermentation of kitchen refuse using rRNA-targeted oligonucleotide probes. J. Biosci. Bioeng. 2004, 98, 48–56. [Google Scholar] [CrossRef]
- Zhao, W.; Su, X.; Zhang, Y.; Xia, D.; Hou, S.; Zhou, Y.; Fu, H.; Wang, L.; Yin, X. Microbial electrolysis enhanced bioconversion of coal to methane compared with anaerobic digestion: Insights into differences in metabolic pathways. Energy Convers. Manag. 2022, 259, 115553. [Google Scholar] [CrossRef]
- Feng, Q.; Song, Y.; Li, J.; Wang, Z.; Wu, Q. Influence of electrostatic field and conductive material on the direct interspecies electron transfer for methane production. Environ. Res. 2020, 188, 109867. [Google Scholar] [CrossRef]
- Quan, X.; Sun, B.; Xu, H. Anode decoration with biogenic Pd nanoparticles improved power generation in microbial fuel cells. Electrochim. Acta 2015, 182, 815–820. [Google Scholar] [CrossRef]
- Luo, S.; Liu, F.; Fu, B.; He, K.; Yang, H.; Zhang, X.; Liang, P.; Huang, X. Onset Investigation on Dynamic Change of Biohythane Generation and Microbial Structure in Dual-chamber versus Single-chamber Microbial Electrolysis Cells. Water Res. 2021, 201, 117326. [Google Scholar] [CrossRef]
Disclaimer/Publisher’s Note: The statements, opinions and data contained in all publications are solely those of the individual author(s) and contributor(s) and not of MDPI and/or the editor(s). MDPI and/or the editor(s) disclaim responsibility for any injury to people or property resulting from any ideas, methods, instructions or products referred to in the content. |
© 2025 by the authors. Licensee MDPI, Basel, Switzerland. This article is an open access article distributed under the terms and conditions of the Creative Commons Attribution (CC BY) license (https://creativecommons.org/licenses/by/4.0/).