Perspective

The First Thirty Years of Green Stormwater Infrastructure in Portland, Oregon

1
Faculty of Architecture, Czech Technical University, 160 00 Prague, Czech Republic
2
Shiley School of Engineering, University of Portland, Portland, OR 97203, USA
3
Department of Geography, Portland State University, Portland, OR 97201, USA
4
Toulan School of Urban Studies and Planning, Portland State University, Portland, OR 97207, USA
5
City of Portland Bureau of Environmental Services, Portland, OR 97204, USA
6
City of Gresham, Gresham, OR 97030, USA
7
KPFF, Portland, OR 97204, USA
8
Zucker Engineering, LLC, Portland, OR 97214, USA
*
Author to whom correspondence should be addressed.
Retired.
Sustainability 2025, 17(15), 7159; https://doi.org/10.3390/su17157159
Submission received: 28 May 2025 / Revised: 27 July 2025 / Accepted: 31 July 2025 / Published: 7 August 2025

Abstract

Over the past 30 years, the City of Portland, Oregon, USA, has emerged as a national leader in green stormwater infrastructure (GSI). The initial impetus for implementing sustainable stormwater infrastructure in Portland stemmed from concerns about flooding and water quality in the city’s two major rivers, the Columbia and the Willamette. Heavy rainfall often led to combined sewer overflows, significantly polluting these waterways. A partial solution was the construction of “The Big Pipe” project, a large-scale stormwater containment system designed to filter and regulate overflow. However, Portland has taken a more comprehensive and long-term approach by integrating sustainable stormwater management into urban planning. Over the past three decades, the city has successfully implemented GSI to mitigate these challenges. Low-impact development strategies, such as bioswales, green streets, and permeable surfaces, have been widely adopted in streetscapes, pathways, and parking areas, enhancing both environmental resilience and urban livability. This perspective highlights the history of the implementation of Portland’s GSI programs, current design and performance standards, and challenges and lessons learned throughout Portland’s recent history. Innovative approaches to managing runoff have not only improved stormwater control but also enhanced green spaces and contributed to the city’s overall climate resilience while addressing economic well-being and social equity. Portland’s success is a result of strong policy support, effective integration of green and gray infrastructure, and active community involvement. As climate change intensifies, cities need holistic, adaptive, and community-centered approaches to urban stormwater management. Portland’s experience offers valuable insights for cities seeking to expand their GSI amid growing concerns about climate resilience, equity, and aging infrastructure.

1. Introduction

Increased impervious areas in urban settings have caused stormwater runoff volumes and pollutants to increase, which can cause degradation of aquatic ecosystems [1,2,3]. Combined sewers in older cities, aging and undersized infrastructure, and climate change have exacerbated this problem [4,5,6]. Many cities have older sewers that combine sewage with stormwater runoff, which is treated at a centralized wastewater treatment plant. During large rain events, the wastewater treatment plant is not able to handle runoff volumes and must discharge into waterways in a combined sewer overflow (CSO) event. Climate change has also impacted the ability to manage urban stormwater runoff, with larger, more intense storms causing localized flooding [4,7,8]. Aging infrastructure, such as collapsed or cracked pipes, undersized pump stations, etc., can cause additional flooding and degradation of aquatic ecosystems.
Green stormwater infrastructure (GSI), such as rain gardens, bioretention cells, detention ponds, and green roofs, has increased in prominence over the last several decades to reduce urban stormwater runoff and improve water quality [9,10,11,12,13,14,15,16,17,18,19,20,21,22,23,24]. Many of these studies have shown quantifiable reductions in runoff volumes and significant reductions in typical stormwater pollutants. Additionally, GSI has been used to reduce urban pluvial flooding while providing opportunities for community revitalization [25,26,27,28,29]. These studies found that small, localized GSI has minimal impact during heavy rainfall events, but integrated GSI and larger facilities can significantly reduce flooding. Overall, GSI has been shown to be an effective stormwater management strategy in urban areas.
The benefits of GSI go beyond just reducing stormwater runoff volumes and improving water quality. The social and environmental benefits and costs of installing GSI have been relatively well studied [30,31,32,33,34,35,36]. Added green areas from GSI can help reduce the urban heat island effect and mitigate climate-induced impacts of heat waves [35]. In addition, GSI reduces air pollution and provides habitat [34]. However, few studies have examined the social, environmental, and institutional context of GSI installation over time.
The City of Portland, Oregon, USA, is known to be a pioneer in the design and installation of GSI [37]. Portland’s early investments were in response to federal mandates to reduce CSOs [38]. Since then, Portland has expanded its GSI program from initial experimental sites to over 3000 installations throughout the city per the City of Portland GIS database. The US EPA has recommended GSI as a strategy for stormwater compliance [39] and many other US cities have implemented GSI to reduce CSO events, including Seattle, New York, and Philadelphia [40,41,42]. This paper aims to synthesize Portland’s success and challenges with implementing GSI, offering guidance to other municipalities, practitioners, and researchers. We present a retrospective synthesis of Portland’s experience with GSI, with a focus on public stormwater facilities such as curb extensions, green streets, and vegetated basins.

2. Methods

2.1. Site Description

Portland, Oregon, is located in the Pacific Northwest of the United States (Figure 1). In 2024, the population of the City of Portland was 635,749 over an area of 346 km2 [43]. Mean annual precipitation is 938 mm (37 inches), which occurs mostly in October–May [44]. It is common for little to no precipitation to fall during the summer months of June to September. Portland has experienced chronic flooding in several parts of the city [45]. To reduce flood risk, the City of Portland has proactively introduced GSI, including floodplain restoration, green streets, and green roofs, moving away from traditional gray infrastructure-focused flood risk reduction strategies [46].

2.2. Data Collection

This perspective is based on a synthesis of primary and secondary sources documenting the history and development of GSI in Portland from 1990 to the present day. Key sources include internal reports, design guidelines, policy documents, and the GIS database from the City of Portland Bureau of Environmental Services (BES), peer-reviewed literature on GSI performance and scalability in Portland, reports and trade publications on stormwater practices in Portland, and professional experience and insights from municipal staff and local professionals who have direct experience designing and maintaining these facilities. The City of Portland website, Summit, IEEE Xplore, and Google Scholar were used to find sources, in addition to municipal staff providing reports and documents. Sources were selected and analyzed for the key themes of regulatory requirements for reducing CSOs, policy evolution, institutional frameworks, community engagement, the impact of GSI on runoff volumes, water quality, and climate change. Municipal staff and local professionals were able to provide insights into GSI design and innovative designs that are not published elsewhere.
We use a chronological historical sociohydrological framework, which seeks to understand the evolving nature of human and water interactions over time, to track major phases of Portland’s GSI development, with added thematic synthesis of regulatory drivers, challenges, successes, and future directions. The historical sociohydrological approach is a nascent field that has emerged in recent years for understanding the coevolution of water policy and water quality changes [47]. A brief description of the installation of Portland’s drainage system in the early 1900s is included to provide context for the drivers of GSI in Portland. This chronological framework is followed by innovative case studies to illustrate GSI development in Portland. Hydrologic, water quality, and social impacts are then discussed, as well as lessons learned and challenges.

3. Results

3.1. Historical Evolution of GSI in Portland

Like many older cities, Portland developed its stormwater drainage systems over time and progressed from combined sewer and stormwater drainage systems to separate stormwater treatment and local infiltration. The main motivation for the initial installation of GSI was in response to a consent decree with the Oregon Department of Environmental Quality (DEQ) to reduce combined sewer overflows by 2011 [48], but the program has since expanded with the goals of improving water quality and maximizing urban green space. As of 2025, the city has over 3000 facilities. Green streets, which are streetside planters between the street and the sidewalk (also known as rain gardens or bioswales), make up the majority of Portland’s facilities (over 80%), though the city also has swales, roadside treatment facilities, and large basins and ponds (Figure 1). An overview of key events is provided in Table 1, and a detailed narrative of the historical evolution of Portland’s GSI approach follows.

3.1.1. Initial Drainage Design (1845–1990)

Portland, Oregon, located along the Willamette River at the confluence with the Columbia River, was platted as a city in 1845, and the first English-speaking settlers arrived in 1846 [49]. Early conveyance systems were constructed from wood and directed sanitary sewage and stormwater to the Willamette River and Columbia Slough through combined sewers [50]. Parts of Portland incorporated at later dates are not included in the combined system [50]. In East Portland, stormwater is infiltrated into the ground through underground infiltration facilities called sumps, while the hills on the west side of the city and areas along water bodies drain directly into surface water in a separate storm system [50].
Portland began construction of interceptor sewers in the 1940s and opened a wastewater treatment plant in 1952 that was designed to treat dry weather flows [50]. The system was designed in response to prolonged dry summer periods with minimal precipitation and extensive precipitation in winter [50]. In 1977, Portland created a stormwater utility and added a stormwater utility fee [38]. The fee was charged on all properties in the city based on impervious area coverage and was used to fund urban drainage and flood control issues [38,51].
The combined sewer system adequately treated flows during dry weather, but during some wet weather events, even as small as 2.5 mm (0.1 inches), combined sewage overflowed (CSOs) into the Willamette River and Columbia Slough. The CSO events could last days to weeks and happened more than 50 times per year [50].

3.1.2. Early Innovations and Pilot Projects (1990–1999)

In 1991, the Oregon Department of Environmental Quality (DEQ) issued a Stipulation and Final Order under the Clean Water Act (as amended in 1972) that required substantial control of CSOs in Portland’s combined system by 2011 [48]. This regulatory milestone catalyzed a broad shift in how Portland approached stormwater management.
In 1995, DEQ issued Portland’s National Pollutant Discharge Elimination System (NPDES), the Municipal Separate Storm Sewer System (MS4) Discharge Permit. The MS4 permit regulates stormwater discharges to waters of the US and requires specific actions to control erosion from construction activities, installation of post-development stormwater controls, removing non-stormwater connections, and regulating non-stormwater discharges. It also requires public engagement, monitoring, and annual reporting [52].
In 2005, DEQ issued Portland’s Water Pollution Control Facility (WPCF) permit to protect groundwater under the Safe Drinking Water Act for operation of class V underground injection control facilities. The permit applied to the approximately 8500 active UICs in the city’s ownership at the time of the permit. It established discharge limitations, monitoring and reporting requirements, and compliance conditions and schedules [53].
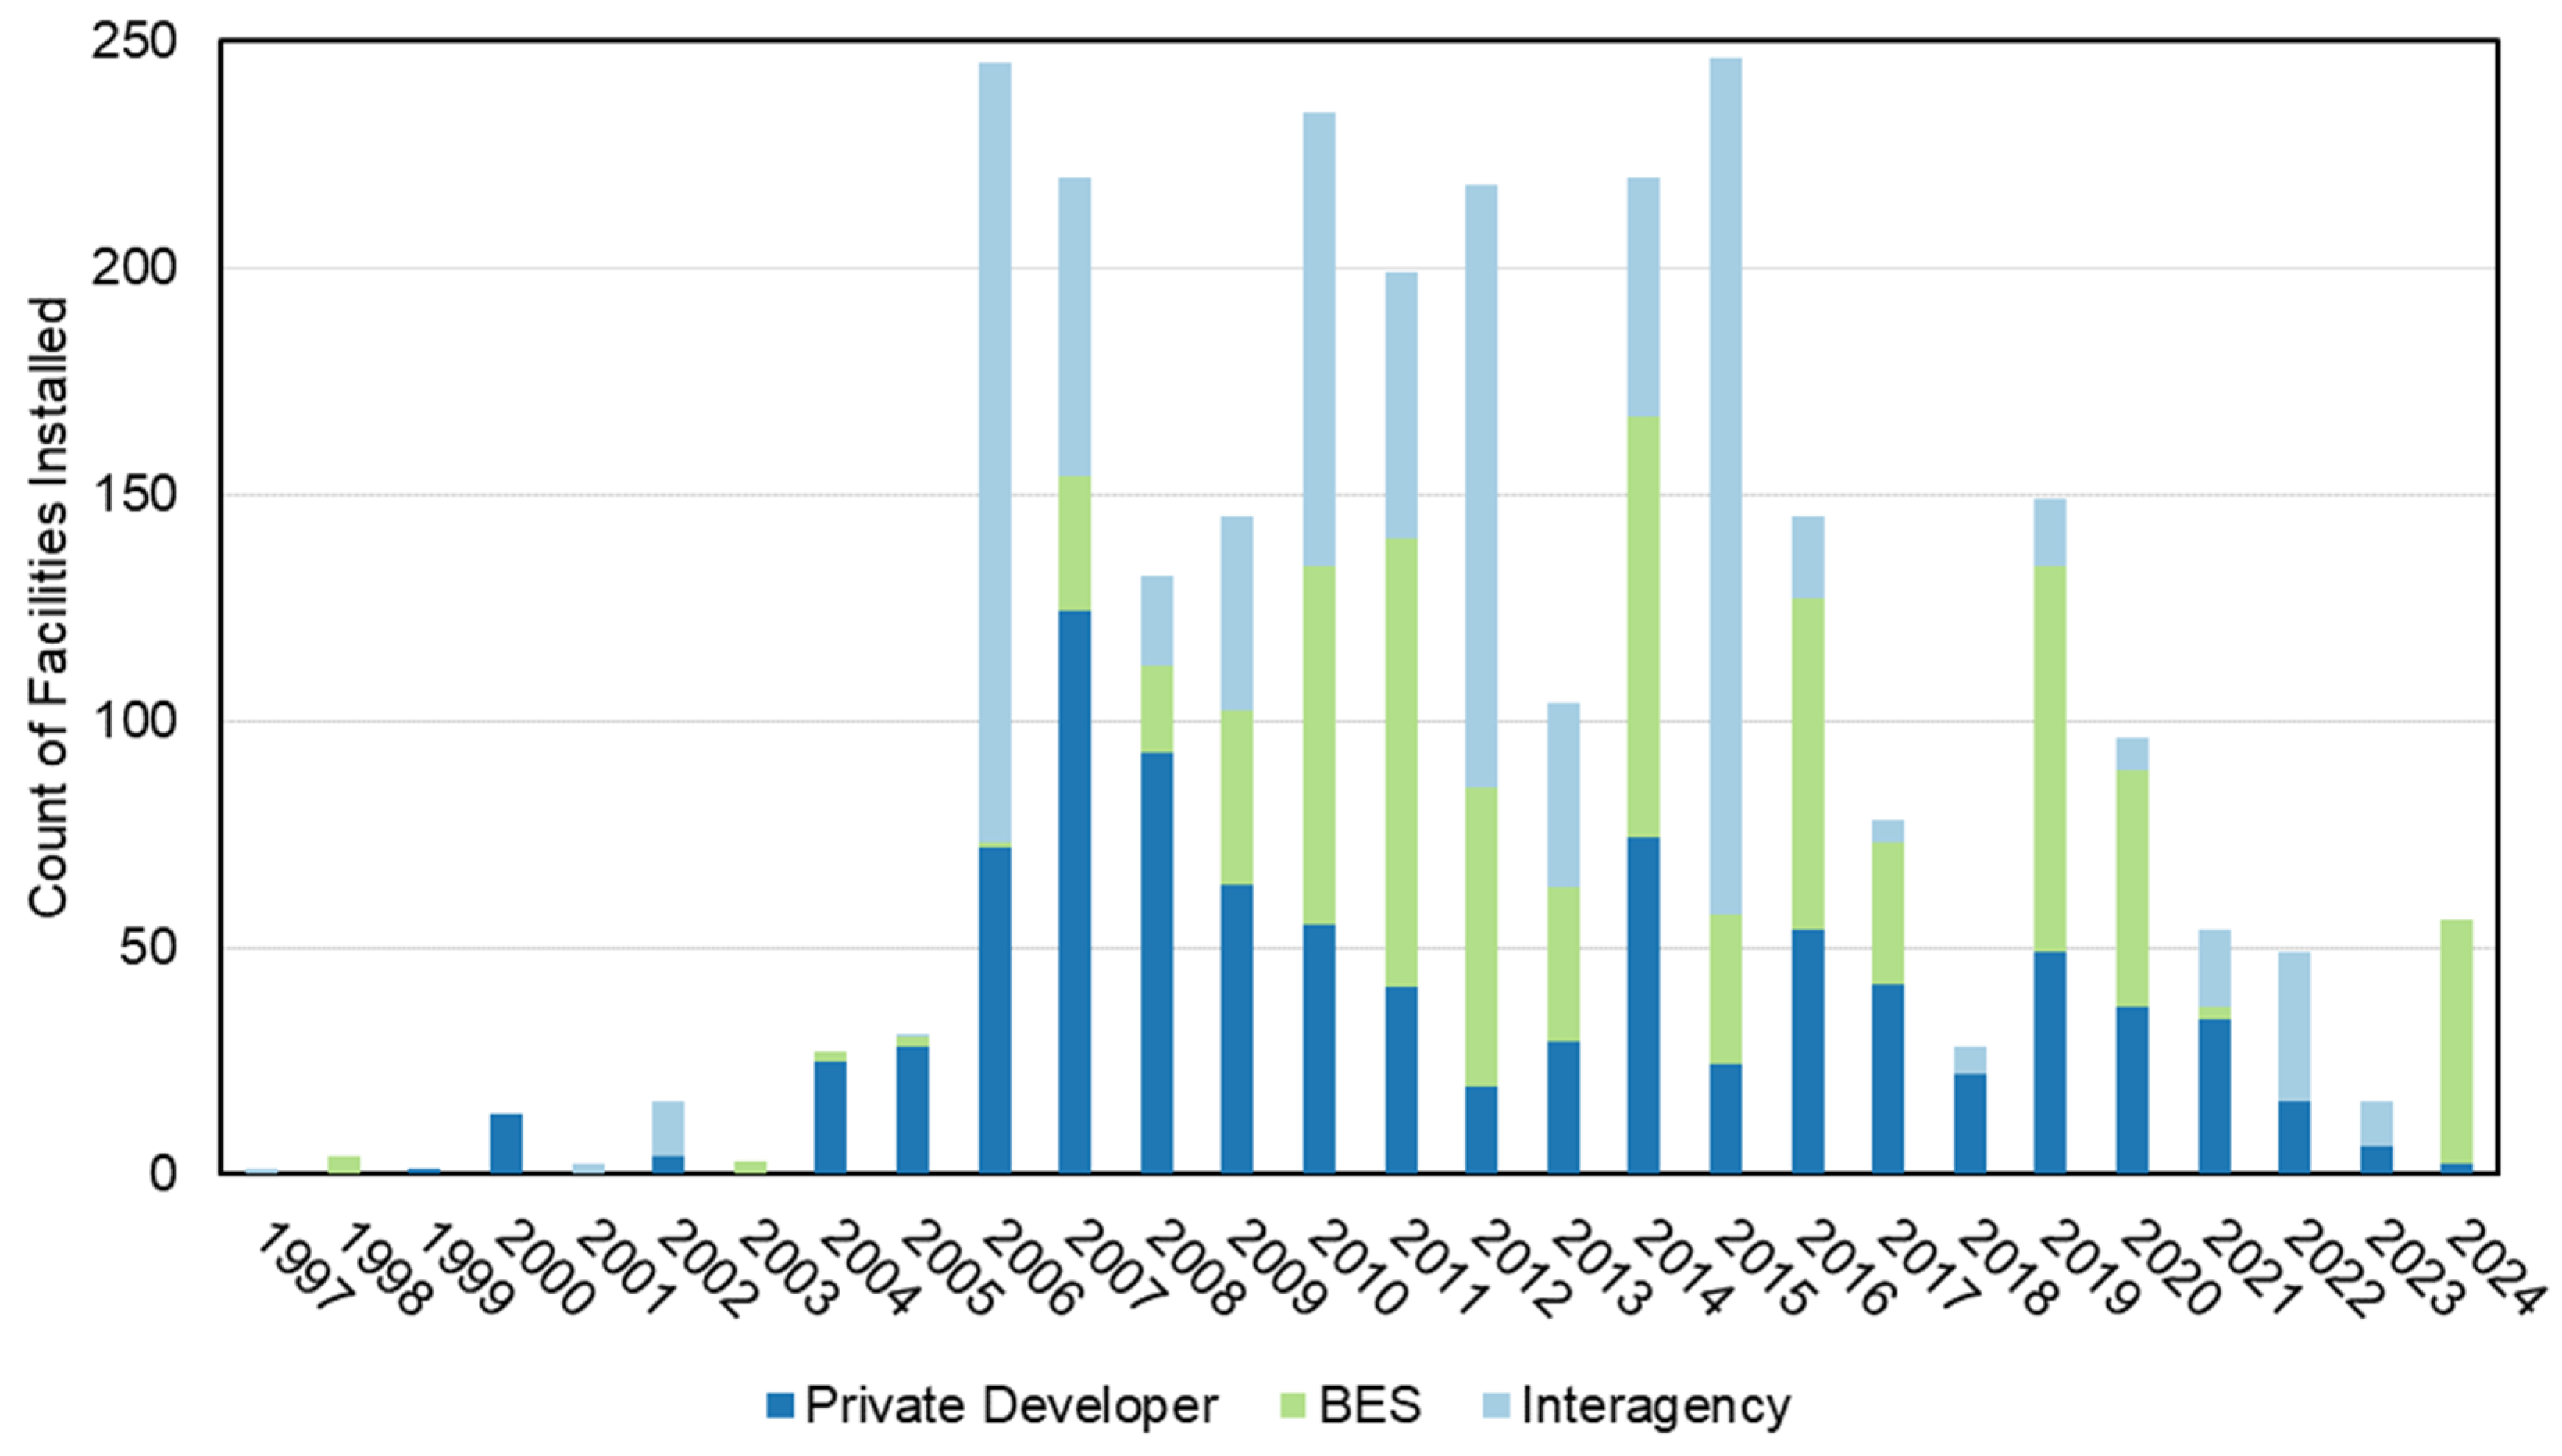
These regulatory drivers led Portland’s Bureau of Environmental Services (BES) to implement numerous GSI demonstration projects during a period starting in the mid-1990s and extending to roughly 2010 (Figure 2). Although the main impetus for GSI implementation was to meet regulatory requirements, the BES was motivated to lead the country in green solutions [54]. During a time when very few studies on GSI were published, the City of Portland allowed the BES to implement demonstration projects that helped inform GSI design. These projects, located on both private and public (right-of-way) properties, including schools, supported the development of Portland’s first Stormwater Management Manual (SWMM) in 1999. Early pilot projects, such as a swale retrofit at the Oregon Museum of Science and Industry in 1996, were initiated through different sources, such as encouragement and technical support of GSI private development (infill housing, commercial and industrial), and city-initiated capital improvement GSI projects, either through the BES or the Bureau of Transportation.
Recognizing that city-led retrofits alone would place a heavy burden on stormwater utility ratepayers, Portland strategically leveraged the city’s development boom in the 1990s and 2000s, including infill, greenfield, and commercial redevelopment, to expand GSI adoption. The 1999 SWMM and further revisions strengthened requirements for redevelopment to incorporate GSI techniques and manage stormwater on site to the “maximum extent practicable” [56]. The manual prioritized vegetated and infiltration-based facilities and introduced a “Simplified Approach” to streamline permitting and design for small developments on private property. Green street installations in Portland quickly expanded beyond initial municipal efforts to include contributions from private developers and interagency partners. Today, approximately 29% are installed by the City of Portland, 33% by private developers, and 38% through interagency projects.
The SWMM remained a key regulatory tool through subsequent updates. From 1999 through 2024, it applied to projects disturbing 46.4 m2 (500 square feet) or more of impervious surface; in 2025, this threshold was increased to 93 m2 (1,000 square feet) [57]. The SWMM continues to play a critical role in shaping how stormwater is managed across Portland’s built environment.

3.1.3. Expansion and Formalization (2000–2005)

In the early 2000s, Portland formed a “Water Quality Friendly Streets” collaboration between the BES and the Bureau of Transportation. This collaboration was later retitled the “Green Streets” group. The group was tasked with developing and refining GSI techniques for managing stormwater runoff from public streets within the public street right-of-way, primarily using rain gardens, streetside planters, and pervious (aka porous or permeable) pavements [55].
The “One Percent for Green” fund supports the construction of green streets. This fund is raised from one percent of the construction budget for any projects requiring a street opening permit (with certain exceptions) [38,58,59]. The BES also received funding support from the US Environmental Protection Agency (EPA) for the initial implementation of the Green Streets program [60].
Effective adoption of GSI for stormwater management by the private development community (planners, architects, engineers, developers, etc.) was not an easy or timely process. It generally requires a degree of stormwater management planning and design much earlier in the development process, as areas of land must be identified and set aside for this purpose. This can influence where structures are placed, how streets are laid out, and to what degree the overall property can be developed. It also requires earlier and closer collaboration between a project’s planners, engineers, architects, and landscape architects. While still a work in progress, it took several years for the private development community to come to terms with this new paradigm in Portland.
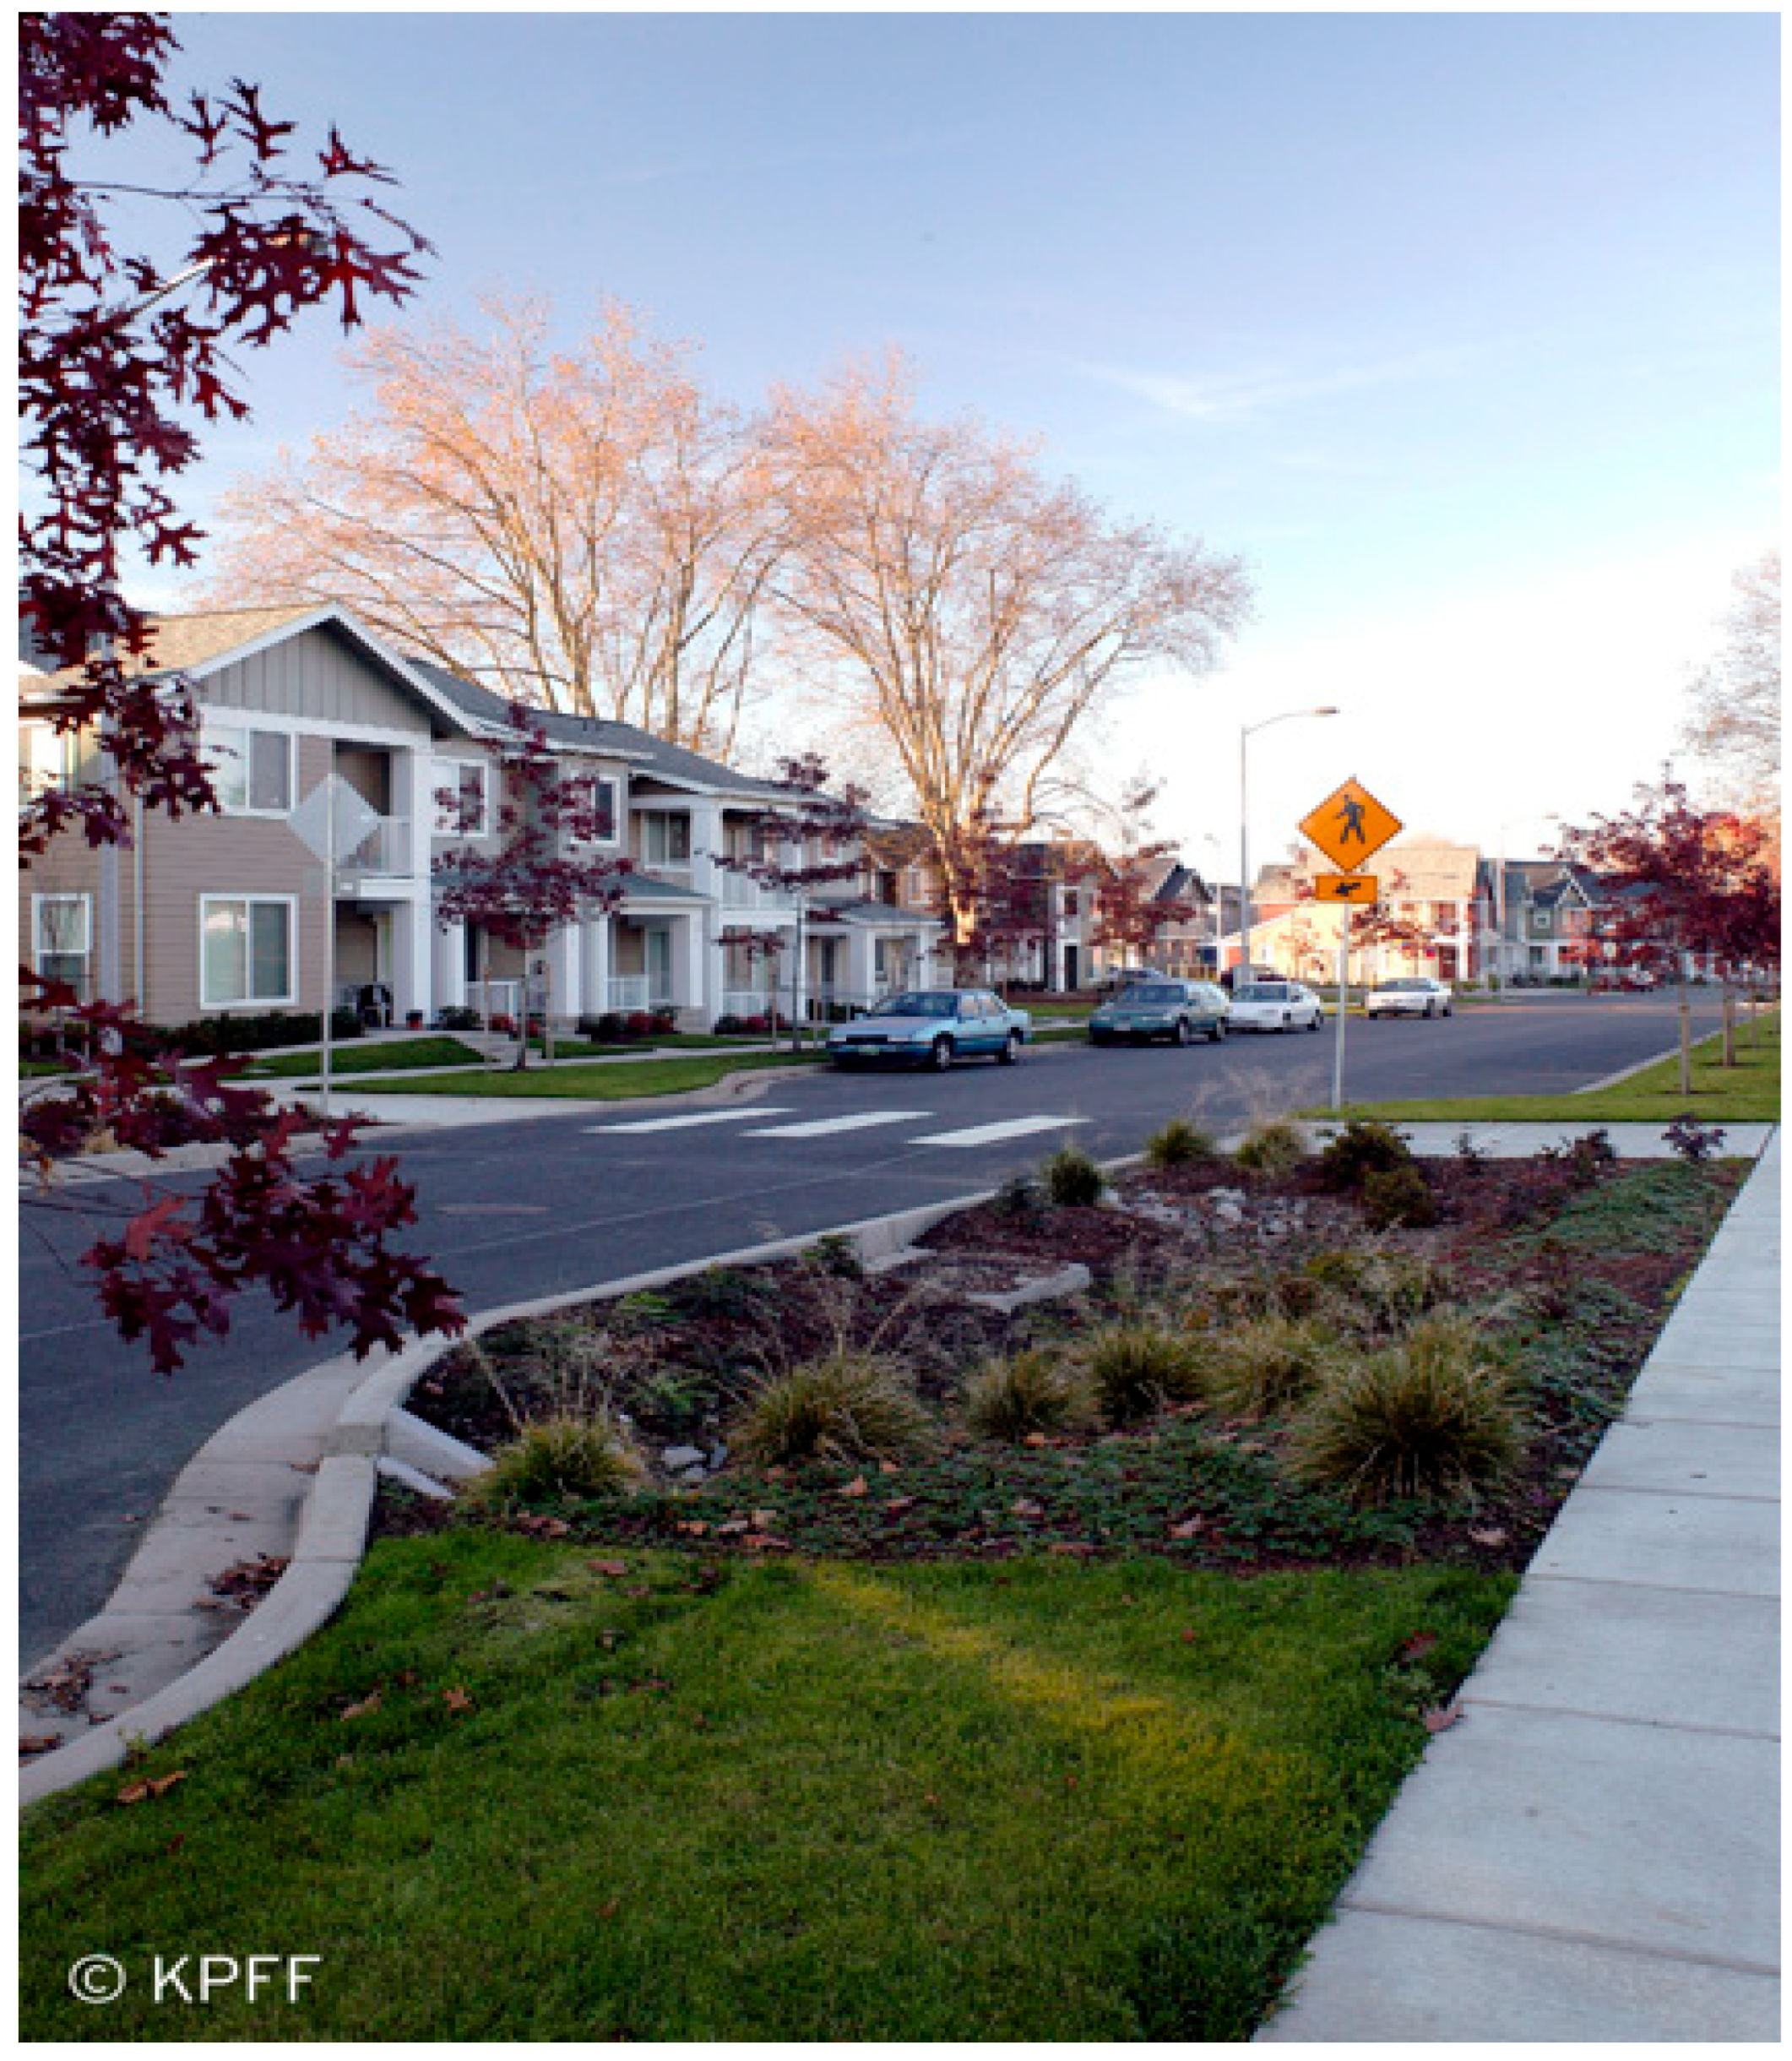
Portland constructed the first pair of streetside bioretention facilities (NE Siskiyou “green streets”) in 2003 and, within a few years, had built additional small-scale green streets projects to refine various design features before implementing larger-scale projects [37]. Around the same time, Portland worked collaboratively with several private development projects to incorporate green street facilities, such as the street network constructed as a part of the Cascade Station development near Portland International Airport and the “pocket swales” constructed as part of the New Columbia neighborhood (Figure 3). Other early examples included Seattle’s Street Edge Alternative (SEA) program demonstrating streetside rain gardens, Oregon Museum of Science and Industry (OMSI) parking lot swales [61], and the Pringle Creek Community in Salem (rain gardens, mature tree preservation, and pervious pavement streets).
These examples of public and private development incorporated GSI effectively, showcasing it as an asset with multiple benefits rather than solely utilitarian stormwater infrastructure [62]. Portland frequently highlighted these projects to educate and inspire the local development community, promoting them as models for effective and innovative GSI implementation.

3.1.4. Reducing Combined Sewer Overflows (2006–2011)

This era marked a dramatic scale-up in Portland’s stormwater infrastructure, primarily targeting the reduction in combined sewer overflows. In 2011, Portland completed the Big Pipe Project, which is a series of three large storage tunnels collectively reducing CSOs to the Willamette River by 94% and by 99% to the Columbia Slough. The project took 20 years to construct, cost USD 1.4 billion, and was the largest public works project in Portland’s history. Today, there are typically only four CSO events per year on average [63].
In addition to constructing three large storage tunnels, Portland took additional measures to remove stormwater from its combined sewer system. The Downspout Disconnection (1996–2011) program removed gutter downspouts from the combined sewer and directed stormwater onto yards and gardens. It disconnected more than 56,000 downspouts and removed 4.5 million m3 (1.2 billion gallons) of stormwater per year from the combined system, raising public awareness of stormwater management strategies [64,65]. BES grant programs were developed to support the implementation of GSI projects, which also increased public awareness and the implementation of GSI throughout Portland [64]. Other major efforts included separating stormwater from targeted locations and increasing infiltration in public streets by installing 3000 stormwater sumps (aka “drywells”, which are 9 m (30 feet) deep, with 1.2 m (4 foot) diameter concrete wells with perforated side walls to allow stormwater to infiltrate into native soils) [63].
In addition, in 2006, the City of Portland started the Clean River Rewards Program to provide discounts to property owners for managing stormwater on their properties [66]. The discounts are available for up to 35% of the stormwater charges [64]. Discounts were available to sites that did not discharge stormwater off site and were greater for sites with green infrastructure [67].
The first programmatic installation of green streets on a larger scale began in 2006, after green streets had been added to the 2004 version of the City’s Stormwater Management Manual [68] as a tool for meeting private development requirements, and when the first large public works sewer capacity projects that included green streets began to be implemented (Figure 2). Annual green street installations due to private development were more variable following economic cycles, while targeted public works installations continued at a fairly even pace through 2019. The majority of public works green street facilities have been constructed in areas served by the combined sewer to help protect residents from sewer backups. Portland contributed funds to more than ten demonstration projects on private property as part of a grant program in 2006/2007. The BES also managed a separate grant program from 2002 to 2009 with federal funding from the US EPA, which provided financial support for 29 GSI demonstration projects of all kinds [60]. The projects displayed how GSI can cost-effectively meet stormwater management requirements while providing many other benefits. The projects provided designers with important local examples of approaches for addressing different site characteristics.
Portland also ramped up its support for green roofs (called ecoroofs in Portland), with the 2001 Green Building Policy and 2005 updates requiring ecoroof installations on new or renovated city buildings. Additional incentives included floor area ratio (FAR) bonuses for buildings that incorporated ecoroofs (2006) and grant programs (2007) as part of the Gray-to-Green initiative [37,69]. Runoff monitoring also started in some city buildings, such as the Harrison Building, where Portland State University researchers evaluated the effectiveness of ecoroofs on peak runoff reductions [70]. Additionally, ecoroofs were installed in commercial buildings, and both runoff and water quality monitoring continued in the Walmart building in north Portland [70].

3.1.5. Mainstreaming and Maturation (2012–2020)

With foundational systems in place, Portland shifted toward refining green infrastructure design, institutionalizing it in both public and private development. By 2013, the BES had completed a program of baseline monitoring, which showed that ecoroofs, stormwater planters, and green streets facilities could, in most cases, meet Portland stormwater management goals for flow control, retention, and water quality. Bench tests were used in some cases, such as the BES-funded soil water quality tests conducted at Portland State University [71], but field tests were used to assess the variability in working installations and to help refine numerous design features. The results indicated some seasonal performance variability in retention, but average annual results were generally excellent and confirmed the basis for Portland’s preference and basic standards for green infrastructure [70]. The Glencoe School rain garden, constructed in 2003, is one of the facilities that the BES monitored intensively to assess performance relative to goals for protecting residents from sewer backups and removing runoff from the combined sewer [70].
Portland also increasingly embedded GSI in private development projects through the ongoing application of the SWMM. Developers began to plan earlier for stormwater needs, recognizing the spatial and design implications of GSI. While cultural and workflow challenges persisted, Portland’s developer community gradually adapted.
Monitoring data and growing implementation experience helped define best practices, reduce risk, and foster broader adoption. Portland also completed baseline assessments that shaped citywide GSI expectations.

3.1.6. Policy Evolution and Equity Focus (2021–2025)

By the start of the 2020s, Portland’s green infrastructure strategy shifted to address policy evolution, climate adaptation, and equity. In 2021, the Central City Plan District began requiring ecoroofs on 100% of the roof area for new developments over 1858 m2 (20,000 square feet) [72]. Up to 40% of roof space could be dedicated to non-ecoroof uses, such as solar or mechanical systems.
In 2025, Portland revised the SWMM, raising the applicability threshold to 93 m2 (1000 square feet) of impervious surface. This change acknowledged improved confidence in GSI performance and project-level flexibility [57,73]. Design tools also matured. Early sizing methods based on infiltration rates and surface storage formed the basis for today’s Presumptive Approach Calculator (PAC) [55,74]. By 2024, Portland had installed over a thousand green street facilities, many in CSO basins to reduce sewer backups and manage runoff [55]. Figure 2 shows a sustained citywide commitment to distributed green stormwater solutions, with an average of over 40 green streets still installed annually, and Portland has continually been recognized in the field [75].
Spatial studies revealed inequities in GSI distribution, with clusters concentrated in combined sewer areas with local capacity issues and correlations to pipe density and median income [76,77,78], while there has been some improvement in recent years since GSI installations have occurred in flood-prone areas. These insights shaped future GSI planning and investment strategies.
Portland does not have numeric strategic goals associated with GSI implementation, and the rate of GSI implementation continues to vary greatly from year to year due to several factors. Facilities are installed both as part of capital-funded public infrastructure projects and to meet the requirements of private development. City budget cycles, project prioritization, grant fund availability, and the state of the economy are major influences. Portland looks for opportunities to obtain additional funding from state or federal sources, looks for efficiencies that may be gained through greater infrastructure bureau coordination, and reaches out for lessons learned from other communities implementing large-scale GSI [79].
GSI implementation is a primary tool to help Portland meet regulatory requirements and make progress toward our strategic goals. The BES Strategic Plan calls for the bureau to remain a leader in GSI to ensure a resilient stormwater system and improve watershed health [80]. GSI also plays a role in addressing Portland’s climate resilience goals, including stormwater management, urban heat mitigation, air quality improvement, carbon sequestration, biodiversity, and improved mental health [57]. Portland operates several programs and initiatives that contribute to the ongoing implementation of GSI, including the Clean Energy Fund, Clean River Rewards, and the Treebate Program [81]. The Clean Energy Fund is a citywide, voter-approved climate action program that includes funding for green stormwater infrastructure through community grants. Other community GSI grant programs include Percent for Green and the Community Watershed Stewardship Program that help communities implement GSI projects that provide broad benefits for watershed health and the community. Clean River Rewards and the Treebate Program provide discounts and credits on a customer’s stormwater bill. All of these programs provide incentives for residents and developers to implement GSI in Portland.

3.2. Innovative Case Studies

The following case studies demonstrate how creative design, community partnerships, and early planning helped redefine stormwater management in Portland.

3.2.1. Slough 104B Green Streets

In 2018, the BES constructed the Slough 104B stormwater project, which included 53 separate green street facilities distributed along adjacent streets in a small neighborhood (Figure 4). These green streets were installed to provide water quality treatment and stormwater infiltration with the aim of improving water quality in the Columbia Slough. The large number of facilities provided a unique opportunity to draw statistical conclusions about the effects of two design changes on soil moisture and plant health. Plant mortality due to summer moisture stress is an issue for green street facilities with liners, where plant roots cannot access the native soil. The project provided important results about the use of a shorter underdrain system and a trial soil blend with more silt and clay to improve water holding and plant health. A log-linear statistical model found a significant relationship between the absence of a liner and plant health; facilities without liners had healthier plants and more plant cover [82]. For lined facilities, plants performed better in facilities with the trial soil blend. The trial soil blend had no impact on plant health for facilities without a liner. Soil moisture monitoring in lined facilities found that facilities with the trial soil blend had 9.5% higher soil moisture at field capacity than facilities with the standard blend [83,84].

3.2.2. Capitol Highway Bioretention

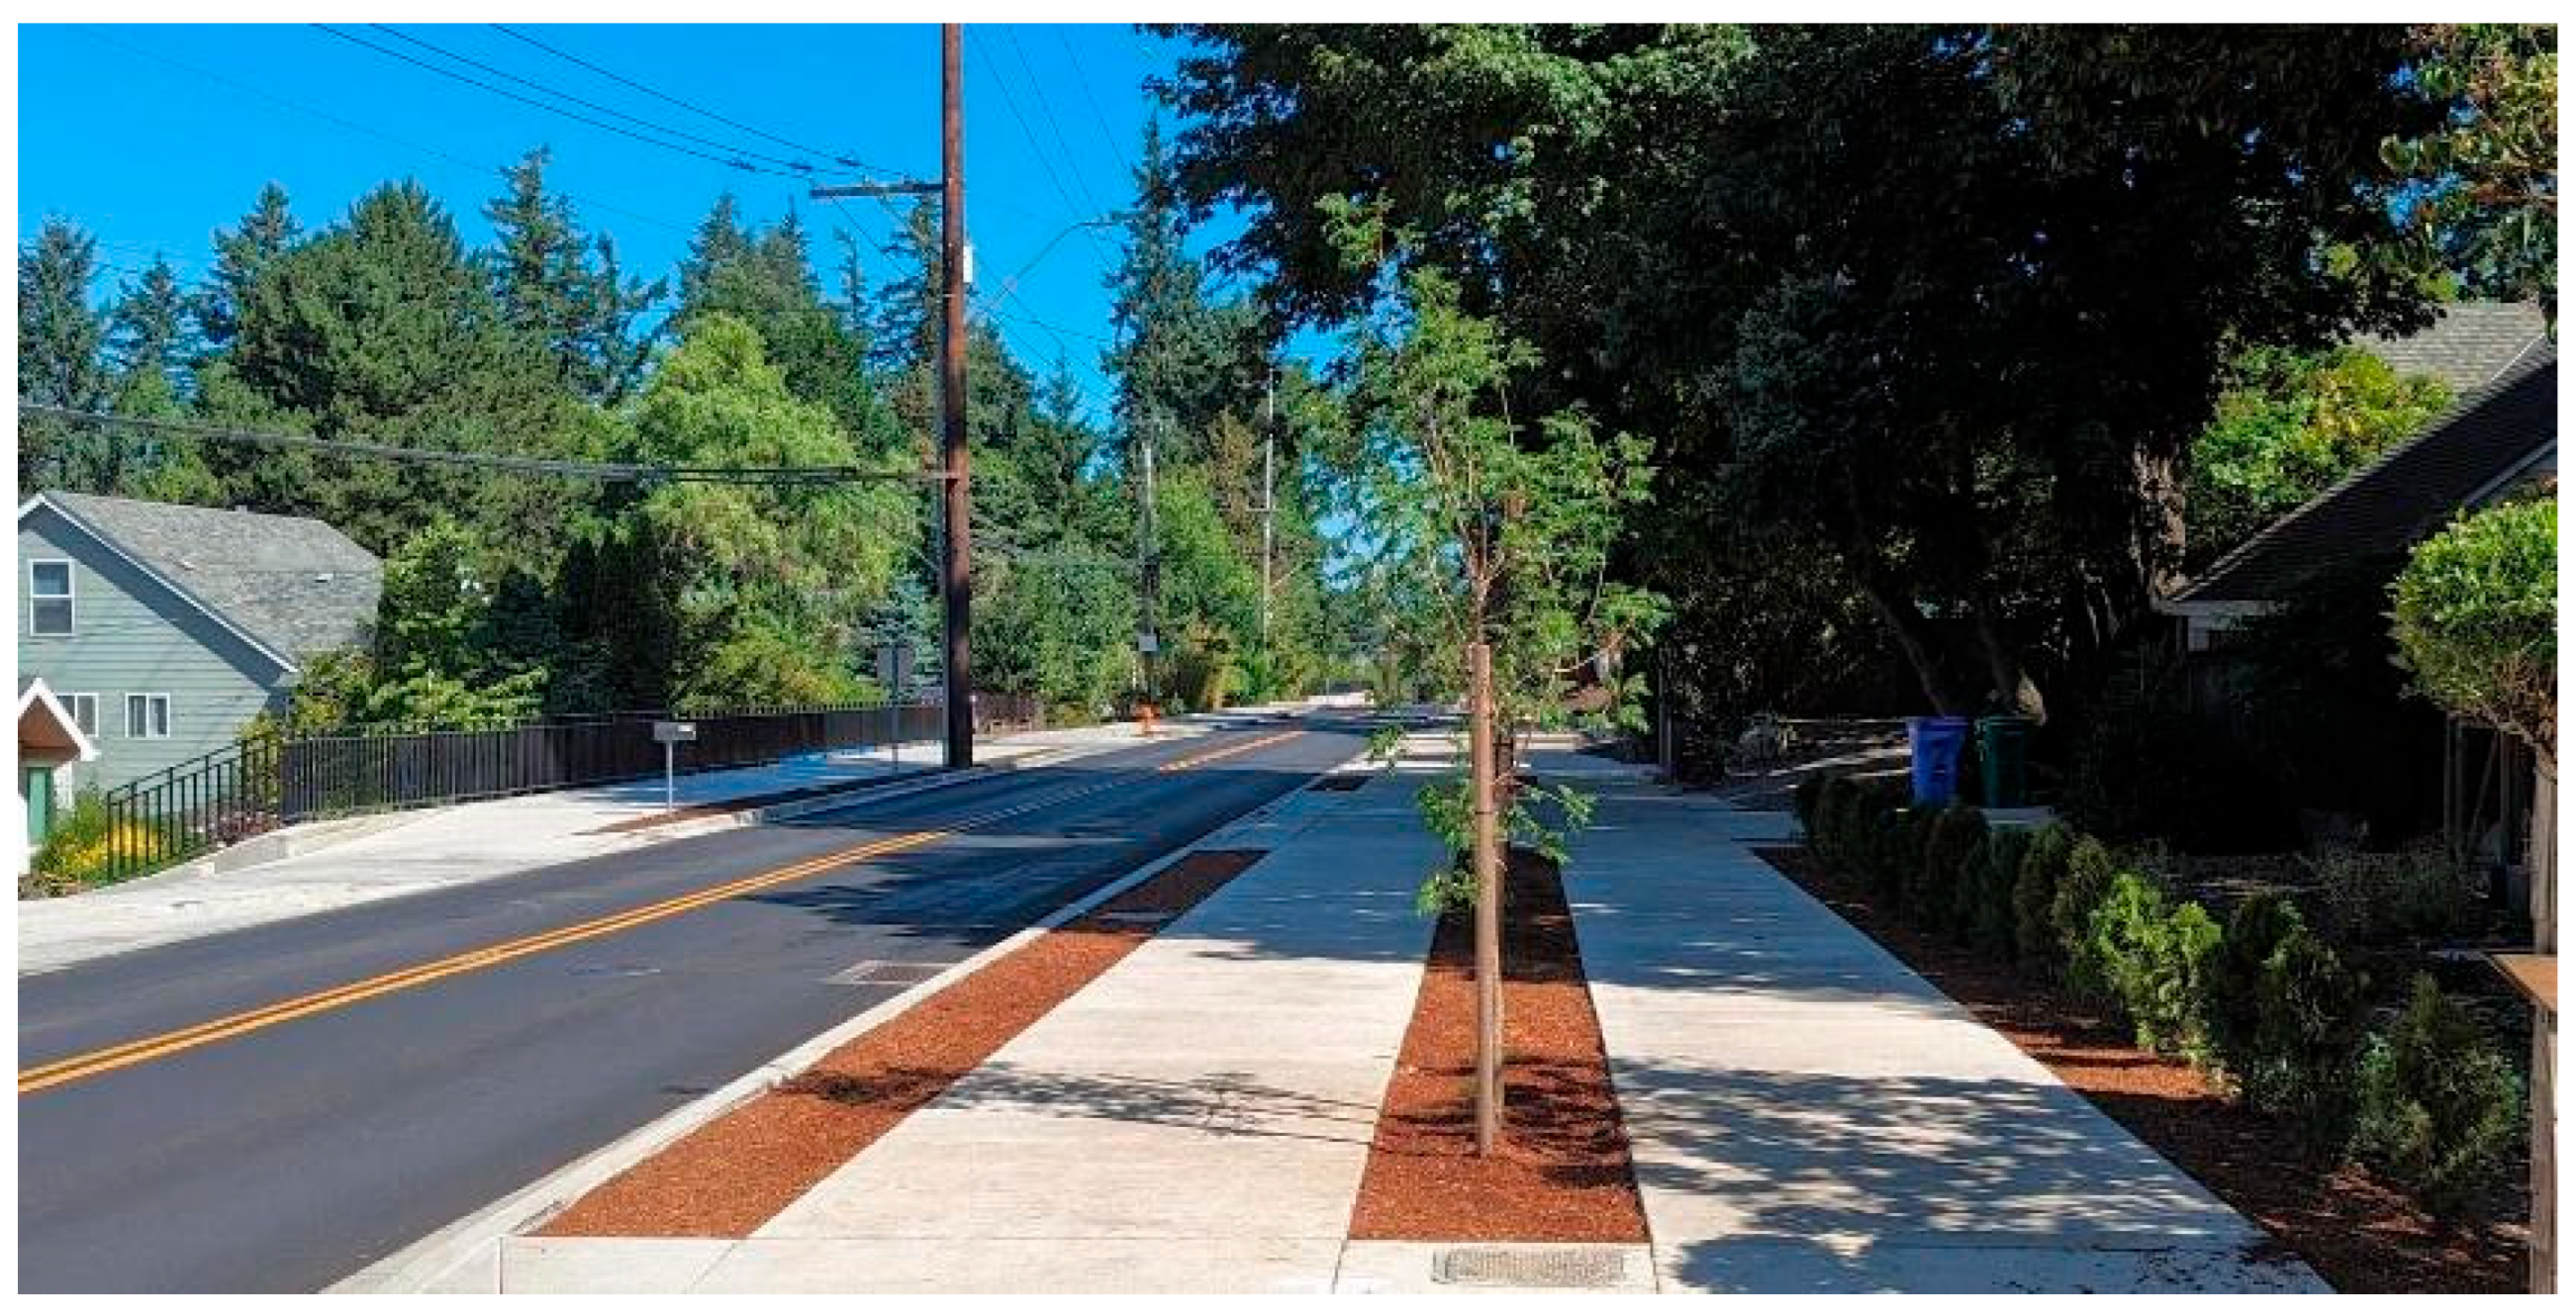
The Capitol Highway project (Figure 5), completed in 2023, was a joint project between the Portland Bureau of Transportation (PBOT), the BES, and the Portland Water Bureau. This project won an Oregon Chapter of the American Public Works Association project of the year award in 2023 for this collaborative project [85]. It provided critical transportation improvements by adding sidewalks and bike lanes on a nearly mile-long section of SW Capitol Highway, a collector street, where none existed before. The Water Bureau installed over 3000 linear feet of earthquake-resistant water mains [86]. The BES constructed four bioretention facilities, which are among the largest of their kind in Portland and collectively manage nearly 50 acres of roadway, including the Capitol Highway, and surrounding neighborhoods. The bioretention facilities provide water quality treatment and flow control before discharging to tributaries of Tryon and Fanno Creeks [87]. The facilities are retrofits to an existing neighborhood. Construction provided important lessons learned about the installation of large systems with liners and accounting for the seasonal influence of fluctuating groundwater levels. Monitoring will provide information about the design and performance of entrance flow spreaders, forebays for sediment capture, orifice systems for flow control, and the suitability of the plant palette.

3.2.3. Washington Park Entry Planter

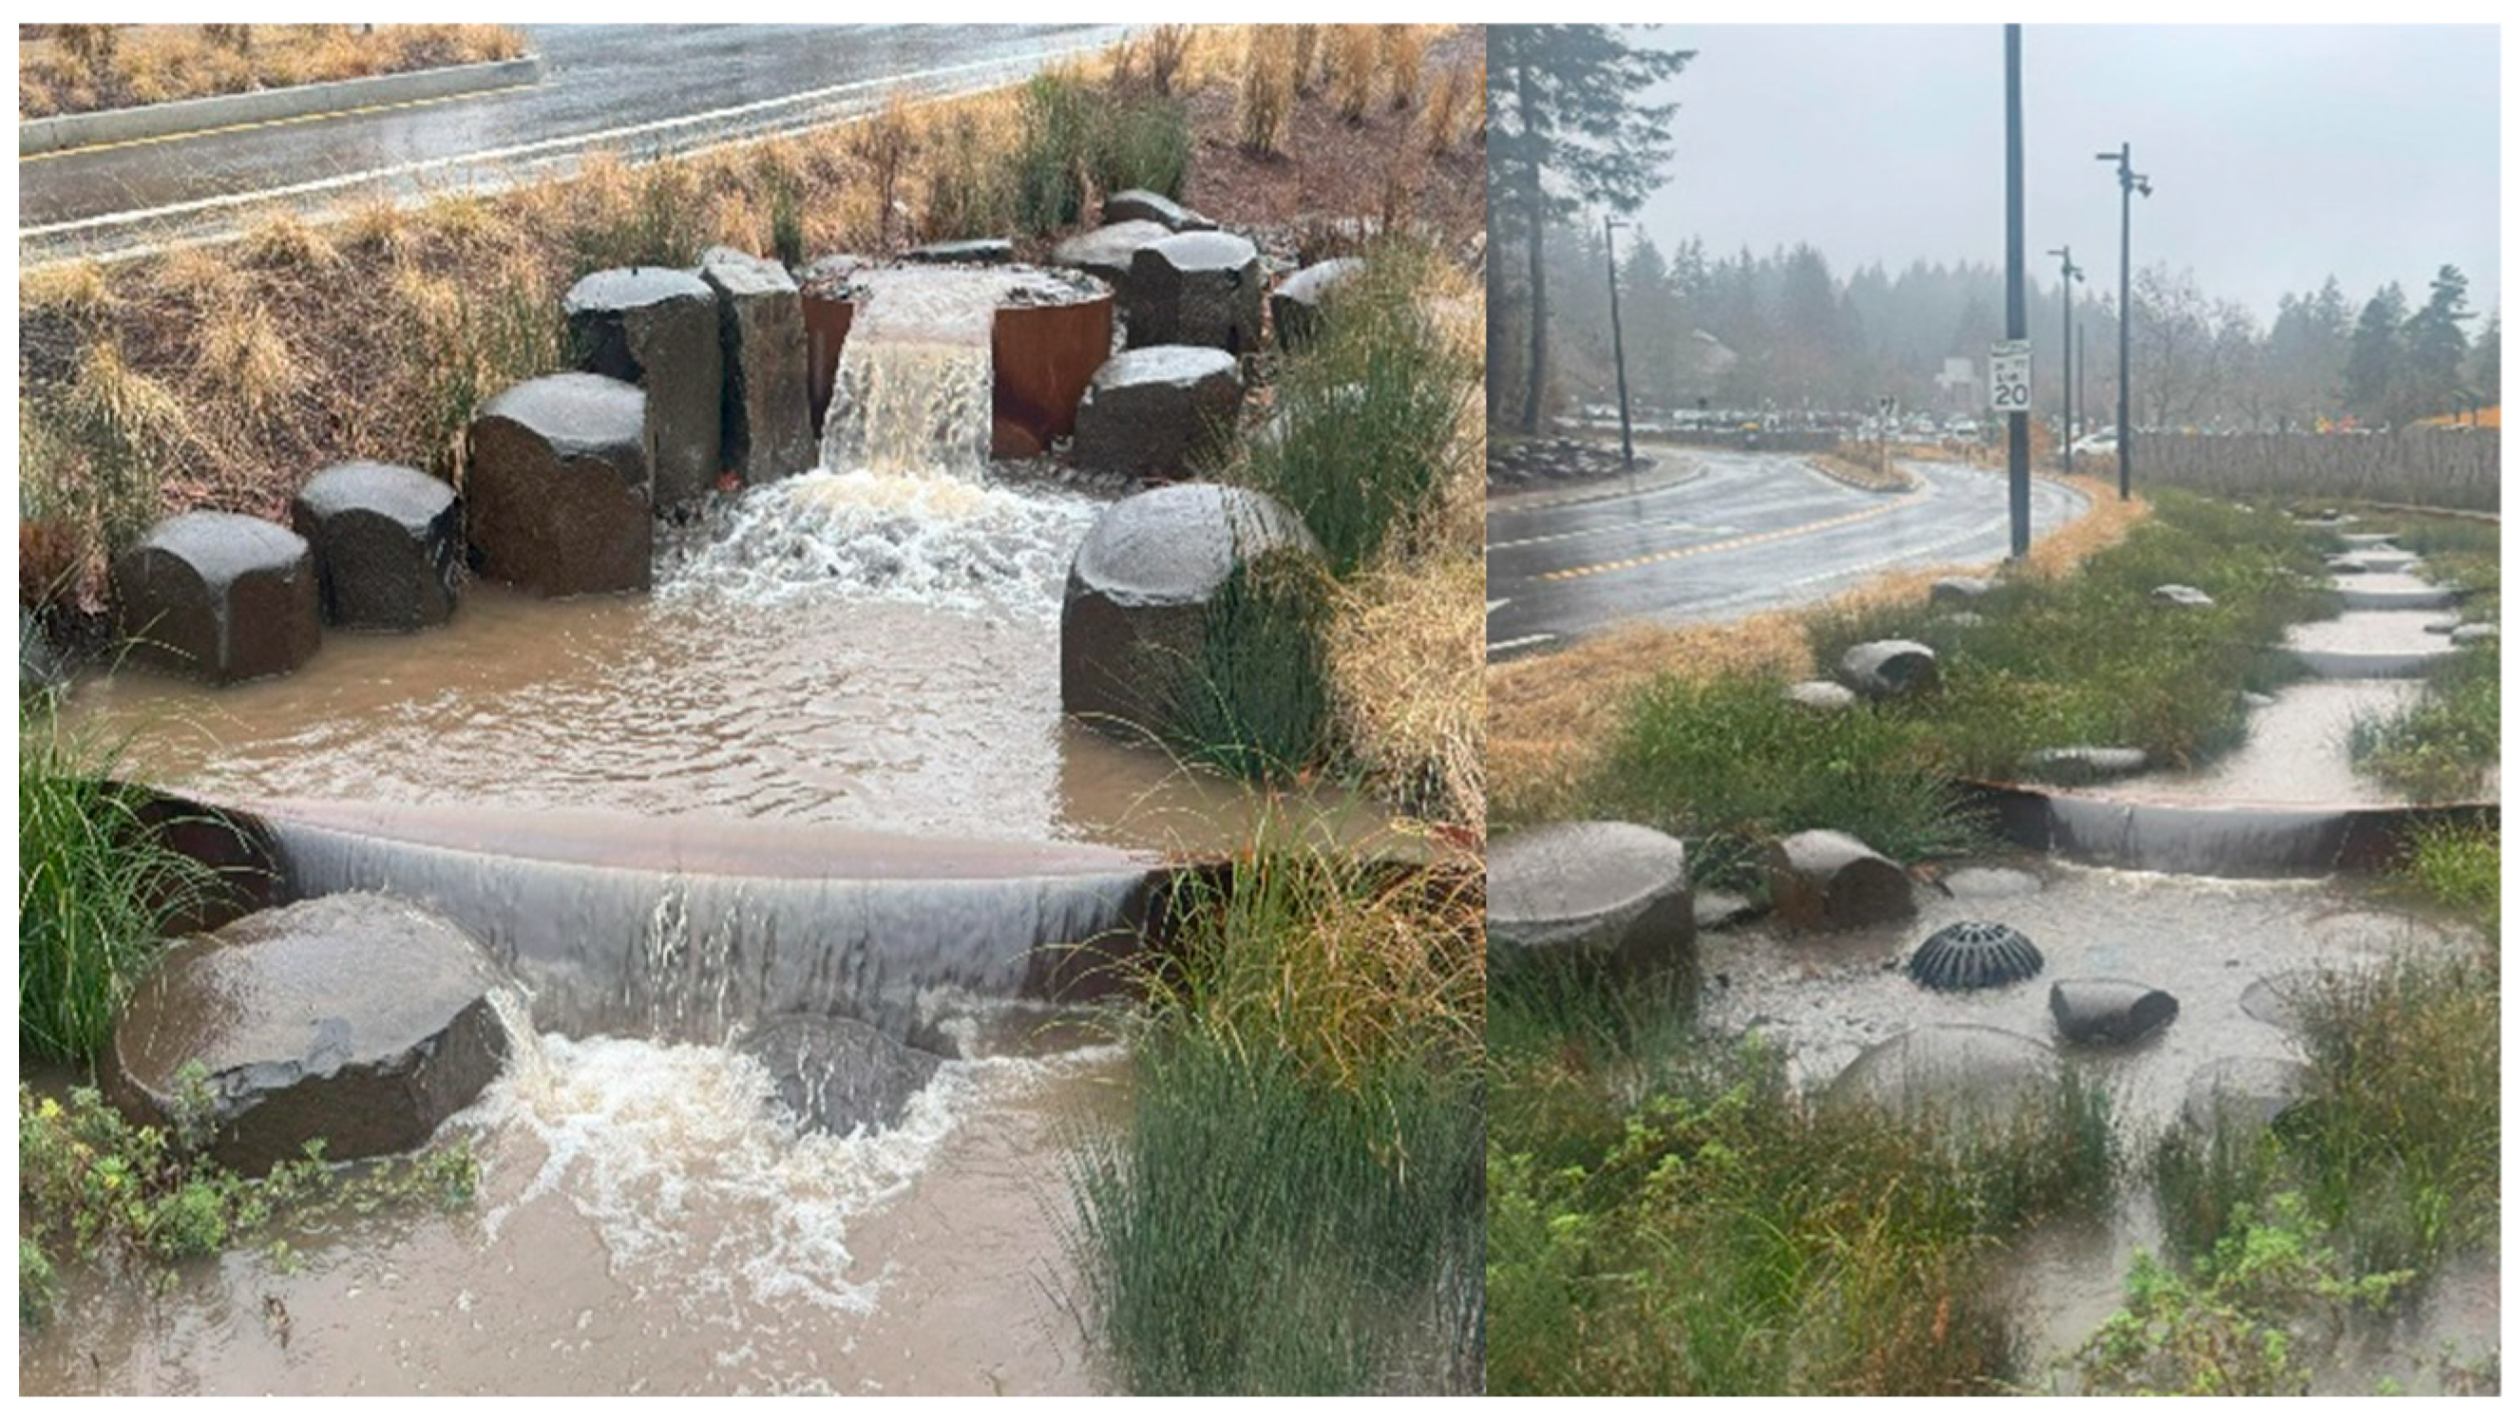
Located in the West Hills above downtown Portland, this showcase project was completed in 2024 by Portland Parks & Recreation and was primarily funded by facility parking lot fees as well as a significant One Percent for Green grant (Figure 6 and Figure 7). This project had three primary goals: (1) establish a clear and welcoming sense of arrival to the park, (2) improve wayfinding and multimodal access for pedestrians, cyclists, and vehicles, and (3) manage stormwater runoff. Stormwater is treated from over four acres of impervious roadway and parking lot area, which is more than two-and-half acres of impervious area beyond the minimum development requirements. The design meets the 80 percent total suspended solids (TSS) removal requirement, in addition to enhancing the user experience with information about stormwater management. The facility consists of an upstream flow control and pollution control structure, a unique inflow “bubbler” feature, and a 10-tiered vegetated stormwater planter with a treatment area of 4600 square feet that is adjacent to the entrance walkway. This highly visible project was designed to celebrate and highlight stormwater management. The weathering weirs and spillways let stormwater cascade from one planter terrace to the next.
Because the underlying soils are not suitable for infiltration, the facility is lined, and each planter terrace has a separate underdrain and flow control orifice. The underdrains and facility outlet tie into a recently separated storm-only sewer that ultimately drains into the Willamette River. Achieving a cascading stormwater flow condition has been elusive at times, particularly during less intense rainfall events. Obtaining this desired flow aesthetic is affected by the complexity associated with modeling a tiered, multi-cell lined stormwater facility with orifice-restricted underdrains for “real-world” rainfall conditions, as well as the seepage around the weirs from one cell into the next. Fortunately, the orifices for controlling flow from the underdrains are accessible for modification.

3.2.4. Northwest Housing Alternatives Combination Treatment and Detention Planter

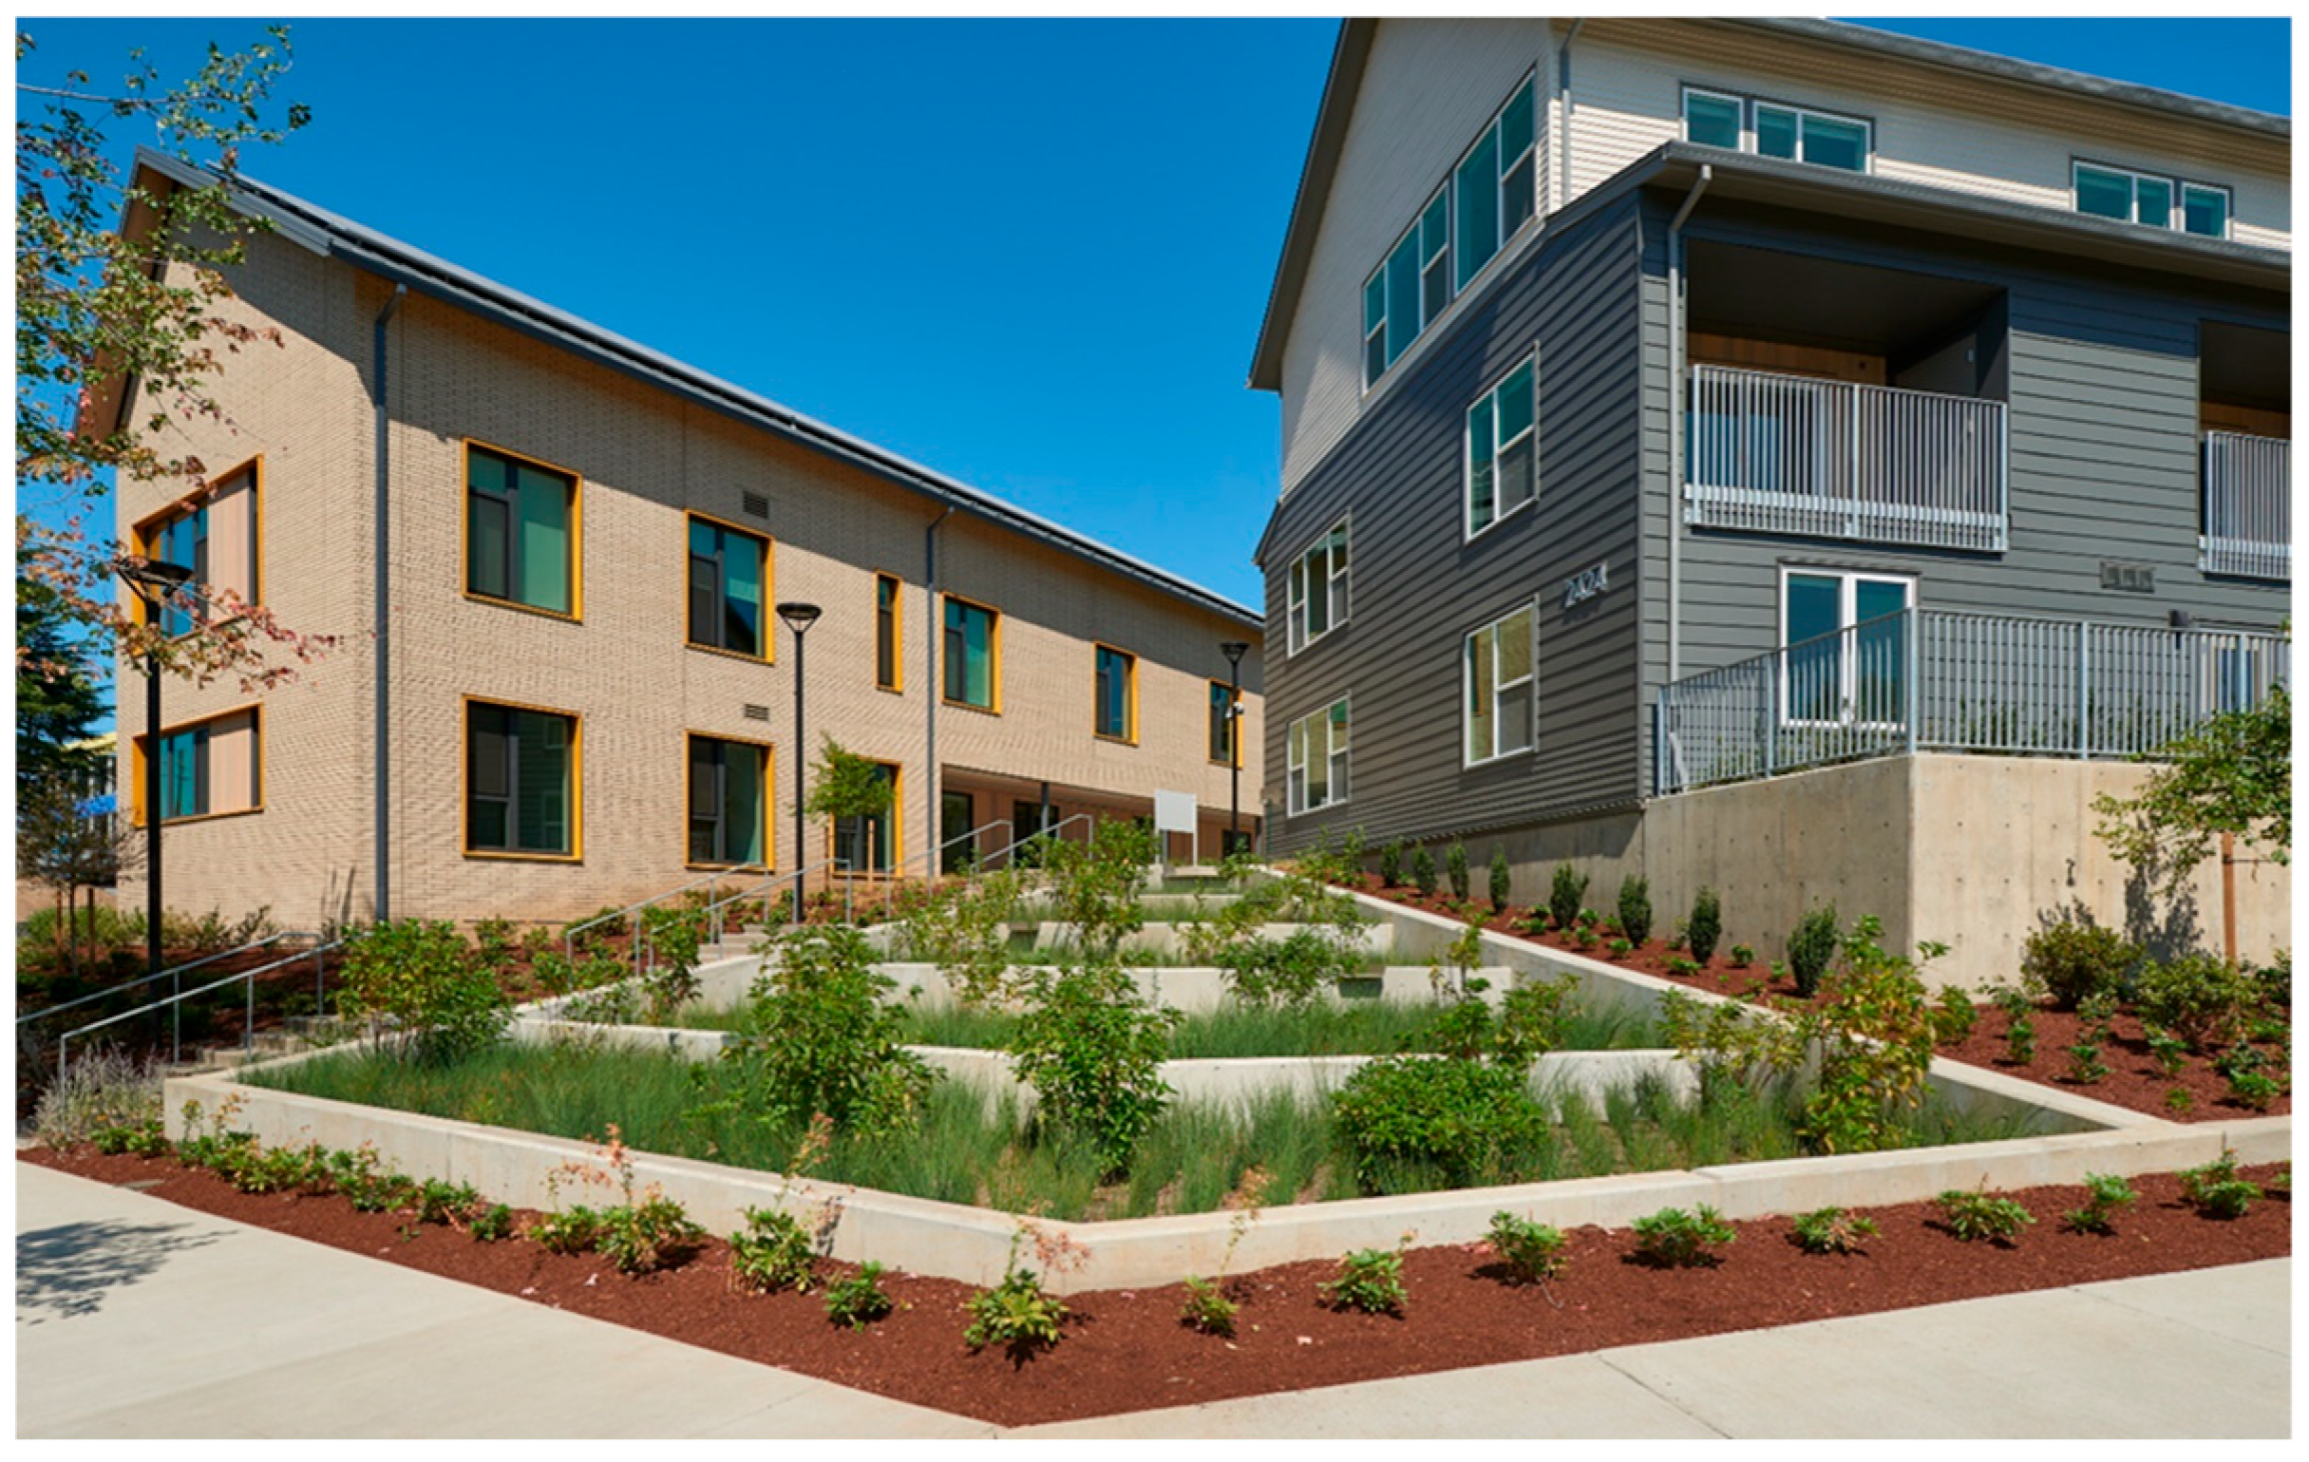
In 2019, to meet local stormwater regulations of filtering at least 70% TSS from the 90th percentile rainfall events and reducing the peak discharge to predevelopment rates for the 2-year through 25-year storm events, a combination storm treatment and detention facility was designed for the multi-family affordable housing development and Northwest Housing Alternatives (NHA) business headquarters. The 6900 m2 (1.7 acre) site is 61% impervious. The project goals were to maximize the use of the land for housing and amenity spaces which only left a triangular-shaped hillside area between two of the buildings as the feasible location for the stormwater facility. To address the site’s constraints and challenging topography, an 85 m2 (915 sq-ft) terraced storm planter was built into the hillside. This planter enables the stormwater runoff to be filtered as it infiltrates through the engineered stormwater soil. During significant rainfall events, excess water can overflow via spillways to lower terraces, ensuring effective flow distribution.
Beneath the soil section is approximately 76 m3 (2700 cubic feet) of available detention volume, created using a modular plastic crate-like product that provides 95% void space. This hidden storage allows for temporary stormwater retention, gradually releasing it to the city storm system at peak rates from the 2-year to 25-year storm events below the pre-developed rates for the site. For the 25-year event, the actual peak release was 0.43 cfs or 46% lower than it would have been without the detention planter during initial testing. This planter design minimized the area needed for stormwater requirements on this high-density site. However, constructing it between two multi-story buildings required strong retaining walls to support lateral loads, increasing cost and complexity. On sites with more land available, alternative solutions may be more cost-effective (Figure 8).

4. Discussion

4.1. Impact Assessment

4.1.1. Hydrologic Improvements

Several studies have shown the water quality and flood mitigation benefits of green infrastructure in Portland [88,89,90,91,92,93]. Many earlier studies demonstrated significant retention of stormwater, with up to 69% of precipitation retained on ecoroofs [88] and 85% of a 25-year storm retained in bioretention systems [94]. This is within the range of other studies worldwide, where 40–80% and 40–97% reductions in runoff volume were observed in green roofs (ecoroofs) and bioretention systems, respectively [21,23,24]. Implementation of green infrastructure throughout Portland has resulted in a 35% reduction in stormwater volumes going into the combined sewer, which in turn reduces CSO events and local sewer backups [95].
When compared to centralized community stormwater infrastructure, distributed GSI has demonstrated reduced peak flow timing and volume by delaying runoff at the neighborhood level [96]. While an ecoroof on a commercial building significantly reduces peak flow timing and amount, the increasing depth of ecoroof substrate only marginally reduces storm runoff [97]. The spatial distribution of GSI concerning pluvial flooding potential shows that GSI has been installed in flood-prone areas, achieving the city’s equitable goals to some extent. However, there is still room for improvement in deploying GSI to maximize benefits in reducing urban flooding potential [78]. Like any other infrastructure, when GSI facilities are not well maintained, they do not function as designed.

4.1.2. Water Quality Improvements

Recent studies in Portland have focused more on the water quality benefits of green infrastructure [98], and have found that both ecoroofs and bioretention systems effectively reduce metals such as copper and zinc [90,91] and microplastics [93,99]. Column studies using the City of Portland bioretention soil mix indicated that bioretention systems can remove 50% copper, 81% zinc, and 86–99% of microplastics from stormwater [91,93,99]. A study on a green roof in Portland showed that zinc and copper concentrations in roof runoff were lower compared to a regular roof [55]. This is similar to studies in other regions of the US [100,101,102,103,104,105,106,107,108]. However, leaching of nutrients has been observed in various types of green infrastructure due to the compost needed to ensure plants can survive during the dry summer months [90,91,109,110]. Leaching of nutrients has also been observed in other regions of the US [10,18,111,112]. Regions with steady rainfall throughout the year, such as the Eastern United States, can remove or substitute the compost in the soil mix [113,114,115]. Due to Portland’s climate, with a wet rainy season and dry summer months, the compost is needed for water retention and plant survival. The water-holding capacity of compost improves plant survival in regions with hot, dry summers [116]. Nutrient leaching may not be a problem for systems that fully infiltrate into the soil, but it is an issue for ecoroofs and lined bioretention systems that drain to a receiving water body [92]. More research is needed on soil mix design and engineered solutions for reducing the leaching of nutrients to receiving waters.

4.1.3. Social Impacts

There are several positive impacts of GSI, including increased green spaces, reduced urban heat, improved air quality, and enhanced biodiversity [117,118,119]. A modeling study conducted in Portland demonstrated that GSI has a cooling effect and can reduce the urban heat island effect in highly urbanized land uses [120]. This is similar to studies conducted worldwide, which observed a reduction in urban heat, improved air quality, and added habitat for pollinators and other wildlife [33,34,35,36]. Other studies in Portland have shown that GSI has socioeconomic benefits such as reduced stress, beautification of urban spaces, enhanced walkability, and environmental equity [121], which is similar to what has been observed in other regions [33]. Chan and Hopkins (2017) observed that GSI densities are higher in areas with higher percentages of minorities and lower income and age in Portland, which can be a social and economic benefit [122].
Although studies have demonstrated the social benefits of GSI, perceptions of GSI are not necessarily aligned. A study on Portland residents’ appreciation and willingness to accept GSI shows no consistent patterns among residents living near GSI, regardless of the age of the bioswales. However, acceptance could be improved if localized maintenance strategies and residents’ needs are addressed [123]. A survey of municipal stormwater managers shows that Portland managers stressed stakeholder buy-in and regulatory approaches in implementing GSI [54]. It appears these efforts have paid off; a recent study on residents’ attitudes toward GSI found widespread support in Portland [124]. There was more support for GSI when residents recognized their personal benefits from GSI.

4.2. Lessons Learned and Challenges

4.2.1. Institutional Coordination

Effective coordination across city agencies and sectors has been critical to the success of Portland’s green stormwater infrastructure (GSI) initiatives. The alignment between the Bureau of Environmental Services (BES) and the Bureau of Planning and Sustainability (BPS) has enabled GSI to be embedded not only in stormwater management but also in broader planning, zoning, and climate strategies. Coordination between the BES and the Portland Bureau of Transportation (PBOT) resulted in the green streets program, which provides stormwater treatment with GSI as well as improved safety through the separation of pedestrians and cars. This cross-departmental collaboration has been complemented by partnerships with private developers, non-profits, and academic institutions where university researchers have played crucial roles in breaking silos [125]. In recent years, Portland has advanced a more integrated “One Water” approach, which stemmed from integrated water resource management [126], recognizing the interdependence of stormwater, groundwater, drinking water, and wastewater systems.
In January, 2025 Portland established a new form of government that created a legislative city council and moved administrative functions under the mayor and a city administrator; previously, city commissioners served both legislative and administrative roles [127]. One of the goals of this structural change was to improve collaboration across bureaus [128]. City leadership is advancing initiatives to increase collaboration amongst the four public works bureaus: the Bureau of Environmental Services, Parks and Recreation, the Bureau of Transportation, and the Water Bureau. Starting July 2025, all four of these bureaus have been brought together under one deputy city administrator in the Public Works Service Area. The goal of this change is to increase collaboration across public works bureaus. Within this organizational change, the city is implementing a “One Water” merger by combining the BES and the Water Bureau in the year 2025. Organizational reforms across the public works bureaus will open new opportunities for collaboration from policy initiatives to capital project implementation [129,130].

4.2.2. Community Engagement

Engaging the community constructively has been both challenging and essential for the success of Portland’s GSI program. Because GSI is highly visible, unlike underground sewer and stormwater systems, it naturally invites more public attention and scrutiny.
Portland’s planning framework emphasizes public participation, aligning with Oregon’s statewide growth management goals which prioritize public participation in the decision-making process. Accordingly, the city conducted extensive outreach campaigns focusing on (1) door-to-door interviews to assess visual preferences; (2) workshops to understand the major disruptions, such as parking, that may be impacted as a result of GSI installation; and (3) surveys to assess the extent of familiarity with GSI, neighborhood qualities that may be changed as a result of GSI implementation, and willingness to care for newly installed systems [131].
Despite these efforts, several challenges have emerged in engaging the public effectively. Communicating the full range of GSI benefits and tradeoffs can be complex, requiring careful messaging. Citizens may have unrealistically positive or negative preconceptions about GSI that dominate public discourse and engagement efforts. Reaching community members who are not already engaged in related environmental or planning issues continues to be challenging, as does building collaborations with the private sector without clear and reliable regulatory guidance. Finally, maintaining vegetated streetside facilities to meet the desired stormwater management function and aesthetic expectations of adjacent homes and businesses can be difficult, underscoring the importance of long-term community involvement and stewardship.

4.2.3. Performance Monitoring and Maintenance

Another major ongoing challenge to Portland’s GSI is obtaining adequate funding for long-term GSI operations and maintenance (O&M) to keep facilities functioning as intended. Funding for the installation of GSI facilities that become the maintenance responsibility of the City of Portland comes from private developers and capital-funded public works projects. Funds to pay for long-term GSI O&M work come from the City of Portland’s sewer/stormwater utility operating budget, which covers a broad range of services beyond O&M. There is always a high demand for operating funds, and maintaining customer affordability is always a primary goal. This limits service rate increases, which makes the success of requests for annual O&M increases to cover the addition of new facilities highly uncertain. In difficult revenue years, existing budgets may even be cut.

4.2.4. Water Quality Treatment

An important opportunity for future green stormwater infrastructure (GSI) lies in its potential to further enhance water quality treatment. Recent studies in the Pacific Northwest have highlighted the acute toxicity of untreated stormwater runoff to salmon, an endangered species, underscoring the need for treatment before runoff reaches receiving waters [132,133]. One key contaminant of concern is 6-PPD quinone, found in tire wear particles (a type of microplastic), which is very toxic to aquatic species. Studies have shown that bioretention can effectively remove these particles and toxicity impacts [134]. Expanding the use of green infrastructure to treat all urban stormwater could significantly reduce pollutant loads and improve the health of urban waterways.

4.2.5. Climate Change

Portland’s implementation of green stormwater infrastructure (GSI) has unfolded without waiting for full scientific certainty regarding its effectiveness under extreme climate scenarios such as cloudbursts or prolonged droughts. Early on, Portland adopted elements of the precautionary principle, which includes anticipating harm, evaluating alternatives, and engaging the public in decision-making. While contemporary climate modeling was limited at the time, the city acted to prevent failures in its aging gray infrastructure and mitigate health risks associated with sewer overflows and polluted river water. Decision-makers were inspired, in part, by Seattle’s short-lived but illustrative SEA (Seattle’s Street Edge Alternative) streets project [135,136]. They saw the potential of GSI to reduce such harm through natural filtration, groundwater recharge, and stormwater volume control. Economic considerations further supported the shift toward GSI. Analyses during the planning of the Tabor to the River program (Taggart Basin) demonstrated that a green approach could save approximately USD 50 million compared to conventional pipe replacement [63]. Public involvement played a key role, consistent with Oregon’s Land Use Goal 1 regarding citizen participation. Outreach efforts included visual preference surveys, interviews, and workshops to identify local concerns such as parking and maintenance [75]. While climate change was not a direct factor in Portland’s early efforts, subsequent research has confirmed the climate resilience benefits of GSI. In addition to flood reduction, urban greening has been shown to reduce peak summer temperatures by up to 7 °C in neighborhoods with more than 30% green cover and to support biodiversity, air quality, mental health, and maternal and child health outcomes. These broader impacts have reinforced Portland’s leadership and provided a transferable model for GSI-based climate adaptation.

5. Conclusions

Portland has played a pioneering role in the development and implementation of green stormwater infrastructure over the past three decades. From early pilot projects in the 1990s to comprehensive regulatory frameworks like the Stormwater Management Manual and the Clean River Plan, the city has consistently pushed innovative approaches to managing urban runoff. These efforts have not only improved stormwater control but also enhanced urban green spaces and contributed to the city’s overall climate resilience while addressing economic well-being and social equity.
The experience in Portland highlights critical lessons for other cities pursuing sustainable stormwater solutions. Key among these are the need for strong policy support, the effective integration of green and gray infrastructure, and active community involvement. Despite these successes, challenges remain in maintaining and scaling green infrastructure across the urban fabric. These challenges are associated with potential green gentrification and more frequent extreme weather events that may increase with rising temperatures.
Today, the City of Portland BES is observing new climate-related challenges that affect the long-term performance of green infrastructure. In particular, hotter and drier summers have increased stress on vegetation in green streets, many of which were designed without irrigation systems. As a result, plant survival and the overall functionality of stormwater facilities are being compromised, prompting discussions about adaptive maintenance strategies, plant selection, and the possible integration of supplemental watering during extreme heat events. These challenges are a reminder that some of the original design assumptions may need to evolve as the climate patterns shift.
Looking ahead, Portland’s continued commitment to innovation and equitable distribution of green stormwater solutions offers a valuable model for cities worldwide. As climate change intensifies, the lessons from Portland’s experience underscore the importance of holistic, adaptive, and community-centered approaches to urban stormwater management.

Author Contributions

Conceptualization, M.K., C.P. and J.W.; methodology, M.K., C.P. and J.W.; investigation, M.K., A.A., H.S., S.H., S.F., J.L. and A.Z.; data curation, T.K.; writing—original draft preparation, M.K., C.P., J.W., H.C., V.S., A.A., H.S., T.K., S.H., S.F., J.L. and A.Z.; writing—review and editing, M.K., C.P., J.W., H.C. and V.S.; visualization, M.K., C.P. and J.W.; supervision, M.K. and C.P. All authors have read and agreed to the published version of the manuscript.

Funding

This research was funded through a Fulbright Scholarship.

Institutional Review Board Statement

Not applicable.

Informed Consent Statement

Not applicable.

Data Availability Statement

All data are available on the BES website (https://www.portland.gov/bes) and GIS site (https://gis-pdx.opendata.arcgis.com/).

Acknowledgments

We would like to thank Katie Holzer and the City of Gresham for providing tours and interviews, as well as everyone at the City of Portland who was willing to talk with us.

Conflicts of Interest

Adrienne Aiona, Tim Kurtz, and Svetlana Hedin are employed by the City of Portland, and Henry Stevens is retired from the City of Portland. Steve Fancher is employed by the City of Gresham, Josh Lighthipe is employed by KPFF, and Adam Zucker is employed by Zucker Engineering. The remaining authors declare that the research was conducted in the absence of any commercial or financial relationships that can be construed as potential conflicts of interest. The funders had no role in the design of the study; in the collection, analyses, or interpretation of data; in the writing of the manuscript; or in the decision to publish the results.

Abbreviations

The following abbreviations are used in this manuscript:
BESCity of Portland Bureau of Environmental Services
BPSCity of Portland Bureau of Planning and Sustainability
CSOsCombined sewer overflows
DEQOregon Department of Environmental Quality
EPAUS Environmental Protection Agency
FARFloor area ratio
GSIGreen stormwater infrastructure
MS4Municipal Separate Storm Sewer System
NHANorthwest Housing Alternatives
NPDESPortland’s National Pollutant Discharge Elimination System
OMSIOregon Museum of Science and Industry
O&MOperations and maintenance
PBOTCity of Portland Bureau of Transportation
SEASeattle’s Street Edge Alternative
SWMMPortland’s Stormwater Management Manual

References

  1. Ferreira, C.S.; Walsh, R.P.; Ferreira, A.J. Degradation in urban areas. Curr. Opin. Environ. Sci. Health 2018, 5, 19–25. [Google Scholar] [CrossRef]
  2. Walsh, C.J.; Fletcher, T.D.; Burns, M.J. Urban Stormwater Runoff: A New Class of Environmental Flow Problem. PLoS ONE 2012, 7, e45814. [Google Scholar] [CrossRef]
  3. Brabec, E.; Schulte, S.; Richards, P.L. Impervious surfaces and water quality: A review of current literature and its implications for watershed planning. J. Plan. Lit. 2002, 16, 499–514. [Google Scholar] [CrossRef]
  4. Kessler, R. Stormwater strategies: Cities prepare aging infrastructure for climate change. Environ. Health Perspect. 2012, 119, a514–a519. [Google Scholar] [CrossRef]
  5. Tavakol-Davani, H.; Goharian, E.; Hansen, C.H.; Tavakol-Davani, H.; Apul, D.; Burian, S.J. How does climate change affect combined sewer overflow in a system benefiting from rainwater harvesting systems? Sustain. Cities Soc. 2016, 27, 430–438. [Google Scholar] [CrossRef]
  6. Moore, T.L.; Gulliver, J.S.; Stack, L.; Simpson, M.H. Stormwater management and climate change: Vulnerability and capacity for adaptation in urban and suburban contexts. Clim. Change 2016, 138, 491–504. [Google Scholar] [CrossRef]
  7. Kumar, S.; Agarwal, A.; Ganapathy, A.; Villuri, V.G.K.; Pasupuleti, S.; Kumar, D.; Kaushal, D.; Gosain, A.; Sivakumar, B. Impact of climate change on stormwater drainage in urban areas. Stoch. Environ. Res. Risk Assess. 2022, 36, 77–96. [Google Scholar] [CrossRef]
  8. Blair, A.; Lovelace, S.; Sanger, D.; Holland, A.F.; Vandiver, L.; White, S. Exploring impacts of development and climate change on stormwater runoff. Hydrol. Process. 2014, 28, 2844–2854. [Google Scholar] [CrossRef]
  9. EPA (Environmental Protection Agency). About Green Infrastructure. 2025. Available online: https://www.epa.gov/green-infrastructure/about-green-infrastructure (accessed on 7 May 2025).
  10. Trowsdale, S.; Simcock, R. Urban stormwater treatment using bioretention. J. Hydrol. 2011, 397, 167–174. [Google Scholar] [CrossRef]
  11. Zhang, W.; Brown, G.O.; Storm, D.E.; Zhang, H. Fly-ash-amended sand as filter media in bioretention cells to improve phosphorus removal. Water Environ. Res. 2008, 80, 507. [Google Scholar] [CrossRef]
  12. Davis, A.P.; Hunt, W.F.; Traver, R.G.; Clar, M. Bioretention technology: Overview of current practice and future needs. J. Environ. Eng. 2009, 135, 109. [Google Scholar] [CrossRef]
  13. Kim, H.; Seagren, E.A.; Davis, A.P. Engineered bioretention for removal of nitrate from stormwater runoff. Water Environ. Res. 2003, 75, 355. [Google Scholar] [CrossRef]
  14. Stutz, B. Green Roofs Are Starting to Sprout in American Cities; Yale Environment 360, Yale School of Forestry and Environmental Studies: New Haven, CT, USA, 2010. [Google Scholar]
  15. Dvorak, B.; Volder, A. Green Roof Vegetation for North American Ecoregions: A Literature Review. Landsc. Urban Plan. 2010, 96, 197–213. [Google Scholar] [CrossRef]
  16. Carpenter, C.; Todorov, D.; Driscoll, C.T.; Montesdeoca, M. Water quantity and quality response of a green roof to storm events: Experimental and monitoring observations. Environ. Pollut. 2016, 218, 664–672. [Google Scholar] [CrossRef]
  17. Harper, G.E.; Limmer, M.A.; Showalter, W.E.; Burken, J.G. Nine-month evaluation of runoff water quality and quantity from an experiential green roof in Missouri, USA. Ecol. Eng. 2015, 78, 127–133. [Google Scholar] [CrossRef]
  18. Clary, J.; Jones, J.; Leisenring, M.; Hobson, P.; Strecker, E. International Stormwater BMP Database: 2020 Summary Statistics; Water Research Foundation: Alexandria, VA, USA, 2020. [Google Scholar]
  19. Birch, G.F.; Fezeli, M.S.; Matthai, C. Efficiency of an infiltration basin in removing contaminants from urban stormwater. Environ. Monit. Assess. 2005, 101, 23–38. [Google Scholar] [PubMed]
  20. Winston, R.J.; Luell, S.K.; Hunt, W.F. Retrofitting with bioretention and a bioswale to treat bridge deck stormwater runoff. In Green Streets and Highways 2010: An Interactive Conference on the State of the Art and How to Achieve Sustainable Outcomes; American Society of Civil Engineers: Denver, CO, USA, 2010; pp. 147–162. [Google Scholar]
  21. Shafique, M.; Kim, R. Green stormwater infrastructure with low impact development concept: A review of current research. Desal. Water Treat. 2017, 83, 16–29. [Google Scholar] [CrossRef]
  22. Kwak, N.; Smith, V.; Good, K.D. Assessing the influence of green stormwater infrastructure implemented for combined sewer overflow control on urban streamflows. J. Hydrol. 2024, 640, 131670. [Google Scholar] [CrossRef]
  23. Le Cauchois, P.; Doucet, S.; Bouattour, O.; McQuaid, N.; Beral, H.; Kõiv-Vainik, M.; Bichai, F.; McCarthy, D.; St-Laurent, J.; Dagenais, D.; et al. Full-scale characterization of the effects of a bioretention system on water quality and quantity following the replacement of a mixed stormwater and combined sewer system. Blue-Green Sys. 2025, 7, 43–62. [Google Scholar] [CrossRef]
  24. Godyń, I.; Grela, A.; Muszyński, K.; Pamuła, J. The Impact of Green Infrastructure on the Quality of Stormwater and Environmental Risk. Sustainability 2024, 16, 8530. [Google Scholar] [CrossRef]
  25. Rosenzweig, B.; McPhillips, L.; Chang, H.; Cheng, C.; Welty, C.; Matsler, M.; Iwaniec, D. Urban pluvian flood risk and opportunities for resilience. Wires Water 2018, 5, e1032. [Google Scholar] [CrossRef]
  26. Chang, H.; Pallathadka, A. A case for change: Flood risk management and green infrastructure. Cell Rep. Sustain. 2025, 2, 100369. [Google Scholar] [CrossRef]
  27. Steis Thorsby, J.; Miller, C.J.; Treemore-Spears, L. The role of green stormwater infrastructure in flood mitigation (Detroit, MI USA)—Case study. Urban Water J. 2020, 17, 838–846. [Google Scholar] [CrossRef]
  28. Green, D.; O’Donnell, E.; Johnson, M.; Slater, L.; Thorne, C.; Zheng, S.; Stirling, R.; Chan, F.K.S.; Li, L.; Boothroyd, R.J. Green infrastructure: The future of urban flood risk management? Wiley Interdisc. Rev. Water 2021, 8, e1560. [Google Scholar] [CrossRef]
  29. Liu, W.; Chen, W.; Peng, C. Assessing the effectiveness of green infrastructures on urban flooding reduction: A community scale study. Ecol. Model. 2014, 291, 6–14. [Google Scholar] [CrossRef]
  30. Arabi, M.; Dell, T.; Zadeh, M.M.; Pomeroy, C.A.; Egan, J.M.; Wible, T.; Sharvelle, S. Community-enabled life-cycle assessment Stormwater Infrastructure Costs (CLASIC) tool. Environ. Model. Softw. 2025, 185, 106279. [Google Scholar] [CrossRef]
  31. Flynn, K.M.; Traver, R.G. Green infrastructure life cycle assessment: A bio-infiltration case study. Ecol. Eng. 2013, 55, 9–22. [Google Scholar] [CrossRef]
  32. Laub, B.G.; Von Bon, E., Jr.; May, L.; Garcia, M. The Hydrologic Mitigation Effectiveness of Bioretention Basins in an Urban Area Prone to Flash Flooding. Water 2024, 16, 2597. [Google Scholar] [CrossRef]
  33. Suppakittpaisarn, P.; Jiang, X.; Sullivan, W.C. Green infrastructure, green stormwater infrastructure, and human health: A review. Curr. Land. Ecol. Rep. 2017, 2, 96–110. [Google Scholar] [CrossRef]
  34. Ando, A.; Netusil, N. Valuing the Benefits of Green Stormwater Infrastructure. Oxf. Res. Encycl. Environ. Sci. 2018. Available online: https://oxfordre.com/environmentalscience/view/10.1093/acrefore/9780199389414.001.0001/acrefore-9780199389414-e-605 (accessed on 20 May 2025).
  35. Brent, D.A.; Gangadharan, L.; Lassiter, A.; Leroux, A.; Raschky, P.A. Valuing environmental services provided by local stormwater management. Water Resour. Res. 2017, 53, 4907–4921. [Google Scholar] [CrossRef]
  36. Gonzalez-Meler, M.A.; Cotner, L.A.; Massey, D.A.; Zellner, M.L.; Minor, E.S. The Environmental and Ecological Benefits of Green Infrastructure for Stormwater Runoff in Urban Areas. JSM Environ. Sci. Ecol 2013, 1, 1007. [Google Scholar]
  37. Garrison, N.; Hobbs, K. Rooftops to Rivers II; Natural Resources Defense Council: New York, NY, USA, 2011; Available online: https://www.nrdc.org/sites/default/files/rooftopstoriversII.pdf (accessed on 26 May 2025).
  38. Vizzini, D.; Nelson, A. Municipal stormwater management, the new normal. The Water Report, 15 February 2011. [Google Scholar]
  39. EPA (Environmental Protection Agency). Using Green Infrastructure to Address Clean Water Act Requirements. Available online: https://www.epa.gov/green-infrastructure/using-green-infrastructure-address-clean-water-act-requirements (accessed on 11 May 2025).
  40. Fitzgerald, J.; Laufer, J. Governing green stormwater infrastructure: The Philadelphia experience. Local Environ. 2017, 22, 256–268. [Google Scholar] [CrossRef]
  41. Culligan, P.J. Green infrastructure and urban sustainability: A discussion of recent advances and future challenges based on multiyear observations in New York City. Sci. Technol. Built Environ. 2019, 25, 1113–1120. [Google Scholar] [CrossRef]
  42. Atchison, D.; Jantzen, T.; Colwell, S.; Tackett, T. Optimizing Green Infrastructure Techniques to Reduce CSO Volume in Seattle. In Proceedings of the Water Environment Federation 2012 Collection Systems Conference, St. Luis, MO, USA, 3–6 June 2012. [Google Scholar]
  43. U.S. Census Bureau. QuickFacts, Portland, OR. 2024. Available online: https://www.census.gov/quickfacts/fact/table/portlandcityoregon/PST045224 (accessed on 9 May 2025).
  44. NOAA. Climate of Portland. NOAA Technical Memorandum NWS-WR-239, Washington D.C. 2024. Available online: https://www.weather.gov/media/pqr/climate/ClimateBookPortland/PDXclimatebook.pdf (accessed on 9 July 2025).
  45. Michelson, K.; Chang, H. Spatial characteristics and frequency of citizen-observed pluvial flooding events in relation to storm size in Portland, Oregon. Urban Clim. 2019, 29, 100487. [Google Scholar] [CrossRef]
  46. Chang, H.; Yu, D.; Markolf, S.; Hong, C.; Eom, S.; Song, W.; Bae, D. Understanding Urban Flood Resilience in the Anthropocene: A Social-Ecological-Technological Systems (SETS) Learning Framework. Ann. Am. Assoc. Geogr. 2021, 111, 837–857. [Google Scholar]
  47. Kim, H.; Foster, E.; Chang, H. Transition of water quality policies in Oregon, USA and South Korea: A historical socio-hydrological approach. Hydrol. Sci. J. 2021, 15, 2117–2131. [Google Scholar] [CrossRef]
  48. DEQ. Oregon Department of Environmental Quality v. City of Portland; Stipulation and Final Order No. WQ-NWR-91-75; DEQ: Portland, OR, USA, 31 July 1991. [Google Scholar]
  49. Abbot, C. Oregon Encyclopedia, Portland; Oregon Historical Society: Portland, OR, USA, 2024; Available online: https://www.oregonencyclopedia.org/articles/portland/#.WW07NDPMxp4 (accessed on 26 May 2025).
  50. City of Portland. 2005 Portland Watershed Management Plan; Bureau of Environmental Services: Portland, OR, USA, 2005. [Google Scholar]
  51. City of Portland. Ordinance 143476; 14 April 1977. Available online: https://efiles.portlandoregon.gov/record/3974404/ (accessed on 26 May 2025).
  52. Oregon Department of Environmental Quality (DEQ). National Pollution Discharge Elimination System, Municipal Separate Storm Sewer Systems Phase I Individual Permit; Permit Number 101314. Issued to City of Portland and Port of Portland; 2021. Available online: https://www.oregon.gov/deq/wq/Documents/ms4permitDportland.pdf (accessed on 26 May 2025).
  53. Oregon Department of Environmental Quality (DEQ). Water Pollution Control Facilities Permit for Class V Stormwater Underground Injection Control Systems; Permit Number 102830. Issued to City of Portland; 2005. Available online: https://www.oregon.gov/deq/FilterDocs/uicgrwater-portland.pdf (accessed on 11 May 2025).
  54. Shandas, V.; Matsler, A.M.; Caughman, L.; Harris, A. Towards the implementation of green stormwater infrastructure: Perspectives from municipal managers in the Pacific Northwest. J. Environ. Plan. 2020, 63, 959–980. [Google Scholar] [CrossRef]
  55. City of Portland. Green Streets Program; Bureau of Environmental Services: Portland, OR, USA, 2025. [Google Scholar]
  56. Bureau of Environmental Services (BES). 1999 Stormwater Management Manual; City of Portland: Portland, OR, USA, 1999. Available online: https://efiles.portlandoregon.gov/Record/9219394 (accessed on 1 May 2025).
  57. Bureau of Environmental Services (BES). 2025 Stormwater Management Manual; City of Portland: Portland, OR, USA, 2025. Available online: https://www.portland.gov/bes/stormwater/2025-stormwater-management-manual (accessed on 8 April 2025).
  58. Bureau of Environmental Services (BES). About Percent for Green Grants; BES: Portland, OR, USA, 2025. Available online: https://www.portland.gov/bes/grants-incentives/percent-green (accessed on 11 May 2025).
  59. City of Portland. Resolution 36500. 18 April 2007. Available online: https://efiles.portlandoregon.gov/record/2850080/ (accessed on 11 May 2005).
  60. City of Portland. Ordinance 177010. 15 October 2002. Available online: https://efiles.portlandoregon.gov/record/145733/ (accessed on 11 May 2025).
  61. Kloss, C.; Calarusse, C. Rooftops to Rivers; Natural Resources Defense Council: New York, NY, USA, 2006; Available online: https://www.nrdc.org/resources/rooftops-rivers-green-strategies-controlling-stormwater-and-combined-sewer-overflows (accessed on 11 May 2025).
  62. Hoang, L.; Fenner, R.A.; Skenderian, M. A conceptual approach for evaluating the multiple benefits of urban flood management practices. J. Flood Risk Manag. 2018, 11, S943–S959. [Google Scholar] [CrossRef]
  63. City of Portland. About the Big Pipe Project. Available online: https://www.portland.gov/bes/about-big-pipe (accessed on 7 March 2025).
  64. City of Portland Policy Documents. ENB-4.16 Administrative Rules for Clean River Rewards Stormwater Discount Program Effective July 1, 2024; City of Portland: Portland, OR, USA, 2024. Available online: https://www.portland.gov/policies/environment-built/sewer-stormwater-erosion-control/enb-416-administrative-rules-clean (accessed on 26 May 2025).
  65. City of Portland, Ordinance 182467. 7 January 2009. Available online: https://efiles.portlandoregon.gov/record/3548994/ (accessed on 11 May 2025).
  66. City of Portland. Resolution 36361, ENB-4.12 Clean River Incentive and Discount Program. 2005. Available online: https://efiles.portlandoregon.gov/record/2663188/ (accessed on 20 May 2025).
  67. City of Portland Policy Documents. ENB-4.16 Administrative Rules for Clean River Rewards Effective May 23, 2014; City of Portland: Portland, OR, USA, 2014. [Google Scholar]
  68. Bureau of Environmental Services (BES). 2004 Stormwater Management Manual; City of Portland: Portland, OR, USA, 2004. Available online: https://efiles.portlandoregon.gov/Record/9238550 (accessed on 20 May 2025).
  69. Entrix. Portland’s Green Infrastructure: Quantifying the Health, Energy, and Community Livability Benefits; City of Portland: Portland, OR, USA, 2010. Available online: https://efiles.portlandoregon.gov/record/16853159 (accessed on 1 May 2025).
  70. Bureau of Environmental Services (BES). 2013 Stormwater Management Facility Monitoring Report; BES: Portland, OR, USA, 2013. Available online: https://efiles.portlandoregon.gov/Record/16484806/ (accessed on 13 May 2025).
  71. Edwards, M.B.; Hart, A.T.; Fish, W. Bench Column Assessment of Soil Media Amendments to Improve the Performance of Vegetated Bioretention Facilities; Final Report Prepared for Bureau of Environmental Services: Portland, OR, USA, 2017. [Google Scholar]
  72. City of Portland. Code 33.510 Central City Plan District. Section 33.510.243 Ecoroofs. 1 March 2025. Available online: https://www.portland.gov/code/33/500s/510 (accessed on 26 May 2025).
  73. City of Portland. Bureau of Environmental Services Stormwater System Overview; City of Portland: Portland, OR, USA, 2024. [Google Scholar]
  74. Bureau of Environmental Services (BES). 2025 Presumptive Approach Calculator. Available online: https://pac.portland.gov (accessed on 11 May 2025).
  75. O’Donnell, E.C.; Thorne, C.R.; Yeakley, J.A.; Chan, F.K.S. Sustainable Flood Risk and Stormwater Management in Blue-Green Cities; an Interdisciplinary Case Study in Portland, Oregon. J. Amer. Water Res. Assoc. 2020, 757–775. [Google Scholar] [CrossRef]
  76. Baker, A.; Brenneman, E.; Chang, H.; McPhilips, L.; Matsler, M. Spatial Analysis of Landscape and Sociodemographic Factors Associated with Green Stormwater Infrastructure Distribution in Baltimore, Maryland and Portland, Oregon. Sci. Total Environ. 2019, 664, 461–474. [Google Scholar] [CrossRef]
  77. McPhillips, L.E.; Matsler, A.M. Temporal Evolution of Green Stormwater Infrastructure Strategies in Three US Cities. Front. Built Environ. 2018, 4, 26. [Google Scholar] [CrossRef]
  78. Pallathadka, A.; Sauer, J.; Chang, H.; Grimm, N. Urban Flood Risk and Green Infrastructure: Who Is Exposed to Risk and Who Benefits from Investment? A Case Study of Three U.S. Cities. Landsc. Urban Plan. 2022, 223, 104417. [Google Scholar] [CrossRef]
  79. Green Infrastructure Leadership Exchange (GILE). Sustainable Solutions in Green Stormwater Infrastructure. Green Infrastructure Leadership Exchange Website. 2025. Available online: https://giexchange.org/about/ (accessed on 25 April 2025).
  80. Bureau of Environmental Services (BES). BES 10-Year Strategic Plan 2018–2027; City of Portland: Portland, OR, USA, 2018. Available online: https://www.portland.gov/bes/documents/bureau-environmental-services-10-year-strategic-plan-2018-2027 (accessed on 8 April 2025).
  81. Bureau of Environmental Services (BES). Environmental Grants and Incentives; City of Portland: Portland, OR, USA, 2025. Available online: https://www.portland.gov/bes/grants-incentives (accessed on 8 April 2025).
  82. Bureau of Environmental Services (BES). Effect of Design Modifications on Plant Health in Lined and Unlined Facilities; City of Portland: Portland, OR, USA, 2022. Available online: https://efiles.portlandoregon.gov/Record/16484817/ (accessed on 11 May 2025).
  83. Bureau of Environmental Services (BES). Effect of Soil Type on Soil Moisture in Lined Facilities; City of Portland: Portland, OR, USA, 2022. Available online: https://efiles.portlandoregon.gov/Record/16484866/ (accessed on 11 May 2025).
  84. Bureau of Environmental Services (BES). Effect of Underdrain Type on Soil Moisture in Lined Facilities; City of Portland: Portland, OR, USA, 2022. Available online: https://efiles.portlandoregon.gov/Record/16484872/ (accessed on 11 May 2025).
  85. American Public Works Association. Projects of the Year 2023. Portland, OR, USA. Available online: https://oregon.apwa.org/resources/awards/project-of-the-year-award/2023-award-winners/ (accessed on 11 May 2025).
  86. Portland Bureau of Transportation. SW Capitol Highway—Multnomah Village to West Portland Project. Available online: https://www.portland.gov/transportation/pbot-projects/construction/sw-capitol-highway-multnomah-village-west-portland (accessed on 11 May 2025).
  87. Bureau of Environmental Services. American Public Works Association Awards SW Capitol Hwy: Multnomah Village to West Portland Project. Available online: https://www.portland.gov/bes/news/2023/10/31/american-public-works-association-awards-sw-capitol-hwy-multnomah-village-west (accessed on 11 May 2025).
  88. Hutchinson, D.; Abrams, P.; Retzlaff, R.; Liptan, T. Stormwater Monitoring two Ecoroofs in Portland, Oregon, USA. In Greening Rooftops for Sustainable Communities; Green Roofs for Healthy Cities: Toronto, ON, Canada, 2003. [Google Scholar]
  89. Bureau of Environmental Services (BES). Stormwater Management Facility Monitoring Report; Sustainable Stormwater Management Program; City of Portland: Portland, OR, USA, 2010. [Google Scholar]
  90. Okita, J.; Poor, C.; Kleiss, J.M.; Eckmann, T. Effect of green roof age on runoff water quality in Portland, Oregon. J. Green Build. 2018, 13, 42–54. [Google Scholar] [CrossRef]
  91. Poor, C.; Balmes, C.; Freudenthaler, M.; Martinez, A. Role of mycelium in bioretention systems: Evaluation of nutrient and metal retention in mycorrhizae-inoculated mesocosms. J. Environ. Eng. 2018, 144, 04018034. [Google Scholar] [CrossRef]
  92. Kohlsmith, E.; Morse, J.; Poor, C.; Law, J. Stormwater treatment effectiveness of established lined bioretention facilities in Portland, Oregon. J. Sustain. Water Built Environ. 2021, 7, 05021002. [Google Scholar] [CrossRef]
  93. Wolfand, J.; Poor, C.J.; Taylor, B.L.; Morrow, E.; Radke, A.; Diaz-Gunning, E. Microplastics: The occurrence in stormwater runoff and the effectiveness of bioretention systems for removal. J. Environ. Eng. 2023, 149, 04023078. [Google Scholar] [CrossRef]
  94. Wise, S. Green Infrastructure Rising: Best Practices in Stormwater Management. Planning 2008, 74, 14–19. [Google Scholar]
  95. Wethington, B. Green Infrastructure in the City of Portland, OR; City of Portland Bureau of Environmental Services Presentation: Portland, OR, USA, 2015. [Google Scholar]
  96. Fahy, B.; Chang, H. Effects of Stormwater Green Infrastructure on Watershed Outflow: Does Spatial Distribution Matter? Int. J. Geospat. Environ. Res. 2019, 6, 5. [Google Scholar]
  97. Chang, H.; Baker, A.; Starry, O.; Chen, J. Seasonal Variation in Hydrologic Performance of Ecoroofs of Multiple Depths: A Case Study in Portland, Oregon, USA. Urban Water J. 2021, 18, 128–135. [Google Scholar] [CrossRef]
  98. Sauer, J.; Chang, H. Watershed management may overcome effects of climate change on stream water quality in the Portland metropolitan area. J. Environ. Manag. 2025, 391, 126304. [Google Scholar] [CrossRef]
  99. Struzak, M.; Poor, C.; Wolfand, J.; Radke, A. Evaluation of biochar as an amendment for the removal of metals, nutrients, and microplastics in bioretention systems. J. Environ. Eng. 2024, 150, 04024007. [Google Scholar] [CrossRef]
  100. Chapman, C.; Horner, R.R. Performance assessment of a street-drainage bioretention system. Water Environ. Res. 2010, 82, 109–119. [Google Scholar] [CrossRef]
  101. Glass, C.; Bissouma, S. Evaluation of a parking lot bioretention cell for removal of stormwater pollutants. WIT Trans. Ecol. Environ. 2005, 81, 699–708. [Google Scholar]
  102. Austin, G. Design and performance of bioretention beds for removal of stormwater contaminants. J. Green Build. 2012, 7, 17–27. [Google Scholar] [CrossRef]
  103. Davis, A.P.; Shokouhian, M.; Sharma, H.; Minami, C.; Winogradoff, D. Water quality improvement through bioretention: Lead, copper, and zinc removal. Water Environ. Res. 2003, 75, 73–82. [Google Scholar] [CrossRef] [PubMed]
  104. Muthanna, T.M.; Viklander, M.; Gjesdahl, N.; Thorolfsson, S.T. Heavy metal removal in cold climate bioretention. Water Air Soil Pollut. 2007, 183, 391–402. [Google Scholar] [CrossRef]
  105. Braga Moruzzi, R.; Galileu Speranza, L.; Tomazini da Conceição, F.; Teodoro de Souza Martins, S.; Busquets, R.; Cintra Campos, L. Stormwater detention reservoirs: An opportunity for monitoring and a potential site to prevent the spread of urban microplastics. Water 2020, 12, 1994. [Google Scholar] [CrossRef]
  106. Gilbreath, A.; McKee, L.; Shimabuku, I.; Lin, D.; Werbowski, L.M.; Zhu, X.; Grbic, J.; Rochman, C. Multiyear water quality performance and mass accumulation of PCBs, mercury, methylmercury, copper, and microplastics in a bioretention rain garden. J. Sust. Water Built Environ. 2019, 5, 04019004. [Google Scholar] [CrossRef]
  107. Lange, K.; Magnusson, K.; Viklander, M.; Blecken, G.T. Removal of rubber, bitumen and other microplastic particles from stormwater by a gross pollutant trap-bioretention treatment train. Water Res. 2021, 202, 117457. [Google Scholar] [CrossRef]
  108. Smyth, K.; Drake, J.; Li, Y.; Rochman, C.; Van Seters, T.; Passeport, E. Bioretention cells remove microplastics from urban stormwater. Water Res. 2021, 191, 116785. [Google Scholar] [CrossRef] [PubMed]
  109. Herrera Environmental Consultants. Analysis of Bioretention Soil Media for Improved Nitrogen, Phosphorus, and Copper Retention. Redmond, WA. 2015. Available online: https://www.herrerainc.com/wp-content/uploads/2021/02/14-05757-000-KitsapHECAnalysis-of-Bioretention-Soil-Media-2015-07-20-4.pdf (accessed on 15 May 2025).
  110. Mullane, J.M.; Flury, M.; Iqbal, H.; Freeze, P.M.; Hinman, C.; Cogger, C.G.; Shi, Z. Intermittent rainstorms cause pulses of nitrogen, phosphorus, and copper in leachate from compost in bioretention systems. Sci. Total Environ. 2015, 537, 294. [Google Scholar] [CrossRef] [PubMed]
  111. Valtanen, M.; Sillanpää, N.; Setälä, H. A large-scale lysimeter study of stormwater biofiltration under cold climatic conditions. Ecol. Eng. 2017, 100, 89–98. [Google Scholar] [CrossRef]
  112. Li, H.; Davis, A.P. Water quality improvement through reductions of pollutant loads using bioretention. J. Environ. Eng. 2009, 135, 567–576. [Google Scholar] [CrossRef]
  113. North Carolina Department of Environmental Quality (NCDEQ). Stormwater Design Manual. Part C: Minimum Design Criteria and Recommendations for Stormwater Control; NCDEQ: Raleigh, NC, USA, 2017. Available online: https://www.deq.nc.gov/about/divisions/energy-mineral-and-land-resources/stormwater/stormwater-program/stormwater-design-manual (accessed on 20 April 2025).
  114. New Hampshire Department of Environmental Services (NHDES). New Hampshire Stormwater Manual: Volume 2. Post-Construction Best Management Practices, Selection, and Design; NHDES: Concord, NH, USA, 2008. Available online: https://www.des.nh.gov/document/stormwater-manual-volume-2 (accessed on 20 April 2025).
  115. Maryland Department of the Environment (MDE). Maryland Stormwater Design Manual, Appendix A; MDE: Baltimore, MD, USA, 2009. Available online: https://mde.maryland.gov/programs/water/StormwaterManagementProgram/Documents/www.mde.state.md.us/assets/document/sedimentstormwater/Appnd_A.pdf (accessed on 20 April 2025).
  116. US Composting Council. USCC Factsheet: Using Compost in Stormwater Management; ASCE: Reston, VA, USA, 2018. [Google Scholar]
  117. Castleton, H.F.; Stovin, V.; Beck, S.B.; Davison, J.B. Green Roofs: Building Energy Savings and the Potential for Retrofit. Energy Build. 2010, 42, 1582–1591. [Google Scholar] [CrossRef]
  118. Johnson, D.; Exl, J.; Geisendorf, S. The Potential of Stormwater Management in Addressing the Urban Heat Island Effect: An Economic Valuation. Sustainability 2021, 13, 8685. [Google Scholar] [CrossRef]
  119. Netusil, N.R.; Lavelle, L.; Dissanayake, S.; Ando, A.W. Valuing the public benefits of green roofs. Landsc. Urban Plan. 2022, 224, 104426. [Google Scholar] [CrossRef]
  120. Makido, Y.; Hellman, D.; Shandas, V. Nature-Based Designs to Mitigate Urban Heat: The Efficacy of Green Infrastructure Treatments in Portland, Oregon. Atmosphere 2019, 10, 282. [Google Scholar] [CrossRef]
  121. Shakya, R.; Ahiablame, L. A Synthesis of Social and Economic Benefits Linked to Green Infrastructure. Water 2021, 13, 3651. [Google Scholar] [CrossRef]
  122. Chan, A.Y.; Hopkins, K.G. Associations between Sociodemographics and Green Infrastructure Placement in Portland, Oregon. J. Sustain. Water Built Environ. 2017, 3, 05017002. [Google Scholar] [CrossRef]
  123. Everett, G.; Lamond, J.E.; Morzillo, A.T.; Matsler, A.M.; Chan, F.K.S. Delivering Green Streets: An Exploration of Changing Perceptions and Behaviours over Time around Bioswales in Portland, Oregon. J. Flood Risk Manag. 2018, 11, S973–S985. [Google Scholar] [CrossRef]
  124. Tanaka, K.; Nelson, H.; McCullar, N.; Parulekar, N. Citizens’ Preferences on Green Infrastructure Practices and Their Enhancement in Portland, Oregon. J. Environ. Manag. 2022, 318, 115415. [Google Scholar] [CrossRef] [PubMed]
  125. Crow-Miller, B.; Chang, H.; Stoker, P.; Wentz, E. Facilitating Collaborative Urban Water Management through University-Utility Cooperation. Sustain. Cities Soc. 2016, 27, 475–483. [Google Scholar] [CrossRef]
  126. Hassing, J.; Ipsen, N.; Clausen, T.; Larsen, H.; Lindgaard-Jørgensen, P. Integrated Water Resources Management in Action. 2009. The United Nations World Water Assessment Programme. Available online: https://www.gwp.org/globalassets/global/toolbox/references/iwrm-in-action-unescounwwapunep-dhi-2009.pdf (accessed on 25 May 2025).
  127. Transition Final Report; City of Portland: Portland, OR, USA, May 2025. Available online: www.portland.gov/transition (accessed on 11 May 2025).
  128. Charter Commission Desired Outcomes; City of Portland: Portland, OR, USA, September 2024. Available online: https://www.portland.gov/omf/charter-review-commission/documents/charter-commission-desired-outcomes-0/download (accessed on 11 May 2025).
  129. City of Portland. One Water. Available online: https://www.portland.gov/water/one-water (accessed on 11 May 2025).
  130. City of Portland. Spring 2025 Organizational Chart. Available online: https://www.portland.gov/hello/documents/city-portland-organization-chart-2025-spring/download (accessed on 11 May 2025).
  131. Shandas, V. Socio-Ecological Dimensions of Salmon in the City. In Wild Salmonids in the Urbanizing Northwest; Yeakley, A., Hughes, J., Mass-Hebner, H., Eds.; Springer: Cham, Switzerland, 2013; pp. 123–142. [Google Scholar]
  132. Hua, X.; Wang, D. Tire-Rubber Related Pollutant 6-PPD Quinone: A Review of Its Transformation, Environmental Distribution, Bioavailability, and Toxicity. J. Hazard. Mater. 2023, 459, 132265. [Google Scholar] [CrossRef]
  133. Tian, Z.; Zhao, H.; Peter, K.T.; Gonzalez, M.; Wetzel, J.; Wu, C.; Hu, X.; Prat, J.; Murdock, E.; Hettinger, R.; et al. A Ubiquitous Tire Rubber–Derived Chemical Induces Acute Mortality in Coho Salmon. Science 2021, 371, 185–189. [Google Scholar] [CrossRef]
  134. McIntyre, J.K.; Davis, J.W.; Hinman, C.; Macneale, K.H.; Anulacion, B.F.; Scholz, N.L.; Stark, J.D. Soil Bioretention Protects Juvenile Salmon and Their Prey from the Toxic Impacts of Urban Stormwater Runoff. Chemosphere 2015, 132, 213–219. [Google Scholar] [CrossRef]
  135. Seattle Public Utilities. Green Stormwater Infrastructure in Seattle: Implementation Strategy 2015–2020; Seattle Public Utilities: Seattle, WA, USA, 2015. Available online: https://www.seattle.gov/documents/departments/ose/gsi_strategy_nov_2015.pdf (accessed on 26 May 2025).
  136. Rodriguez-Valencia, A.; Ortiz-Ramirez, H.A. Understanding Green Street Design: Evidence from Three Cases in the U.S. Sustainability 2021, 13, 1916. [Google Scholar] [CrossRef]
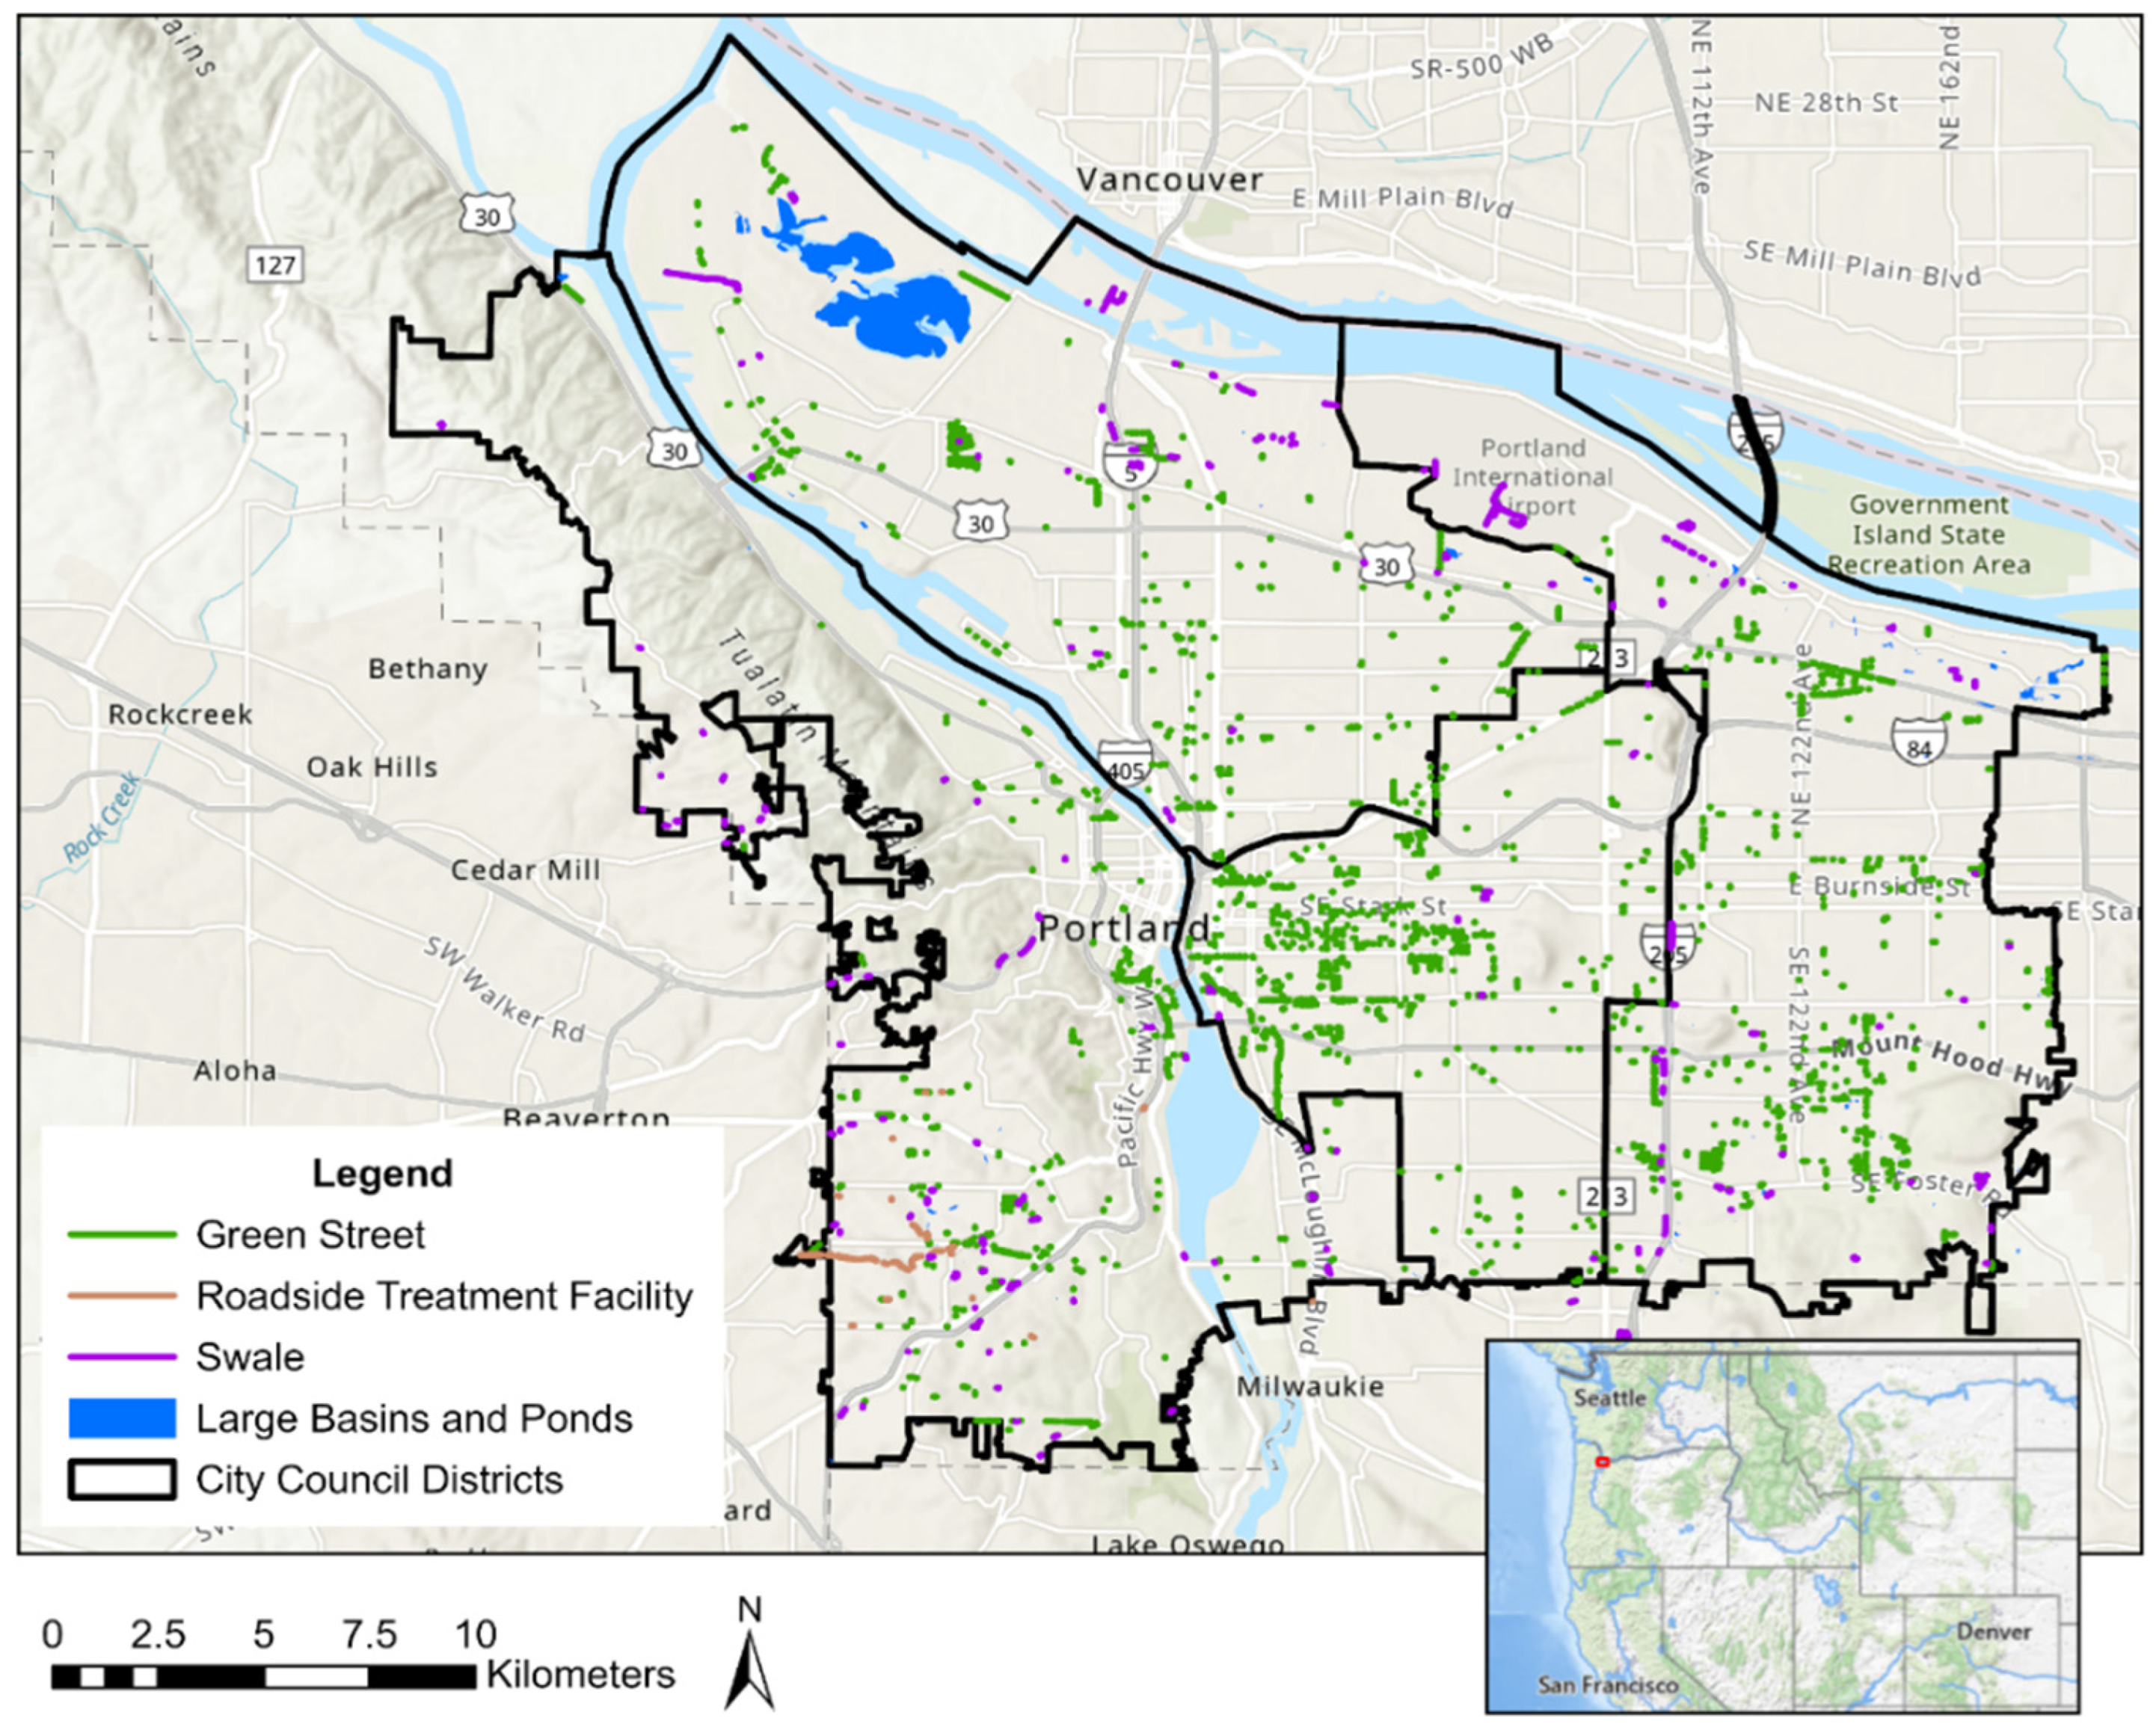
Figure 1. Installations of distributed green stormwater infrastructure (GSI) in Portland, OR, USA, as of May 2025. There are approximately 2950 green street facilities, 70 roadside treatment facilities, 350 swales, and 200 large basins and ponds.
Sustainability 17 07159 g001
Figure 2. Annual installation of public right-of-way green street facilities [55].
Sustainability 17 07159 g002
Figure 3. Typical pocket swale (aka green street) (courtesy of KPFF).
Sustainability 17 07159 g003
Figure 4. Monitoring photos from the Columbia Slough 104B project of two different green streets taken on the same day. The green street on the left has a full liner, the standard soil blend, and low plant cover. The green street on the right has no liner, the standard soil blend, and good plant cover. These facilities are representative of trends observed during the study (©City of Portland).
Sustainability 17 07159 g004
Figure 5. Sidewalks, bike lanes, stormwater management, and water system upgrades along the SW Capitol Highway between SW Multnomah Boulevard and SW Taylors Ferry Road (©City of Portland).
Sustainability 17 07159 g005
Figure 6. The Washington Park Entry Planter inflow “bubbler” structure and cascading stormwater flow into water quality facility during a long and intense storm event, preceded by more than 1.5” of rainfall per 24 h duration and more than 0.5” of rainfall per 5 h duration on 23 February 2025. (Courtesy of Adam Zucker).
Sustainability 17 07159 g006
Figure 7. Washington Park Entry Planter on days without precipitation (Courtesy of Michaela Koucka).
Sustainability 17 07159 g007
Figure 8. Terraced storm planter with sub-surface detention gallery (courtesy of Thomas Harris, KPFF).
Sustainability 17 07159 g008
Table 1. Timeline of key events in Portland’s approach to stormwater infrastructure.
YearEvent
1845The City of Portland is incorporated
1952Portland opens its first wastewater treatment plant
1977Portland creates a stormwater utility and charges a stormwater utility fee
1991Portland enters consent decree with Oregon DEQ to reduce CSOs by 2011
1993Early vegetated stormwater facilities are constructed
1995Oregon DEQ issues Portland’s NPDES MS4 discharge permit
1996Downspout disconnection program launches
1998Columbia River Steelhead Salmon listed as an endangered species
1999Willamette River Chinook and Steelhead Salmon listed as endangered species
1999The first Portland Stormwater Management Manual (SWMM) is published
2000The Portland Harbor listed as a Superfund site
2000Construction of the Columbia Slough “Big Pipe,” a 3.5-mile (6–12 ft diameter) tunnel to reduce CSOs, is completed
2001The Green Building Program, which promotes installation of ecoroofs, is adopted
2002The Green Streets pilot program launches
2005Oregon DEQ issues Portland’s WPCF UIC permit
2006Construction of the West Side “Big Pipe,” a 3.5-mile (14 ft diameter) tunnel to reduce CSOs, is completed
2006The Clean River Rewards Program, which offers incentives for GSI installation, launches
2008The Green Streets Policy established the Percent for Green grant program, which provides grants for GSI installation
2009The Treebate Program, which offers a credit for planting trees, launches
2011Construction of the East Side “Big Pipe,” a 6-mile (22 ft diameter) tunnel to reduce CSOs, is completed
2018The Clean Energy Fund is established in Portland, which provides funding for green stormwater infrastructure projects
2020The Central City ecoroof zoning requirement is established
Disclaimer/Publisher’s Note: The statements, opinions and data contained in all publications are solely those of the individual author(s) and contributor(s) and not of MDPI and/or the editor(s). MDPI and/or the editor(s) disclaim responsibility for any injury to people or property resulting from any ideas, methods, instructions or products referred to in the content.