Article

Integrating Spatial Autocorrelation and Greenest Images for Dynamic Analysis Urban Heat Islands Based on Google Earth Engine

1
College of Horticulture and Plant Protection, Henan University of Science and Technology, Luoyang 471000, China
2
College of Agriculture, Henan University of Science and Technology, Luoyang 471000, China
*
Author to whom correspondence should be addressed.
Sustainability 2025, 17(15), 7155; https://doi.org/10.3390/su17157155
Submission received: 24 June 2025 / Revised: 26 July 2025 / Accepted: 5 August 2025 / Published: 7 August 2025
(This article belongs to the Special Issue Sustainable Future of Ecohydrology: Climate Change and Land Use)

Abstract

With rapid global urbanization development, impermeable surface increase, urban population growth, building area expansion, and rising energy consumption, the urban heat island (UHI) effect is becoming increasingly serious. However, the spatial distribution of the UHI cannot be accurately extracted. Therefore, we focused on Luoyang City as the research area and combined the Getis-Ord-Gi* statistic and the greenest image to extract the UHI based on the Google Earth Engine using land surface temperature–spatial autocorrelation characteristics and seasonal changes in vegetation. As bare land considerably influenced the UHI extraction results, we combined the greenest image with the initial extraction results and applied the maximum normalized difference vegetation index threshold method to remove this effect on UHI distribution extraction, thereby achieving improved UHI extraction accuracy. Our results showed that the UHI of Luoyang continuously expanded outward, increasing from 361.69 km2 in 2000 to 912.58 km2 in 2023, with a continuous expansion rate of 22.95 km2/year. Furthermore, the urban area had a higher UHI area growth rate than the county area. Analysis indicates that the UHI effect in Luoyang has increased in parallel with the expansion of the building area. Intensive urban construction is a primary driver of this growth, directly exacerbating the UHI effect. Additionally, rising temperatures, population growth, and gross domestic product accumulation have collectively contributed to the ongoing expansion of this phenomenon. This study provides scientific guidance for future urban planning through the accurate extraction of the UHI effect, which promotes the development of sustainable human settlements.

1. Introduction

The urban heat island (UHI) phenomenon refers to the formation of a high-temperature “heat island” in a city, whereby urban areas exhibit higher temperatures than surrounding suburban or rural areas [1,2,3]. In recent years, due to population density increases and urbanization acceleration [4], impervious surfaces such as buildings and roads in the city have replaced existing natural surfaces. Urban area expansion [5], population increase [6], and gross domestic product (GDP) accumulation [7] are all exacerbating UHI expansion. The increase in UHI areas can considerably influence the urban ecological environment and people’s living conditions [8], disrupting ecological balance and affecting sustainable economic development [9,10,11]. Therefore, studying the automatic monitoring and spatiotemporal dynamic changes in UHI effects is crucial for timely response to the impact of the thermal environment and future development planning.
The most direct method for identifying UHI is to analyze land surface temperature (LST) [12]. The expansion of urban built-up areas leads to surface energy accumulation and LST variation [13,14]. Therefore, the LST is the most effective evaluation indicator for UHI and an important parameter for regional and global surface physical processes [15,16,17]. As urban regions show notably warmer conditions than suburban or countryside regions, areas with higher temperatures can be identified as UHI areas [18,19]. The traditional UHI monitoring method relies on temperature data obtained from ground meteorological stations. It involves comparing temperature differences between urban and rural areas to determine the UHI range [20]. The shortcomings are the low distribution density of meteorological stations, making them unable to simultaneously monitor temperature in distant areas, which limits the research on large-scale spatial distribution [15,19]. Meantime, many researchers divide LST into multiple temperature groups through threshold classification and then determine the spatial range of the highest temperature zone as the UHI area [21,22]. Other studies calculate the threshold for the temperature difference between urban and countryside regions based on the defined scope of these areas, thereby determining the geographical extent of the urban heat island [23,24,25]. Notably, different threshold algorithms have different recognition results for UHI. Moreover, with rapid and sustained urbanization, clearly delineating urban–rural boundaries is challenging [23,24]. UHI effects leads to a high concentration of LST within urban areas, thereby forming spatially aggregated regions exhibiting comparatively uniform features in LST images that are distinct from those of other land use categories [26]. Some scholars have recently used spatial autocorrelation methods to display the distribution of LST and explore the spatial distribution characteristics of the UHI [27,28,29]. Furthermore, the results of this method have many erroneous judgments because there are other features with higher surface temperatures, including uncultivated farmland or other exposed soil [6,29]. These bare lands can considerably influence the UHI effect extraction results, which shows that accurately drawing the spatial range of UHI remains challenging [7,13].
With the maturity and widespread application of remote sensing technology, much research tends to utilize satellite imagery data to detect and measure the spatial range of UHI, and thermal infrared images have high potential for monitoring LST [30,31]. The monitoring method of using thermal infrared remote sensing images to invert LST compensates for the shortcomings of traditional temperature monitoring methods, has higher spatial resolution, and can be used for large-scale UHI monitoring [32,33]. The commonly used inversion algorithms include the radiative transfer equation, single-window [34], and split window algorithms [10,35]. However, using traditional methods, such as ENVI 5.3 software, for LST inversion is both complex and time-consuming. Google Earth Engine (GEE) is highly effective for image processing and retrieving data information through programming code. Therefore, it is suitable for studying UHI effects in longer time-series and larger spatial scales [36,37]. Lou et al. (2020) used a single-window algorithm for LST inversion from 2010 to 2018 based on GEE [38]. Gao (2022) utilized Landsat images and implemented three LST inversion algorithms through GEE [39]. Moreover, GEE has brought technological innovations in image synthesis algorithms for mapping UHI effects. The greenest image comprising pixels with the maximum normalized vegetation index (NDVI) value [40,41] can help to distinguish between bare soil areas in farmland and urban areas. So, the greenest image can determine the exposed area after crop harvesting, providing a great basis for accurately detecting UHI effects. However, how to combine spatial autocorrelation and the greenest image to eliminate the impact of harvested farmland on the extraction of heat island effect have not been well characterized. As a result, it is vital to design an algorithm to identify UHI spatial range precisely from Landsat series satellite imagery provided by the GEE cloud platform. In addition, population growth, rapid urbanization, and GDP accumulation have led to the outward expansion of urban buildings [3], converting natural land surfaces into construction land [21], exacerbating LST in urban areas, and making the UHI effect more significant [42,43]. Therefore, exploring the influence of urban expansion on the spatiotemporal distribution range of UHI and analyzing the driving factors behind UHI effects are crucial.
Therefore, our goal is to design an automated algorithm to identify the spatial range of the UHI. We analyze the spatiotemporal dynamic changes in the spatial distribution of UHI from 2000 to 2023 using the spatial autocorrelation characteristics of LST and seasonal changes in vegetation based on the Landsat series remote sensing images provided by the GEE cloud platform. The specific goals of this research are (1) drawing the spatial range of the UHI effect by combining Getis-Ord-Gi* and the greenest image, (2) analyzing the spatiotemporal changes in the UHI spatial range in Luoyang from 2000 to 2023, and (3) exploring the impact of main driving factors on the spatial range of UHI. The research results have important practical significance for the future development planning of Luoyang City and provide a reference for related research in other cities in China.

2. Materials and Methods

The extraction method of the UHI effect area in Luoyang included three parts: (1) inversion of LST based on GEE, (2) conducting spatial autocorrelation analysis of LST using hot spot analysis (Getis-Ord-Gi*), and (3) the influence of bare soil on the extraction results of heat island effect after crop harvest was eliminated based on the greenest image (Figure 1).

2.1. Study Area

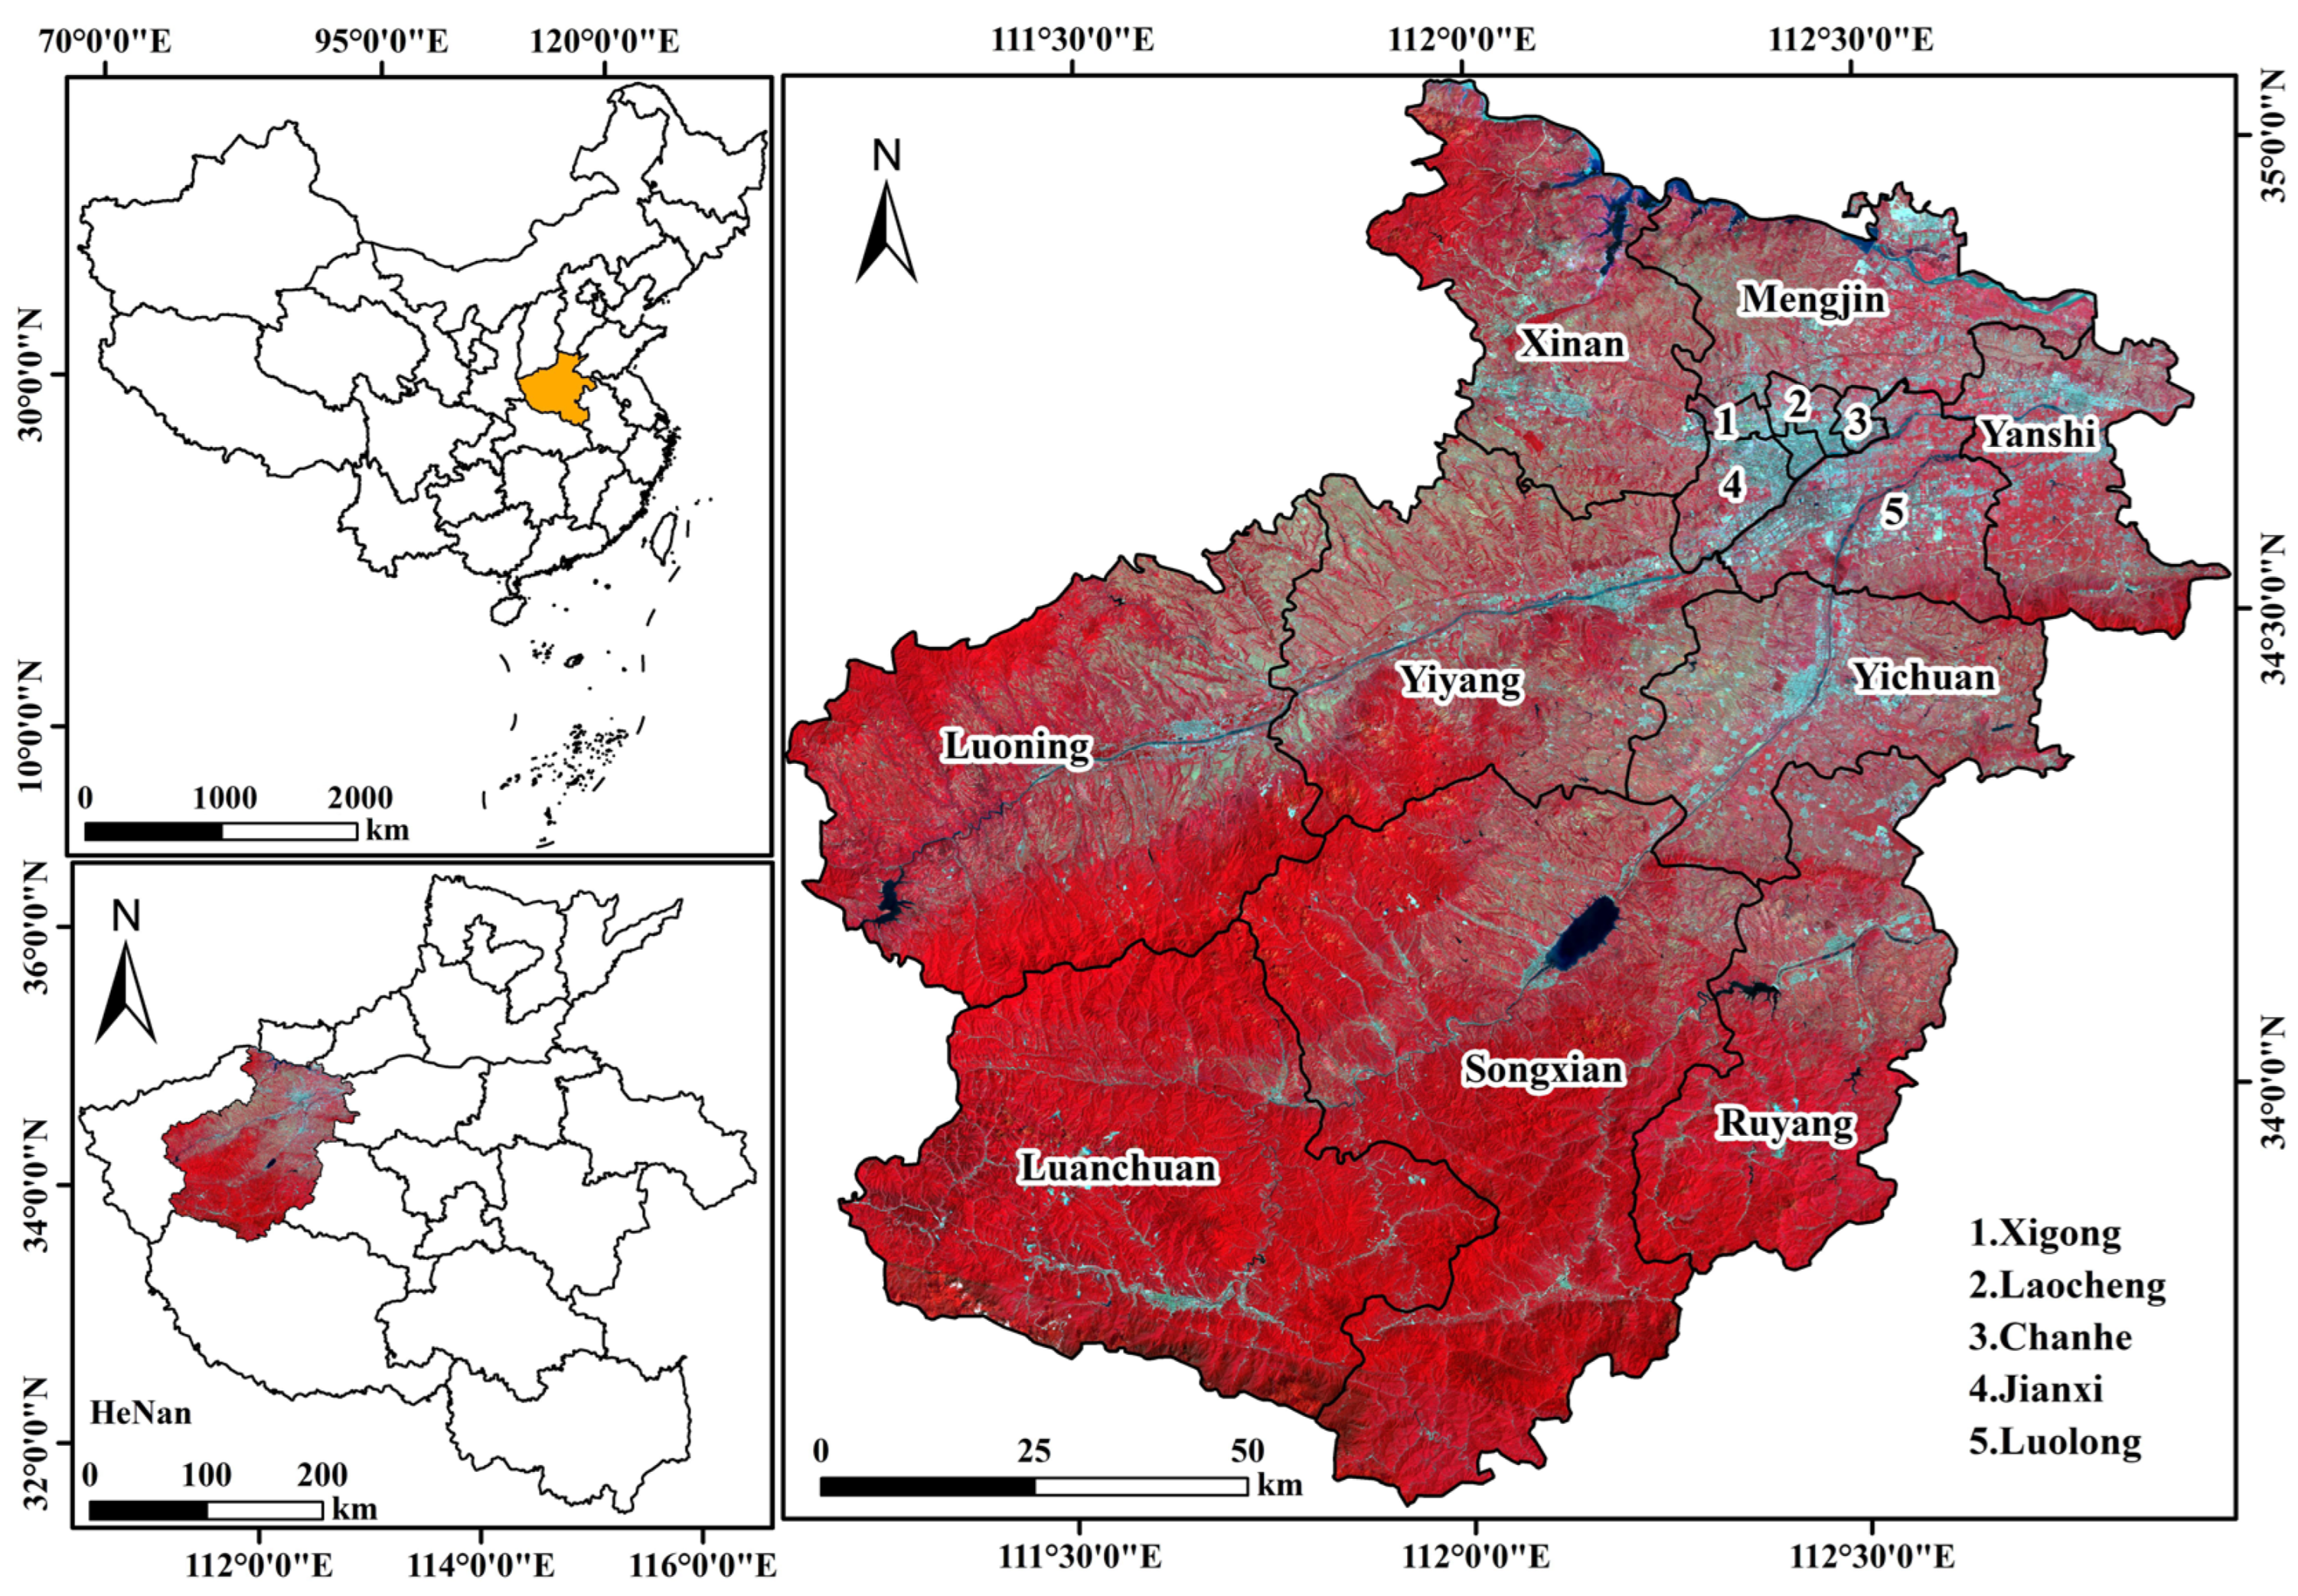
Luoyang (111°08′–113°00′ E, 33°38′–35°05′ N) is located in the west of Henan Province, across the middle and lower reaches of the Yellow River on both sides of the north and south. It is the second largest city in Henan Province and has been approved by the State Council as a sub-central city, a famous tourist city, and an important industrial city in Henan Province. The region has a temperate monsoon climate, spring is dry with frequent strong winds, and summer is hot and rainy with concentrated rainfall. The total area of Luoyang City is 15,200 km2, with the urban area covering 2274 km2. According to the statistical data from the Luoyang Municipal People’s Government (https://www.ly.gov.cn/zwgk/szfbgsgkml/tjgb/index.html; accessed on 28 June 2024), Luoyang’s permanent resident population reached 7.08 million in 2023, including 4.77 million urban permanent residents. Compared to the population data in 2013, the urban population in 2023 has increased by 45.92%. The rapid urbanization and population growth in Luoyang have intensified the UHI effect, making it an ideal case for studying this phenomenon. As a key industrial and tourist city, Luoyang has a high concentration of economic activities and energy consumption, both of which further exacerbate the UHI effect. The increased energy demands associated with industrial activities and tourism infrastructure amplify waste heat emissions, while dense urbanization reduces natural land cover. This combination of anthropogenic heat release and altered surface characteristics constitutes a primary driver of UHI effect [44,45]. So, studying this phenomenon in Luoyang can provide a scientific basis for urban planning and environmental protection policies, as well as valuable insights for other cities with similar scales and climatic conditions. According to the urban expansion degree of each administrative area, Luoyang is classified into urban areas (Xigong, Laocheng, Chanhe, Jianxi, Luolong, Mengjin, and Yanshi) and county areas (Xin’an, Yiyang, Yichuan, Luoning, Songxian, Ruyang, and Luanchuan) (Figure 2). The main farmland that affects the extraction of UHI effects are winter wheat and corn in Luoyang. Winter wheat is sown from 10 October to 31 October and harvested in early June of the following year. Corn is mainly sown from 20 May to 31 May and harvested from 1 September to 20 September.

2.2. Datasets

2.2.1. Landsat Image

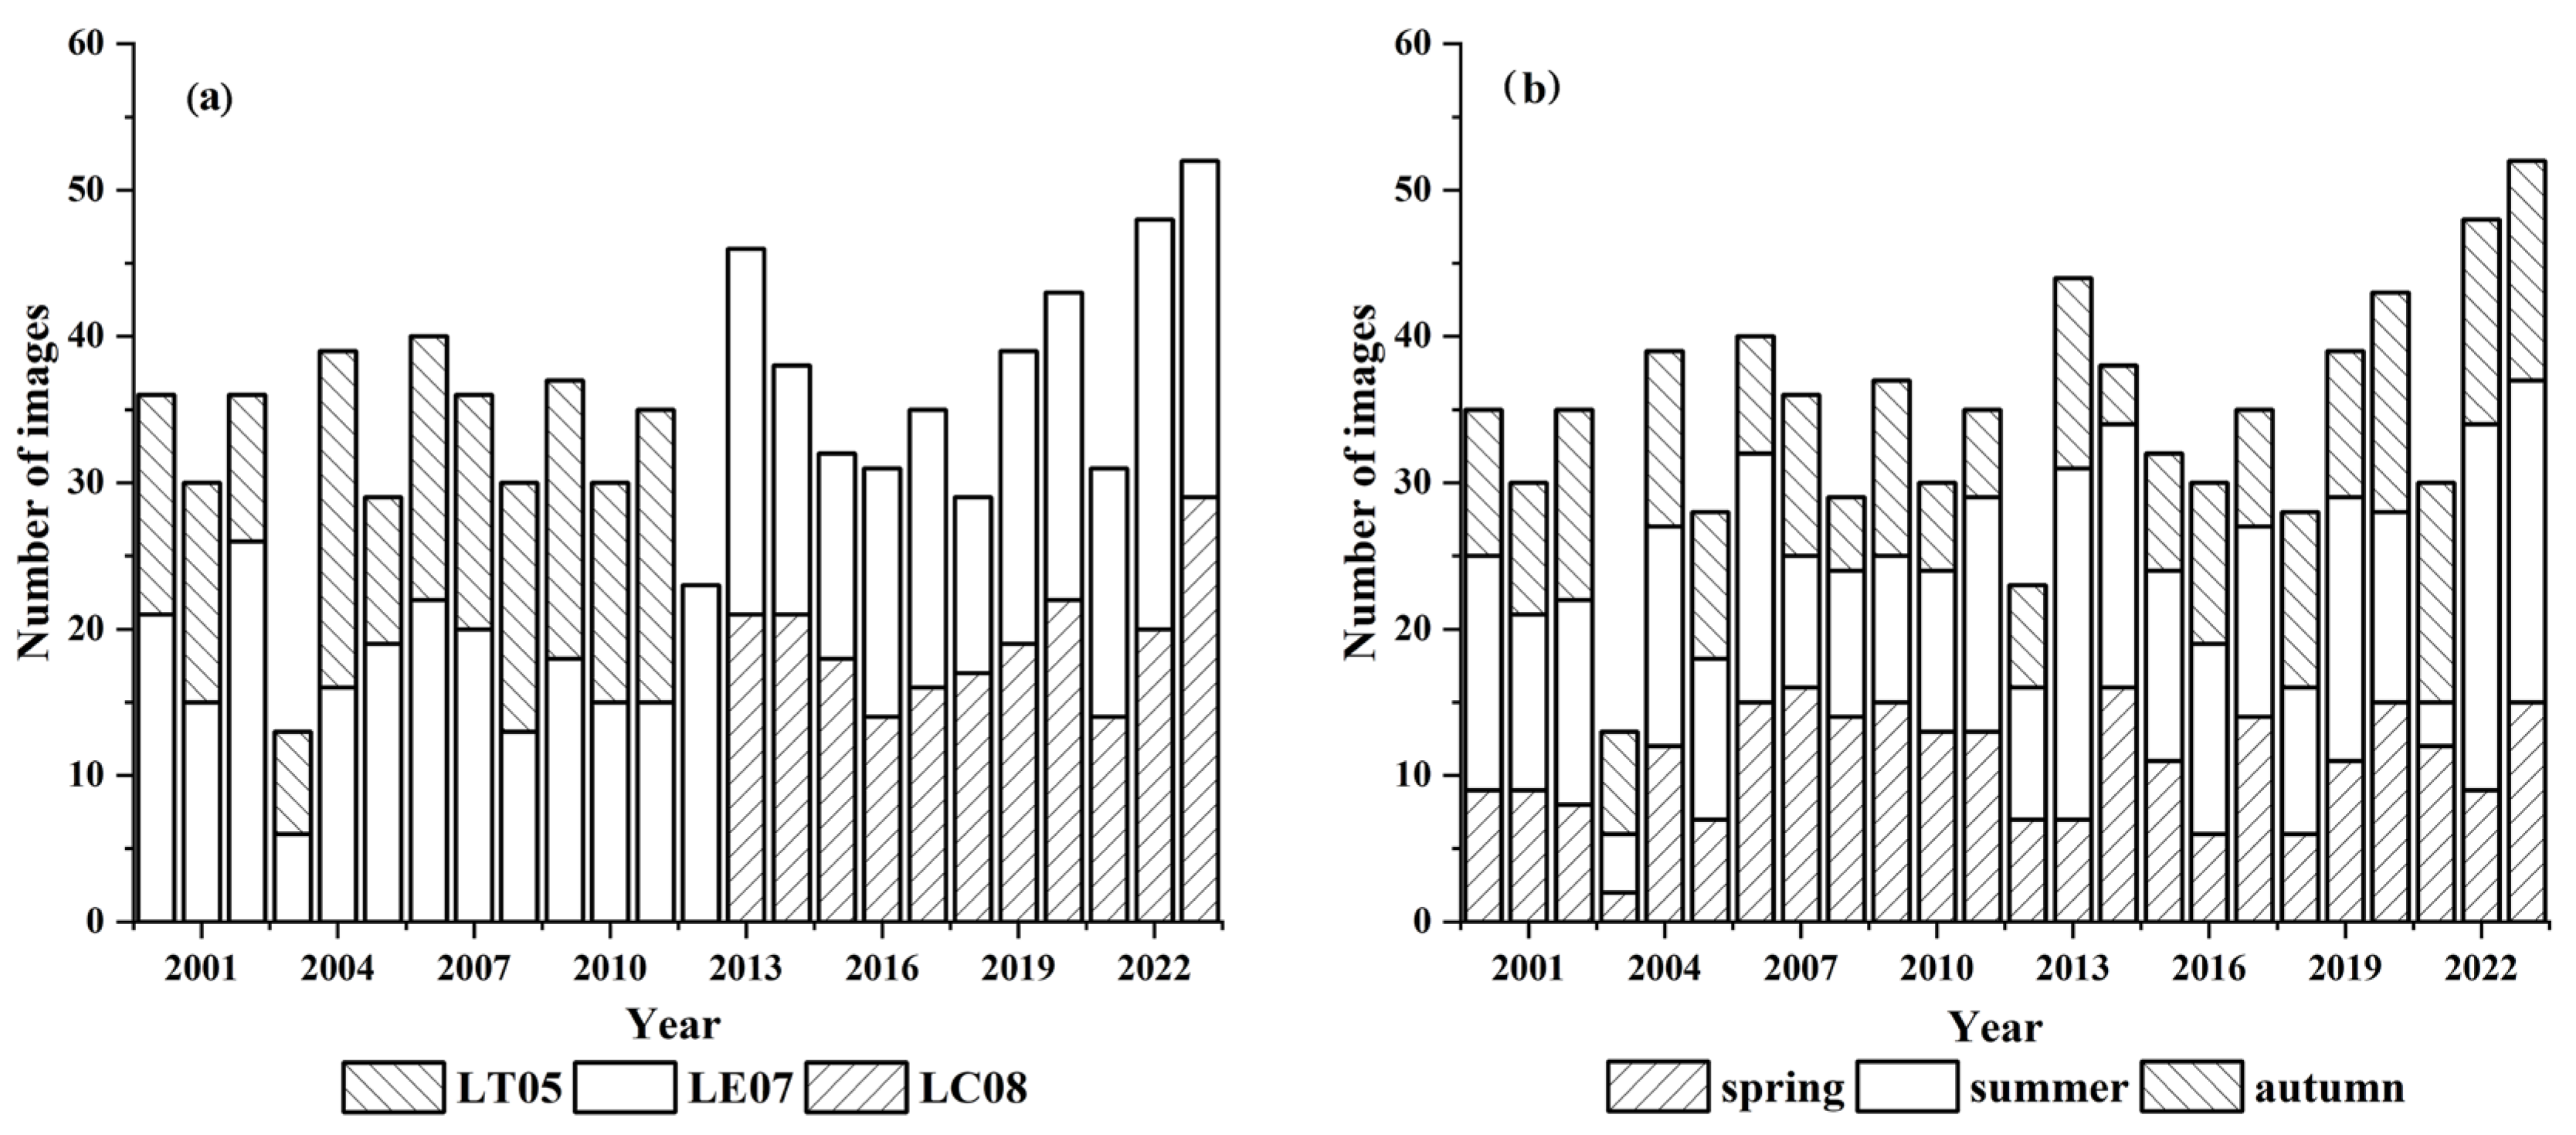
Due to the discontinuation of support for the Collection 1 dataset by the USGS as of January 2024, this study utilizes the Collection 2 dataset for data processing. The Collection 2 Level 2 dataset of the Landsat series, obtained from the GEE cloud platform, available online at https://code.earthengine.google.com (accessed on 9 April 2024), serves as the main data source. The Landsat series remote sensing image dataset obtained in this study included 185 thematic imager (TM) images (2000–2011) and 211 operational land imager (OLI) images (2013–2023). The image quality band (QA) value was obtained using a CF Mask (C Function of Mask) algorithm after mask processing images on the GEE cloud platform. It mainly includes clouds, cirrus clouds, and cloud shadows. The pixel quality evaluation algorithm provided by GEE was utilized to identify and remove clouds and cloud shadows, eliminating the influence of clouds and shadows in Landsat images. Images acquired between April and October each year were selected for LST inversion on the GEE platform. Finally, an image set with the highest comprehensive score and the lowest cloud cover from 2000 to 2023 was generated. This image set was then employed to replace the corresponding images in the original image dataset to construct the minimum cloud cover image set. The resulting image was compared with traditional images to extract land cover information. The minimum cloud cover image set improved the quantity and quality of optional remote sensing images, overcoming the shortcomings of poor image quality caused by cloudy and rainy climate characteristics in the study area. Figure 3 shows the number of Landsat images divided by sensors (TM, ETM+, and OLI) (Figure 3a) and months (Figure 3b) from 2000 to 2023.

2.2.2. Additional Data

According to the statistical data from the Luoyang Municipal People’s Government, available online at https://www.ly.gov.cn/zwgk/szfbgsgkml/tjgb/index.html (accessed on 28 June 2024), GDP data, resident population data, and urban population data of Luoyang were obtained. The surface cover types of Luoyang were divided into five categories including farmland, vegetation, water bodies, impermeable surfaces, and wetlands based on the annual land cover datasets in China from 1985 to 2023, which has a resolution of 30 m and is available online at https://zenodo.org/records/12779975 (accessed on 31 March 2024) [46].

2.3. Methodology

2.3.1. GEE-Based Temperature Inversion

The Landsat Collection 2 Level 2 data included atmospheric-corrected surface reflectance and surface temperature. All Collection 2 surface temperature products were created using a single channel algorithm jointly developed by the Rochester Institute of Technology and NASA Jet Propulsion Laboratory. Therefore, the thermal infrared band of Landsat Level 2 data products directly corresponds to the surface temperature, and the Celsius degree can be obtained by a simple calculation. After downloading the Level 2 image, the surface reflectance and surface temperature can be calculated using Equations (1) and (2).
S R = D N × 0.0000275 0.2
where SR is the surface reflectance and DN is the pixel value of Landsat Collection 2 Level 2 images (Equation (1)).
L S T = D N × 0.00341802 + 149 273.15
where LST is the land surface temperature (Equation (2)).
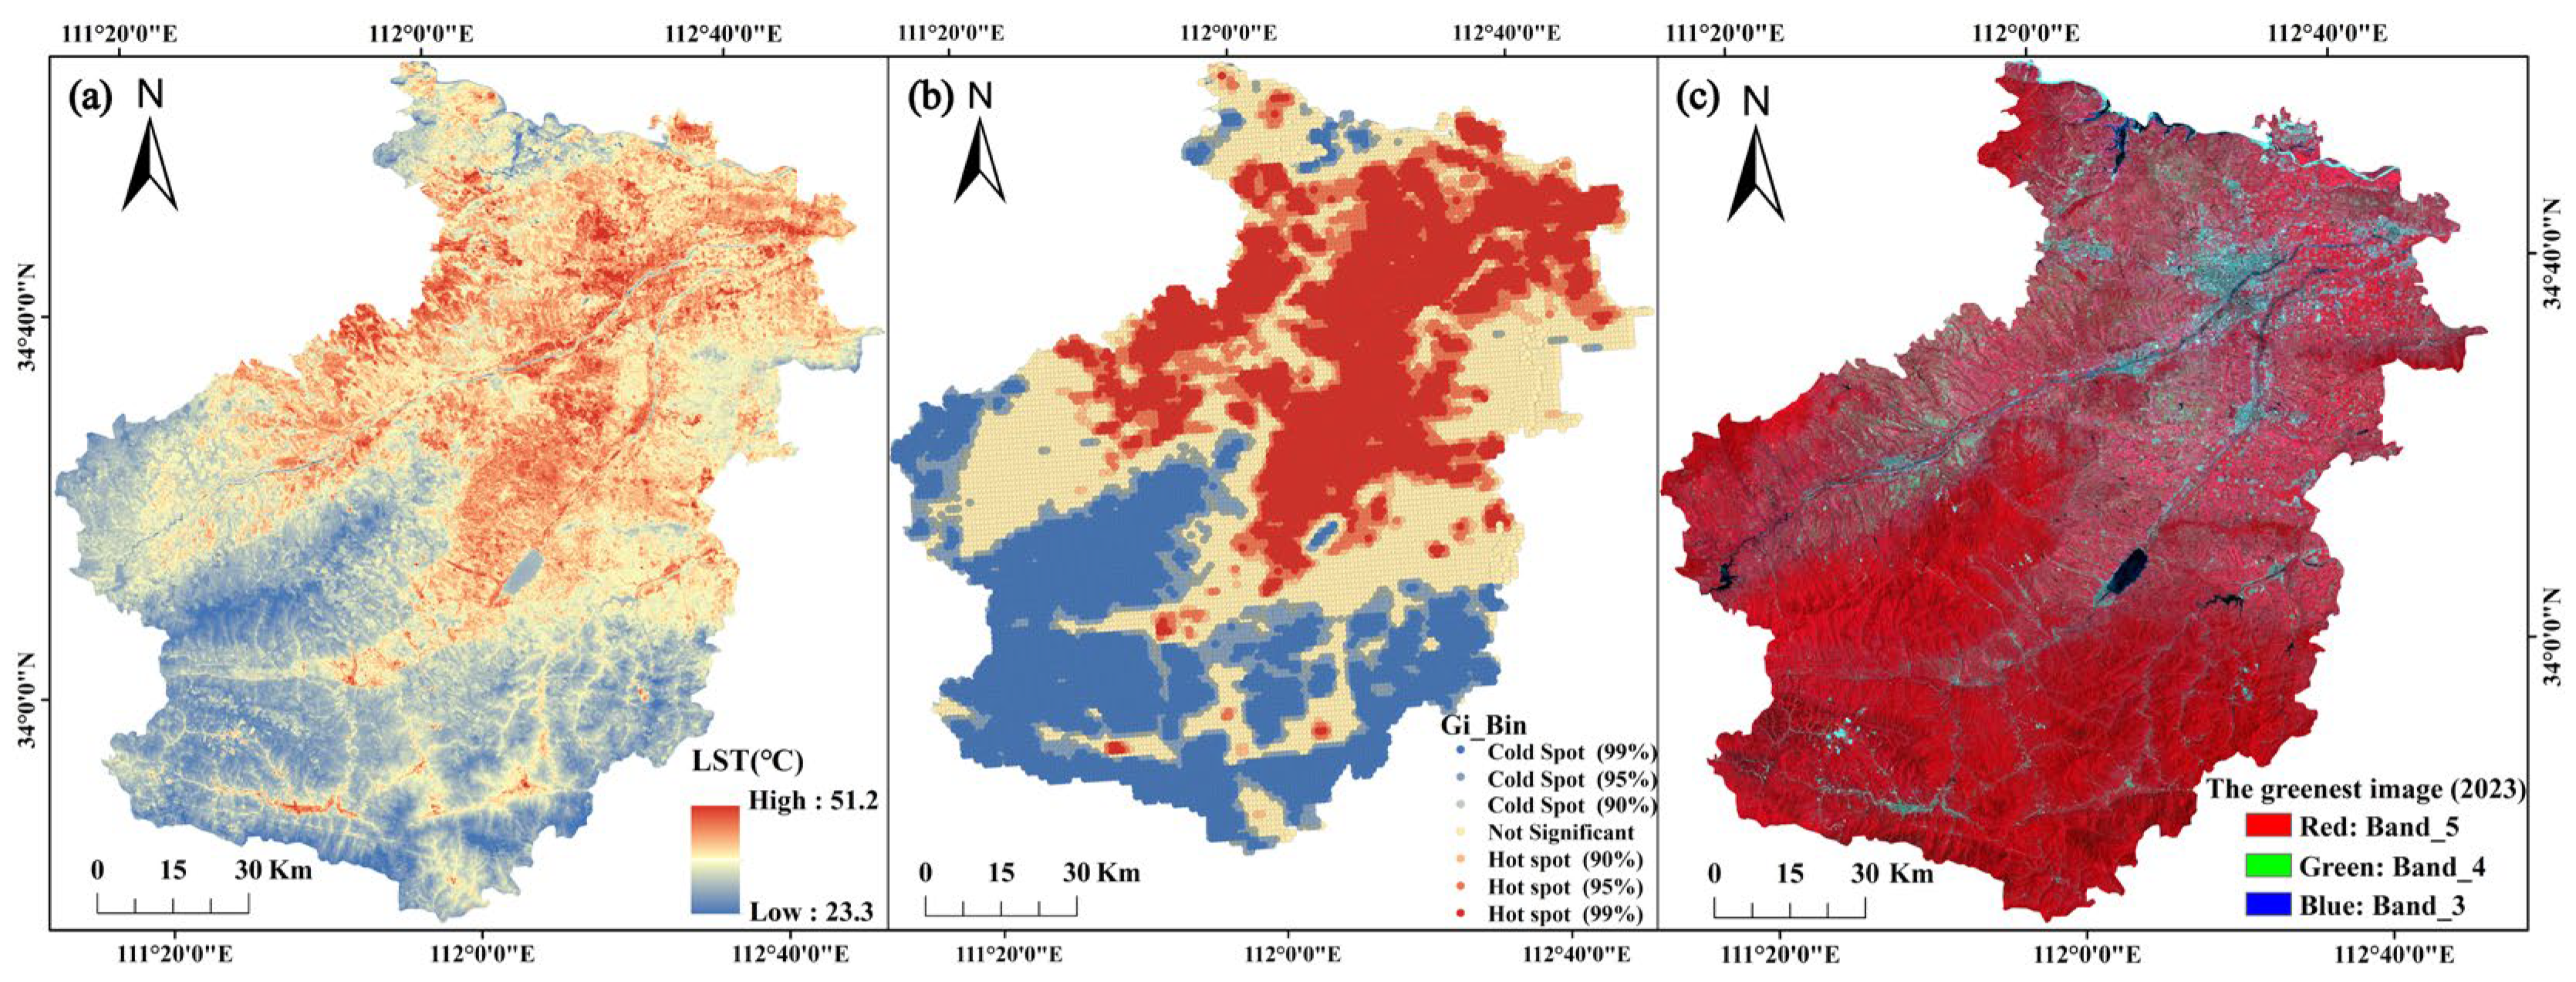
By directly utilizing the thermal infrared band in the GEE cloud platform, the average surface temperature (LST) from April to October (2000–2023) was calculated (Figure 4a), all with a spatial resolution of 30 m. The resulting LST data were then processed through time-series analysis. For months with missing LST values, interpolation was applied to the data from other months, allowing for the generation of continuous spatial distribution data of LST from 2000 to 2023.

2.3.2. Spatial Autocorrelation Analysis

Spatial autocorrelation analysis is a method of identifying spatial clusters with relative uniformity, such as surface temperature and air temperature. Getis-Ord-Gi* (hotspot analysis) is among the most widely used spatial autocorrelation analysis tools that can calculate Getis-Ord-Gi* statistics for each element in the dataset [26]. Spatial clustering of high- or low-value elements can be identified through the use of z-scores and p-values [27,28,47]. For an element to emerge as a significant hotspot with statistical relevance, it must not only exhibit high values but also be surrounded by other elements that share similarly high values [48]. The UHI effect leads to the aggregation of high-ground LST in urban areas, resulting in spatial clusters in LST images that differ from other land cover types. In this research, the preliminary findings of the UHI spatial distribution were extracted using Getis-Ord-Gi* (Equation (3)), which are the results before removing exposed soil areas [49,50]. From April to October, the UHI effect in Luoyang was the highest, so we selected images from this period to identify the spatial range of the UHI. We extracted hot spots (p ≤ 0.05; Gi_Bin ≥ 2, points with confidence interval exceeding 95%) as the preliminary findings of the UHI spatial distribution (Figure 4b).
G i * = i = 1 N j = 1 N W ( i , j ) x i x j i = 1 N j = 1 N x i x j
where N is the total count of points, W (i, j) is the spatial weight matrix calculated using the inverse distance method, where weights decrease with increasing distance. The threshold distance (921.19 m), calculated using Euclidean distance via the Average Nearest Neighbor tool, defines the maximum distance beyond which spatial relationships receive zero weight. xi is the LST of point i; xi is the spatial neighbor of xj; G i * is the spatial correlation index (the higher the value of G i * , the more significant the hot spot; the lower the value of G i * , the more significant the cold spot).

2.3.3. The Greenest Image

After crop harvesting in agricultural areas, the exposed soil area becomes a spatial cluster with a high LST. Using hotspot analysis tools to perform spatial autocorrelation analysis on LST, hotspots with high confidence intervals (i.e., exceeding 95%) are identified as UHI zones [50]. However, the UHI zones identified by this method also encompass bare soil regions within farmland. Notably, synergizing red and near-infrared bands in remote sensing images can effectually reflect vegetation information. The NDVI is an important parameter used to monitor the growth status and coverage of vegetation [51,52]. As vegetation coverage increases, the NDVI also increases. Therefore, the maximum NDVI image in the study area, also known as the greenest image [41], helps to distinguish between bare soil areas in farmland and urban areas. In this study, the NDVI of each pixel in the annual image of the image dataset was first generated based on the GEE, all with a spatial resolution of 30 m. Then, the maximum NDVI of the entire research area was obtained using the “quality Mosaic” function, after which the greenest images of the research area from 2000 to 2023 were generated (Figure 4c). Finally, areas with high NDVI (NDVI ≥ 3.6) were discarded from the preliminary findings of the UHI spatial distribution to eliminate the impact of bare farmland.

2.3.4. Postprocessing for UHI Extraction

Postprocessing included calculating point density, selecting the appropriate point density, and transforming raster into polygon. Polygons smaller than 1 km2 were removed, and the remaining ones were identified as UHI areas. After extracting the spatial distribution of the UHI, we examined the spatiotemporal dynamics of UHI in Luoyang from 2000 to 2023. We quantified the UHI area in each district and county of Luoyang and employed segmented linear regression in Origin 2022 to analyze the characteristics of the dynamic changes in the UHI area.

2.3.5. Analysis of Factors Influencing the UHI Effect

This study explores the spatiotemporal dynamic changes and driving factors of the UHI from 2000 to 2023. Based on the extracted spatial distribution of UHI, we created spatiotemporal dynamic change maps for the years 2007 and 2016 and analyzed their dynamic characteristics utilizing ArcGIS 10.7. Additionally, to assess the correlation between UHI area and key driving factors, we conducted linear regression using Origin 2022, selecting population, GDP, and built-up area as potential influencing factors. We calculated R2 value to quantify the strength of the relationships between UHI area and these factors.

3. Results

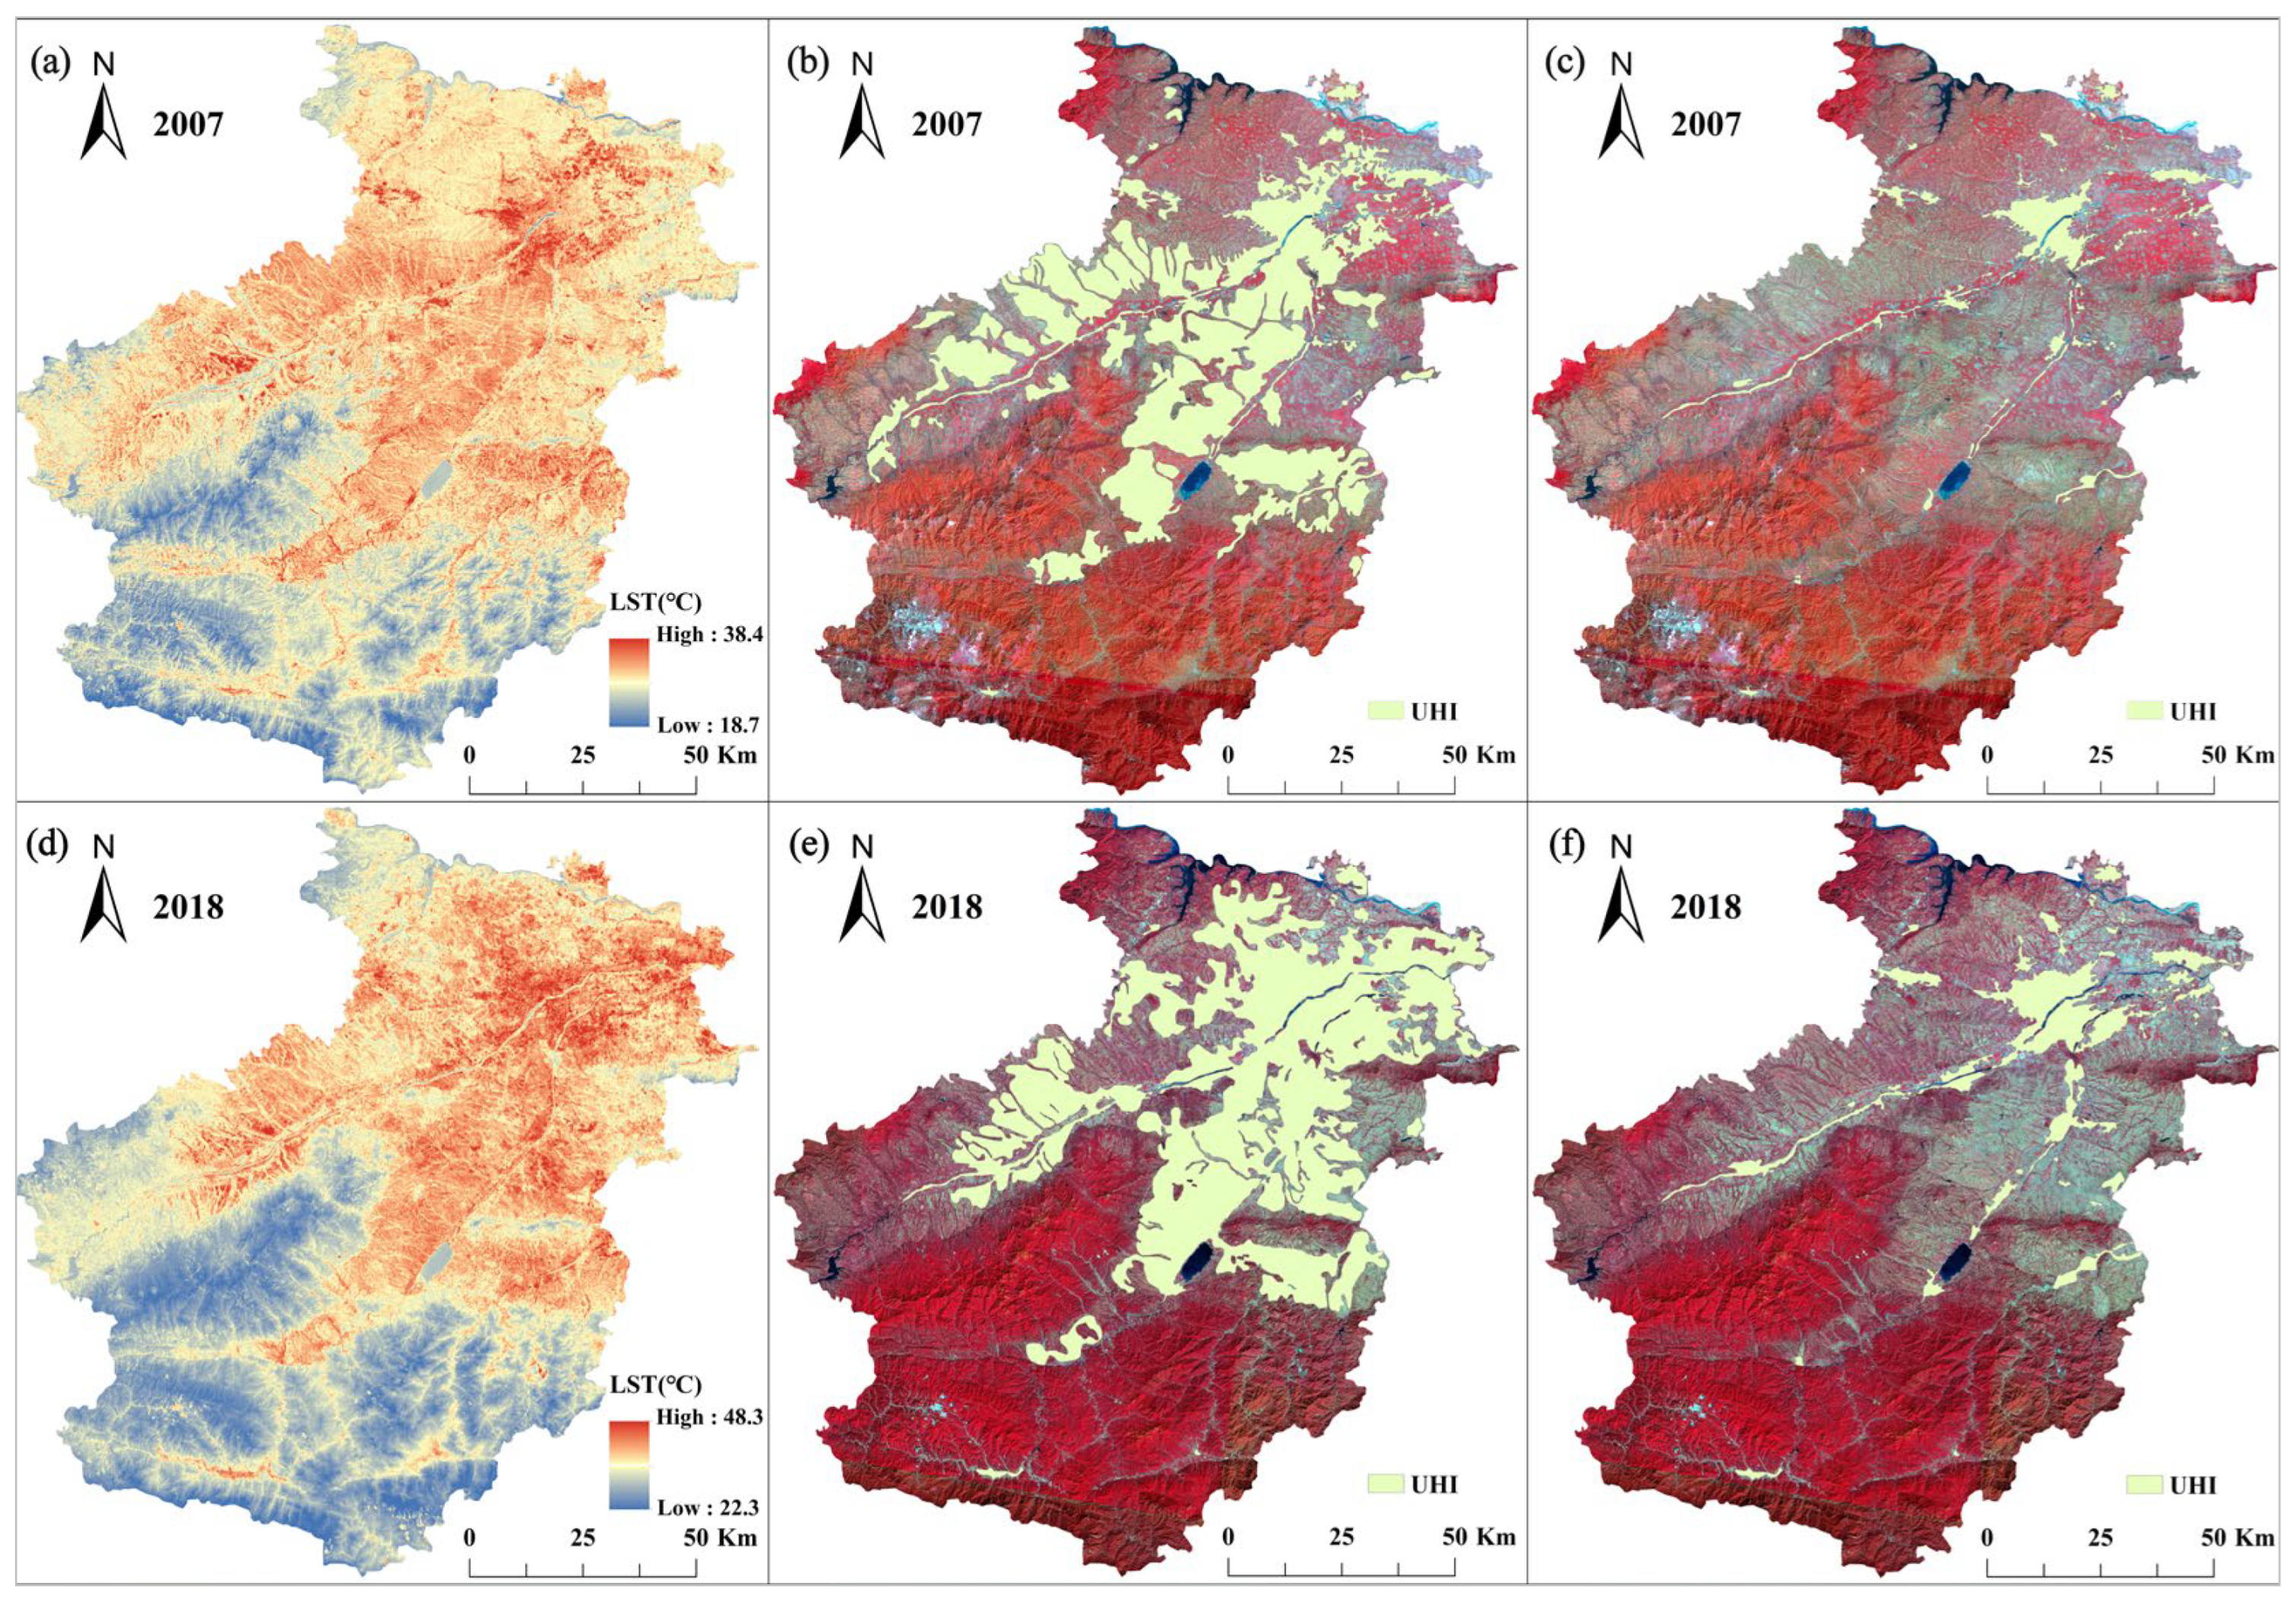
3.1. UHI Effect Spatial Distribution Mapping

Figure 5a–f depicts the spatial distribution map of the UHI effect in Luoyang. This study obtained the spatial distribution map of LST by temperature inversion of the thermal infrared band in GEE (Figure 5a,d). The redder the color of the distribution area, the higher the temperature, forming a “heat island” effect. Conversely, the blue area represents the “cold island” distribution area of Luoyang. Subsequently, spatial autocorrelation analysis was performed to obtain preliminary analysis results on the UHI effect (Figure 5b,e). The results indicate that the UHI areas of Luoyang were mainly concentrated in urban areas, and the county areas presented lighter colors. However, the farmland area in Luoyang constituted a large proportion of the total area, with the majority located in Yiyang, Xin’an, and Yichuan counties. After harvesting winter wheat and corn, the large exposed soil areas were mistakenly extracted as UHI areas. To address this, we combined the greenest image of the research area with an appropriate threshold to remove the influence of cultivated land on the UHI effect. This approach yielded a more accurate spatial distribution map of the UHI effect in Luoyang City (Figure 5c,f). The method developed in this study to extract the spatial distribution map of UHI effects in Luoyang can improve extraction accuracy and precision.

3.2. Spatiotemporal Dynamics of UHI Extent (2000–2023)

Based on the spatiotemporal changes in the UHI range in Luoyang City from 2000 to 2023, we analyzed the expansion characteristics of different regions and stages (Figure 6a–i, see the Supplementary Table S1 for the all-urban heat island extraction results). On the whole, the spatial distribution of UHI in Luoyang was constantly expanding outward. The area of UHI increased by 550.89 km2, rising from 361.69 km2 in 2000 to 912.58 km2 in 2023. The UHI area continued to expand at a rate of 22.95 km2/year, with significant spatiotemporal dynamic growth. It can be divided into three stages based on the area change of the UHI (Figure 6j). Before 2007, the spatial distribution of UHI in Luoyang was mainly concentrated in the urban area (Figure 6a–c), and the expanded area was relatively small, with a total increase of 59.25 km2. From 2007 to 2016, the spatial distribution area of the UHI in Luoyang entered the second stage of expansion. During this period, the UHI area increased by 342.36 km2. In particular, Luolong District expanded eastward, with the most significant changes, while other areas expanded southwestward to Jianxi District and northwestward to Chanhe and Laocheng (Figure 6d–f). The UHI areas in the county area also expanded substantially, with UHI mainly distributed in urban areas expanding outward from the original urban foundation. In particular, the UHI areas of Yiyang and Yichuan counties expanded along the Luo River and Yi River to both sides. From 2016 to 2023, the expansion of UHI in Luoyang tended to be moderate (Figure 6g–i), and the area increased from 803.72 km2 in 2016 to 912.58 km2 in 2023. At this stage, the expansion rate of counties exceeded that of urban areas.
The above results indicate a marked disparity in the changes in the UHI effect area between urban and county regions. Therefore, we analyzed the changes in urban and county areas, respectively (Figure 6k). From 2000 to 2023, the urban and county UHI areas in Luoyang both increased and continuously expanded outward. In urban areas, the UHI area expanded rapidly before 2016, increasing from 209.52 km2 in 2000 to 485.75 km2 in 2016, at an average annual growth of approximately 16.25 km2. However, between 2016 and 2023, the expansion rate slowed, with an average annual increase of only 3.45 km2. In contrast, UHI expansion in the county areas was relatively slow prior to 2007, with an average annual increase of 3.54 km2. After 2007, the expansion accelerated, with the area growing from 180.50 km2 in 2007 to 399.21 km2 in 2023, corresponding to an average annual increase of 12.87 km2. Overall, the average annual growth rate of UHI area in urban regions (12.66 km2) was slightly higher than that in county areas (10.29 km2).

3.3. UHI Distribution in Different Regions of Luoyang from 2000 to 2023

To reduce the uncertainty of the UHI area in the study area caused by the extraction results of specific years or other factors, we determined the dividing points based on the expansion rate of the UHI area. The research found that the expansion rate of the UHI area was relatively slow before 2007 and after 2016, while it rapidly intensified between 2007 and 2016 (Figure 6k). Therefore, according to the three stages of UHI area change, we used 2007 and 2016 as the dividing points to calculate the dynamic changes in the average annual area of UHI and divided them into three periods (2000–2007, 2007–2016, and 2016–2023) to study the spatiotemporal pattern dynamics in UHI (Figure 7a–c). The results show that the UHI in the entire study region has continuously expanded over the three periods. The urban UHI area increased from 1914.34 km2 in the first stage to 3956.94 km2 in the third stage, and the county UHI area increased from 1280.83 km2 in the first stage to 2789.22 km2 in the third stage. In particular, the area of Luolong District in the urban area changed the most, and the area of Yichuan County in the county area changed the most. Figure 7b,c present the UHI area expansions in Luolong District and Yichuan County. The UHI area in Luolong District extended not only to the east but also to the southwest along the Luo River to Yiyang County (Figure 7b). Because Yichuan County is near Luolong District, the UHI area extended to both sides of the Yi River.
In addition, we calculated the annual UHI area of urban areas, counties, Luolong District, and Yichuan County, and used segmented linear regression to simulate the trend of the UHI effect (Figure 7d). The results revealed that the urban UHI area showed a significant linear upward trend before 2016 (p < 0.05), from 209.52 km2 in 2000 to 485.75 km2 in 2016, with a total increase of 276.22 km2. However, only a small change in the county area occurred from 2016 to 2023, with an increase of 27.62 km2. The growth trend of Luolong District was consistent with that of the urban area, and the area had increased by 150.20 km2 (Figure 7f). The UHI area of the county increased slowly before 2007, increasing by only 28.21 km2 (Figure 7e). From 2007 to 2023, it showed a significant linear upward trend (p < 0.05), from 180.50 km2 in 2007 to 399.21 km2 in 2023, with a total increase of 218.71 km2. The growth trend of Yichuan County (Figure 7g) was consistent with that of the county area. The total area increased by 65.58 km2.

3.4. The Relationship Between UHI Area and Main Driving Factors

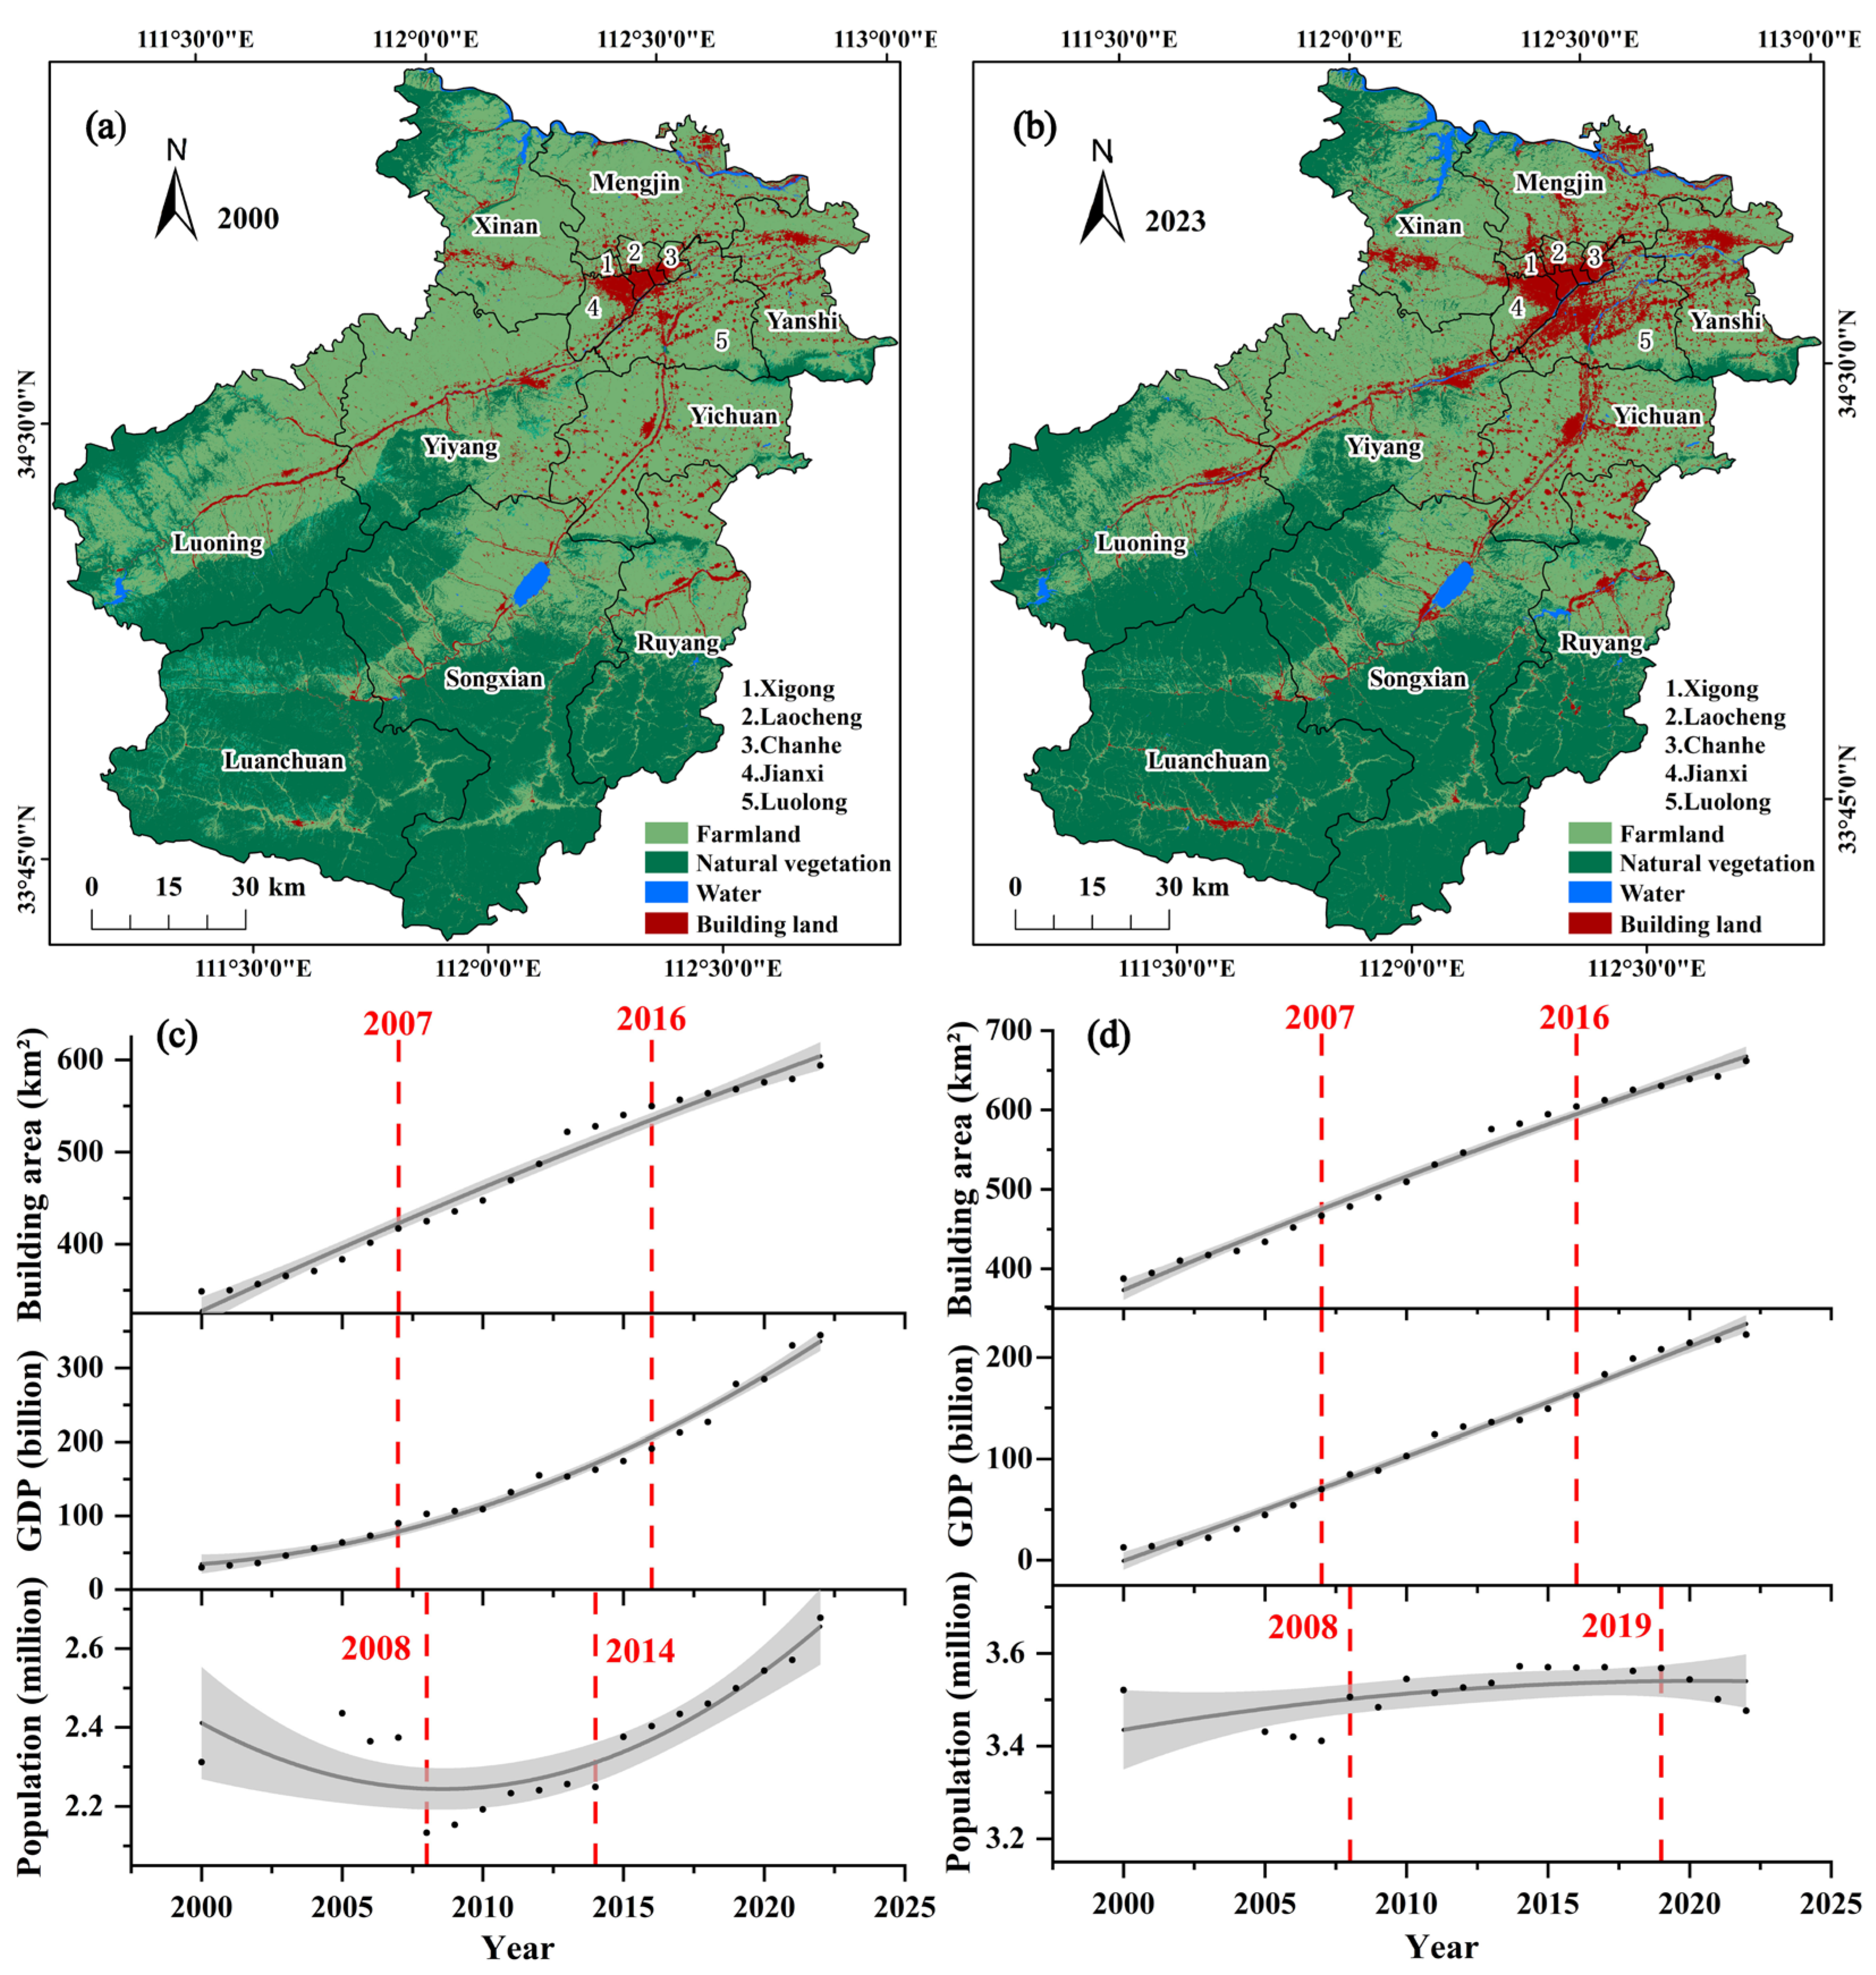
The UHI expansion in urban areas has a significant positive correlation with the expansion of building areas, GDP accumulation, and population increase (Table 1). The urban building areas increased from 348.59 km2 in 2000 to 593.95 km2 in 2022, a total increase of 245.35 km2. After 2008, the urban permanent population increased year by year and maintained a rapid growth trend after 2014. By 2022, the urban permanent population reached 2.68 million, while the regional GDP grew to 330.52 billion (Figure 8c). The growth trends of building areas, population, and GDP in urban areas are consistent with the expansion trend of the UHI. The UHI was primarily concentrated in the districts of Jianxi, Xigong, Laocheng, and Chanhe in 2000 (Figure 8a). From 2000 to 2023, the distribution of urban building areas expanded from the center to the surrounding area, eastward to Luolong District, and southwestward to Yiyang County (Figure 8a,b). Among urban areas, the building area in Luolong District has changed the most. The building area increased from 85.19 km2 in 2000 to 174.67 km2 in 2022, accompanied by a corresponding rise in GDP, which reached 78.92 billion by 2022 (Figure 9a).
However, the correlation between the expansion of UHI in counties and population is extremely low, and the main influencing factors are building area and GDP (Table 2). From 2000 to 2022, the county’s permanent population decreased by 44,600. However, between 2008 and 2019, there was a relatively stable upward trend. The area of construction land maintained an upward trend year by year, with a total increase of 274.06 km2 from 2000 to 2023. The GDP of counties increased from 12.50 billion in 2000 to 222.50 billion in 2022, an increase of 210.00 billion (Figure 8d). From 2000 to 2023, the area of UHI in the county generally showed an upward trend (Figure 7e), which was mainly reflected in the Yi River along Yichuan County. The building area in this region increased by 71.12 km2 from 2000 to 2022, while the GDP increased by 42.23 billion. However, the population increase was small, only 53,000 people (Figure 9b).

4. Discussion

4.1. Extracting the UHI Effect by Combining Spatial Autocorrelation and Greenest Images

In this study, we designed an automated algorithm to identify the spatial range of the UHI from 2000 to 2023 using the spatial autocorrelation characteristics of LST and greenest image provided by the GEE cloud platform. In order to verify the accuracy of the UHI extraction model and results, we first performed comparison with other satellite-based products and approaches, which improved methodological credibility to some extent. The calculation can be completed in a short time by inputting the code of LST inversion into the GEE cloud platform, which is more suitable for the research and processing of large spatiotemporal scales [53,54,55]. Wang et al. developed a global long-term Landsat LST retrieval method on GEE, validated with SURFRAD, BSRN, and HiWATER data. Results showed R2 > 0.9 between retrieved LST and measurements at eight sites (excluding GOB), demonstrating the high accuracy of LST retrieval achievable on the GEE platform [56]. Chen and Na et al. employed the spatial autocorrelation features of LST to analyze its spatial distribution and clustering patterns [50,57]. Building on this, Na et al. further integrated the standard deviation of the normalized difference vegetation index to reduce the influence of bare farmland on UHI extraction [50]. Therefore, the comprehensive application of the greenest image to extract UHI effects is extremely accurate. Additionally, we also quantified the effect of bare soil removal. We calculated the rate of change in UHI area before and after removal (the area decreased by 70% after removal). To further verify the accuracy of the model in removing exposed farmland, consider the following examples. In 2023, Luolong District had relatively limited farmland. Before accounting for farmland interference, the UHI area measured 377.35 km2; after exclusion, it decreased to 198.49 km2, resulting in a reduction of 47.40%. In contrast, Yichuan County, which has more extensive farmland coverage, had a UHI area of 524.06 km2 before exclusion. After removing farmland interference, this area dramatically dropped to 94.33 km2, reflecting a substantial decrease of 82.00%. These examples demonstrate the effectiveness of removing farmland interference.
The UHI areas of Luoyang were mainly concentrated in urban areas, and the county areas presented lighter colors. The spatial pattern of LST in the UHI area showed obvious spatial autocorrelation. Different regions exhibit a certain degree of correlation for LST [17], so hotspot analysis can reveal the preliminary results of the spatial distribution of UHI. However, the farmland area in Luoyang constituted a large proportion of the total area, with the majority located in Yiyang, Xin’an, and Yichuan counties. After harvesting winter wheat and corn, the large exposed soil areas were misidentified as UHI areas (Figure 5b,e) (all extraction results can be found in Supplementary Table S1). These misclassifications primarily resulted from the thermal characteristics of exposed cropland after harvest. The absorption and reflection of solar radiation by exposed farmland after crop harvesting have a high degree of similarity in spectral characteristics with urban areas. This results in similar reflectivity between urban construction land and exposed farmland areas in the thermal infrared band, and the exposed soil has a certain degree of temperature aggregation [29]. Therefore, in the preliminary extraction results of the UHI effects, bare land was identified as UHI areas. Owing to the different growth periods of winter wheat and corn, some farmland becomes bare during summer and autumn, which affects the accuracy of detecting UHI effect areas. To address this, a composite image based on maximum NDVI values was used to distinguish vegetated areas from exposed soil, thereby improving the accuracy of UHI delineation (Figure 4c). In the preliminary identification of the UHI area and the maximum NDVI threshold method, bare soil areas were effectively distinguished from true urban heat zones. This correction improved the spatial accuracy of UHI identification in Yiyang, Xin’an, and Yichuan counties (Figure 5c,f and Supplementary Table S1).

4.2. Analysis of the Driving Factors of UHI Expansion

The expansion of UHI spatial distribution is usually consistent with the expansion caused by the increase in building areas and economic development [58]. While construction land is the area with the largest and most concentrated human activities, most building materials are concrete and other materials that have a high ability to absorb solar radiation but lose heat slowly, exacerbating the UHI effect [59]. The expansion of the UHI in urban areas exhibits a positive correlation with building areas, population, and GDP (Table 1). To promote economic development, urban building areas have expanded considerably, which is consistent with the urban UHI expansion trend. The urban area attracts numerous people with complete facilities and convenient transportation. Population concentration brings more labor to urban areas, driving economic development in these areas. The urban building area, GDP, and population jointly exacerbate UHI expansion (Figure 8c). The expansion of the urban UHI effect is mainly reflected in the eastern and southwestern parts of the Luolong District, attributed mainly to the rapid development of construction in the area [60]. Following the administrative restructuring in 2000, the area was redesignated as Luolong District, with concurrent construction of a western university town, a central business district, and an eastern big data industrial park. Subsequently, the urban area moved from the north of Luo River to the south, realizing cross-river development. At present, it has developed into the central area of Luoyang City [60]. The high-density buildings in urban areas exacerbate the UHI effect [19]. However, after 2016, the infrastructure construction in Luolong District was basically complete; the building area increased by only 17.22 km2 by 2023, the population agglomeration tended to be stable, and the UHI expansion showed a slow upward trend (Figure 9a). Although the population in county areas has increased slightly, the overall change is minimal and shows a very low correlation with UHI expansion (Table 2). In contrast, the rapid growth in building areas and GDP are the primary driving factors behind UHI expansion in these regions (Figure 8d). The UHI expansion in county areas is mainly concentrated in Yichuan County, which is adjacent to Longmen Grottoes and borders Luolong District. The rapid development of the Luolong District has driven the economic development of Yichuan County. The expansion of building areas and GDP accumulation drive UHI expansion (Figure 9b). Additionally, vegetation plays a critical role in mitigating surface urban heat through processes such as evapotranspiration, shading, and increased surface albedo. Surface albedo affects the amount of absorbed solar radiation, building height influences wind flow and shading effects, and canopy cover reflects the spatial extent of vegetative cooling. Meantime, green retrofit strategies including green roofs, vertical greening systems, and other nature-based solutions are effective in reducing surface temperatures, improving thermal comfort, enhancing microclimates, and increasing energy efficiency in urban settings [61,62].

4.3. The Advantages and Disadvantages of Extracting the UHI Area

In this study, to better analyze the spatiotemporal dynamic changes in UHI spatial distribution, we developed a high-precision automated method that combines spatial autocorrelation with the greenest image to map the spatial range of UHI. The success of detecting UHI effects resulted from the enormous computing power of the GEE platform and the synergistic effect of Getis-Ord-Gi* [26] and the greenest image [41]. In this research, the GEE cloud platform was utilized to process remote sensing image data and other earth observation data with powerful cloud computing capabilities [63,64,65]. The traditional LST inversion process is cumbersome and complex, requiring much calculation in ENVI [50,66]. However, the calculation can be completed in a short time by inputting the code of LST inversion into the GEE cloud platform, which is more suitable for the research and processing of large spatiotemporal scales [53,54,55]. Meanwhile, to eliminate the influence of harvested farmland on the identification of the UHI area, this study used the spatial autocorrelation characteristics of LST and the seasonal variation of vegetation, and selected the greenest image comprising pixels with the largest NDVI value, which proved effective in removing the influence of farmland on UHI extraction. Therefore, the comprehensive application of Getis-Ord-Gi* and the greenest image to extract UHI effects is extremely accurate.
Multiple error sources exist in the automatic extraction method of UHI that can reduce the accuracy of land satellite UHI effect extraction. The influence of clouds and rain results in fewer clear images in summer, increasing the uncertainty of the time-series analysis. During spatial autocorrelation, the process of converting hotspots into UHI regions can trigger certain issues. After converting the raster to polygons, removing small polygons with an area smaller than 1 km2 results in the loss of some fragmented, small UHI regions, thus reducing extraction accuracy [47,50]. In addition, pixel missing occurred in certain months in the southern part of Yichuan County and in the eastern part of Ruyang County. The LST inversion images in 2012 showed strip-shaped patterns, which may have caused bias in UHI identification and extraction. Additionally, the lack of ground-based observations for accuracy validation is notable. The method primarily relies on comparisons with other satellite-based products and approaches, which improves methodological credibility to some extent. Future research should incorporate a validation mechanism for NDVI thresholds to enable more precise extraction of urban heat island spatial distribution patterns. In addition, future analyses should integrate more potential factors such as surface albedo, building height, and canopy cover. Among these, shadows cast by tall buildings and tree canopies can reduce land surface temperatures in localized areas. These factors also play a significant role in enhancing thermal comfort, optimizing the urban microclimate, and improving energy efficiency.

5. Conclusions

We used the spatial autocorrelation characteristics of LST and seasonal changes in vegetation to extract precisely the spatial distribution range of UHI in Luoyang. Owing to the significant impact of bare land on the extraction results of UHI effects, this study utilized the greenest image from the GEE platform to remove this impact, thereby greatly improving UHI extraction accuracy. The UHI of Luoyang was continuously expanding outward from 2000 to 2023, and the growth rate of the UHI area in the urban area exceeded that in the county area. The UHI area and building area in Luoyang maintained a consistent growth trend, with intensive urban construction exacerbating the UHI effect. In particular, Luolong District and Yichuan County demonstrated the most pronounced expansion of the UHI effect. Overall, this study provided a high-precision automated method to map the spatial range of UHI, which demonstrates strong potential for generalization and application across other cities and climate zones. This enhances its value for broader urban climate studies and sustainable planning efforts.

Supplementary Materials

The following supporting information can be downloaded at: https://www.mdpi.com/article/10.3390/su17157155/s1, Table S1: All urban heat island extraction results.

Author Contributions

Conceptualization, D.Y.; methodology, D.Y., Y.Z. and Y.W.; software, D.Y., X.Z. and Y.W.; formal analysis, D.Y.; investigation, D.Y., Y.Z., P.S., X.Z., W.Z. and Q.D.; resources, Y.Z.; data curation, D.Y.; writing—original draft preparation, D.Y.; writing—review and editing, Y.Z., P.S., X.Z., Y.W., W.Z. and Q.D. All authors have read and agreed to the published version of the manuscript.

Funding

PhD Research Startup Foundation of Henan University of Science and Technology (grant no. 13480078); Natural Science Foundation of Henan Province (project no. 252300420841); Science and Technology Research Projects of Henan Province (project no. 242102110185) and National Agricultural Experimental Station for Agricultural Environment (project no. SQZ-2025-03).

Data Availability Statement

Data will be made available on request.

Acknowledgments

The authors sincerely thank the editor and reviewers for their valuable comments and suggestions, which significantly improved the manuscript. We also gratefully acknowledge the financial support from the Natural Science Foundation of Henan Province (project no. 252300420841), which was crucial in facilitating the experiments and preparing this paper.

Conflicts of Interest

The authors declare that they have no known competing financial interests or personal relationships that could have appeared to influence the work reported in this paper.

References

  1. Kabisch, N.; Remahne, F.; Ilsemann, C.; Fricke, L. The urban heat island under extreme heat conditions: A case study of Hannover, Germany. Sci. Rep. 2023, 13, 23017. [Google Scholar] [CrossRef] [PubMed]
  2. Qiao, Z.; Wu, C.; Zhao, D.; Xu, X.; Yang, J.; Feng, L.; Sun, Z.; Liu, L. Determining the boundary and probability of surface urban heat island footprint based on a logistic model. Remote Sens. 2019, 11, 1368. [Google Scholar] [CrossRef]
  3. Yin, C.; Yuan, M.; Lu, Y.; Huang, Y.; Liu, Y. Effects of urban form on the urban heat island effect based on spatial regression model. Sci. Total Environ. 2018, 634, 696–704. [Google Scholar] [CrossRef] [PubMed]
  4. Assaf, G.; Assaad, R.H. Modeling the impact of land use/land cover (LULC) factors on diurnal and nocturnal Urban Heat Island (UHI) intensities using spatial regression models. Urban Clim. 2024, 55, 101971. [Google Scholar] [CrossRef]
  5. Peng, J.; Ma, J.; Liu, Q.; Liu, Y.; Hu, Y.; Li, Y.; Yue, Y. Spatial-temporal change of land surface temperature across 285 cities in China: An urban-rural contrast perspective. Sci. Total Environ. 2018, 635, 487–497. [Google Scholar] [CrossRef]
  6. Yu, S.; Chen, Z.; Yu, B.; Wang, L.; Wu, B.; Wu, J.; Zhao, F. Exploring the relationship between 2D/3D landscape pattern and land surface temperature based on explainable extreme Gradient Boosting tree: A case study of Shanghai, China. Sci. Total Environ. 2020, 725, 138229. [Google Scholar] [CrossRef]
  7. Zhang, H.; Yin, Y.; An, H.; Lei, J.; Li, M.; Song, J.; Han, W. Surface urban heat island and its relationship with land cover change in five urban agglomerations in China based on GEE. Environ. Sci. Pollut. R. 2022, 29, 82271–82285. [Google Scholar] [CrossRef]
  8. Nwakaire, C.; Onn, C.; Yap, S.; Yuen, C.; Onodagu, P. Urban heat island studies with emphasis on urban pavements: A review. Sustain. Cities Soc. 2020, 63, 102476. [Google Scholar] [CrossRef]
  9. He, B.; Wang, J.; Liu, H.; Ulpiani, G. Localized synergies between heat waves and urban heat islands: Implications on human thermal comfort and urban heat management. Environ. Res. 2021, 193, 110584. [Google Scholar] [CrossRef]
  10. Liu, J.; Wang, J.; Chen, T.; Wang, L. Heat stress resilience assessment of urban form from physical space dimension: A case study of Guangdong-Hong Kong-Macao Greater Bay Area. Urban Clim. 2024, 55, 101905. [Google Scholar] [CrossRef]
  11. Wang, S.; Ma, Q.; Ding, H.; Liang, H. Detection of urban expansion and land surface temperature change using multi-temporal landsat images. Resour. Conserv. Recy. 2018, 128, 526–534. [Google Scholar] [CrossRef]
  12. Peng, J.; Jia, J.; Liu, Y.; Li, H.; Wu, J. Seasonal contrast of the dominant factors for spatial distribution of land surface temperature in urban areas. Remote Sens. Environ. 2018, 215, 255–267. [Google Scholar] [CrossRef]
  13. Chen, Y.; Shan, B.; Yu, X. Study on the spatial heterogeneity of urban heat islands and influencing factors. Build. Environ. 2022, 208, 108604. [Google Scholar] [CrossRef]
  14. Lee, K.; Kim, Y.; Sung, H.; Ryu, J.; Jeon, S. Trend analysis of urban heat island intensity according to urban area change in Asian mega cities. Sustainability 2020, 12, 112. [Google Scholar] [CrossRef]
  15. Ayanlade, A. Seasonality in the daytime and night-time intensity of land surface temperature in a tropical city area. Sci. Total Environ. 2016, 557, 415–424. [Google Scholar] [CrossRef]
  16. Baqa, M.; Lu, L.; Chen, F.; Nawaz-Ul-Huda, S.; Pan, L.; Tariq, A.; Qureshi, S.; Li, B.; Li, Q. Characterizing spatiotemporal variations in the urban thermal environment related to land cover changes in Karachi, Pakistan, from 2000 to 2020. Remote Sens. 2022, 14, 2164. [Google Scholar] [CrossRef]
  17. Cao, J.; Zhou, W.; Zheng, Z.; Ren, T.; Wang, W. Within-city spatial and temporal heterogeneity of air temperature and its relationship with land surface temperature. Landsc. Urban Plan. 2021, 206, 103979. [Google Scholar] [CrossRef]
  18. Liu, G.; Zhang, L.; He, B.; Jin, X.; Zhang, Q.; Razafindrabe, B.; You, H. Temporal changes in extreme high temperature, heat waves and relevant disasters in Nanjing metropolitan region, China. Nat. Hazards 2015, 76, 1415–1430. [Google Scholar] [CrossRef]
  19. Sun, F.; Liu, M.; Wang, Y.; Wang, H.; Che, Y. The effects of 3D architectural patterns on the urban surface temperature at a neighborhood scale: Relative contributions and marginal effects. J. Clean. Prod. 2020, 258, 120706. [Google Scholar] [CrossRef]
  20. Wang, Z. Reconceptualizing urban heat island: Beyond the urban-rural dichotomy. Sustain. Cities Soc. 2022, 77, 103581. [Google Scholar] [CrossRef]
  21. Chen, T.; Sun, A.; Niu, R. Effect of land cover fractions on changes in surface urban heat islands using Landsat time-series images. Int. J. Environ. Res. Public Health 2019, 16, 971. [Google Scholar] [CrossRef]
  22. Shen, H.; Huang, L.; Zhang, L.; Wu, P.; Zeng, C. Long-term and fine-scale satellite monitoring of the urban heat island effect by the fusion of multi-temporal and multi-sensor remote sensed data: A 26-year case study of the city of Wuhan in China. Remote Sens. Environ. 2016, 172, 109–125. [Google Scholar] [CrossRef]
  23. Zhou, D.; Zhang, L.; Li, D.; Huang, D.; Zhu, C. Climate-vegetation control on the diurnal and seasonal variations of surface urban heat islands in China. Environ. Res. Lett. 2016, 11, 74009. [Google Scholar] [CrossRef]
  24. Yao, R.; Wang, L.; Huang, X.; Niu, Y.; Chen, Y.; Niu, Z. The influence of different data and method on estimating the surface urban heat island intensity. Ecol. Indic. 2018, 89, 45–55. [Google Scholar] [CrossRef]
  25. Peng, S.; Piao, S.; Ciais, P.; Friedlingstein, P.; Ottle, C.; Breon, F.; Nan, L.; Zhou, L.; Myneni, R.B. Surface urban heat island across 419 global big cities. Environ. Sci. Technol. 2012, 46, 696–703. [Google Scholar] [CrossRef]
  26. Liu, Y.; Peng, J.; Wang, Y. Diversification of land surface temperature change under urban landscape renewal: A case study in the main city of Shenzhen, China. Remote Sens. 2017, 9, 919. [Google Scholar] [CrossRef]
  27. Pan, L.; Lu, L.; Fu, P.; Nitivattananon, V.; Guo, H.; Li, Q. Understanding spatiotemporal evolution of the surface urban heat island in the Bangkok metropolitan region from 2000 to 2020 using enhanced land surface temperature. Geomat. Nat. Hazards Risk 2023, 14, 2174904. [Google Scholar] [CrossRef]
  28. Zhang, J.; Lin, T.; Sun, C.; Lin, M.; Zhan, Y.; Chen, Y.; Ye, H.; Yao, X.; Huang, Y.; Zhang, G.; et al. Long-term spatiotemporal characteristics and impact factors of land surface temperature of inhabited islands with different urbanization levels. Remote Sens. 2022, 14, 4997. [Google Scholar] [CrossRef]
  29. Pan, J.H. Area delineation and spatial-temporal dynamics of urban heat island in Lanzhou city, China using remote sensing imagery. J. Indian Soc. Remote. 2016, 44, 111–127. [Google Scholar] [CrossRef]
  30. Mathew, A.; Sreekumar, S.; Khandelwal, S.; Kumar, R. Prediction of land surface temperatures for surface urban heat island assessment over Chandigarh city using support vector regression model. Sol. Energy 2019, 186, 404–415. [Google Scholar] [CrossRef]
  31. Herbel, I.; Croitoru, A.; Rus, A.; Rosca, C.; Harpa, G.; Ciupertea, A.; Rus, I. The impact of heat waves on surface urban heat island and local economy in Cluj-Napoca city, Romania. Theor. Appl. Climatol. 2018, 133, 681–695. [Google Scholar] [CrossRef]
  32. Chen, Y.; Wang, Y.; Zhou, D.; Gu, Z.; Meng, X. Summer urban heat island mitigation strategy development for high-anthropogenic-heat-emission blocks. Sustain. Cities Soc. 2022, 87, 104197. [Google Scholar] [CrossRef]
  33. Tian, P.; Li, J.; Cao, L.; Pu, R.; Wang, Z.; Zhang, H.; Chen, H.; Gong, H. Assessing spatiotemporal characteristics of urban heat islands from the perspective of an urban expansion and green infrastructure. Sustain. Cities Soc. 2021, 74, 103208. [Google Scholar] [CrossRef]
  34. Guo, A.; Yang, J.; Xiao, X.; Xia, J.; Jin, C.; Li, X. Influences of urban spatial form on urban heat island effects at the community level in China. Sustain. Cities Soc. 2020, 53, 101972. [Google Scholar] [CrossRef]
  35. Yu, X.; Guo, X.; Wu, Z. Land surface temperature retrieval from Landsat 8 TIRS-comparison between radiative transfer equation-based method, split window algorithm and single channel method. Remote Sens. 2014, 6, 9829–9852. [Google Scholar] [CrossRef]
  36. Wang, L.; Diao, C.; Xian, G.; Yin, D.; Lu, Y.; Zou, S.; Erickson, T. A summary of the special issue on remote sensing of land change science with Google earth engine. Remote Sens. Environ. 2020, 248, 112002. [Google Scholar] [CrossRef]
  37. Jia, M.; Mao, D.; Wang, Z.; Ren, C.; Zhu, Q.; Li, X.; Zhang, Y. Tracking long-term floodplain wetland changes: A case study in the China side of the Amur River Basin. Int. J. Appl. Earth Obs. 2020, 92, 102185. [Google Scholar] [CrossRef]
  38. Lou, P.; Fu, B.; He, H.; Gao, E.; Fan, D.; Tang, T.; Lin, X.; Bi, L. Quantitative remote sensing analysis of thermal environment changes in the main urban area of Guilin City based on GEE. J. Guilin Univ. Technol. 2020, 40, 330–337. [Google Scholar] [CrossRef]
  39. Gao, G. Research on Urban Heat Island Effect and Its Causes Supported by GEE. Master’s Thesis, Henan Polytechnic University, Jiaozuo, China, 2022. [Google Scholar]
  40. Wang, C.; Jia, M.; Chen, N.; Wang, W. Long-term surface water dynamics analysis based on Landsat imagery and the Google Earth Engine platform: A case study in the Middle Yangtze River Basin. Remote Sens. 2018, 10, 1635. [Google Scholar] [CrossRef]
  41. Yan, D.; Li, J.; Yao, X.; Luan, Z. Quantifying the long-term expansion and dieback of Spartina alterniflora using Google Earth Engine and object-based hierarchical random forest classification. IEEE J. Sel. Top. Appl. Earth Observ. Remote Sens. 2021, 14, 9781–9793. [Google Scholar] [CrossRef]
  42. Zheng, S.; Chen, X.; Liu, Y. Impact of urban renewal on urban heat island: Study of renewal processes and thermal effects. Sustain. Cities Soc. 2023, 99, 104995. [Google Scholar] [CrossRef]
  43. Xu, D.; Gao, J. Comparative analysis of land surface temperature and land cover based on geographically weighted regression. Appl. Ecol. Environ. Res. 2019, 17, 12623–12638. [Google Scholar] [CrossRef]
  44. Zhang, G.; Ding, Z.; Zhao, W. A study on technology integration of ecological environment protection among central plains urban agglomeration. Ecol. Econ. 2014, 30, 170–174. [Google Scholar]
  45. Dong, Z.; Sun, S.; Xia, C.; Zhou, C.; Zhao, J.; Zhang, W. The effect of “Ecological Restoration and Urban Repair” strategy on urban carbon emission. Acta Ecol. Sin. 2024, 44, 6142–6153. [Google Scholar] [CrossRef]
  46. Yang, J.; Huang, X. The 30 m annual land cover datasets and its dynamics in China from 1985 to 2023. Earth Syst. Sci. Data 2024, 13, 3907–3925. [Google Scholar] [CrossRef]
  47. Wang, H.; Xu, D.; Zhang, D.; Pu, Y.; Luan, Z. Shoreline dynamics of Chongming island and driving factor analysis based on Landsat images. Remote Sens. 2022, 14, 3305. [Google Scholar] [CrossRef]
  48. Wang, J.; Liu, H.; Peng, D.; Lv, Q.; Sun, Y.; Huang, H.; Liu, H. The county-scale economic spatial pattern and influencing factors of seven urban agglomerations in the Yellow River Basin-A study based on the integrated nighttime light data. Sustainability 2021, 13, 4220. [Google Scholar] [CrossRef]
  49. Tran, D.; Pla, F.; Latorre-Carmona, P.; Myint, S.; Gaetano, M.; Kieu, H. Characterizing the relationship between land use land cover change and land surface temperature. ISPRS J. Photogramm. 2017, 124, 119–132. [Google Scholar] [CrossRef]
  50. Na, N.; Xu, D.; Fang, W.; Pu, Y.; Liu, Y.; Wang, H. Automatic detection and dynamic analysis of urban heat islands based on Landsat images. Remote Sens. 2023, 15, 4006. [Google Scholar] [CrossRef]
  51. Bhuyan, U.; Zang, C.; Vicente-Serrano, S.; Menzel, A. Exploring relationships among tree-ring growth, climate variability, and seasonal leaf activity on varying timescales and spatial resolutions. Remote Sens. 2017, 9, 526. [Google Scholar] [CrossRef]
  52. Gutman, G.; Skakun, S.; Gitelson, A. Revisiting the use of red and near-infrared reflectances in vegetation studies and numerical climate models. Sci. Remote Sens. 2021, 4, 100025. [Google Scholar] [CrossRef]
  53. Liu, Y.; Peng, J.; Li, G.; Han, W.; Liu, L.; Guan, J.; Ju, X.; Zheng, J. Ecological environment assessment of Kurustai grassland based on GEE. Chin. J. Ecol. 2023, 42, 2776–2785. [Google Scholar] [CrossRef]
  54. Ermida, S.; Soares, P.; Mantas, V.; Göttsche, F.; Trigo, I. Google Earth Engine open-source code for land surface temperature estimation from the Landsat series. Remote Sens. 2020, 12, 1471. [Google Scholar] [CrossRef]
  55. Amani, M.; Ghorbanian, A.; Ahmadi, S.; Kakooei, M.; Moghimi, A.; Mirmazloumi, S.; Moghaddam, S.; Mahdavi, S.; Ghahremanloo, M.; Parsian, S.; et al. Google Earth Engine cloud computing platform for remote sensing big data applications: A comprehensive review. IEEE J.-STARS 2020, 13, 5326–5350. [Google Scholar] [CrossRef]
  56. Wang, M.; Zhang, Z.; Hu, T.; Wang, G.; He, G.; Zhang, Z.; Li, H.; Wu, Z.; Liu, X. An efficient framework for producing Landsat-based land surface temperature data using Google Earth Engine. IEEE J.-STARS 2020, 13, 4689–4701. [Google Scholar] [CrossRef]
  57. Chen, Q.; Yang, Y.; Xu, Z.; Lin, L.; Huang, S. Spatial distribution characteristics of thermal environment in Fuzhou New District based on RS and GIS. Adm. Tech. Environ. Monit. 2023, 4, 13–18. [Google Scholar] [CrossRef]
  58. Yin, J.; Liu, X.; Wang, H.; Huang, W.; Cai, E. Spatio-temporal variations of ecosystem service values in response to land use/cover change in Luoyang city. Front. Environ. Sci. 2022, 10, 984888. [Google Scholar] [CrossRef]
  59. Yin, S.; Liu, J.; Han, Z. Relationship between urban morphology and land surface temperature-A case study of Nanjing City. PLoS ONE 2022, 17, e0260205. [Google Scholar] [CrossRef]
  60. Wang, J.; Zhang, M.; Yang, X.; Zhu, M. Inversion Study of Urban Surface Temperature in Luoyang City Based on Landsat Images. Ind. Arch. 2024, 54, 30–38. [Google Scholar] [CrossRef]
  61. Tseliou, A.; Melas, E.; Mela, A.; Tsiros, I.; Zervas, E. The effect of green roofs and green facades in the pedestrian thermal comfort of a Mediterranean Urban Residential Area. Atmospheric 2023, 14, 1512. [Google Scholar] [CrossRef]
  62. De Cristo, E.; Evangelisti, L.; Barbaro, L.; Vollaro, R.; Asdrubali, F. A systematic review of green roofs’ thermal and energy performance in the Mediterranean Region. Energies 2025, 18, 2517. [Google Scholar] [CrossRef]
  63. Gorelick, N.; Hancher, M.; Dixon, M.; Ilyushchenko, S.; Thau, D.; Moore, R. Google Earth Engine: Planetary-scale geospatial analysis for everyone. Remote Sens. Environ. 2017, 202, 18–27. [Google Scholar] [CrossRef]
  64. Kumar, L.; Mutanga, O. Google Earth Engine applications since inception: Usage, trends, and potential. Remote Sens. 2018, 10, 1509. [Google Scholar] [CrossRef]
  65. Mutanga, O.; Kumar, L. Google Earth Engine applications. Remote Sens. 2019, 11, 591. [Google Scholar] [CrossRef]
  66. Zhang, Z.; Jia, S. Research on inversion and spatiotemporal variation analysis of surface temperature in Hangzhou based on GEE and Landsat8 data. Stand. Surv. Map. 2024, 40, 48–53. [Google Scholar] [CrossRef]
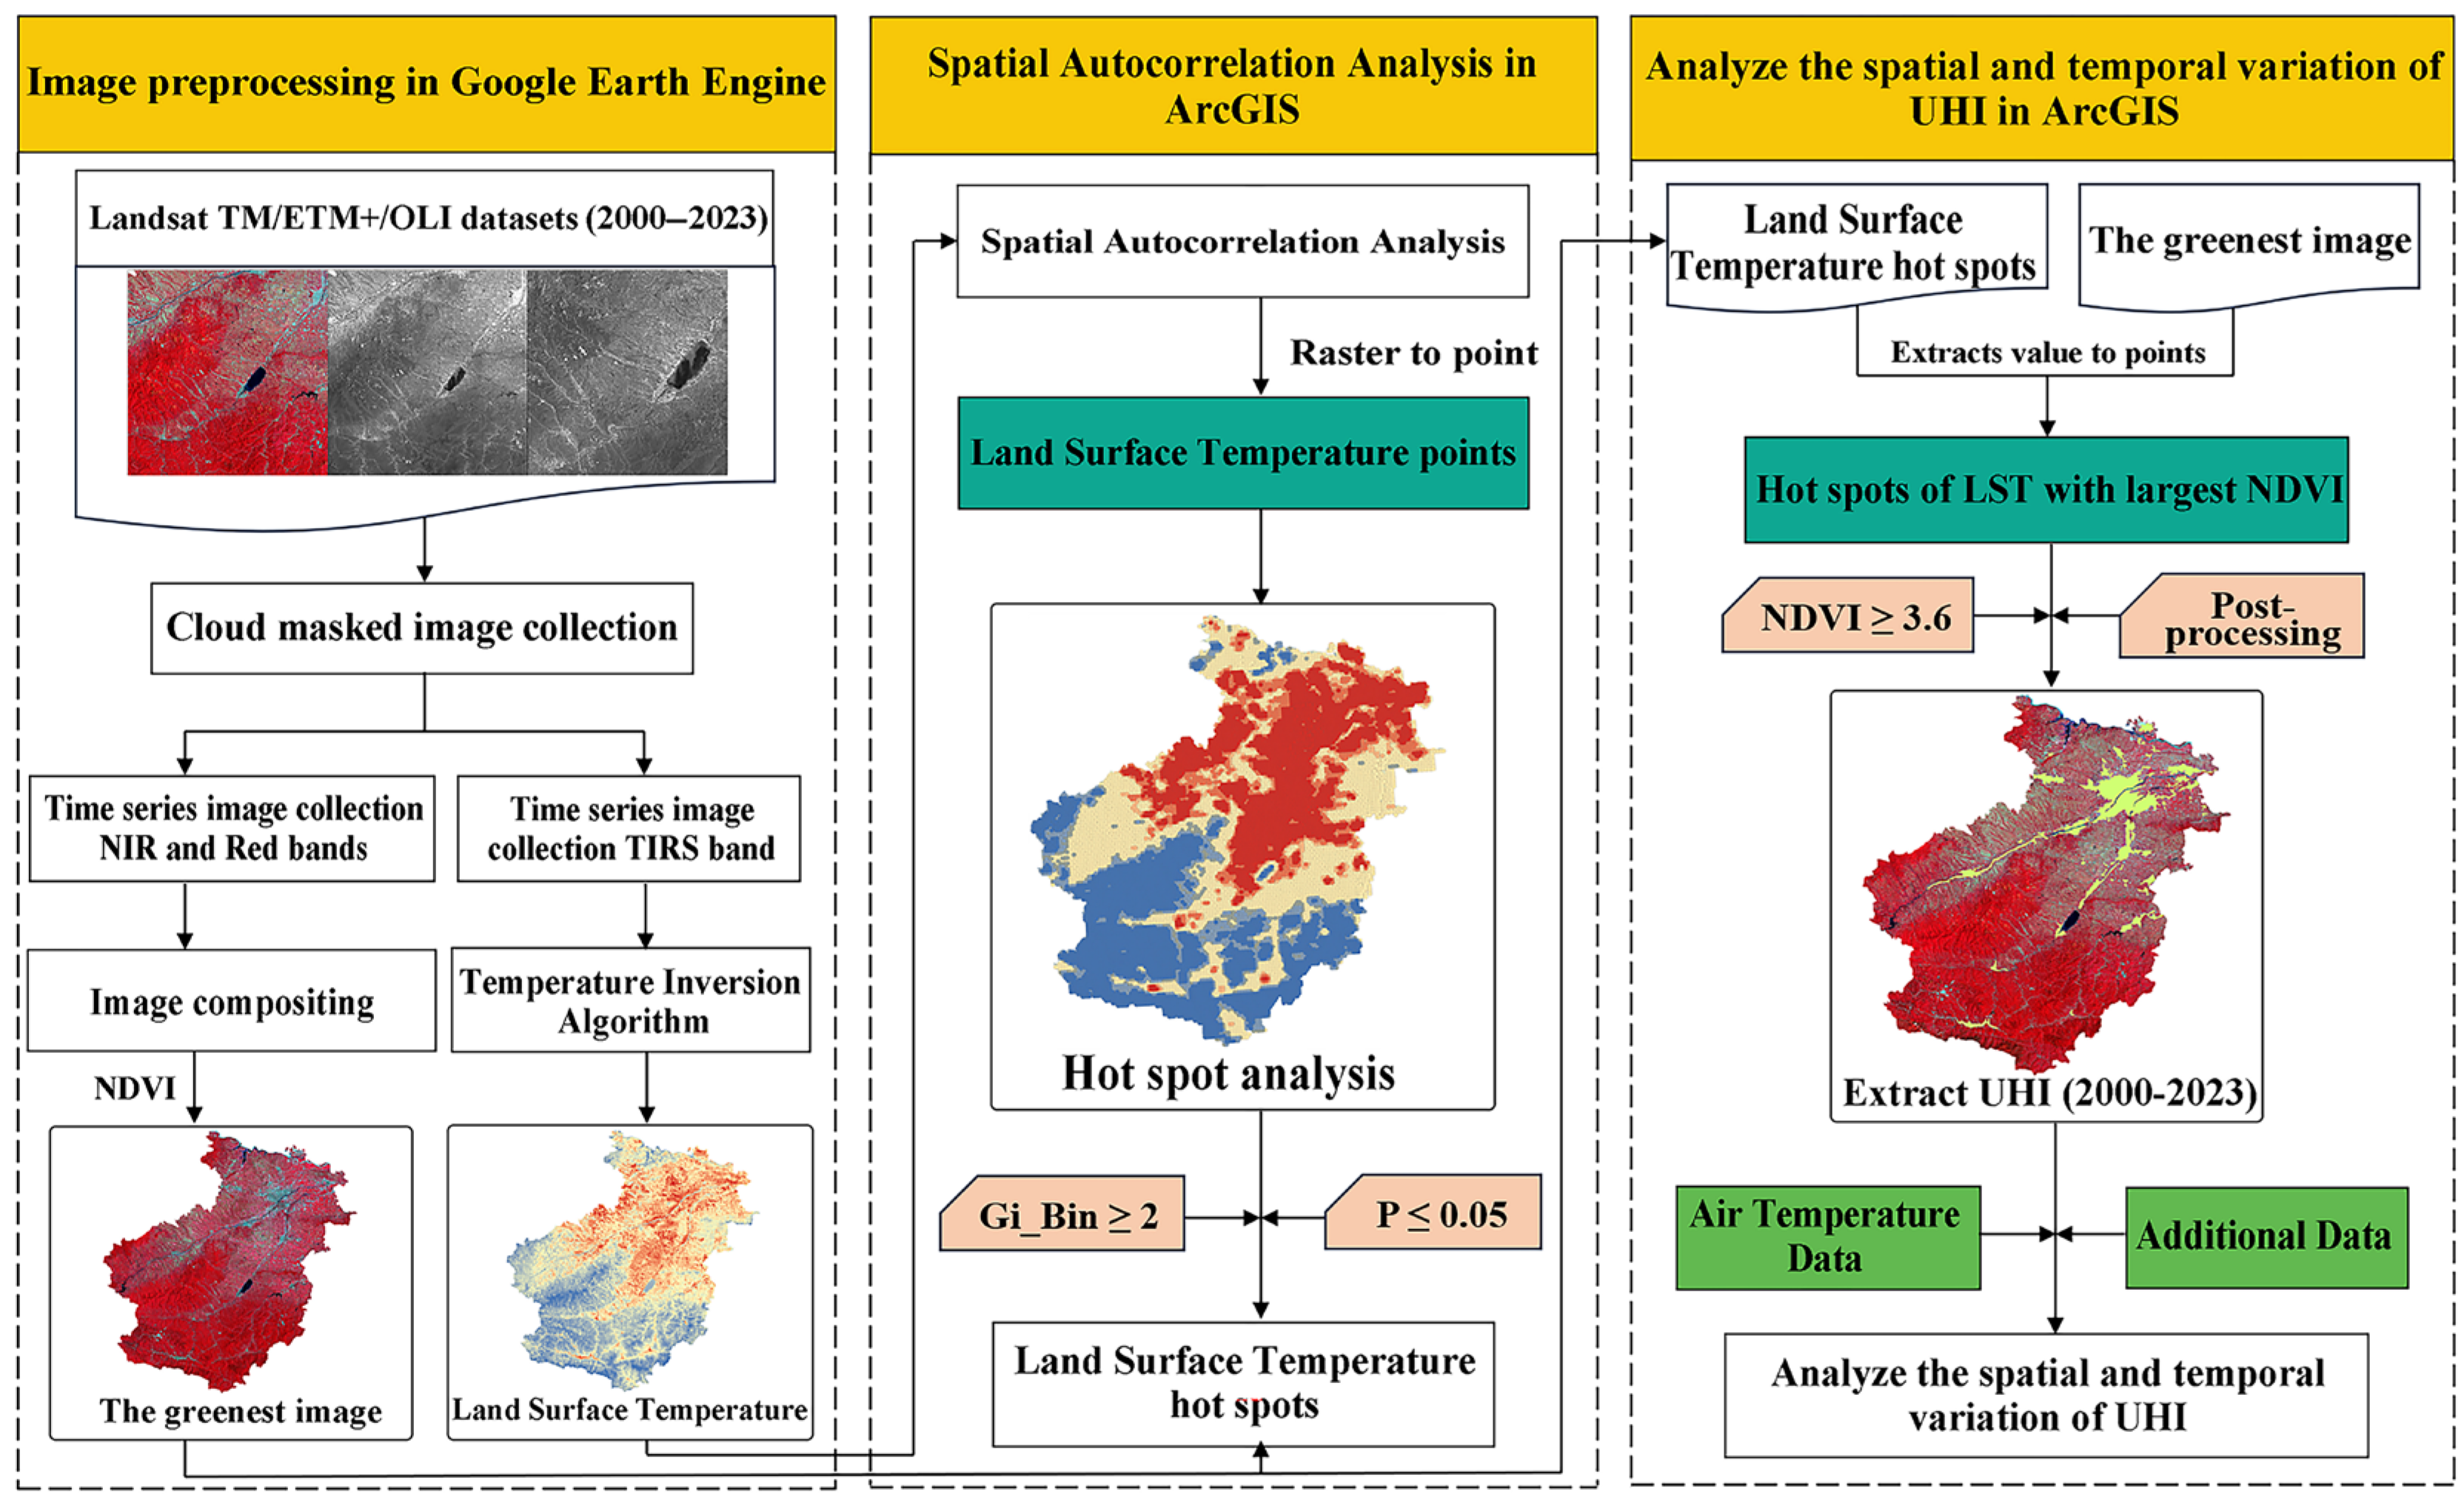
Figure 1. Workflow of extraction of the UHI area in Luoyang. (NDVI = normalized difference vegetation index; NIR = near-infrared band; TIRS = thermal infrared band; LST = land surface temperature; UHI = urban heat island).
Sustainability 17 07155 g001
Figure 2. Luoyang location. The background image is a Landsat OLI image acquired in 2023, displayed using a standard false color composition, where the near-infrared band is shown in red, the red band in green, and the green band in blue.
Sustainability 17 07155 g002
Figure 3. The annual number of Landsat images captured by different sensors and seasons from 2000 to 2023 are presented here; (a) the annual number of images obtained by the three sensors: TM, ETM+, and OLI; (b) the distribution of image numbers across the spring, summer, and autumn seasons.
Sustainability 17 07155 g003
Figure 4. (a) Land surface temperature distribution map of Luoyang in 2023; (b) hot spot distribution map of Luoyang in 2023; (c) the greenest image of Luoyang in 2023.
Sustainability 17 07155 g004
Figure 5. The extraction of UHI spatial distribution in Luoyang. Land surface temperature of Luoyang in 2007 (a) and 2018 (d), the preliminary findings of UHI spatial range in 2007 (b) and 2018 (e), and the extraction of UHI spatial distribution after excluding the influence of farmland in 2007 (c) and 2018 (f). The (b,c,e,f) panel backgrounds are Landsat images with standard false color composition, where the near-infrared band is shown in red, the red band in green, and the green band in blue).
Sustainability 17 07155 g005
Figure 6. Map of UHI distribution. The UHI distribution in Luoyang in 2004 (a), 2006 (b), 2007 (c), 2011 (d), 2013 (e), 2018 (f), 2021 (g), 2022 (h), and 2023 (i). Annual area change in UHI (j). Urban and county areas from 2000 to 2023 (k).
Sustainability 17 07155 g006
Figure 7. Expansion dynamics of UHI during 2000–2023 in Luoyang (a), Luolong District (b), and Yichuan County (c). The annual and multiyear average areas of UHI during 2000–2023 were modeled by linear regression in urban (d) and county (e). The annual areas of UHI during 2000–2023 were modeled by linear regression in Luolong District (f) and Yichuan County (g).
Sustainability 17 07155 g007
Figure 8. Land cover map of Luoyang in 2000 (a) and 2023 (b), and the trends of building area, GDP and population in Luoyang urban area (c) and county area (d).
Sustainability 17 07155 g008
Figure 9. Building area, GDP, and population of Luolong District (a). Building area, GDP, and population of Yichuan County (b).
Sustainability 17 07155 g009
Table 1. Pearson correlation analysis among urban UHI, urban building area, urban GDP and urban population.
U-UHIU-AreaU-GDPU-Population
U-UHI1
U-area0.988 **1
U-GDP0.834 **0.891 **1
U-population0.879 **0.921 **0.972 **1
** Indicates that the correlation is significant at a 0.01 level (two-tailed).
Table 2. Pearson correlation analysis among county UHI, county building area, county GDP and county population.
C-UHIC-AreaC-GDPC-Population
C-UHI1
C-area0.991 **1
C-GDP0.977 **0.967 **1
C-population0.1220.1670.0561
** Indicates that the correlation is significant at a 0.01 level (two-tailed).
Disclaimer/Publisher’s Note: The statements, opinions and data contained in all publications are solely those of the individual author(s) and contributor(s) and not of MDPI and/or the editor(s). MDPI and/or the editor(s) disclaim responsibility for any injury to people or property resulting from any ideas, methods, instructions or products referred to in the content.