
Exploring Key Factors Influencing ESG Commitment: Evidence from Taiwanese Listed Companies


Abstract
1. Introduction
1.1. Research Background and Motivation
1.2. Research Questions
2. Literature Review
2.1. ESG and Sustainable Development
2.2. ESG and Corporate Governance
2.3. ESG and Regulatory Pressure
2.4. ESG and Stakeholder Influence
2.5. ESG and Financial Performance
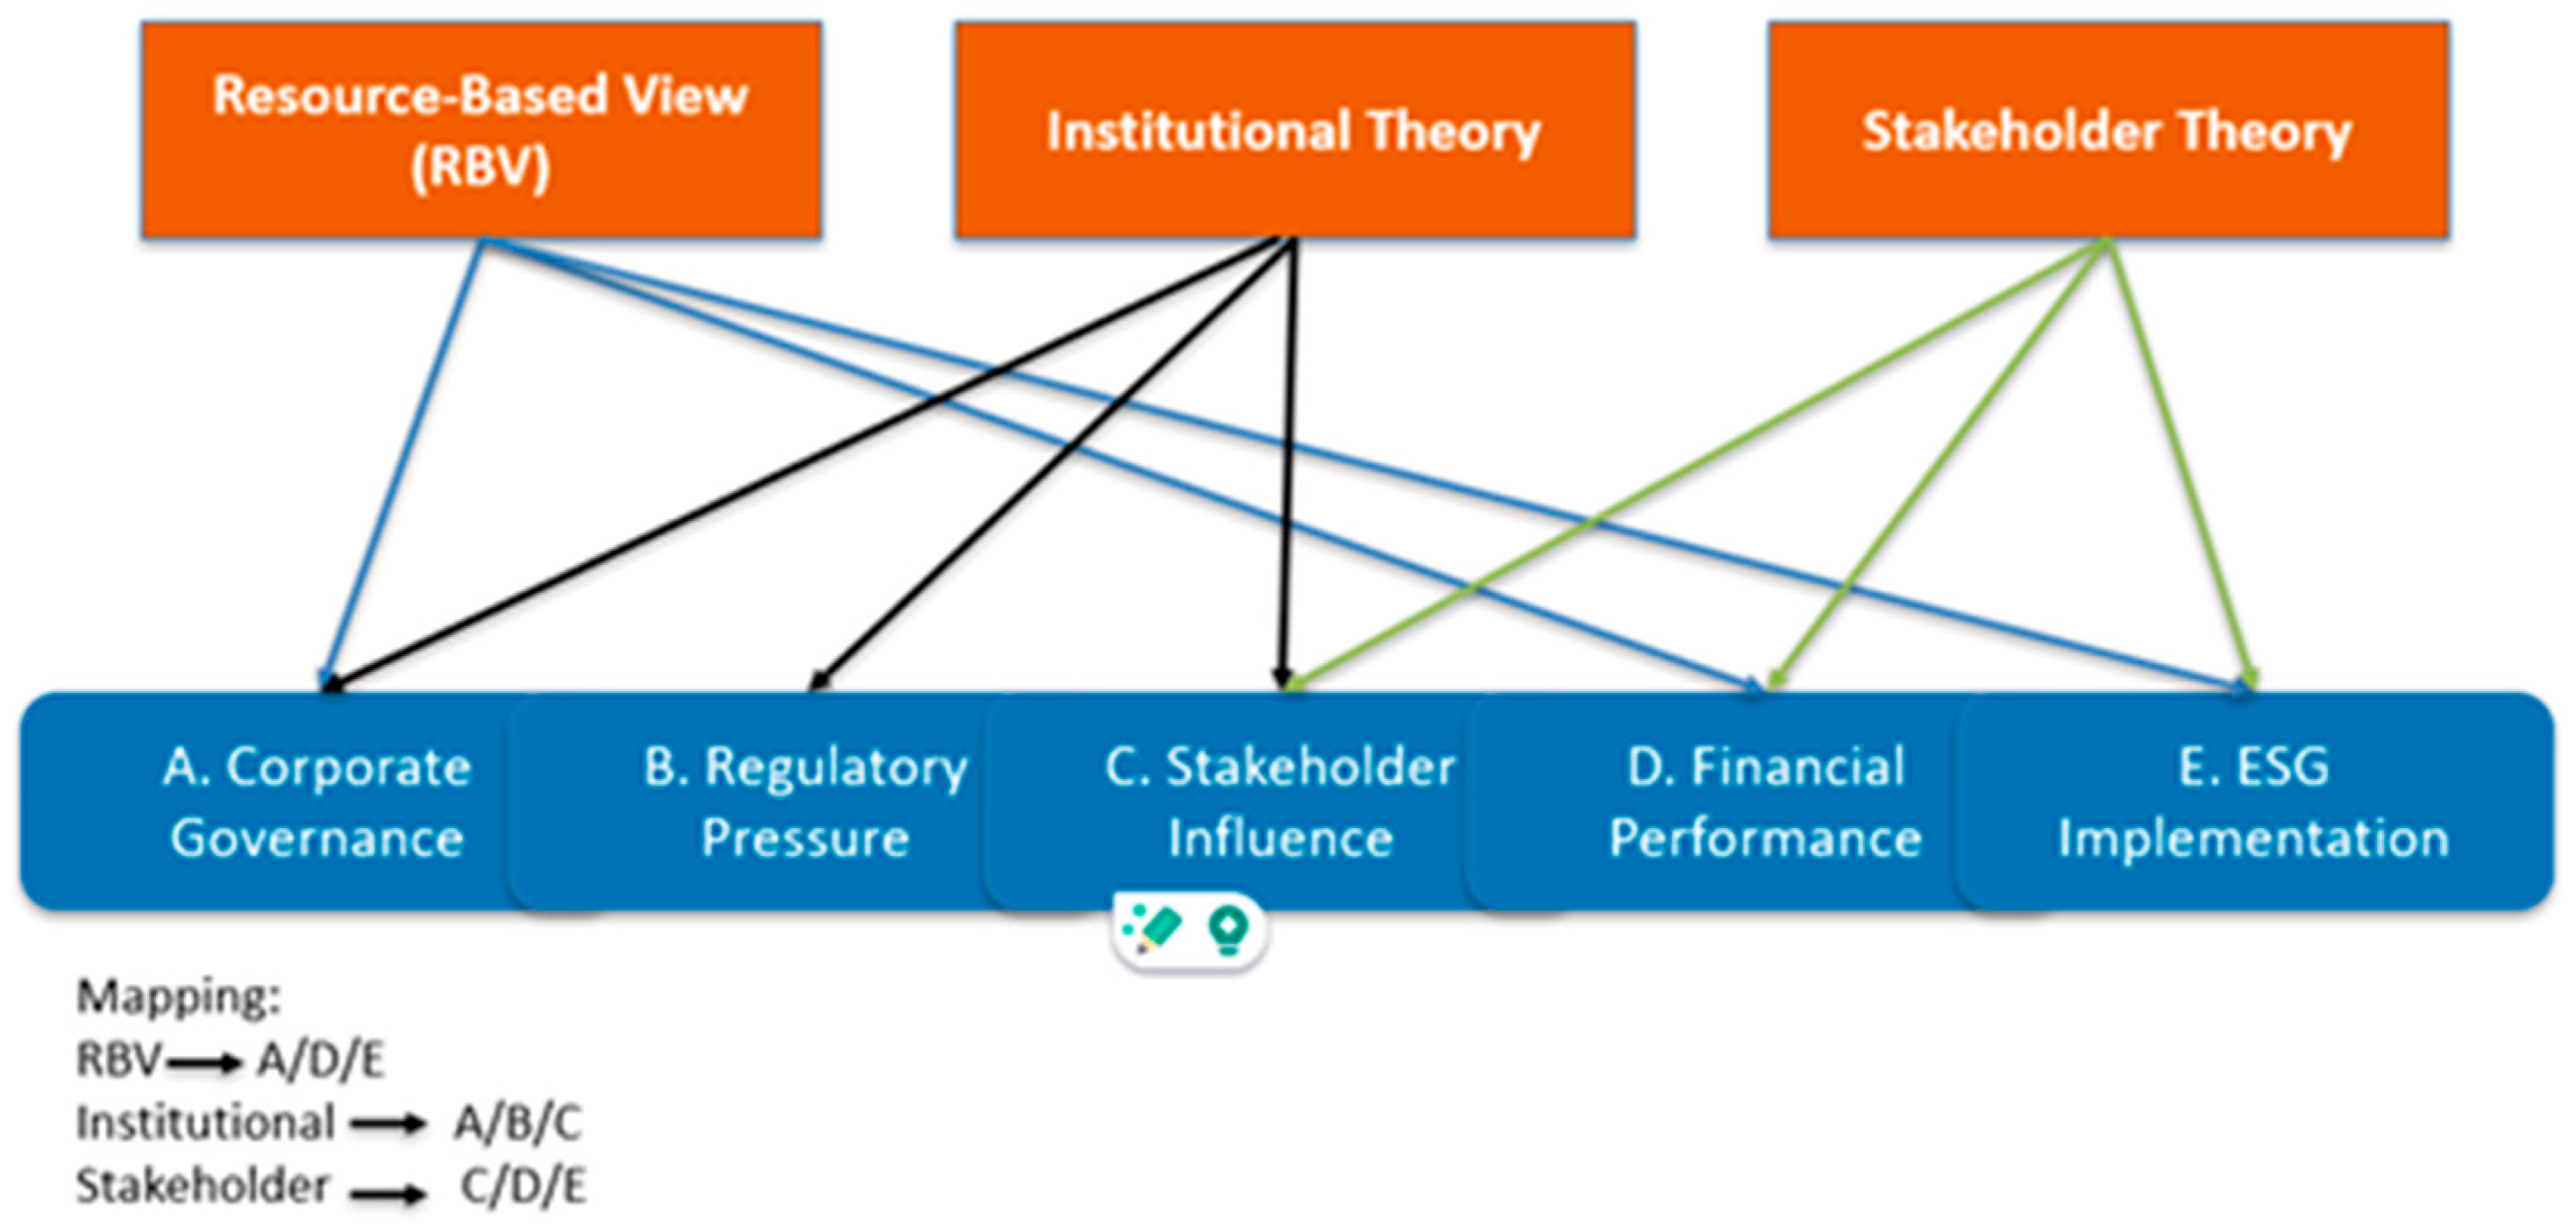
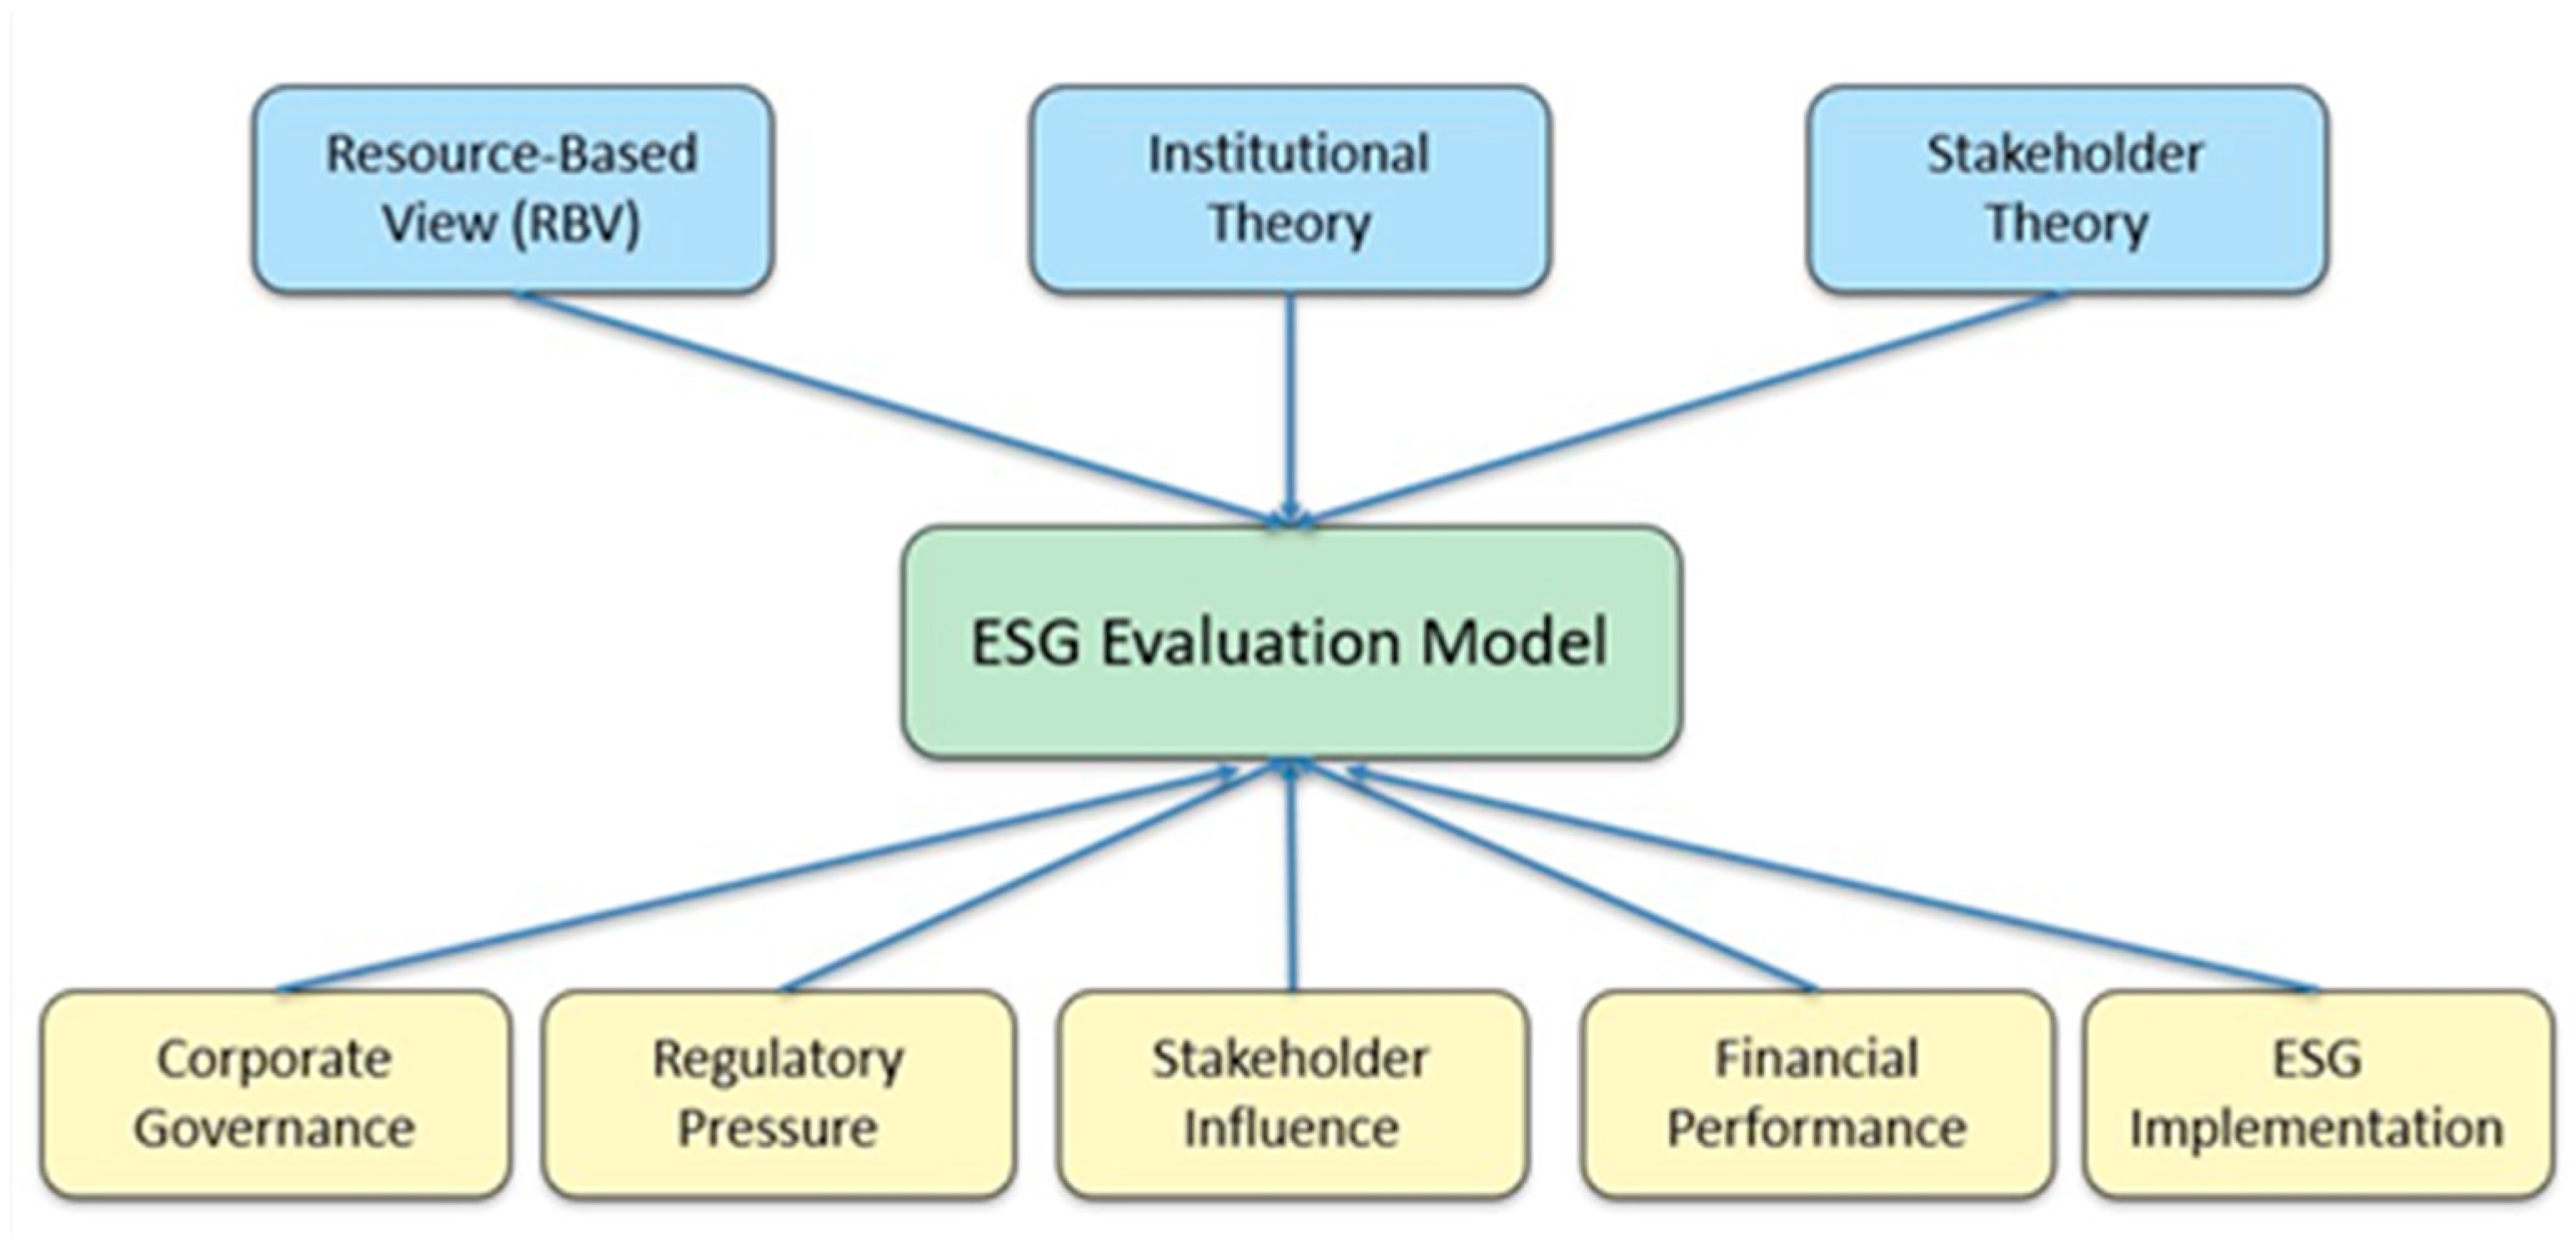
2.6. Theoretical Integration
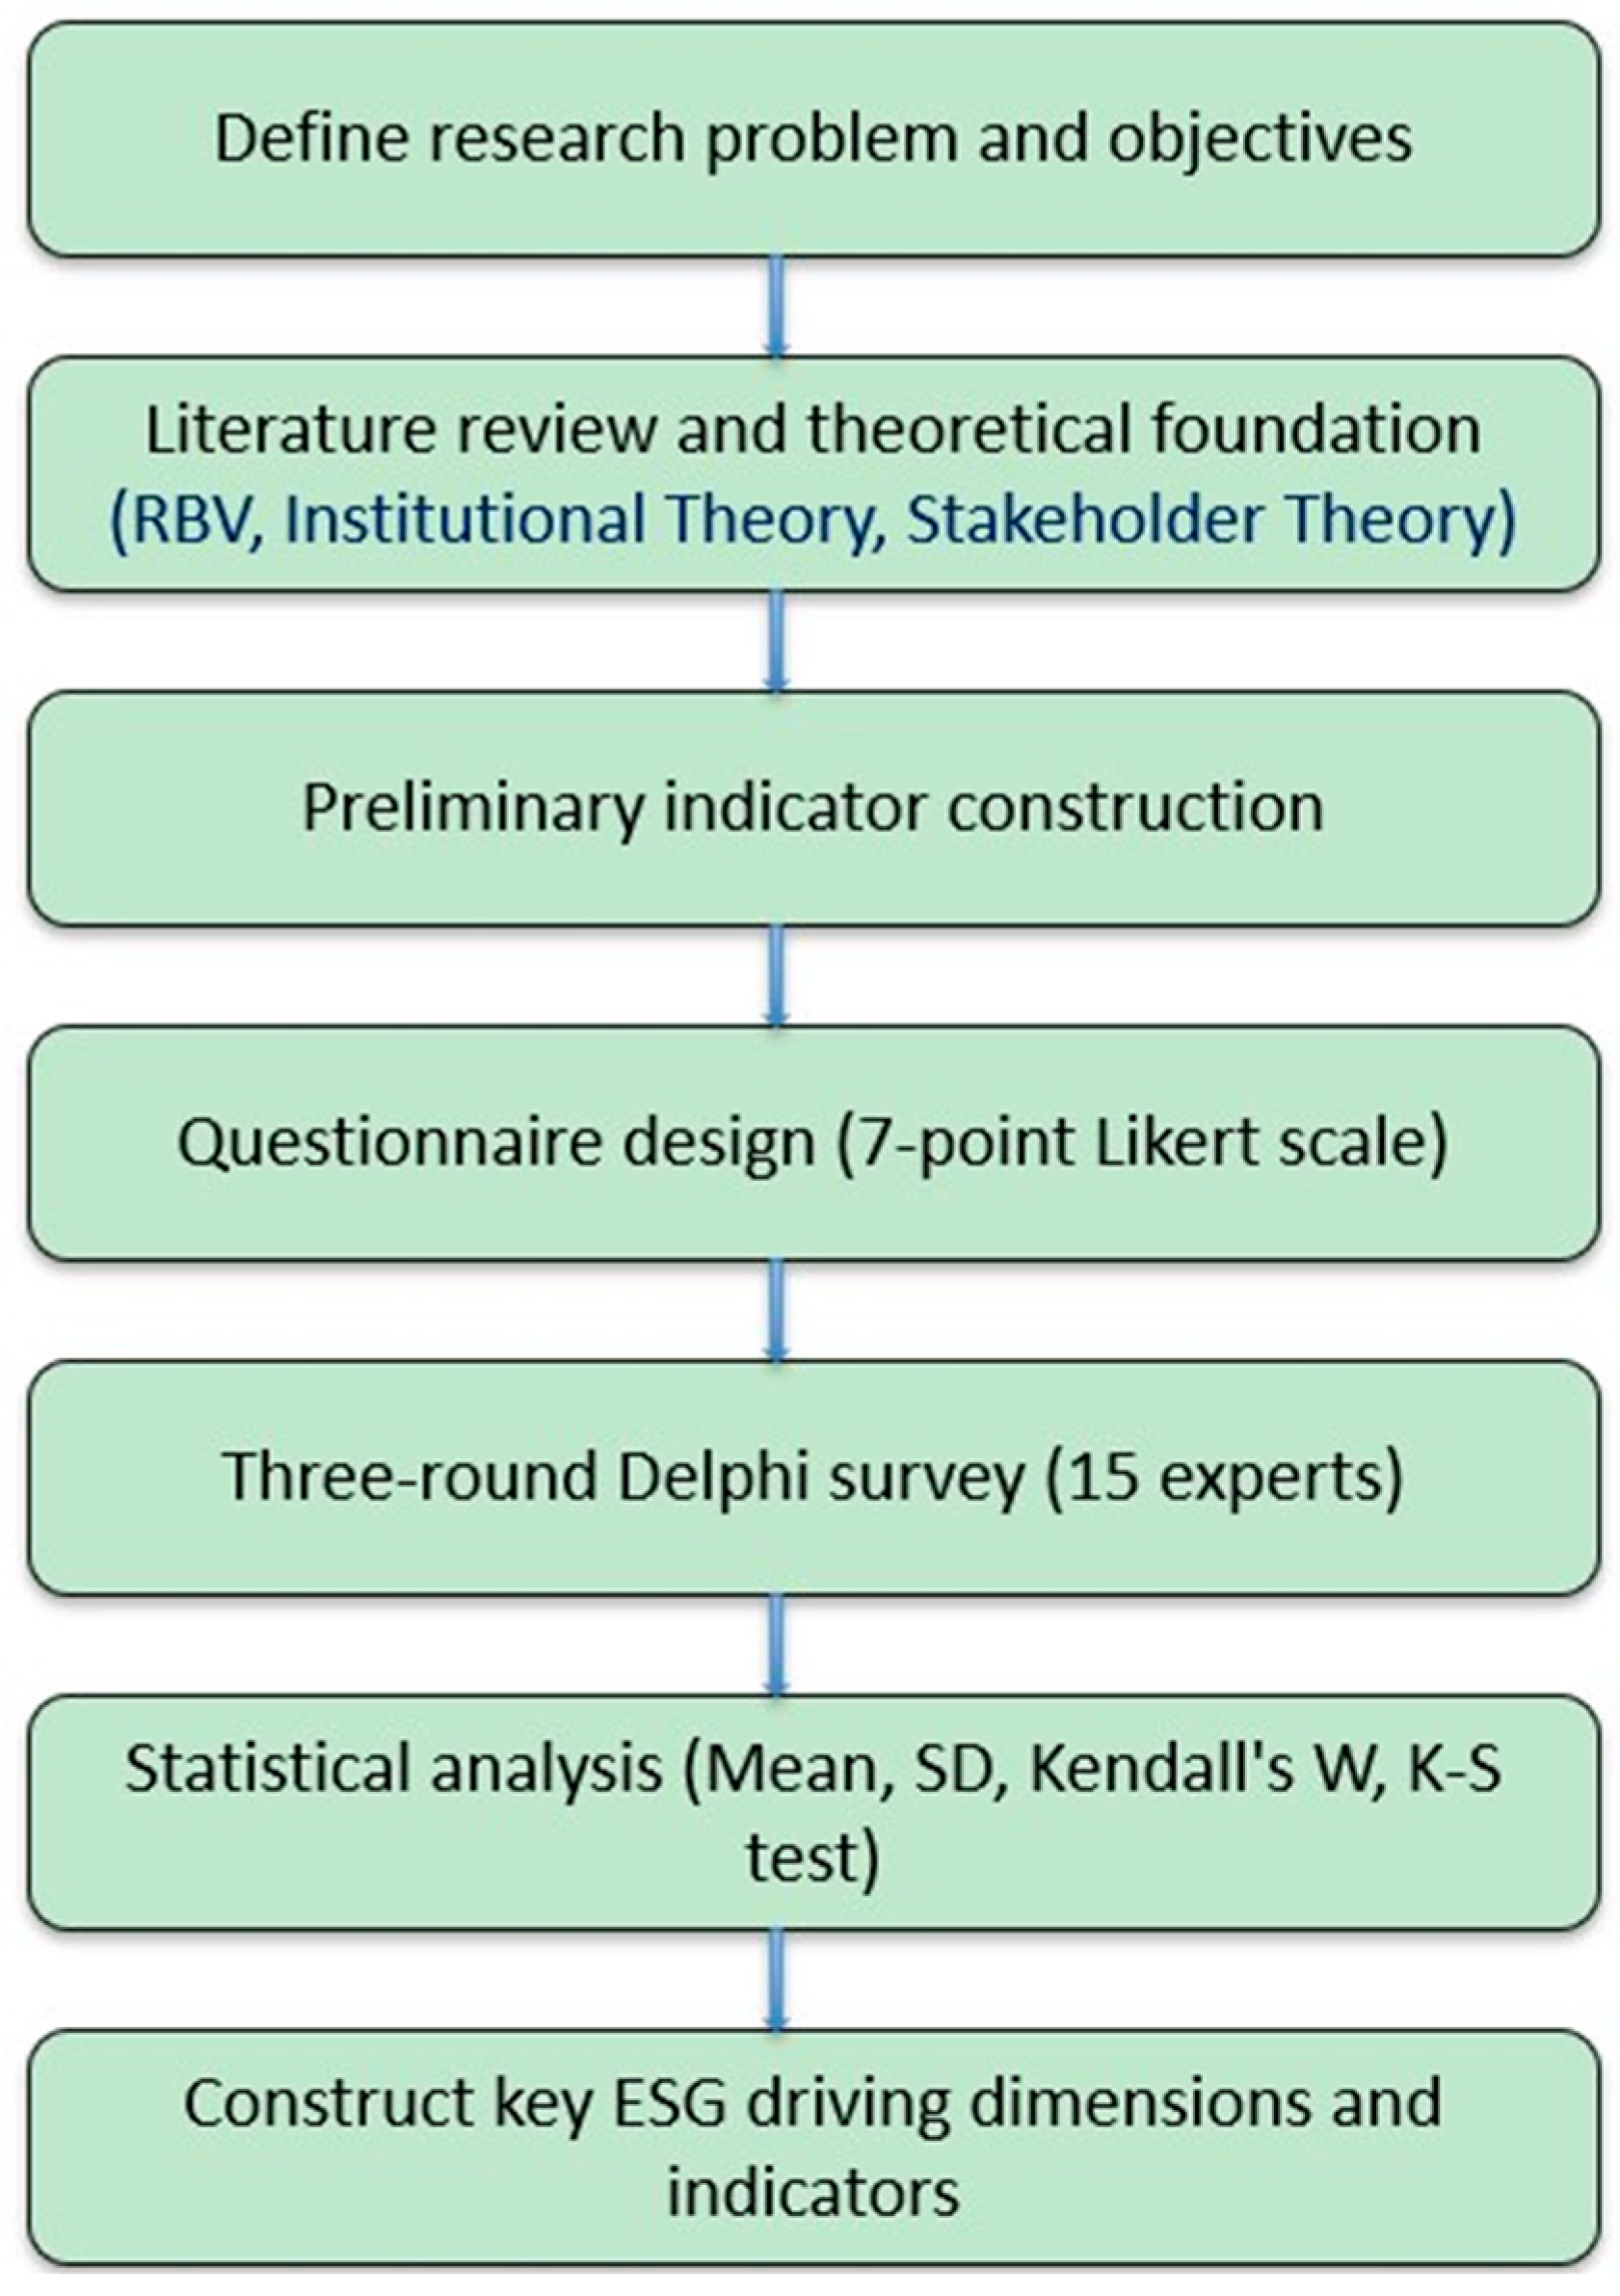
3. Methodology
3.1. Research Framework
- A. Corporate Governance—board structure, ESG oversight, incentives
- B. Regulatory Pressure—FSC and IFRS S1/S2 mandates, climate disclosure, compliance
- C. Stakeholder Influence—investor/customer expectations, supply chain
- D. Financial Performance—ESG returns, market value, credit
- E. ESG Implementation—decarbonization, action plans, integration
3.2. Research Design
- Questionnaire Design: A 7-point Likert scale questionnaire was pre-tested by five experts [33].
- Delphi Survey: Two rounds, involving 15 experts from academia, industry, and government, assessed the indicators [34].
- Framework Validation: Indicators were mapped to dimensions (Figure 2).
- Synthesis: Findings align with Taiwan’s ESG context [3].
3.3. Expert Selection
- (i)
- Sustainability Officers (N = 5): Senior managers from Taiwanese listed companies, with 3 holding doctoral degrees and 2 holding master’s degrees. Their average professional experience was approximately 12 years. Their expertise focused on corporate governance, supply chain management, and the implementation of ESG, GRI, IFRS, and CDP.
- (ii)
- ESG Consultants (N = 5): Experts from industrial consulting or sustainability advisory sectors. Four held doctoral degrees, and one had a master’s degree. Their average experience was approximately 15 years. Their specialties included constructing ESG metrics, conducting governance diagnostics, and providing guidance on ESG, GRI, IFRS, and CDP.
- (iii)
- Academic Scholars (N = 5): Professors and postdoctoral researchers affiliated with universities. All five held doctoral degrees and had an average of 13 years of academic experience. Their research focused on ESG frameworks, corporate governance, sustainability development, and supply chain responsibility.
3.4. Data Collection
3.5. Data Analysis
4. Results
4.1. Dimension-Level Analysis: Key Drivers of ESG Adoption
4.2. Sub-Indicator Validation
4.2.1. Key Sub-Indicators and Grey Areas
- (1)
- A5: ESG-Linked Executive Compensation (M = 5.800, SD = 0.775, p = 0.016 *)
- (2)
- C3: Supply Chain ESG Coordination (M = 6.130, SD = 0.743, p = 0.071)
- (3)
- B2 and B8: Regulatory Compliance and Disclosures (M = 6.800, SD = 0.414, p = 0.000 ***)
- (4)
- A8: Board Oversight (M = 6.200, SD = 0.561, p = 0.007) and E5: Performance Monitoring (M = 6.200, SD = 0.775, p = 0.016 *)
4.2.2. Research Contributions
4.3. Taiwan’s ESG Framework
4.3.1. Key Findings
- C3: Supply Chain ESG Coordination (M = 6.130, p = 0.071)
- A5: ESG-Linked Executive Compensation (M = 5.800, p = 0.016 *)
4.3.2. Implications
5. Discussion
5.1. Empirical Synthesis and Key Findings
- A5: Only 20% of firms connect ESG to executive bonuses, compared to 80% in the EU [5,13,14], highlighting governance gaps under RBV [11]. This gap indicates limited ESG-linked incentive mechanisms in Asia, as noted by Lin and Hsu [28]. The Organization for Economic Co-operation and Development OECD [37] similarly emphasizes that misalignment of incentives presents a regional barrier to the effectiveness of ESG across Asia-Pacific economies [39]. In particular, ref. [40] highlights that companies in emerging Asian markets often adopt ESG measures symbolically, with few connections to executive accountability, thereby undermining the strategic integration of ESG into corporate governance systems.
- C3: Over 80% of firms lack ESG supply chain systems, which contrasts with Japan’s 90% supplier compliance [4,6,37]. This mismatch reflects fragmented disclosure of supplier data and the compliance barriers [22]. Abedin et al. [39] note that Japan’s strong board oversight enhances supply chain ESG transparency; however, SMEs encounter challenges in data standardization, highlighting Taiwan’s C3 coordination gaps.
5.2. Practical Implications for Corporate ESG Strategy
- Corporate Governance (A): Firms should prioritize ESG-linked compensation (A5), aiming for a 40% adoption rate by 2030, benchmarking against the EU’s 80% rate [3,5,14]. TSMC’s plan to tie 20% of bonuses to ESG by 2025 sets a precedent [7]. Enhancing board risk oversight (A8) through ESG training aligns with the Resource-Based View (RBV), strengthening internal capabilities [11].
5.3. Theoretical Integration and Framework Recommendations
5.3.1. Recommendations Extensions for Evaluating
- Resource-Based View (RBV) [11]: Explains high performance in A2 (governance, M = 6.730) and D4 (financial reporting, M = 6.800), driven by internal capabilities. However, gaps in A5 (ESG-linked compensation, M = 5.800, 20% adoption vs. EU’s 80% [5,13,14]) and A8 (board oversight, M = 6.200) indicate weak governance systems, as evidenced by TSMC’s gradual A5 integration [7].
- Stakeholder Theory [9]: Applies to C3 (supply chain coordination, M = 6.130, p = 0.071, 80% of firms lack systems [6,14,37]) and E5 (performance monitoring, M = 6.200), where external pressures from buyers such as Apple expose coordination and tracking gaps [17]. Japan’s 90% supplier compliance serves as a benchmark [4]. Abedin et al. [39] further demonstrate that Japan’s governance-driven ESG disclosure strengthens supply chain coordination, offering a model for Taiwan to address C3 gaps.
5.3.2. Recommendations for Framework Extension
6. Conclusions
6.1. Summary of Contributions
- Empirical Validation:
- Contextual Insights:
- Theoretical Advancement:
- Practical Impact:
6.2. Research Limitations
6.3. Future Research Directions
- Compare Taiwan’s policy-driven ESG with Japan’s supply chain model (90% compliance), the EU’s governance (80% ESG pay), or Korea’s incentive-led approach, especially its impact on financial outcomes [4,5,23,37]. Abedin et al. (2023) suggest Japan’s board governance aids SME supply chain integration [39].
- Use NLP to analyze ESG disclosure quality (> 95% accuracy), integrating secondary data [37].
6.4. Final Remarks
Author Contributions
Funding
Institutional Review Board Statement
Informed Consent Statement
Data Availability Statement
Acknowledgments
Conflicts of Interest
Appendix A

| Dimension | Item | Description | Mean | SD | Z-Value | p-Value |
|---|---|---|---|---|---|---|
| A | A1 | Does a higher proportion of independent directors on the board improve the quality and transparency of decisions about ESG commitments? | 6.670 | 0.488 | 2.582 *** | 0.000 |
| A | A2 | Does establishing a dedicated ESG committee enhance corporate governance and commitment to ESG? | 6.730 | 0.458 | 2.840 *** | 0.000 |
| A | A3 | Does the transparent disclosure of governance information enhance stakeholder trust in ESG commitments? | 6.730 | 0.458 | 2.840 *** | 0.000 |
| A | A4 | Does an effective risk management system mitigate ESG-related operational and regulatory risks? | 6.400 | 0.632 | 1.807 ** | 0.003 |
| A | A5 | Does the inclusion of ESG commitments in executive compensation incentives encourage the implementation of ESG practices? | 5.800 | 0.775 | 1.549 * | 0.016 |
| A | A6 | Do clear ethical guidelines improve corporate ethical standards in ESG commitments? | 6.270 | 0.704 | 1.549 * | 0.016 |
| A | A7 | Does the implementation of anti-corruption policies enhance the credibility of corporate governance and commitment to ESG? | 6.270 | 0.594 | 1.678 ** | 0.007 |
| A | A8 | Do internal audit procedures effectively monitor compliance with ESG commitment policies? | 6.200 | 0.561 | 1.678 ** | 0.007 |
| B | B1 | Do compliance costs cause companies to prioritize ESG to avoid penalties? | 6.470 | 0.516 | 2.066 *** | 0.000 |
| B | B2 | Do standardized operational guidelines simplify corporate compliance with ESG commitment regulations? | 6.800 | 0.414 | 3.098 *** | 0.000 |
| B | B3 | Do mandatory ESG commitment disclosure requirements encourage companies to improve the quality of their ESG commitment reports? | 6.600 | 0.507 | 2.324 *** | 0.000 |
| B | B4 | Does the severity of regulatory penalties effectively motivate companies to enhance their commitment to ESG? | 6.330 | 0.724 | 1.807 ** | 0.003 |
| B | B5 | Does regulatory stability influence companies’ long-term commitment to ESG? | 6.730 | 0.458 | 2.840 *** | 0.000 |
| B | B6 | Does aligning with international ESG standards improve a corporation’s global compliance capabilities? | 6.330 | 0.724 | 1.807 ** | 0.003 |
| B | B7 | Do government incentives, such as tax exemptions, effectively reduce the costs associated with ESG commitments? | 6.600 | 0.632 | 2.582 *** | 0.000 |
| B | B8 | Does regulatory clarity ease corporate uncertainty in ESG compliance? | 6.800 | 0.414 | 3.098 *** | 0.000 |
| C | C1 | Do investors’ ESG commitment requirements force companies to enhance their ESG initiatives to attract capital? | 6.130 | 0.640 | 1.420 * | 0.035 |
| C | C2 | Do consumer expectations for products centered on ESG commitments motivate companies to improve their ESG practices? | 6.470 | 0.516 | 2.066 *** | 0.000 |
| C | C3 | Do ESG commitment requirements in the supply chain effectively foster collaboration on ESG commitments between both upstream and downstream companies? | 6.130 | 0.743 | 1.291 | 0.071 |
| C | C4 | Does participation by employees in ESG commitment programs enhance the corporate culture of ESG dedication and commitment? | 6.330 | 0.617 | 1.678 ** | 0.007 |
| C | C5 | Do strong relationships with local communities enhance corporate ESG social impact? | 6.530 | 0.516 | 2.066 *** | 0.000 |
| C | C6 | Does oversight from NGOs encourage companies to strengthen their ESG commitments? | 6.270 | 0.799 | 1.807 ** | 0.003 |
| C | C7 | Does media coverage of ESG commitments affect corporate adjustments to ESG strategies? | 6.400 | 0.632 | 1.807 ** | 0.003 |
| C | C8 | Do customer demands for products or services focused on ESG commitments drive innovation in corporate ESG practices? | 6.530 | 0.516 | 2.066 *** | 0.000 |
| D | D1 | Does ESG investing yield significant financial returns for companies? | 6.330 | 0.488 | 2.582 *** | 0.000 |
| D | D2 | Does the cost-benefit analysis of ESG commitment practices influence corporate decisions about ESG investment? | 6.470 | 0.516 | 2.066 *** | 0.000 |
| D | D3 | Does a commitment to ESG strengthen a company’s competitive advantage in the market? | 6.600 | 0.507 | 2.324 *** | 0.000 |
| D | D4 | Does technological innovation, such as energy-saving technologies, significantly enhance ESG financial and environmental benefits? | 6.800 | 0.414 | 3.098 *** | 0.000 |
| D | D5 | Does a commitment to ESG enhance corporate brand value and market recognition? | 6.530 | 0.516 | 2.066 *** | 0.000 |
| D | D6 | Is the commitment to ESG positively related to the stability or growth of corporate stock prices? | 6.530 | 0.516 | 2.066 *** | 0.000 |
| D | D7 | Do ESG commitment practices reduce corporate financing costs (e.g., green bonds)? | 6.270 | 0.594 | 1.678 ** | 0.007 |
| D | D8 | Do ESG commitment practices provide long-term financial advantages for companies? | 6.200 | 0.561 | 1.678 ** | 0.007 |
| E | E1 | Does implementing an environmental management system effectively reduce a corporation’s environmental impact? | 6.400 | 0.737 | 2.066 *** | 0.000 |
| E | E2 | Does the implementation of social responsibility projects enhance corporate social impact? | 6.330 | 0.816 | 2.066 *** | 0.000 |
| E | E3 | Does a robust governance structure promote comprehensive ESG commitment policies? | 6.330 | 0.724 | 1.807 ** | 0.003 |
| E | E4 | Does interdepartmental collaboration boost the integration and efficiency of ESG commitment practices? | 6.530 | 0.516 | 2.066 *** | 0.000 |
| E | E5 | Does integrating ESG commitment into core corporate strategies enhance long-term competitiveness in ESG commitment? | 6.200 | 0.775 | 1.549 * | 0.016 |
| E | E6 | Does assessing regular ESG commitments foster continuous improvement in corporations? | 6.400 | 0.737 | 2.066 *** | 0.000 |
| E | E7 | Do training programs focused on ESG commitments enhance awareness of ESG principles among employees and management? | 6.330 | 0.724 | 1.807 ** | 0.003 |
| E | E8 | Do continuous improvement mechanisms ensure long-term progress in corporate ESG commitment practices? | 6.470 | 0.516 | 2.066 *** | 0.000 |
References
- Kotsantonis, S.; Pinney, C.; Serafeim, G. ESG integration in investment management: Myths and realities. J. Appl. Corp. Financ. 2016, 28, 10–16. [Google Scholar] [CrossRef]
- International Sustainability Standards Board. IFRS S1 and S2 Sustainability Disclosure Standards. 2023. Available online: https://www.ifrs.org/issued-standards/ifrs-sustainability-standards-navigator (accessed on 2 June 2025).
- Financial Supervisory Commission. Green Finance Action Plan 2.0. 2022. 2023. Available online: https://www.fsc.gov.tw/en/ (accessed on 2 June 2025).
- Sony Corporation. Corporate Sustainability Report 2024. Available online: https://www.sony.com/en/SonyInfo/csr_report/ (accessed on 2 June 2025).
- European Commission. Corporate Sustainability Due Diligence Directive (CSDDD). 2024. Available online: https://commission.europa.eu/business-economy-euro/doing-business-eu/sustainability-due-diligence-responsible-business/corporate-sustainability-due-diligence_en (accessed on 2 June 2025).
- Ministry of Economic Affairs. Taiwan’s Pathway to Net-Zero Emissions by 2050. 2023. Available online: https://www.moea.gov.tw/MNS/english/Policy/NetZero.aspx (accessed on 2 June 2025).
- Taiwan Semiconductor Manufacturing Company. 2023 Sustainability Report. 2023. Available online: https://esg.tsmc.com/en-US/resources/ESG-data-hub?tab=reports-documents (accessed on 2 June 2025).
- Lin, W.L.; Cheah, J.-H.; Azali, M.; Ho, J.A.; Yip, N. Does firm size matter? Evidence on the impact of ESG performance on financial performance. J. Bus. Res. 2018, 91, 78–89. [Google Scholar] [CrossRef]
- Freeman, R.E. Strategic Management: A Stakeholder Approach; Cambridge University Press: Cambridge, UK, 2010. [Google Scholar] [CrossRef]
- DiMaggio, P.J.; Powell, W.W. The iron cage revisited: Institutional isomorphism and collective rationality in organizational fields. Am. Sociol. Rev. 1983, 48, 147–160. [Google Scholar] [CrossRef]
- Barney, J. Firm resources and sustained competitive advantage. J. Manag. 1991, 17, 99–120. [Google Scholar] [CrossRef]
- Global Reporting Initiative. GRI Standards. 2021. Available online: https://www.globalreporting.org (accessed on 2 June 2025).
- Financial Supervisory Commission. Corporate Governance Roadmap. 2023. Available online: https://www.fsc.gov.tw/en/index.jsp (accessed on 2 June 2025).
- Pham, V.L.; Ho, Y.-H. Independent Board Members and Financial Performance: ESG Mediation in Taiwan. Sustainability 2024, 16, 6836. [Google Scholar] [CrossRef]
- Eccles, R.G.; Ioannou, I.; Serafeim, G. The impact of corporate sustainability on organizational processes and performance. Manag. Sci. 2014, 60, 2835–2857. [Google Scholar] [CrossRef]
- Tan, Y.; Zhu, Z. The effect of ESG rating events on corporate green innovation in China: The mediating role of financial constraints and managers’ environmental awareness. Technol. Soc. 2022, 68, 101906. [Google Scholar] [CrossRef]
- Apple Inc. Environmental Progress Report. 2023. Available online: https://www.apple.com/environment/pdf/Apple_Environmental_Progress_Report_2025.pdf (accessed on 2 June 2025).
- Singapore Exchange. Sustainability Reporting Guide. 2023. Available online: https://www.sgx.com/sustainable-finance/sustainability-reporting (accessed on 2 June 2025).
- Mitchell, R.K.; Agle, B.R.; Wood, D.J. Toward a theory of stakeholder identification and salience: Defining the principles of who and what really counts. Acad. Manag. Rev. 1997, 22, 853–886. [Google Scholar] [CrossRef]
- Bui, T.H.; Nguyen, T.L.; Phan, T.H. Corporate social responsibility and firm value: The mediating role of financial performance. Int. J. Bus. Soc. 2021, 22, 623–639. [Google Scholar]
- Friede, G.; Busch, T.; Bassen, A. ESG and Financial Performance: Aggregated Evidence from more than 2000 Empirical Studies. J. Sustain. Financ. Investig. 2015, 5, 210–233. [Google Scholar] [CrossRef]
- Huang, C.-J.; Kung, F.-H. Environmental consciousness and corporate performance: Evidence from Taiwan’s electronics industry. Sustainability 2019, 11, 1587. [Google Scholar] [CrossRef]
- Delta Electronics. 2022 ESG Report. 2023. Available online: https://www.deltaww.com/en-US/Investors/Governance (accessed on 2 June 2025).
- Kim, D.; Shin, D.; Lee, J.; Noh, G. Sustainability from institutionalism: Determinants of Korean companies’ ESG performances. Asian Bus. Manag. 2024, 23, 393–425. [Google Scholar] [CrossRef]
- Hussain, N.; Rigoni, U.; Cavezzali, E. Does it pay to be sustainable? Evidence from European banks. Bus. Strategy Environ. 2024, 33, 34–45. [Google Scholar] [CrossRef]
- Guchhait, R.; Sarkar, B. Increasing growth of renewable energy: A state of art. Energies 2023, 16, 2665. [Google Scholar] [CrossRef]
- Nguyen, T.H.; Truong, Q.T. Corporate social responsibility and financial performance: Evidence from Vietnam. J. Asian Financ. Econ. Bus. 2021, 8, 97–106. [Google Scholar]
- Responsible Investor. Major ESG Data Providers Adopt Japanese Code of Conduct. 2023. Available online: https://www.responsible-investor.com/major-esg-data-providers-adopt-japanese-code-of-conduct/ (accessed on 2 June 2025).
- Dyck, A.; Lins, K.V.; Roth, L.; Wagner, H.F. Do institutional investors drive corporate social responsibility? International evidence. J. Financ. Econ. 2019, 131, 693–701. [Google Scholar] [CrossRef]
- Skadden, Arps, Slate, Meagher & Flom LLP. ESG: A Review of 2024 and Key Trends To Look for in 2025. Available online: https://www.skadden.com/-/media/files/publications/2025/01/esg-a-review-of-2024-and-key-trends-to-look-for-in-2025/esg_a_review_of_2024_and_key_trends_to_look_for_in_2025.pdf (accessed on 2 June 2025).
- Okoli, C.; Pawlowski, S.D. The Delphi method as a research tool: An example, design considerations and applications. Inform.Manag. 2004, 42, 15–29. [Google Scholar] [CrossRef]
- Hsu, C.-C.; Sandford, B.A. The Delphi technique: Making sense of consensus. Pract. Assess. Res. Eval. 2007, 12, 10. [Google Scholar] [CrossRef]
- Dalkey, N.; Helmer, O. An experimental application of the Delphi method to the use of experts. Manag. Sci. 1963, 9, 458–467. [Google Scholar] [CrossRef]
- Ghasemi, A.; Zahediasl, S. Normality tests for statistical analysis: A guide for non-statisticians. Int. J. Endocrinol. Metab. 2012, 10, 486–489. [Google Scholar] [CrossRef]
- Linstone, H.A.; Turoff, M. The Delphi Method: Techniques and Applications. New Jersey Institute of Technology. 2002. Available online: https://is.njit.edu/sites/is/files/DelphiBook.pdf (accessed on 2 June 2025).
- Zhang, Y.; Wang, Z. Corporate governance and ESG performance: Evidence from Taiwanese firms. Sustainability 2024, 16, 1273. [Google Scholar] [CrossRef]
- OECD. Sustainable Finance in Asia: ESG and Climate-Aligned Investing and Policy Considerations. OECD Publishing. 2023. Available online: https://www.oecd.org/content/dam/oecd/en/publications/reports/2023/07/sustainable-finance-in-asia-esg-and-climatealigned-investing-and-policy-considerations_a04a0f33/bde9ec0d-en.pdf (accessed on 2 June 2025).
- Global Reporting Initiative (GRI). Global Sustainability Standards Board. 2025. Available online: https://www.globalreporting.org/about-gri/governance/global-sustainability-standards-board/ (accessed on 2 June 2025).
- Abedin, S.H.; Subha, S.; Anwar, M.; Kabir, M.N.; Tahat, Y.A.; Hossain, M. Environmental performance and corporate governance: Evidence from Japan. Sustainability 2023, 15, 3273. [Google Scholar] [CrossRef]
- de Almeida Barbosa Franco, J.; Franco Junior, A.; Battistelle, R.A.G.; Bezerra, B.S. Dynamic capabilities: Unveiling key resources for environmental sustainability, economic sustainability, and corporate social responsibility towards sustainable development goals. Resources 2024, 13, 22. [Google Scholar] [CrossRef]
- Ülgen, V.S.; Björklund, M.; Simm, N.; Forslund, H. Inter-organizational supply chain interaction for sustainability: A systematic literature review. Sustainability 2019, 11, 5488. [Google Scholar] [CrossRef]
- Araújo Gomes da Silva, A.C.; Teixeira Junior, G.; de Campos, L.M.C.; Bulcão-Neto, R.F.; Graciano Neto, V.V. Systems-of-systems for environmental sustainability: A systematic mapping study. arXiv 2025, arXiv:2502.20021, 20021. [Google Scholar]
- United Nations. Transforming Our World: The 2030 Agenda for Sustainable Development. 2015. Available online: https://sdgs.un.org/2030agenda (accessed on 2 June 2025).
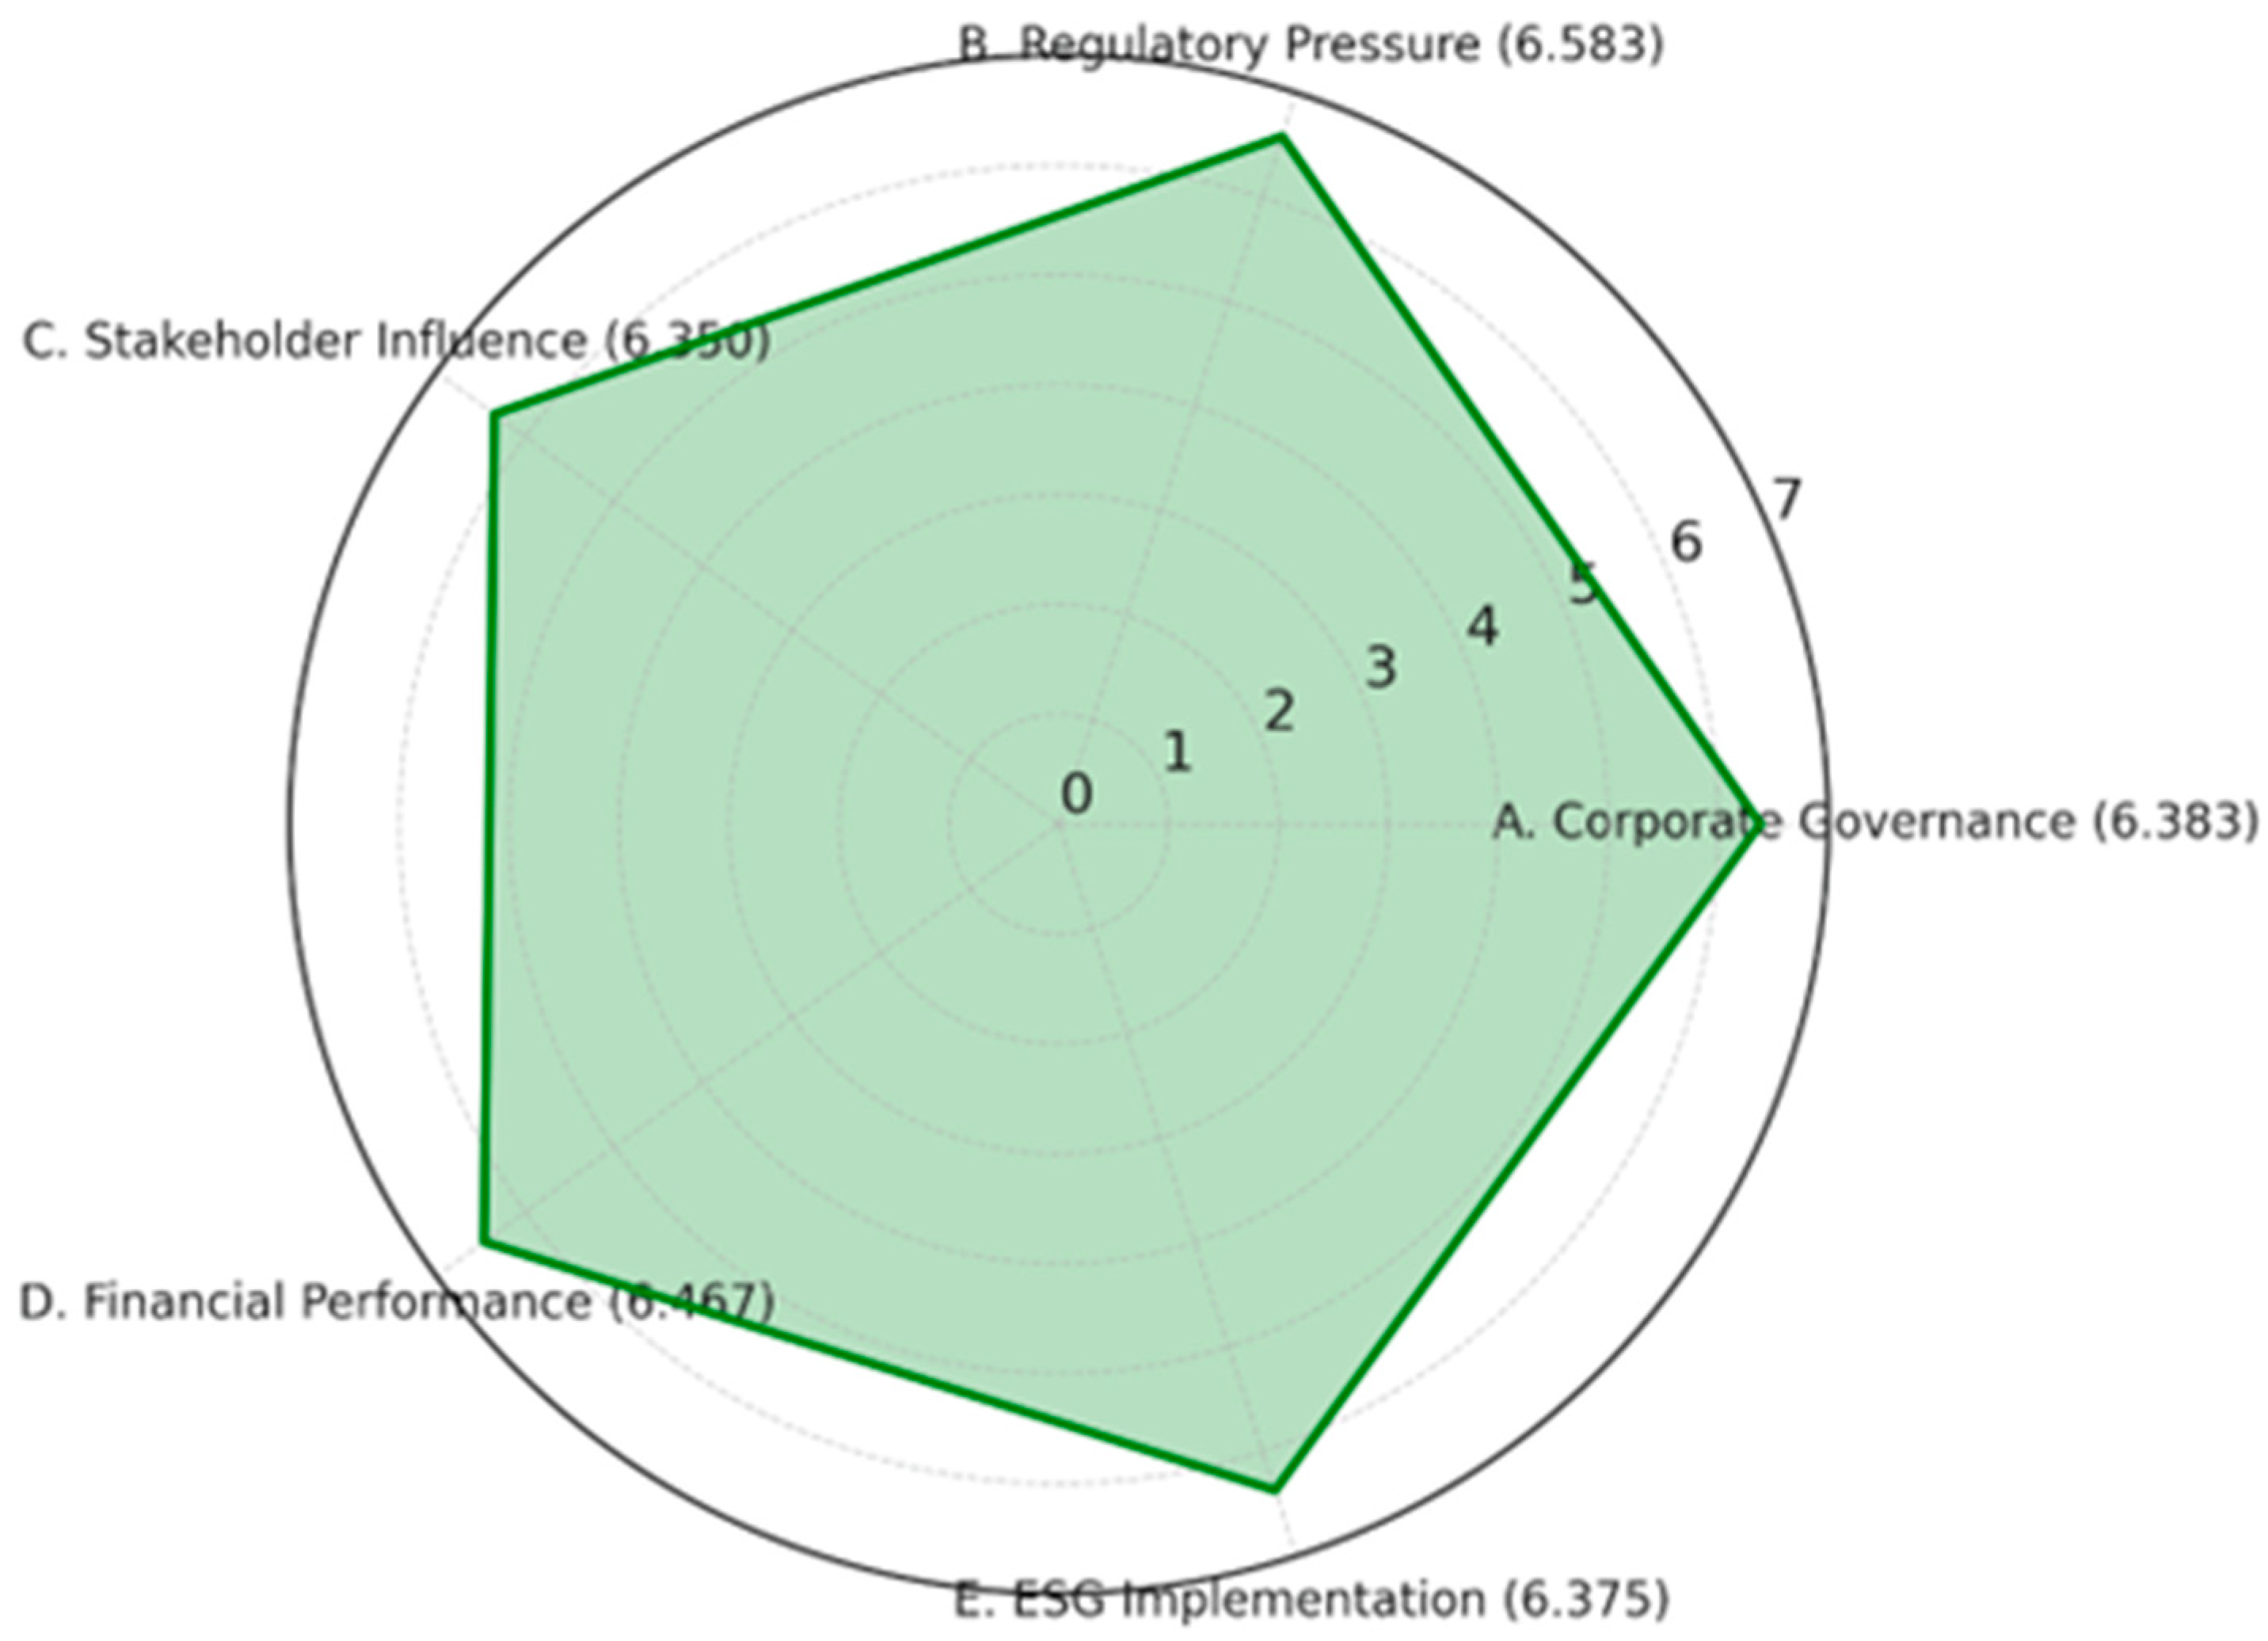
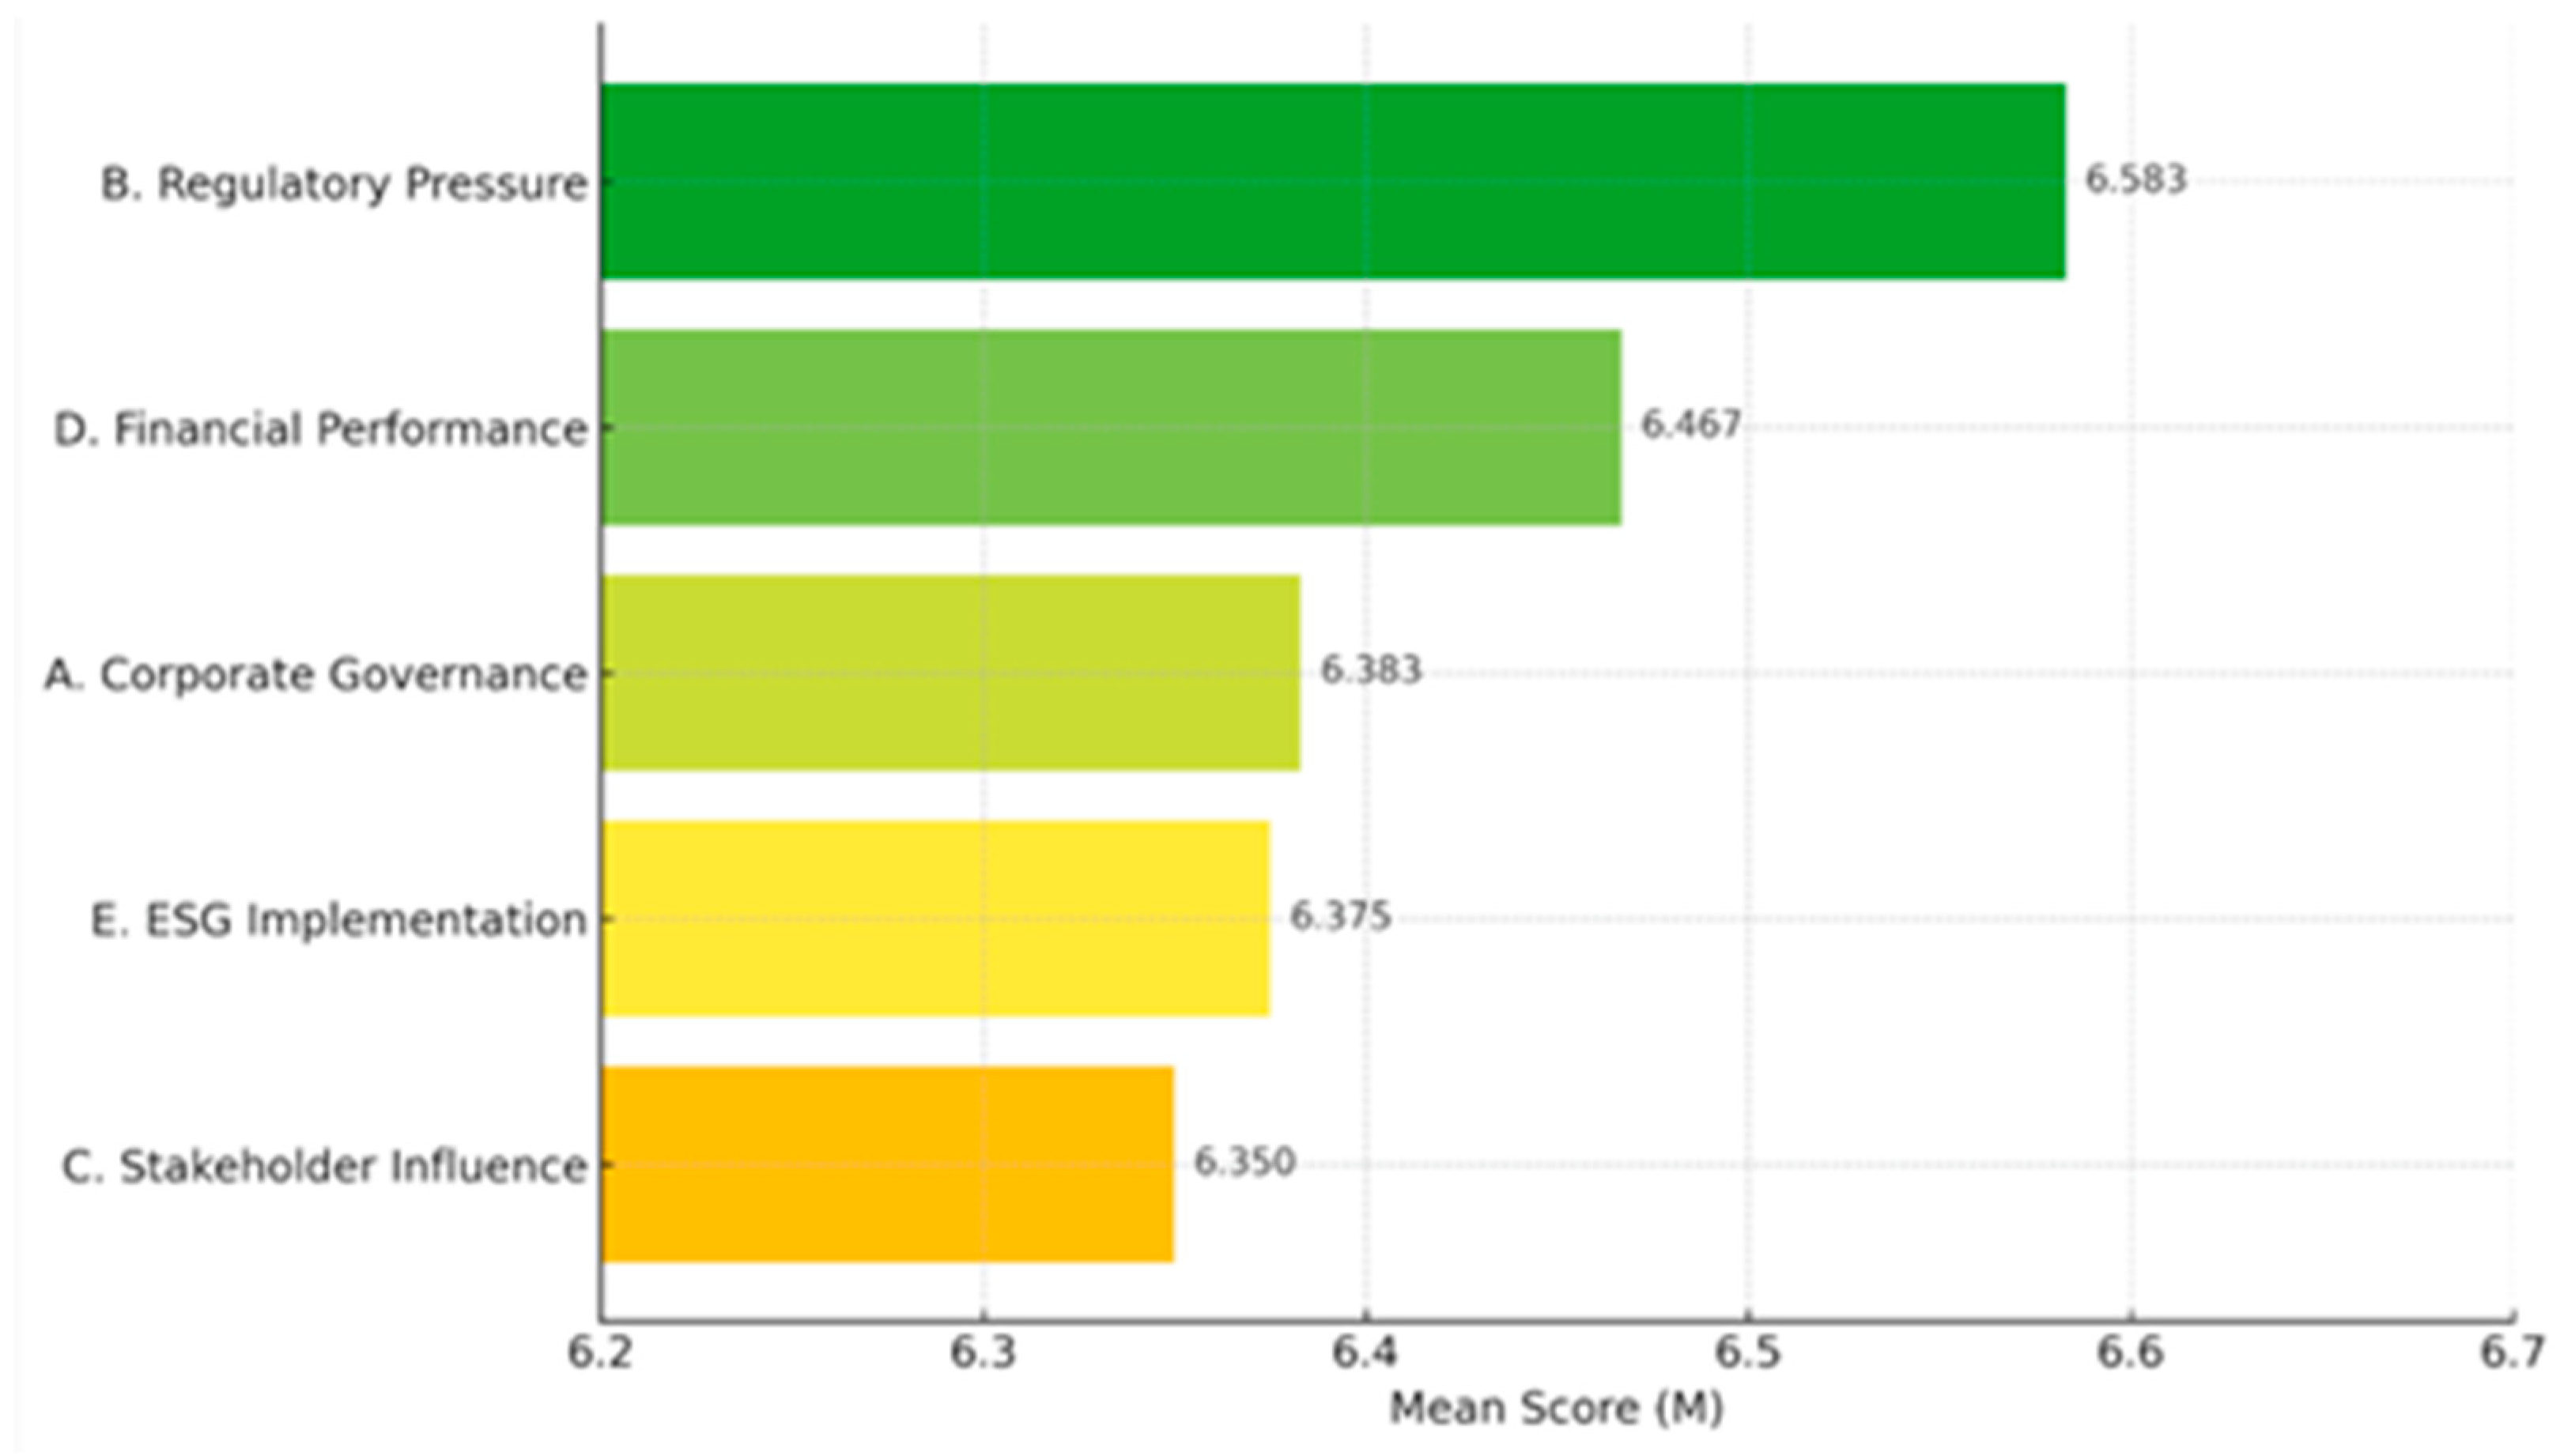
| Dimension | Mean | SD | Z-Value | p-Value |
|---|---|---|---|---|
| A. Corporate Governance | 6.383 | 0.361 | 0.861 | 0.449 |
| B. Regulatory Pressure | 6.583 | 0.298 | 0.701 | 0.710 |
| C. Stakeholder Influence | 6.350 | 0.396 | 0.947 | 0.332 |
| D. Financial Performance | 6.467 | 0.367 | 0.839 | 0.482 |
| E. ESG Implementation | 6.375 | 0.518 | 1.033 | 0.236 |
| Dimension | Item | Mean | SD | Z-Value | p-Value |
|---|---|---|---|---|---|
| A | A1 | 6.670 | 0.488 | 2.582 *** | 0.000 |
| A | A2 | 6.730 | 0.458 | 2.840 *** | 0.000 |
| A | A3 | 6.730 | 0.458 | 2.840 *** | 0.000 |
| A | A4 | 6.400 | 0.632 | 1.807 ** | 0.003 |
| A | A5 | 5.800 | 0.775 | 1.549 * | 0.016 |
| A | A6 | 6.270 | 0.704 | 1.549 * | 0.016 |
| A | A7 | 6.270 | 0.594 | 1.678 ** | 0.007 |
| A | A8 | 6.200 | 0.561 | 1.678 ** | 0.007 |
| B | B1 | 6.470 | 0.516 | 2.066 *** | 0.000 |
| B | B2 | 6.800 | 0.414 | 3.098 *** | 0.000 |
| B | B3 | 6.600 | 0.507 | 2.324 *** | 0.000 |
| B | B4 | 6.330 | 0.724 | 1.807 ** | 0.003 |
| B | B5 | 6.730 | 0.458 | 2.840 *** | 0.000 |
| B | B6 | 6.330 | 0.724 | 1.807 ** | 0.003 |
| B | B7 | 6.600 | 0.632 | 2.582 *** | 0.000 |
| B | B8 | 6.800 | 0.414 | 3.098 *** | 0.000 |
| C | C1 | 6.130 | 0.640 | 1.420 * | 0.035 |
| C | C2 | 6.470 | 0.516 | 2.066 *** | 0.000 |
| C | C3 | 6.130 | 0.743 | 1.291 | 0.071 |
| C | C4 | 6.330 | 0.617 | 1.678 ** | 0.007 |
| C | C5 | 6.530 | 0.516 | 2.066 *** | 0.000 |
| C | C6 | 6.270 | 0.799 | 1.807 ** | 0.003 |
| C | C7 | 6.400 | 0.632 | 1.807 ** | 0.003 |
| C | C8 | 6.530 | 0.516 | 2.066 *** | 0.000 |
| D | D1 | 6.330 | 0.488 | 2.582 *** | 0.000 |
| D | D2 | 6.470 | 0.516 | 2.066 *** | 0.000 |
| D | D3 | 6.600 | 0.507 | 2.324 *** | 0.000 |
| D | D4 | 6.800 | 0.414 | 3.098 *** | 0.000 |
| D | D5 | 6.530 | 0.516 | 2.066 *** | 0.000 |
| D | D6 | 6.530 | 0.516 | 2.066 *** | 0.000 |
| D | D7 | 6.270 | 0.594 | 1.678 ** | 0.007 |
| D | D8 | 6.200 | 0.561 | 1.678 ** | 0.007 |
| E | E1 | 6.400 | 0.737 | 2.066 *** | 0.000 |
| E | E2 | 6.330 | 0.816 | 2.066 *** | 0.000 |
| E | E3 | 6.330 | 0.724 | 1.807 ** | 0.003 |
| E | E4 | 6.530 | 0.516 | 2.066 *** | 0.000 |
| E | E5 | 6.200 | 0.775 | 1.549 * | 0.016 |
| E | E6 | 6.400 | 0.737 | 2.066 *** | 0.000 |
| E | E7 | 6.330 | 0.724 | 1.807 ** | 0.003 |
| E | E8 | 6.470 | 0.516 | 2.066 *** | 0.000 |
Disclaimer/Publisher’s Note: The statements, opinions and data contained in all publications are solely those of the individual author(s) and contributor(s) and not of MDPI and/or the editor(s). MDPI and/or the editor(s) disclaim responsibility for any injury to people or property resulting from any ideas, methods, instructions or products referred to in the content. |
© 2025 by the authors. Licensee MDPI, Basel, Switzerland. This article is an open access article distributed under the terms and conditions of the Creative Commons Attribution (CC BY) license (https://creativecommons.org/licenses/by/4.0/).
Share and Cite
Yao, K.-C.; Lai, C.-C.; Shyr, W.-J.; Chou, D.-F.; Huang, K.-M. Exploring Key Factors Influencing ESG Commitment: Evidence from Taiwanese Listed Companies. Sustainability 2025, 17, 6208. https://doi.org/10.3390/su17136208
Yao K-C, Lai C-C, Shyr W-J, Chou D-F, Huang K-M. Exploring Key Factors Influencing ESG Commitment: Evidence from Taiwanese Listed Companies. Sustainability. 2025; 17(13):6208. https://doi.org/10.3390/su17136208
Chicago/Turabian StyleYao, Kai-Chao, Cheng-Chang Lai, Wen-Jye Shyr, Da-Fang Chou, and Kun-Ming Huang. 2025. "Exploring Key Factors Influencing ESG Commitment: Evidence from Taiwanese Listed Companies" Sustainability 17, no. 13: 6208. https://doi.org/10.3390/su17136208
APA StyleYao, K.-C., Lai, C.-C., Shyr, W.-J., Chou, D.-F., & Huang, K.-M. (2025). Exploring Key Factors Influencing ESG Commitment: Evidence from Taiwanese Listed Companies. Sustainability, 17(13), 6208. https://doi.org/10.3390/su17136208