Article

Economic Feasibility and Operational Performance of Rotor Sails in Maritime Transport

Estonian Maritime Academy, Tallinn University of Technology, Kopli 101, 11712 Tallinn, Estonia
*
Author to whom correspondence should be addressed.
Sustainability 2025, 17(13), 5909; https://doi.org/10.3390/su17135909
Submission received: 16 May 2025 / Revised: 19 June 2025 / Accepted: 23 June 2025 / Published: 26 June 2025

Abstract

The maritime sector is under pressure to increase ship energy efficiency and reduce greenhouse gas (GHG) emissions as a part of global decarbonization goals. Various innovative technologies are being adopted in recent years, raising concerns not only about technological feasibility but also about the economic viability of such technologies in the context of sustainable maritime practices. This study evaluates the operational performance, potential to increase energy efficiency, and economic feasibility of wind-assisted propulsion technologies such as rotor sails across different vessel types and operational profiles. As a contribution to cleaner and more efficient shipping, energy savings produced by rotor thrust were analyzed in relation to vessel dimensions and rotor configuration. The results derived from publicly available industry data including shipowner reports, manufacturer case studies, and classification society publications on 25 confirmed rotor sail installations between 2010 and 2025 indicate that savings typically range between 4% and 15%, with isolated cases reporting up to 25%. A simulation model was developed to assess payback time based on varying fuel consumption, investment cost, CO2 pricing, and operational parameters. Monte Carlo analysis confirmed that under typical assumptions rotor sail investments can reach payback in three to six years (as the ship is also liable for CO2 payments). These findings offer practical guidance for shipowners and operators evaluating wind-assisted propulsion under current and emerging environmental regulations and contribute to advancing sustainability in maritime transport. The research contributes to bridging the gap between simulation-based and real-world performance evaluations of rotor sail technologies.

1. Introduction

The maritime industry is facing growing pressure to reduce GHG emissions due to increasingly stringent environmental regulations, and the aim of sustainable maritime practices. The International Maritime Organization (IMO) has set ambitious targets [1,2,3,4,5,6] for carbon emissions reduction, leading shipowners to explore alternative propulsion methods. Among these, wind-assisted ship propulsion (WASP) has gained significant attention as a scalable solution. WASP harnesses wind energy through various technologies, including rotor sails, hard sails, suction wings, kites, soft sails, and hull-integrated solutions. Several studies have explored the potential of WASP. For example, Chou et al. (2021) [7] provided an economic and operational review of various wind propulsion technologies, while Bordogna et al. (2020) [8] investigated aerodynamic interference between multiple rotors. Lindstad et al. (2022) [9] proposed optimized bulk carrier hull designs to enhance wind propulsion performance. Still significant knowledge gaps remain, particularly regarding the long-term financial viability of WASP investments for ships.
Rotor sails (Flettner rotors) are emerging as one of the most commercially viable options. Rotor sails operate using the Magnus effect, where rotating cylinders powered by electric motors generate lift perpendicular to the wind flow, providing additional thrust to the vessel. Their effectiveness is highest with beam winds but diminishes in headwind conditions. Commercial installations of rotor sails currently range between 18 and 35 m in height, with diameters up to 5 m. Rotor sails are adaptable for different ship types. However, rotor sails are not suitable for all ship types. Their installation is most feasible on bulk carriers, general cargo ships, and tankers. An application on container ships or RoRo vessels is constrained due to limited deck space and structural interference. Some experimental or limited commercial installations on these vessel types have been carried out, so under specific design adaptations, deployment may still be possible.
The fuel savings of WASP system are calculated [10] based on average energy consumption per vessel type, as presented by the IMO [3]. This method simplifies the evaluation by focusing on generic averages without accounting for specific vessel characteristics or operational parameters. While the report provides a broad overview, the approach introduces significant limitations, as fuel savings for WASP are highly dependent on specific factors, like rotor size, thrust, and vessel dimensions. Both studies [3,10] exclude certain ship categories (e.g., tugs and offshore vessels) and fail to account for factors like off-hire costs during retrofits or the potential impact of voyage optimization software. Relying on average fuel consumption by ship type without considering vessel size or other critical characteristics reduces the analysis’s relevance, as studies show that the relationship between rotor thrust and vessel size is non-linear.
The shipping industry has reported energy savings between 4% and 25% when sailing with rotors. Historically, the m/v E-Ship 1 demonstrated 25% savings [11], while the m/v Maersk Pelican (renamed m/v Timberwolf) recorded an 8.2% reduction in fuel consumption over a one-year period on Middle East–Far East trade routes [12]. Since the 2010s, rotor sail technology has progressed significantly, improving in efficiency, scalability, and integration with existing propulsion systems. Early models with limited automation primarily served as proof-of-concept deployments. Recent developments have advanced rotor technology to a generated thrust of 350 kN with 143 kW power input [13,14]. Additionally, tiltable rotor sails are available on market, allowing greater flexibility in deployment for vessels operating under height-restricted areas. Scientific sources say that a 2–60% range of energy savings can be achieved depending on vessel type, operational profile, and environmental conditions [7,15,16]. Large-scale studies suggest that slow-steaming ships achieve savings between 5 and 17% at higher speeds and between 7 and 23% at lower speeds [17].
Rotor sails’ real-world performance has faced skepticism. Some studies have highlighted issues such as aerodynamic interference among multiple rotors, which can reduce their effectiveness [8], while others raise concerns about the high initial investment costs and the fact that emission reduction alone is insufficient to ensure adoption within the shipping industry and that financial viability must offset costs and risks [7]. Chou et al. (2021) [7] suggested that further studies are required to assess long-term cost effectiveness and integration challenges within the shipping industry. Bentin et al. (2016) [18] emphasized that investment in WASP must consider multiple cost factors, including fuel savings, capital costs, operational costs, and environmental costs from emissions. Lack of reliable cost data for WASP systems makes it difficult to determine their exact economic efficiency. Bentin et al. (2016) [18] suggested using scenario-based calculations to assess the maximum viable investment based on a reasonable payback period (5 years) and that the economic feasibility of WASP depends on fuel prices and future regulatory policies regarding emissions and cleaner fuels.
This research aims to assess rotor sails’ economic feasibility, energy saving potential, cost effectiveness, and operational challenges in shipping. The research problem can be described as follows:
  • How sensitive (and sustainable) is rotor sail investment payback time to variations in fuel consumption and price, CO2 cost, and vessel operational parameters?
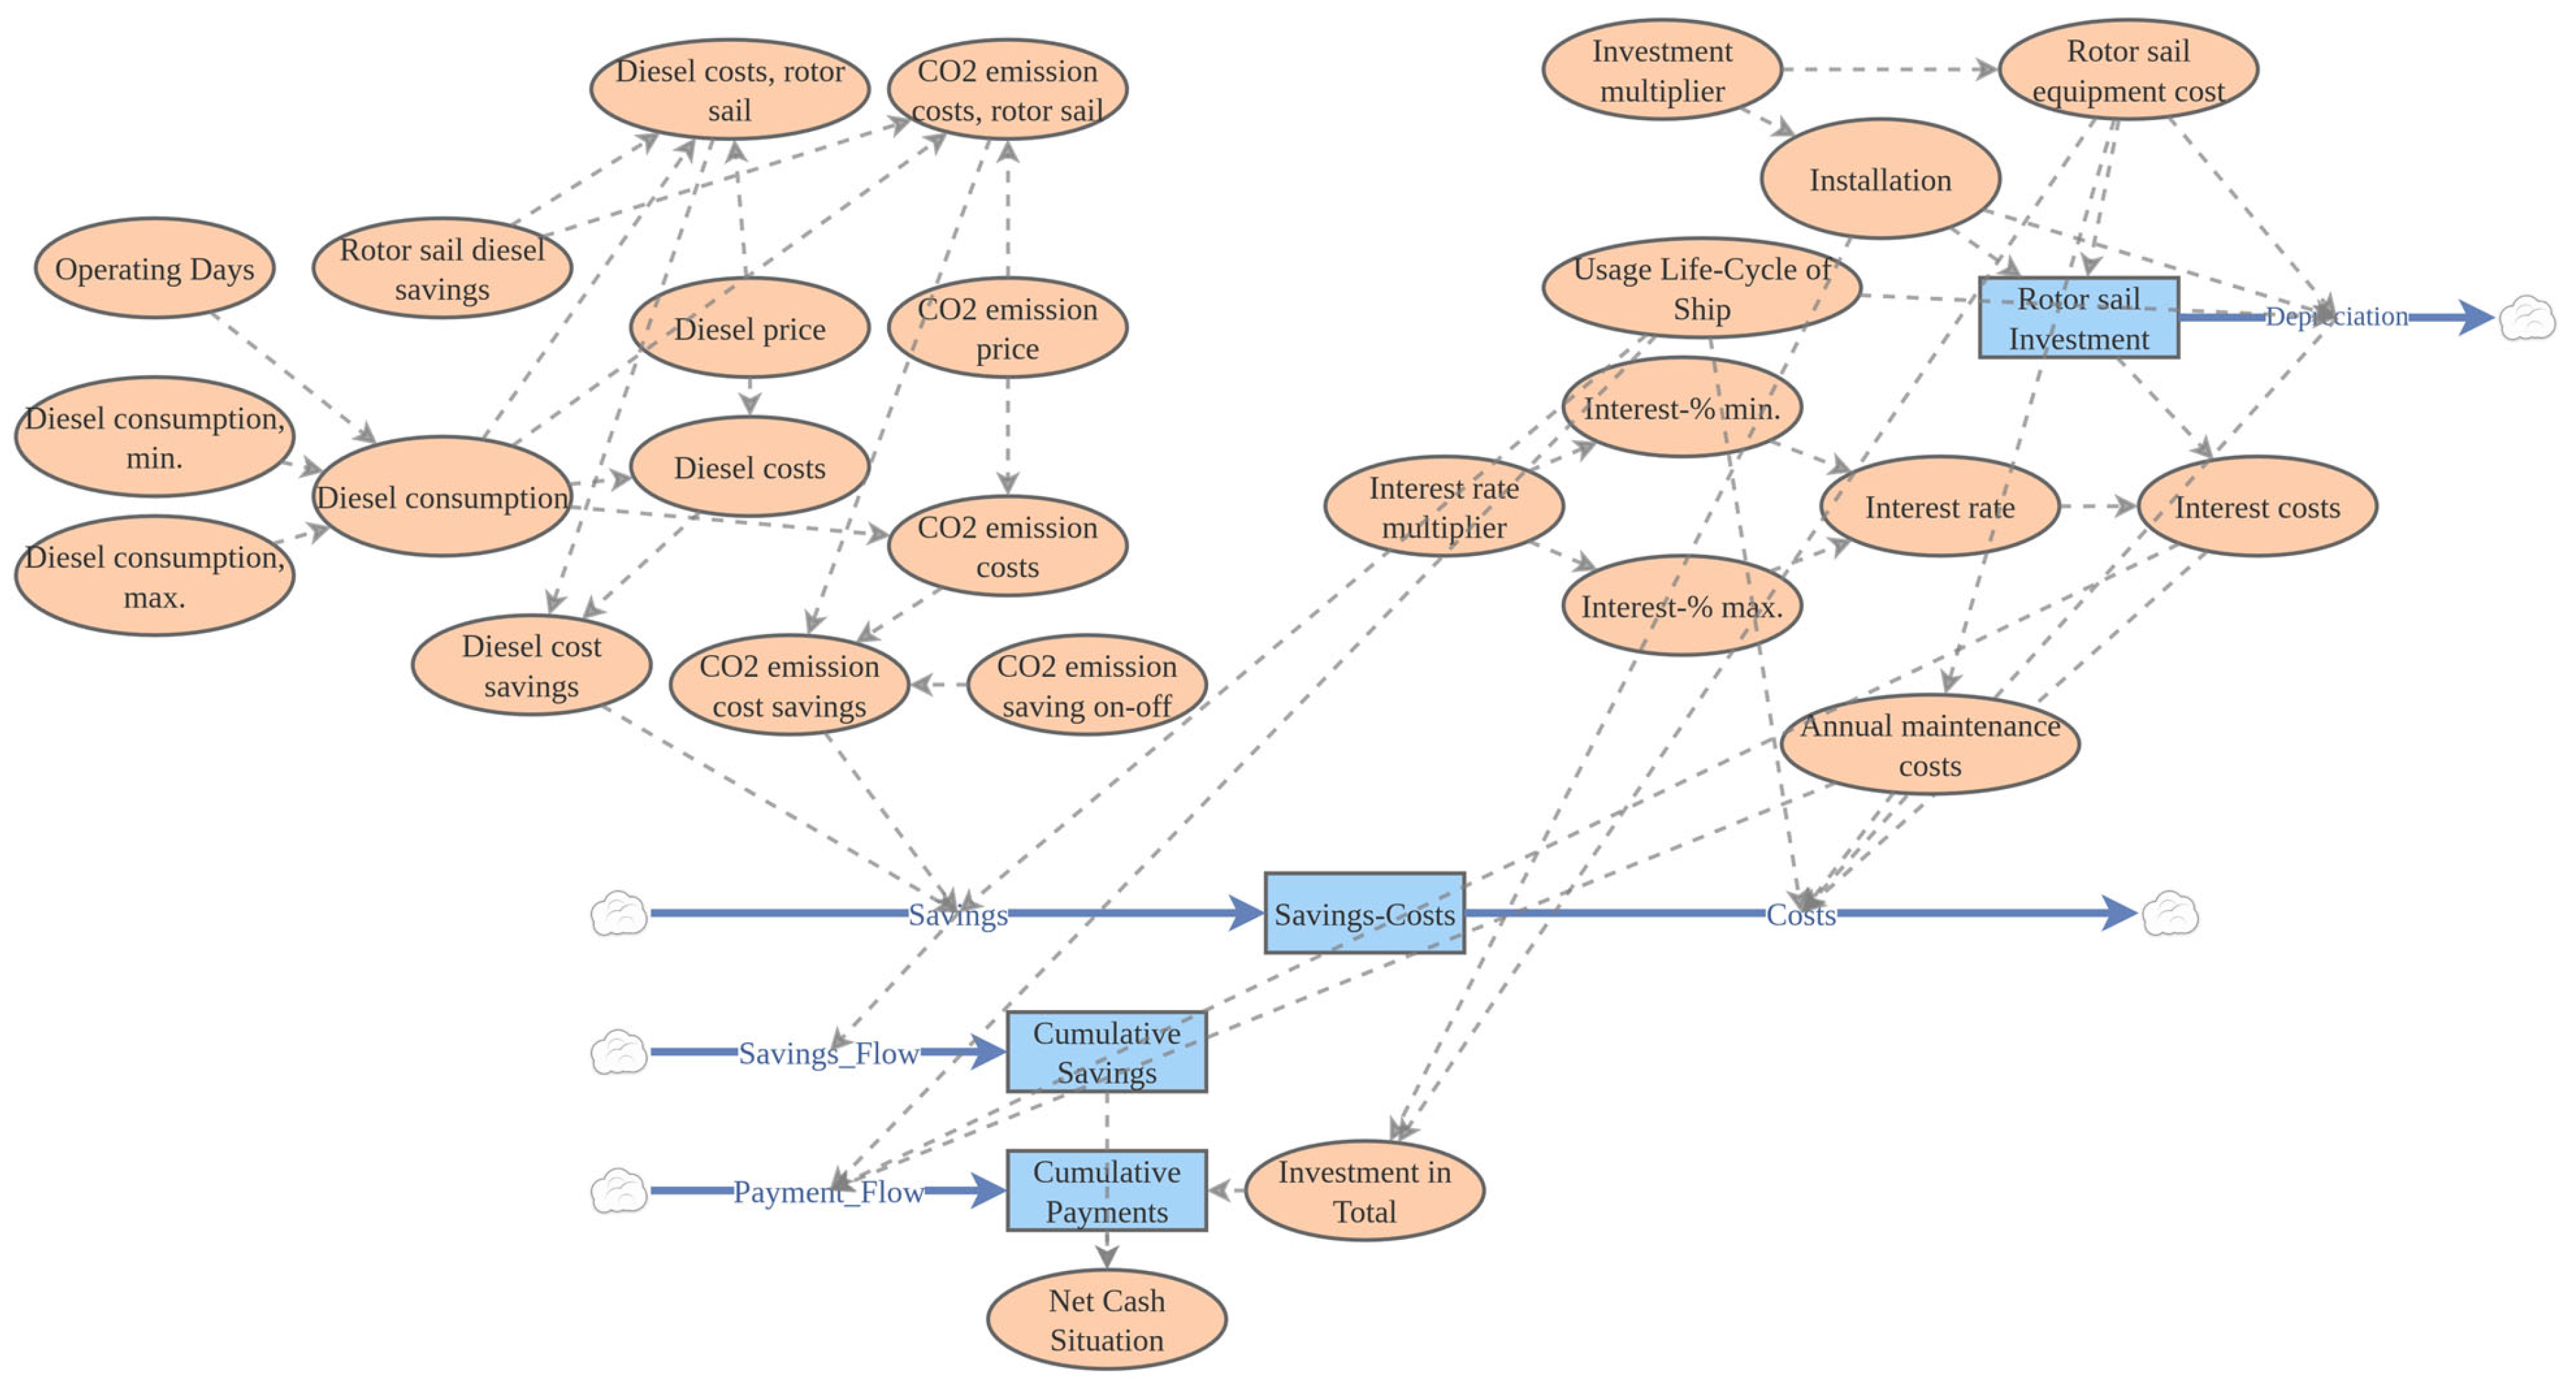
Existing studies have described the technical potential of rotor sails but rarely integrate operational profiles and vessel parameters into economic assessment models. Theoretical approaches typically rely on averaged fuel consumption by ship type, overlooking the non-linear effects of rotor thrust in relation to vessel size and operational constraints. This study addresses this methodological gap by combining literature-derived savings data with ship characteristics and introducing a flexible simulation model to assess payback time across diverse conditions. The aim is to enable sustainable shipping where both economic and environmental aspects are considered as well as incorporated.
The remainder of this paper is structured as follows. Section 2 describes the data sources used to compile a dataset of vessels equipped with rotor sails and describes the simulation model created to estimate investment feasibility. Section 3 presents results from public vessels’ data, reported and simulated fuel savings, and literature-based performance comparisons. Section 4 discusses the implications of the findings of the literature review, including variability in reported results, limitations in data comparability, and challenges in performance validation. Section 5 presents the results of the effectiveness simulation model. Section 6 concludes the study by summarizing key insights and highlighting future research directions for assessing rotor sail technologies under different regulatory and operational scenarios.

2. Simulation Model

This study uses a literature review, public data analysis, and simulation modeling to assess the economic feasibility and operational performance of rotor sail technology in the maritime transport. Information about ships equipped with rotor sails was gathered from publicly available sources, including manufacturers’ websites, shipping company announcements, reports of classification societies, and verified media publications. Data were compiled on ship type, size, rotor configuration, year of installation, and reported or estimated fuel savings. These reported values were treated as indicative of industry-reported performance. Our aim was to reflect the range of savings figures used in commercial decision making. Where possible, we prioritized cases supported by third-party validation (e.g., classification society reports or research projects) and excluded inconsistent or speculative figures from comparative analysis. The database of rotor sail-equipped vessels was developed, including 25 ships with confirmed installations between 2010 and 2025. In the case that fuel savings were estimated, vessels were excluded from further saving trend analysis. Fuel savings were analyzed in relation to vessel length overall (LOA), installed rotor thrust, and operational profile. The analysis approach was descriptive and exploratory. Publicly reported fuel savings were matched with vessel characteristics, and only cases with verified or consistently reported savings were included. A comparative matrix was constructed for rotor sails to assess non-linearities in fuel savings trends across vessel types. Visual comparison methods were used to examine how rotor thrust and ship size correlate with energy savings. In the literature review, the compiled data reflect the terminology used by each original author—whether described as fuel savings, energy savings, CO2 savings, or rotor contribution—without reinterpretation and used, as “energy savings” is a generalized term.
A simulation model was created using InsightMaker software [19] to estimate the payback time and cost effectiveness of rotor sail investments for a bulk carrier. The model includes variable parameters such as:
  • Diesel fuel consumption: random uniform 1–4 tons/hour (same for one year);
  • Diesel price: EUR 500 per ton (could be user-altered: EUR 200–1000/ton);
  • CO2 emission cost: EUR 85 per ton (could be user-altered: EUR 10–200/ton);
  • Investment cost multiplier: 1 (could be user-altered: 0.1–5);
  • Interest rates: random triangular 3–10% (peak at 6.5%; same for one year);
  • Vessel lifecycle: 20 years (could be user-altered: 10–30 years);
  • Rotor sail fuel saving rate: 7% (could be user-altered: 0–50%);
  • Number of operating days: 250 (could be user-altered: 0–365);
  • CO2 emission saving on–off: on, 1 (could be user-altered: off, 0; on, 1).
Monte Carlo simulations (n = 100 runs) were applied to test the sensitivity of outcomes to input variability (having random distributions in diesel consumption and interest rates, with others parameters being fixed and default as given in the above). In the simulation model, the term “fuel savings” refers specifically to reductions in fuel consumption. The simulation model includes a user-interactive modeling possibility, where the user is freely given an opportunity to alter default values in the scales given above.
In the simulation model, the investment of rotor sails does not directly lead to change in revenues, and it can only be justified with cost savings. Cost savings are mostly dependent on vessel diesel fuel consumption. Fuel use potentially decreases and causes a CO2 emission decline as well. These two saving items are modeled on the left side of Figure 1. So, it all depends on whether CO2 emissions are to be paid by the vessel or not (e.g., part of European Union Emission Trading System, EU ETS). In the case that the ship is liable for CO2 payments, then savings are possible from these with the use of rotor sails. In the simulation model, savings of diesel and CO2 are based on comparison. In the middle, the model estimates how much diesel and CO2 emissions are created without rotor sails, and then, in the upper part, these two element calculations contain this investment (and result on diesel and CO2 savings). The difference is the saving potential of diesel fuel and CO2 emissions. The simulation model randomly varies (uniform) diesel fuel consumption per hour (min. 1 ton and max. 4 tons of diesel; taken from [20]). Diesel consumption per hour is multiplied by 24 to make it daily and then further multiplied by the operating days of a year to make it annual.
The costs of rotor sails are mostly dependent on the investment amount needed and the equipment installation costs. As these contain uncertainties, in the simulation model, we include a multiplier for their overall costs incurred (they may stay on the budget or exceed it in multipliers). In addition to this, there is usage lifecycle of a ship—the rotor sail may be invested in the middle of the ship’s usage life-cycle and be forecasted to be in operation for 15–20 years. This impacts the annual depreciation program of the rotor sail investment as well as limits the accumulation time of savings. The situation is, of course, most preferable if the rotor sail is installed in a brand new ship, and its usage life-cycle is then 30–40 years.
The investment and installation costs will lead to annual depreciation costs based on the selected usage lifetime of a ship. Annual maintenance costs and interest rates paid are based on overall investment and the depreciation program (it is assumed that loans are paid based on depreciation amount of an investment, so depreciation is a loan amortization plan as well). In the simulation model, interest rates do vary during usage period, and the user may give a range of interest rates; these are then randomized with triangular distribution.
The simulation model presented in Figure 1 follows both annual flows of savings–costs, but in addition, at the very bottom, the cash flow is followed for the purposes of investment appraisal calculations, like cash flow formation and payback time. Both increase the understanding of rotor sail investment—annual savings and costs concerning the margin of benefits per annum, then cash flow formation regarding the risks of the investment, and its possible return to a positive cash position. In cash flow calculations, investment and installation costs are directly accounted as negative outflow, as investment is being made (and depreciation is not included).
The simulation model contains numerous parameter values, which the user may interactively alter for different simulation runs. First are the estimated multipliers for investment (for possible cost overruns) and estimated interest rates (for possible changes in interest rate environment). Currently, rotor sail investment is set to cost EUR 2 million and its installation EUR 0.1 million. The investment multiplier could be altered from 0.1 to 5. So, in the case of 0.1, rotor sail investment will cost only 10% of the total sum of EUR 2.1 million (which corresponds EUR 0.21 million). However, on the other hand, with a multiplier of 5, this investment and installation could reach a total cost of EUR 10.5 million. Interest rates similarly vary with random uniform distribution, and the lowest possible interest paid is 3% p.a., and the maximum is 10%. The multiplier could values from one to three. So, the interest rate min. could increase up to 9% and the max. to 30%.
The lifetime of the ship could be altered from 10 up to 30 years (with the default value being 20 years). This selection impacts the depreciation program of the investment (length) and the length of accumulated savings, costs, and payment flows.
Prices of diesel fuel and CO2 emission rights can also be altered by user. By default, the diesel price is set to EUR 500 per ton (e.g., BIX, 2025; VLSFO 0.5 diesel grade in early to mid-February 2025 was around USD 540–560 per ton, and MGO 0.1 grade in turn USD 670–680 per ton), and CO2 emissions in turn are EUR 85 per ton (CO2 emission rights have been trading in the range of EUR 60–95 per ton from August 2022 to March 2025; Investing.com, 2025). The diesel price could be anything between EUR 200 and EUR 1000 per ton. Similarly, CO2 emission could cost between EUR10 and EUR 200 per ton. This is also given for the user to determine whether CO2 emissions are part of the savings or not. This is a binary value from 0 (off) to 1 (on).
The savings rate of rotor sail investment is also a freely selected parameter of the simulation model—initially, it is set as 7%, but this could be altered from 0 to 50%. Similarly, the operating days of a ship per year can also be freely selected. It is initially set as 250 days per year, but this could range from 0 to 365 days.
Finally, it should be noted that the simulation model has only two random statistical distributions (for diesel consumption and interest rates). These are randomly given to the model for each year of simulation run (so these change only annually). Other variables have default values throughout the entire simulation, but these could be altered between simulation runs by the user (interactive simulation). These user-defined values are valid for the entire simulation run (vessel’s lifecycle).

3. Literature Review on Rotor Sail Installations

This section presents a literature review on rotor sail installations in maritime transport and a summary of rotor sail performance.

3.1. Rotor Sail Model and Manufacturer Analysis

The European Maritime Safety Agency EMSA [10] reports that several companies are engaged in the development and deployment of rotor sail technology. These include Anemoi (UK), Dealfeng (China), Enercon (Germany), Magnuss (Sweden), MariGreen (Germany), and Norsepower (Finland). These companies are reported to have implemented rotor sail solutions across various vessel types with differing degrees of market penetration.
Analysis of public sources shows that Magnuss has not recorded any rotor sail installations to date. Dealfeng reports one installation on a heavy lift ship Hai Yang Shi You 226, confirmed only in a process of installation. Chengxi Shipbuilding in China reports installation of rotor sails on the bulk carrier Chang Hang Sheng Hai. Enercon GmbH earlier explored wind-assisted propulsion with the m/v E-Ship 1 launched in 2010 [11]. This RoLo vessel, designed for transporting wind turbine components, is equipped with four rotor sails, each measuring 27 m in height and 4 m in diameter. Despite this initiative, Enercon has not expanded its maritime rotor sail applications beyond a single vessel. MariGreen is an EU-funded project that has facilitated the installation of rotors on two general cargo vessels. The m/v Goldy Seven (ex. Fehn Pollux) was retrofitted in 2018, followed by the m/v Annika Braren in 2021. They are equipped with @EcoFlettner (produced by ECO FLETTNER GmbH, Leer, Germany) rotors and serve as research platforms to evaluate the feasibility and operational performance of WASP in commercial shipping.
Two companies that are industrially developing rotor sails now are Norsepower and Anemoi. Table 1 summarizes ships that have rotor sails installed to date.
Anemoi reports to have installed rotor sails on a total of nine dry bulk ships and tankers between 2018 and 2025, with ongoing projects expected. An analysis of its installations revealed that rotor sails have been deployed on four bulk carriers to date. The first geared dry bulk ship to feature this technology was m/v Afros in 2018 [21]. Recently, installations were completed on m/v Berge Neblina and m/v Sohar Max in 2024 [22,23]. These vessels of LOA from 200 to 360 m were equipped with three to five rotor sails each.
According to EMSA [10], Norsepower installed or planned to install rotor sails on 29 vessels. Between 2014 and 2025, Norsepower equipped 18 different types of ships with rotor sails. Installations ranged from RoRo ships such as m/v SC Connector (2021), with tiltable rotors first implemented to allow passage under bridges [24], to VLOCs like m/v Sea Zhoushan. The technology has expanded to hybrid RoRo ships [25] such as m/v Berlin (2022) and m/v Delphine (2023) as well as to VLGCs and Post Panamax dry bulk ships with air draught limitations.
Despite its growing adoption, rotor sail technology has not been universally retained. For instance, Viking Grace was one of the first passenger ferries to adopt a rotor sail but removed it in 2021 after a three-year trial [26].

3.2. Reported Fuel Savings from Wind-Assisted Propulsion Systems

The implementation of WASP across various shipping companies and vessel types has led to a range of fuel savings influenced by factors such as vessel size, rotor sail configuration, operational routes, and wind conditions. While some ships have already been retrofitted with rotor sails and are actively reporting fuel savings, others remain in the planning stages, with projected reductions in fuel consumption based on model simulations and previous installations.
Companies have reported fuel savings of up to 25% on certain vessels, for example, on the m/v SC Connector [24]. The m/v Sea Zhoushan has demonstrated fuel savings of up to 8% on its voyages between Brazil and China [27], similar to m/v Berge Neblina [22]. The m/v TR Lady has shown fuel savings of approximately 10% on its voyages between China and Australia [28] and m/v Afros 12.5% on routes between China and Canada [21].
Verified WASP trials confirmed that m/v Copenhagen achieved 4% savings on the Rostock–Gedser route [29]. Trials using the same methodology were carried out onboard the m/v Annika Braren retrofitted under the MariGreen project. Rotor sails demonstrated a peak efficiency of 15% under optimal wind conditions with a typical savings between 2% and 4.5%, reaching 4.6% on the Sunderland–Karlshamn route [30].
WASP studies suggest that average energy savings from Flettner rotors range from approximately 5% to 20% with variations depending on ship type and route [7,16]. Deviations above 30% [31], 36% [18], 47% [32], and 50% [33] have been observed (Table 2).

4. Analysis of Previous Studies

This section presents findings on reported fuel savings across vessel types as presented in the literature.

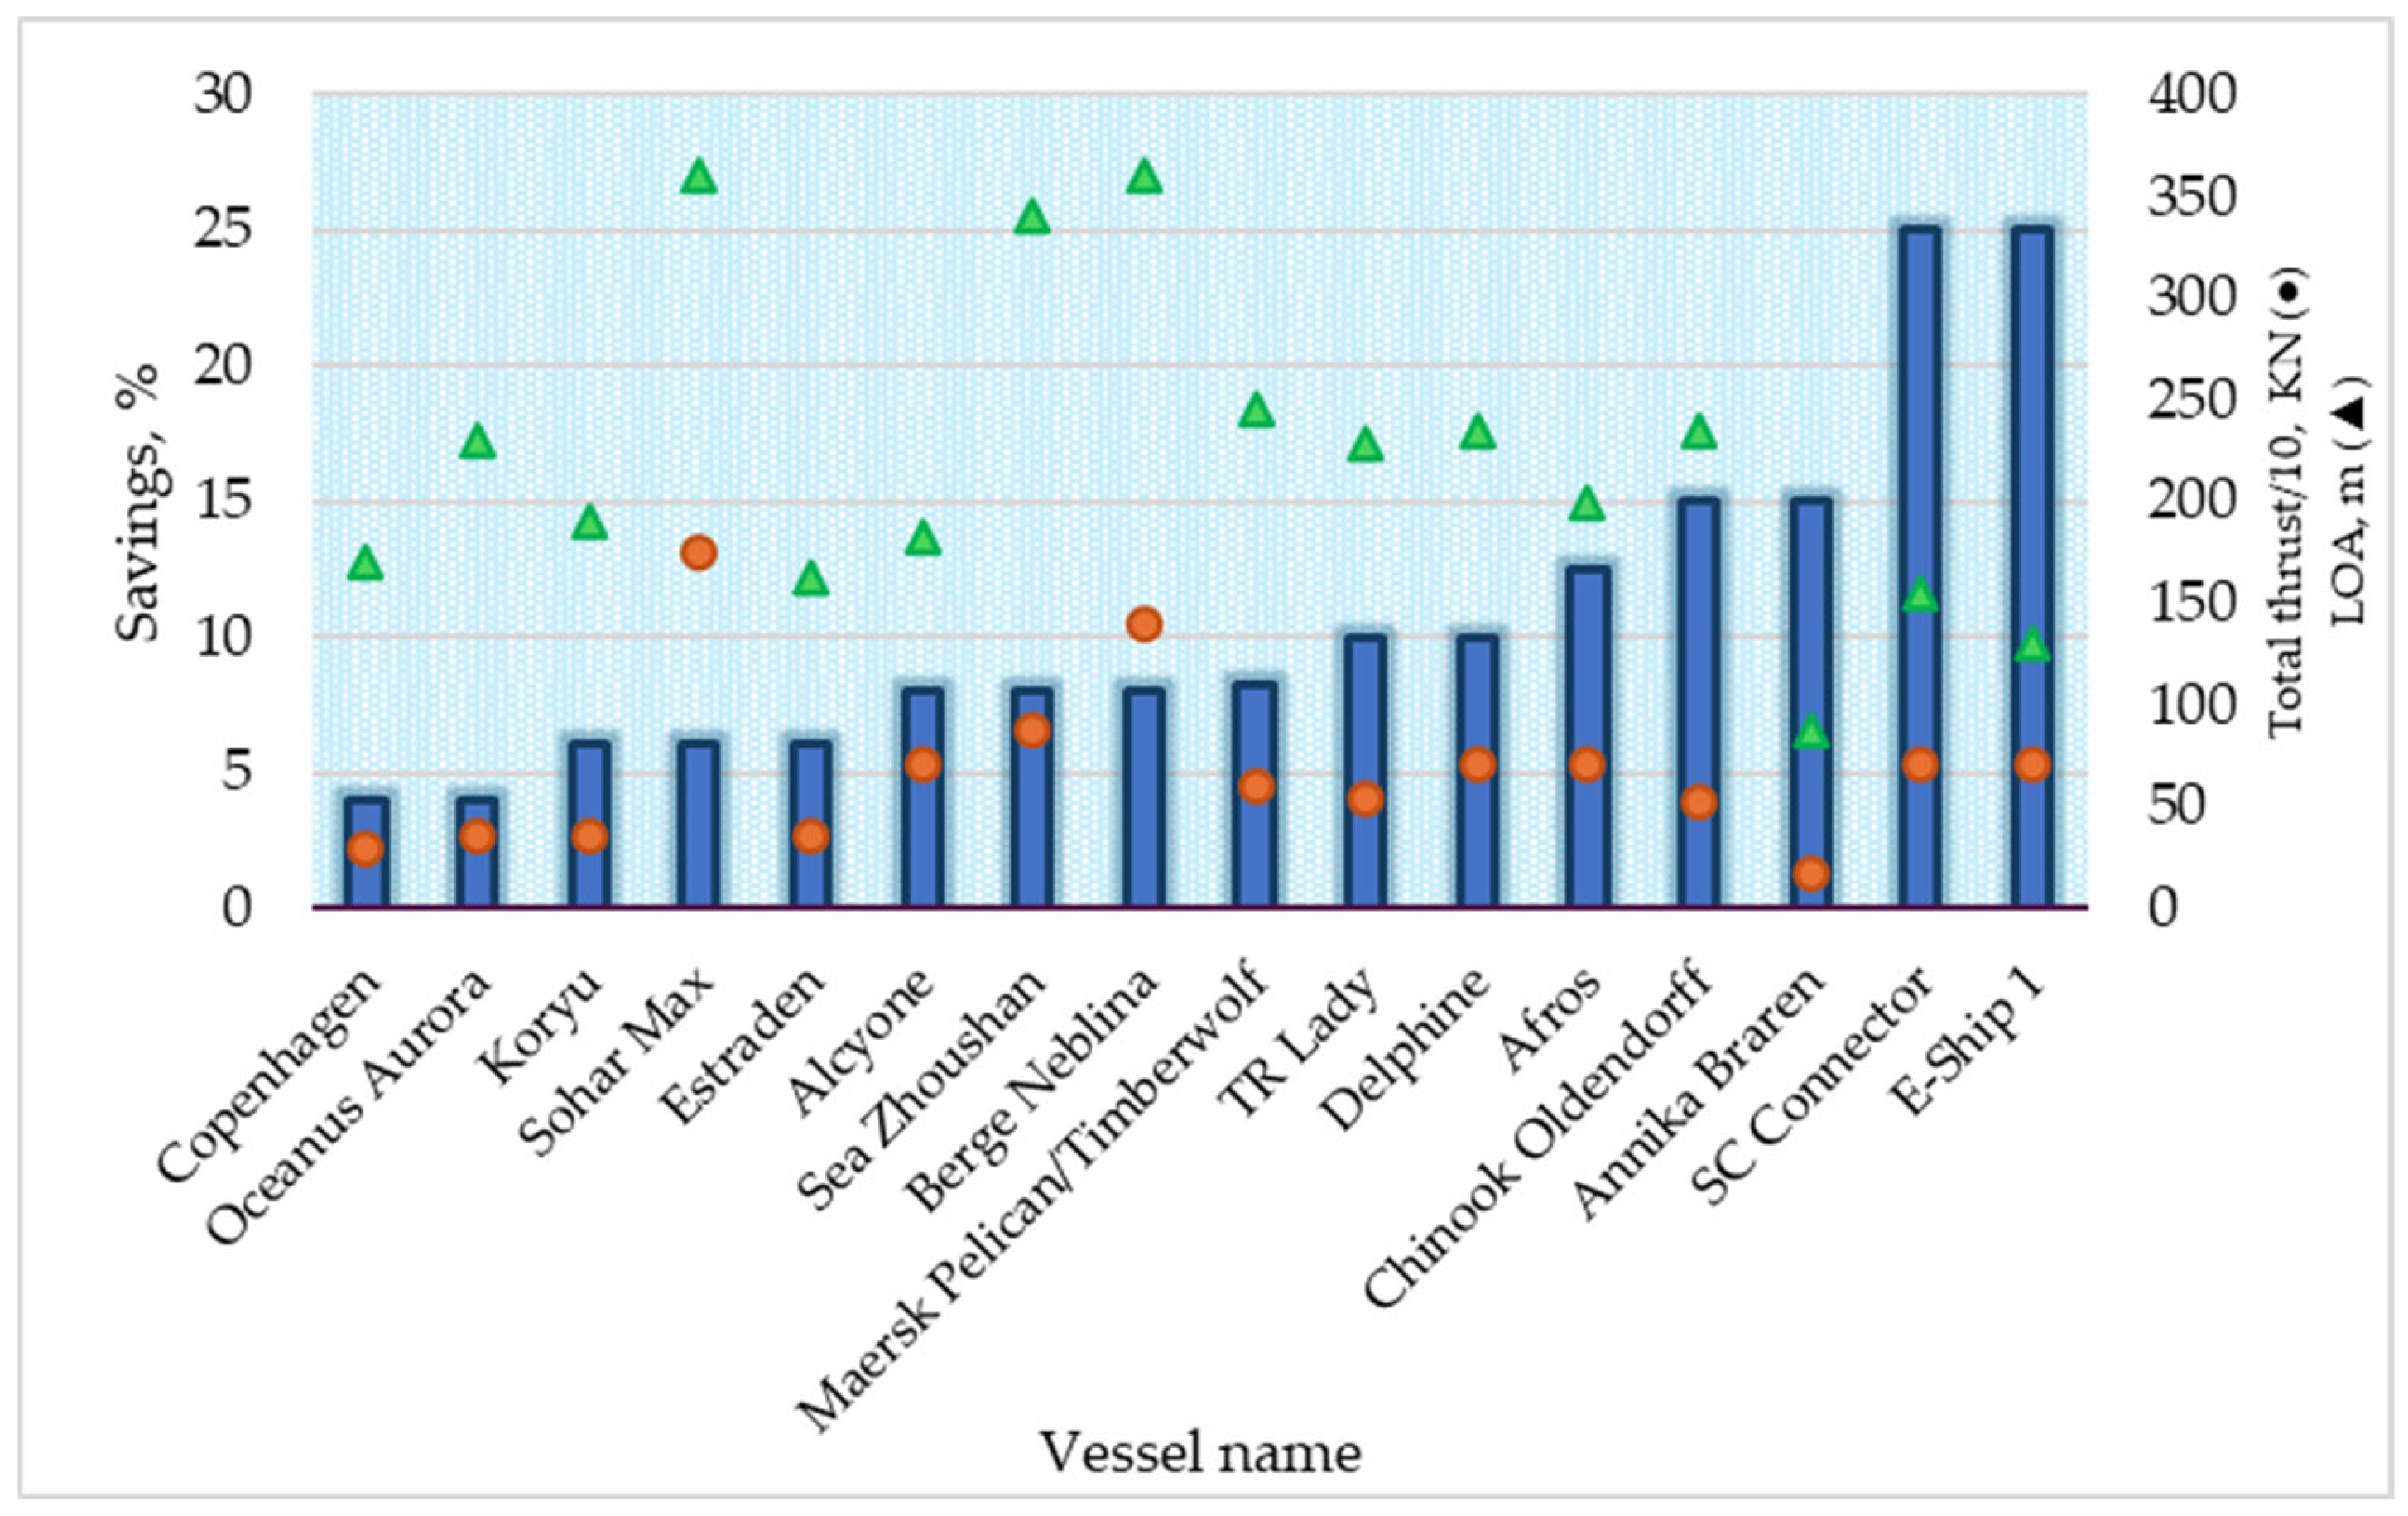
4.1. Analysis of Reported Fuel Savings from Wind-Assisted Propulsion Systems

The analysis of WASP-caused fuel savings confirms that they depend on both rotor sail thrust and vessel size. Since detailed loading conditions (e.g., deadweight and draft) for reported savings during specific voyages are unavailable, LOA serves as a practical comparison metric. Vessels with validated savings (Table 1) across dedicated routes or voyages are summarized in Figure 2.
The relationship between thrust and fuel savings is not linear, as very large vessels do not experience proportionally higher efficiency gains despite greater installed thrust. For example, the m/v Sohar Max (360 m, 1750 kN) has the highest total thrust among the analyzed ships but achieves 6% fuel savings, while the m/v Berge Neblina (360 m, 1400 kN), m/v Sea Zhoushan (340 m, 875 kN), and m/v Maersk Pelican (244 m, 600 kN) report 8% savings despite having lower thrust. At the same time, m/v Chinook Oldendorff (235 m, 525 kN), m/v TR Lady (229 m, 540 kN), and m/v Delphine (234 m, 700 kN) as well as m/v Afros (200 m, 700 kN) achieve 10–15% savings.
RoRo vessels and ferries due to their higher freeboard are more exposed to wind forces, which can enhance rotor sail performance but also increase aerodynamic resistance. They also navigate coastal routes, where wind conditions are highly variable. This suggests relatively low savings by m/v Copenhagen (170 m, 300 kN).

4.2. Analysis of Factors Influencing Wind-Assisted Propulsion Efficiency

Traut et al. (2014) [15] based his findings on numerical modeling, while the research of Vahs (2021) [16] was based on sea trials on the general cargo ship Fehn Pollux (now Goldy Seven). Bentin et al. (2016) [18] used simulation modeling based on real wind and wave data collected from m/v BBC Hudson, demonstrating energy savings through mathematical modeling and route optimization simulations. There are also studies that have underestimated savings. For example, Lu et al. (2020) [34] conducted a comparative analysis of Flettner rotors on an Aframax-size tanker and a Handysize bulk carrier using simulation modeling with real voyage and weather data. The study found that the Handysize ship benefited more from the Flettner rotor than the Aframax vessel. The effectiveness of the rotor is proportionally influenced by the ship’s size and the number of installed rotors. Both ships’ performance was modeled with one installed rotor, whereas real-world applications feature at least two rotors for ships of this size.
Traut et al. (2014) [15] evaluated the impact of Flettner rotors on different ship types, modeling their performance across various routes. The study assessed rotor power contribution expressed as the proportion of rotor generated power relative to the vessel’s total propulsive power demand. This can be interpreted as a lower main engine power requirement and potential energy savings. However, these savings are not necessarily proportional due to variations in engine load response and operational conditions. Chou et al. (2021) [7] interpreted Traut et al.’s (2014) [15] results of the rotor power contribution as fuel savings. Since the study applied the same methodology across all ship types and sizes, using the same rotor size and configuration, the results offer a comparison between them. Rotor contributions are comparable within the dataset, and conclusions are relative. Similarly, Comer et al. (2019) [32] studied existing vessels that had rotor sails installed and simulated their performance using AIS data and global meteorological data on specific routes. Simulations included scenarios of low and high rotor performance. Since one methodology was applied to all vessels, the study provides a basis for comparison. However, as the analysis did not account for the specific loading conditions for each voyage, the results should be interpreted relatively, allowing for a comparative assessment of fuel savings across ship sizes and types included in the simulation. In the same time, the methodology included modeling fuel consumption both without rotor sails (baseline) and with rotor sails, ensuring that the results are intercomparable from this perspective. De Marco et al. (2016) [31] focused on the aerodynamics of Flettner rotors, analyzing how spin ratio, aspect ratio, and end plate size influence lift and drag performance. Using numerical simulations, the study developed a surrogate model to predict aerodynamic efficiency and evaluated the thrust contribution of two Flettner rotors on a product tanker with LOA of 205 m and a deadweight (DWT) of 74,983 tons. While the findings suggest that rotors could provide up to 30% of the ship’s resistance in favorable wind conditions, the study did not quantify actual fuel reduction or energy savings, making it a theoretical foundation for future efficiency assessments. Additionally, Traut et al. (2014) [15] modeled the installation of up to three Flettner rotors, each 35 m in height and 5 m in diameter, proposing that such a setup could replace up to 50% of the main engine power under slow-steaming conditions. However, real-world applications suggest that vessels of similar size typically have no more than one rotor, with a height below 30 m—for example, the Annika Braren was equipped with a single 18 m × 3 m rotor. More recent studies such as that of Mason et al. (2024) [35] have conducted a simulation-based assessment of rotor performance across 14 routes, comparing the Great Circle Route (GCR) without wind propulsion and an optimized route with rotor sails. The study used voyage and weather data to quantify CO2 savings. This brings an additional layer of terminology, further complicating the already inconsistent language used across the literature. Terms such as fuel savings, energy savings, rotor contribution, and CO2 savings are frequently used interchangeably despite referring to different aspects of performance. Fuel savings reflect actual reductions in fuel consumption—a main metric for ship operators—but are not always directly measured. Energy savings describe a decrease in overall propulsion energy demand, which does not always correspond linearly to fuel use. Rotor contribution gives information about the proportion of thrust provided by the rotor relative to the engine, and this does not directly correspond to lower fuel consumption. CO2 savings are often inferred from fuel savings, but can also be derived through separate modeling methods.
The key factors influencing Flettner rotor efficiency across studies such as that of Traut et al. (2014) [15], Vahs (2021) [16], Bentin et al. (2016) [18], and Comer et al. (2019) [32] are common elements such as wind speed and direction (with side winds being optimal), ship speed (where slower speeds enhance efficiency), and route characteristics (favoring wind-rich areas and optimized route). Comer et al. (2019) [32] introduced additional considerations, including the impact of wave conditions and hydrodynamic resistance, which can impact energy savings, and the geographic variability of wind conditions, identifying specific regions where rotors perform better. The study also incorporated a weather adjustment factor accounting for increased fuel demand near shorelines due to additional wind resistance. While all studies highlighted route optimization as a key factor, Bentin et al. (2016) [18] specifically quantified its role, showing its ability to enhance fuel savings when combined with rotor sails. Later studies have introduced more detailed real-world considerations, particularly regarding operational issues. Deck space constraints and the aerodynamic performance of the rotors are noted as influencing factors. The study by Bordogna et al. (2020) [8] investigated the aerodynamic interaction between two Flettner rotors using wind tunnel experiments. The key focus was on how their relative positioning, spacing, and velocity ratio influence aerodynamic performance. The findings indicate that the interaction effects are most pronounced when rotors are placed closer together and aligned with the wind direction, affecting lift, drag, and overall thrust. The study highlights that real-world performance estimations often overlook these interactions, assuming rotors operate independently. It also demonstrates that optimal rotor placement and control of rotational speeds can either enhance or degrade performance, suggesting that layout and operational strategies significantly influence fuel savings in wind-assisted propulsion. The results show that wider spacing minimizes aerodynamic interference, improving efficiency. When deck space is limited, the best arrangement depends on the wind conditions: a side-by-side setup performs better when sailing closer to headwind, while a tandem configuration is more effective when sailing closer to crosswind or downwind. Additionally, operating the windward rotor at a higher velocity ratio than the leeward one helps mitigate negative effects and optimize thrust.

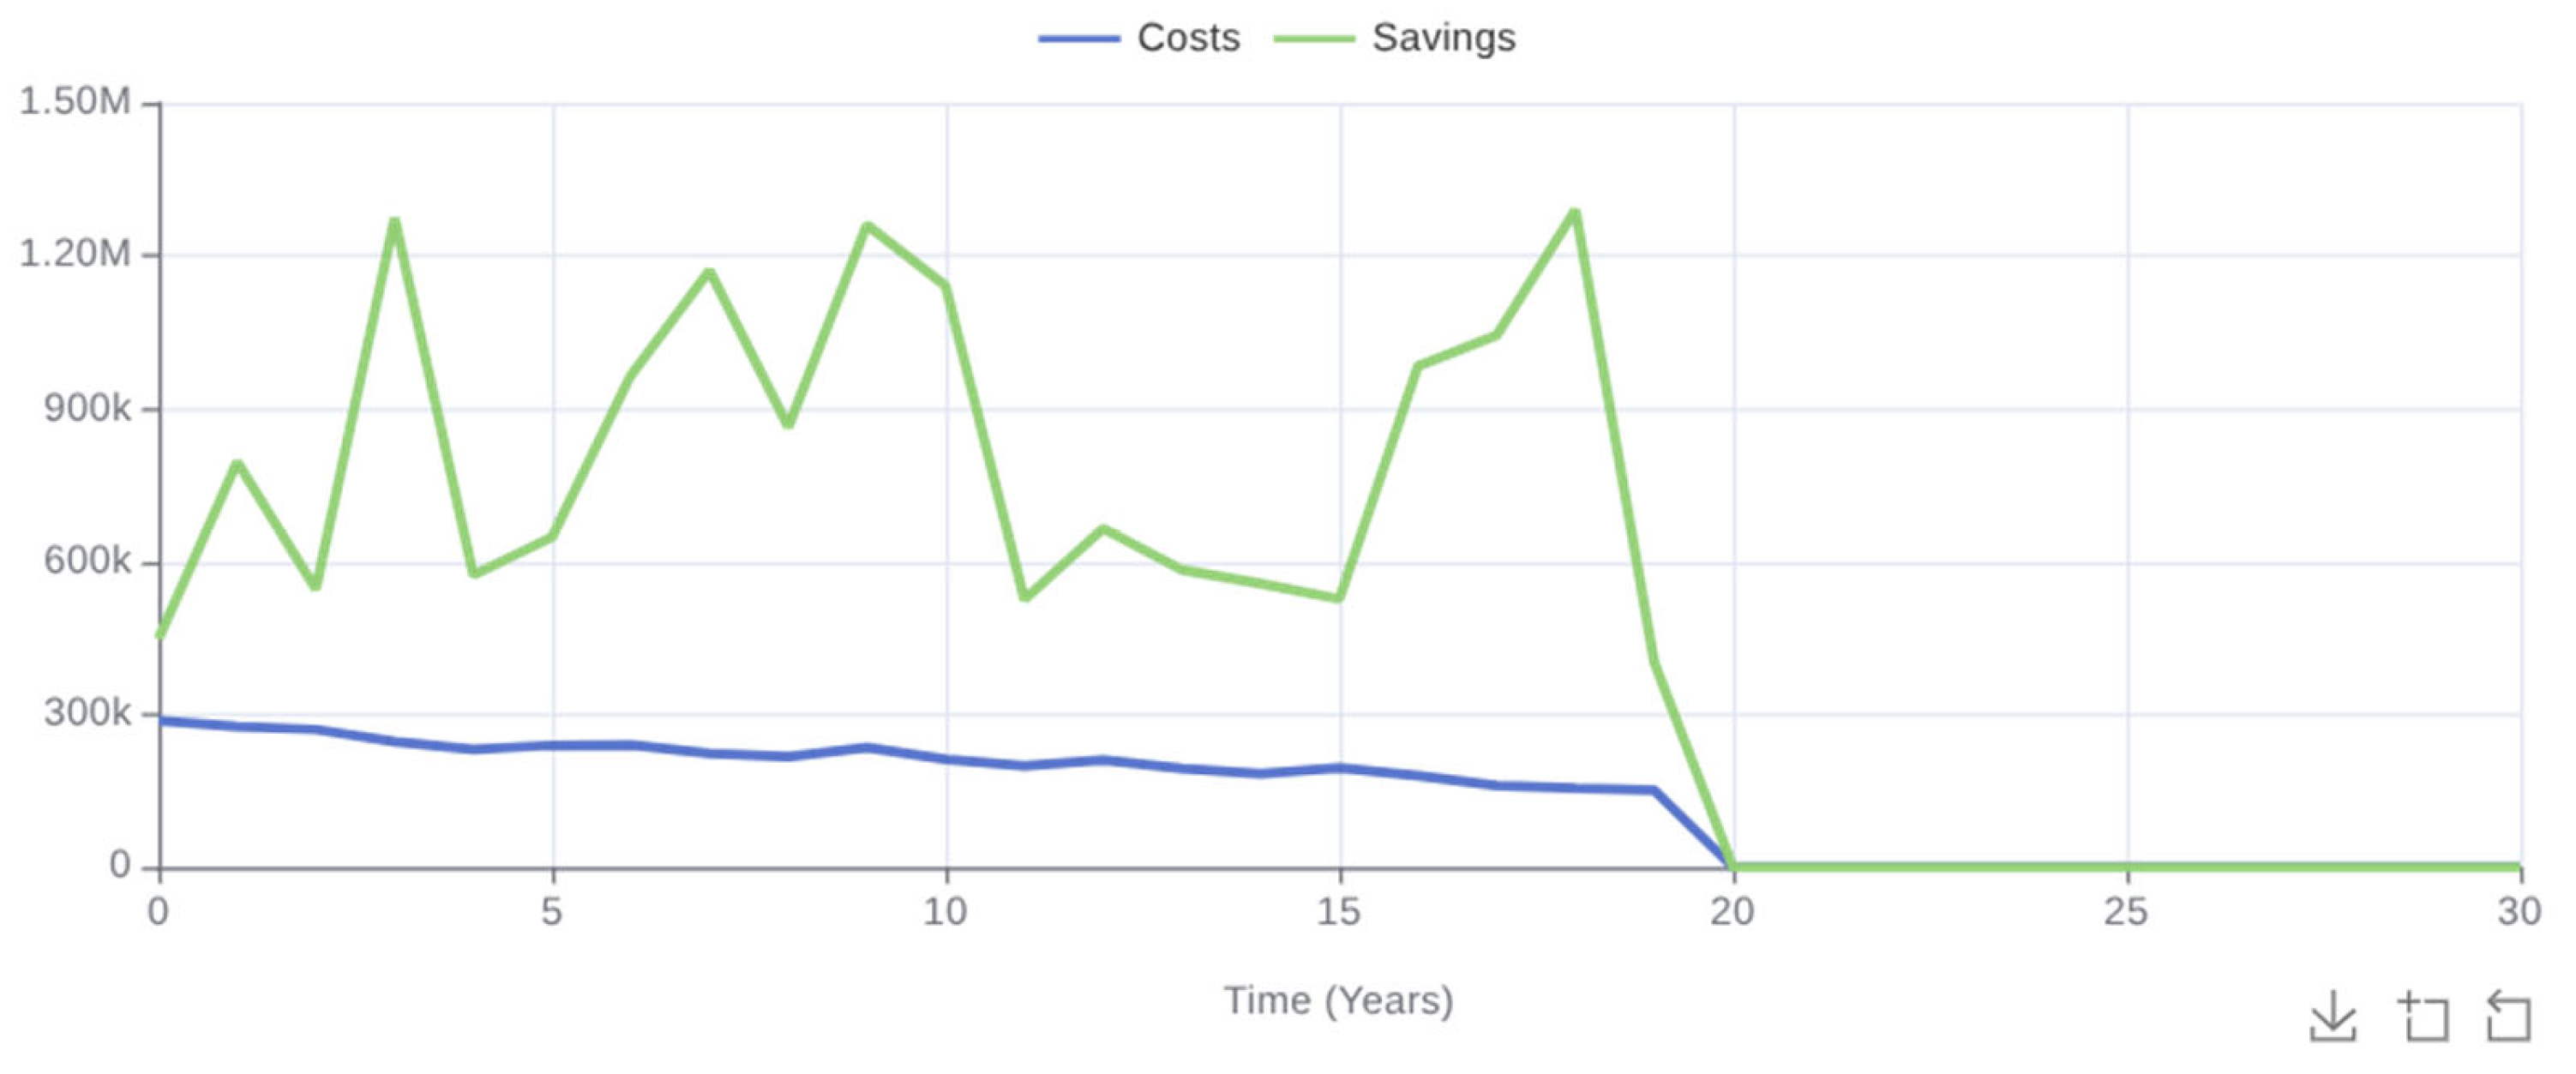
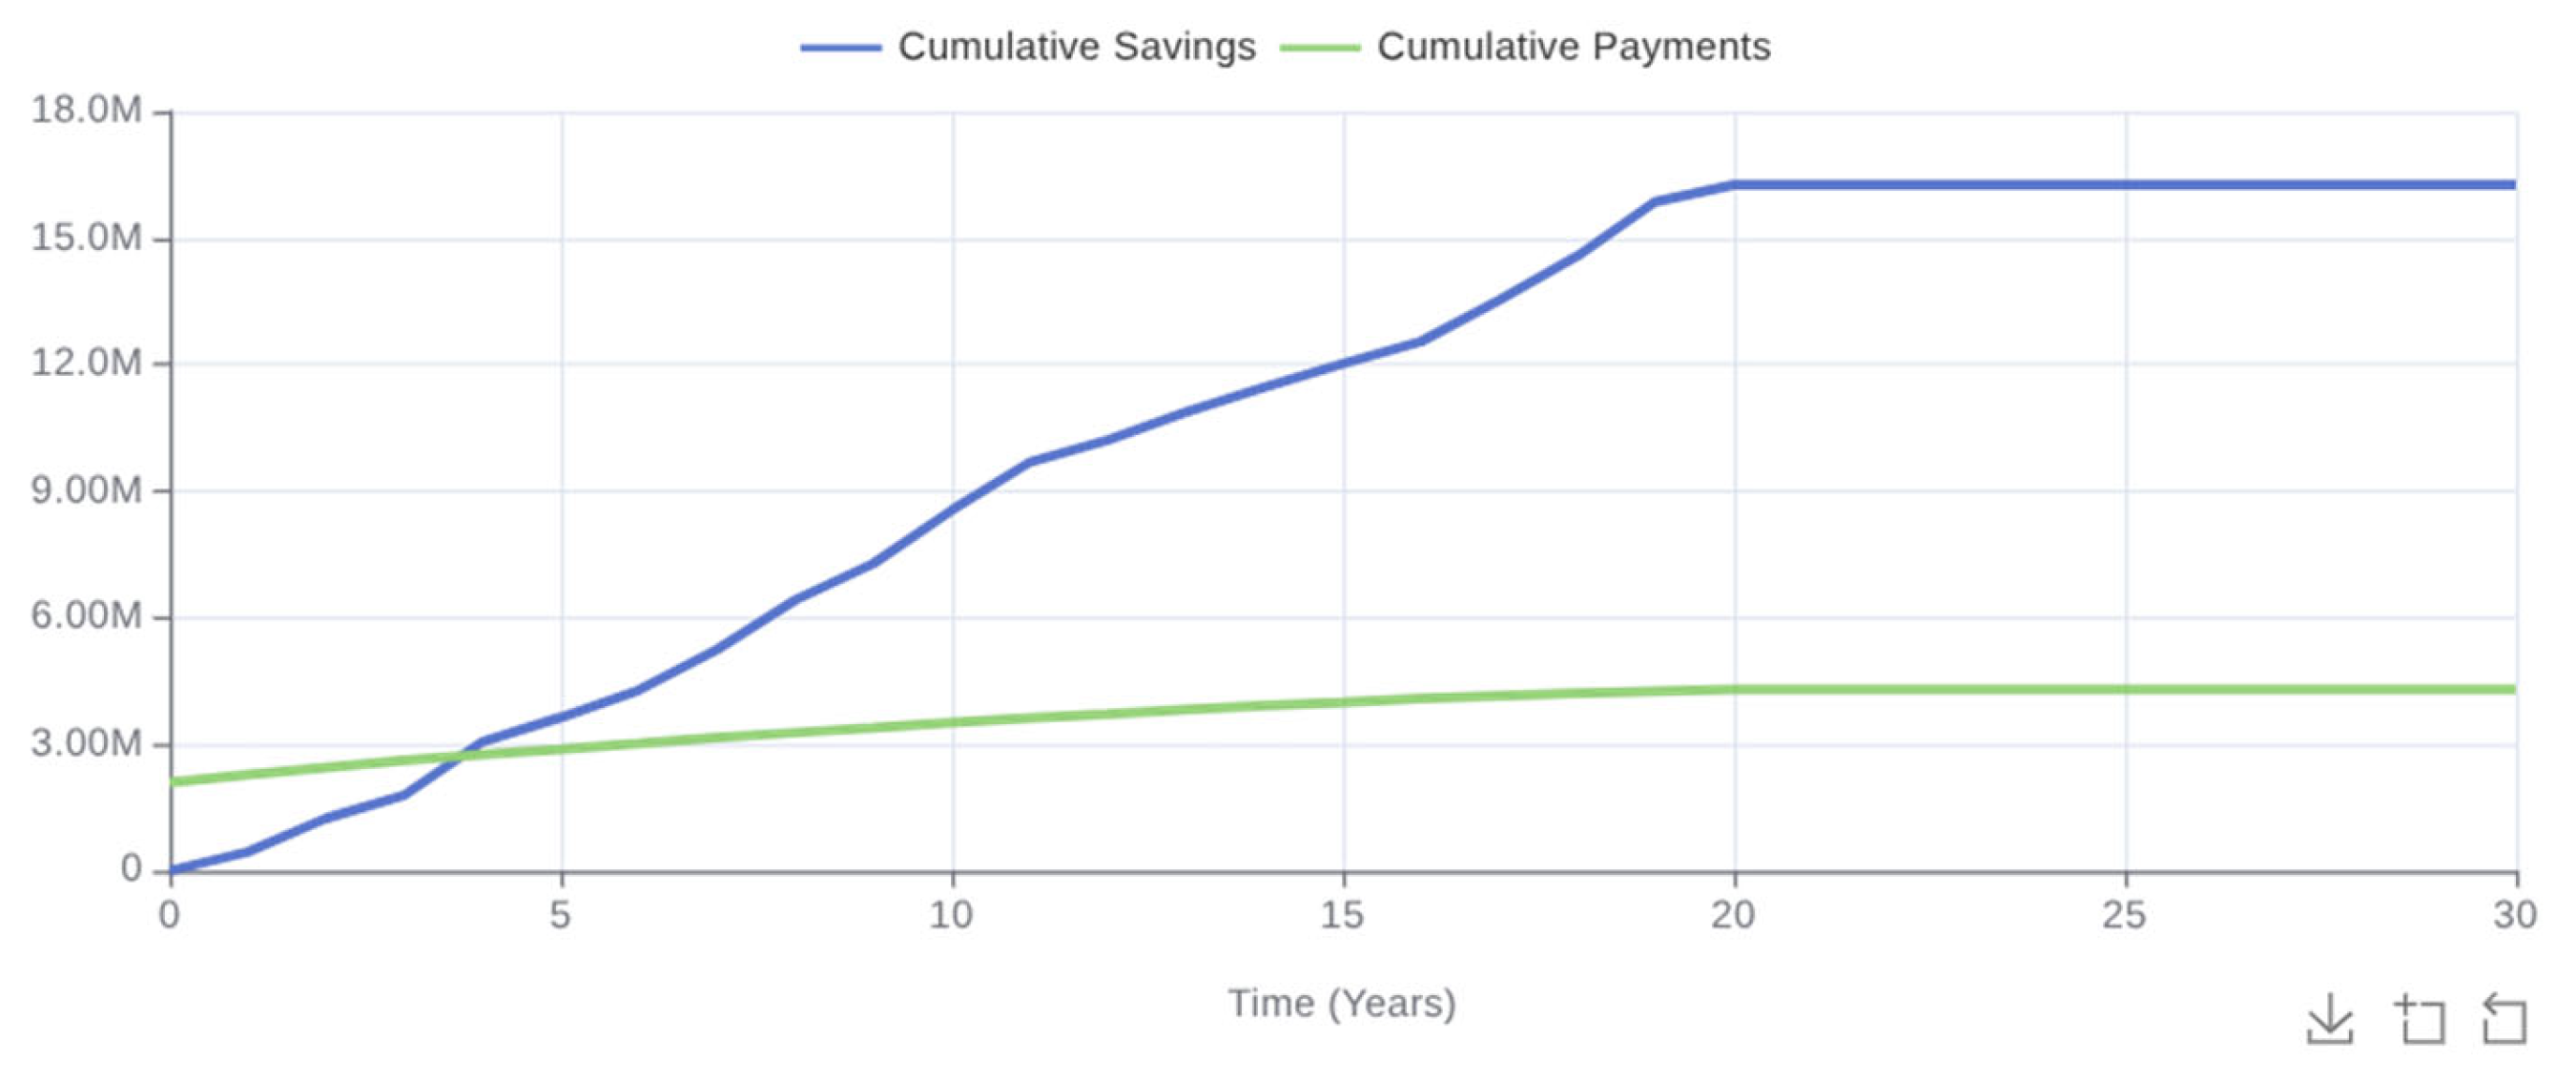
5. Simulation Model Results

This section presents the results achieved by the simulation model.
To study the cost effectiveness of the rotor sails, we used a simulation model (see Section 4). As savings are driven by two savings streams, namely diesel fuel savings (also resulting in a lower amount of CO2 emissions) and CO2 payment savings [1], it is understandable that the savings are far higher than the annual costs of a rotor sail system (Figure 3). This is, of course, supported by a rather high diesel fuel price and CO2 payment price. However, these correspond to the situation of early 2025 in these two markets. It should be noted that savings do fluctuate annually greatly, as diesel fuel consumption of the ship was modeled as random and uniform from one to four tons per hour, representing average consumption across various operational phases of a voyage including at sea, port maneuvering, and possible anchorage delays. As both savings are based on this diesel fuel consumption, this creates some annual uncertainty in the savings model.
If cash flows are examined (Figure 4), then the conclusion could be drawn that the payback period of rotor sail system is under five years, where in Figure 4, it is four (based on one simulation run). This, of course, contains uncertainty, as diesel fuel consumption varies in the model, and so do the interest rates. As Monte Carlo simulation is executed for 100 simulation runs, this could gain some area for payback time, which is shown in Figure 5 as 3–6 years. So, even with model uncertainties, investment in a rotor sail system could be justified. Of course, this in a perfect situation, where the given parameter values hold their status.
Based on different simulation runs with different configurations, we found that the uncertainty of savings streams plays a critical role in the payback period. However, CO2 payments could be excluded from the total savings if the simulated bulk ship operates outside of EU waters and does not belong to an EU-registered state. The energy saving rate of rotor sails could also be lower than estimated, and it was lowered to 5%. The results are given in Figure 6. As can be noted, the payback time takes considerably longer to achieve, basically somewhat above 10 years (again, based on a single simulation run).

6. Conclusions

This study evaluated the performance and economic feasibility of rotor sails using public vessel data, a literature review, and simulation modeling. It consolidated previous findings from the literature (e.g., [7,15,18]) and compiled real-world installation data into an overview. The novel simulation model developed for this study allows interactive adjustment of key parameters. Rotor sails can contribute to fuel consumption reduction in shipping, with reported savings in the range of 4–15% under operational conditions and up to 25% in isolated cases. Simulated results from prior studies indicate a wider potential ranging from 5% to over 50% depending on modeling assumptions, vessel size, route characteristics, and environmental conditions. The relationship between installed thrust and energy savings is shown to be non-linear, particularly for larger ships, where increasing thrust does not necessarily bring proportionally higher savings. There are certain limitations in the comparability of performance results. Publicly available validated data remain insufficient, and the terminology used across studies is inconsistent. Terms such as fuel savings, energy savings, rotor contribution, and CO2 savings are often used to describe same savings percentage.
A simulation model was developed to assess economic feasibility. It includes variable input parameters such as diesel consumption, investment costs, CO2 pricing and emission trading system, as well as ship operating days. Monte Carlo simulation demonstrated that under typical assumptions, rotor sail investments can achieve payback in three to six years. However, the economic outcome is highly sensitive to cost assumptions, savings rates, and fuel market conditions. In some cases, particularly where fuel savings are modest, CO2 savings are not gained (off), and/or installation costs are high, the system does not achieve payback within a 20-year period. One limitation of the Monte Carlo simulation method is its reliance on probabilistic inputs, which can introduce randomness and may not capture all real-world constraints. These findings suggest that rotor sail feasibility cannot be generalized across vessel types but must be evaluated on a case-by-case basis.
In the context of expanding EU climate regulations, the EU ETS interest in emission-reduction technologies is expected to increase. However, shipowners require access to transparent, research-based, and verified data to make informed investment decisions. The study highlights the need for improved data availability, standard performance assessment frameworks, and greater collaboration between technology providers and research institutions.
It should also be noted that rotor sails can increase aerodynamic resistance during voyages with prolonged headwinds. Instead of generating auxiliary thrust, the rotors may impose additional drag on the vessel, leading to higher fuel consumption and CO2 emissions. This effect is especially relevant in regions with persistent wind patterns that oppose the vessel’s heading. The net benefit of rotor sail installation must consider route-specific wind conditions and the potential for negative performance impacts during certain operational scenarios.
Future work should focus on closing the gap between simulation and real-world performance through the collection of long-term operational data of WASP systems. Further development of route optimization tools, control strategies for rotor operation, and scenario-based investment modeling could contribute to a more comprehensive understanding of rotor sail potential in supporting maritime decarbonization.

Author Contributions

Conceptualization, K.C. and O.-P.H.; Methodology, K.C., O.-P.H. and U.T.; Software, O.-P.H.; Validation, K.C., O.-P.H. and U.T.; Formal analysis, K.C. and O.-P.H.; Investigation, K.C., O.-P.H. and U.T.; Resources, K.C., O.-P.H. and U.T.; Data curation, K.C. and O.-P.H.; Writing—original draft, K.C. and O.-P.H.; Writing—review & editing, K.C., O.-P.H. and U.T.; Visualization, K.C. and O.-P.H.; Supervision, K.C. and U.T.; Project administration, K.C. and U.T.; Funding acquisition, U.T. All authors have read and agreed to the published version of the manuscript.

Funding

This research received funding from Horizon-Widera-2023-Access-02-02 under the grant agreement no. 101159424 project titled ‘‘Twinning to enable Baltic Sea vessels to meet Fit-for-55 regulations’’ by the European Research Executive Agency (REA) delegated by the European Commission. The views and opinions expressed are those of the authors only and do not necessarily reflect those of the European Union or REA. Neither the European Union nor the granting authority can be held responsible for these views and opinions. The APC was funded by MDPI as article was awarded with free waiver.

Institutional Review Board Statement

Not applicable.

Informed Consent Statement

Not applicable.

Data Availability Statement

Data available on request.

Acknowledgments

The authors would like to thank Norsepower for their cooperation and for providing insights that informed aspects of this research.

Conflicts of Interest

The authors declare no conflicts of interest. The funders had no role in the design of the study; in the collection, analyses, or interpretation of data; in the writing of the manuscript; or in the decision to publish the results.

Abbreviations

The following abbreviations are used in this manuscript:
EMSAEuropean Maritime Safety Agency
EU ETSEuropean Union Emissions Trading System
DWTDeadweight
IMOInternational Maritime Organization
GCRGreat Circle Route
GHGGreenhouse gas
GTGross tonnage
LOALength overall
MACCMarginal abatement cost curve
RoRoRoll on roll off
VLGCVery large gas carrier
VLOCVery large ore carrier
WASPWind-assisted ship propulsion

References

  1. European Parliament and Council. Regulation (EU) 2023/1805 on the Use of Renewable and Low-Carbon Fuels in Maritime Transport, and Amending Directive 2009/16/EC; European Union: Brussels, Belgium, 2023. Available online: https://eur-lex.europa.eu/eli/reg/2023/1805/oj (accessed on 16 December 2024).
  2. European Parliament and Council. Regulation (EU) 2023/1804 on the Deployment of Alternative Fuels Infrastructure, and Repealing Directive 2014/94/EU; European Union: Brussels, Belgium, 2023. Available online: https://eur-lex.europa.eu/eli/reg/2023/1804/oj (accessed on 6 January 2025).
  3. International Maritime Organization. Initial IMO Strategy on Reduction of GHG Emissions from Ships; IMO: London, UK, 2018; Available online: https://unfccc.int/sites/default/files/resource/250_IMO%20submission_Talanoa%20Dialogue_April%202018.pdf (accessed on 16 December 2024).
  4. International Maritime Organization. MEPC.203(62)—Amendments to the Annex of the Protocol of 1997 to Amend the International Convention for the Prevention of Pollution from Ships, 1973, as Modified by the Protocol of 1978 Relating Thereto; IMO: London, UK, 2011; Available online: https://wwwcdn.imo.org/localresources/en/KnowledgeCentre/IndexofIMOResolutions/MEPCDocuments/MEPC.203(62).pdf (accessed on 16 December 2024).
  5. International Maritime Organization. MEPC.328(76)—2021 Revised MARPOL Annex VI, Including Energy Efficiency Existing Ship Index (EEXI) and Carbon Intensity Indicator (CII); IMO: London, UK, 2021; Available online: https://wwwcdn.imo.org/localresources/en/KnowledgeCentre/IndexofIMOResolutions/MEPCDocuments/MEPC.328(76).pdf (accessed on 16 December 2024).
  6. International Maritime Organization. 2023 IMO Strategy on Reduction of GHG Emissions from Ships; IMO: London, UK, 2023; Available online: https://wwwcdn.imo.org/localresources/en/OurWork/Environment/Documents/annex/MEPC%2080/Annex%2015.pdf (accessed on 16 December 2024).
  7. Chou, T.; Kosmas, V.; Acciaro, M.; Renken, K. A Comeback of Wind Power in Shipping: An Economic and Operational Review on the Wind-Assisted Ship Propulsion Technology. Sustainability 2021, 13, 1883. [Google Scholar] [CrossRef]
  8. Bordogna, S.G.; Muggiasca, S.; Giappino, S.; Belloli, M.; Keuning, J.; Huijsmans, R. The Effects of Aerodynamic Interaction on the Performance of Two Flettner Rotors. J. Wind Eng. Ind. Aerodyn. 2020, 196, 104013. [Google Scholar] [CrossRef]
  9. Lindstad, E.; Stokke, T.; Alteskjær, A.; Borgen, H.; Sandaas, I. Ship of the Future—A Slender Dry-Bulker with Wind-Assisted Propulsion. Marit. Transp. Res. 2022, 3, 100055. [Google Scholar] [CrossRef]
  10. European Maritime Safety Agency (EMSA). Rotor Sail Technology Overview; EMSA: Lisbon, Portugal, 2024. Available online: https://www.emsa.europa.eu (accessed on 15 January 2025).
  11. Enercon. E-Ship 1 Fuel Savings Confirmed; Enercon: Aurich, Germany, 2010; Available online: https://www.enercon.de (accessed on 15 January 2025).
  12. Norsepower. Norsepower Rotor Sails Confirmed Savings of 8.2% Fuel and Associated CO2 in Maersk Pelican Project. 24 October 2019. Available online: https://www.norsepower.com/post/norsepower-rotor-sails-confirmed-savings-of-8-2-fuel-and-associated-co2-in-maersk-pelican-project/ (accessed on 15 January 2025).
  13. Norsepower. Technical Specifications of Rotor Sails; Norsepower: Helsinki, Finland, 2025; Available online: https://www.norsepower.com/product/ (accessed on 15 January 2025).
  14. Anemoi Marine Technologies. Technical Specifications of Rotor Sails; Anemoi: London, UK, 2025; Available online: https://www.anemoimarine.com (accessed on 15 January 2025).
  15. Traut, M.; Gilbert, P.; Walsh, C.; Bows, A.; Filippone, A.; Stansby, P.; Wood, R. Propulsive Power Contribution of a Kite and a Flettner Rotor on Selected Shipping Routes. Appl. Energy 2014, 113, 362–372. [Google Scholar] [CrossRef]
  16. Vahs, M. Retrofitting of Flettner Rotors—Results from Sea Trials of the General Cargo Ship “Fehn Pollux”. MariGREEN Project, 2020. Available online: https://www.researchgate.net/figure/Fehn-Pollux-outbound-for-sea-trials-Source-MariGREEN_fig1_357027644 (accessed on 15 January 2025).
  17. CE Delft; Tyndall Centre; Fraunhofer ISI; Chalmers University. Study on the Analysis of Market Potentials and Market Barriers for Wind Propulsion Technologies for Ships; CE Delft: Delft, The Netherlands, 2016; Available online: https://cedelft.eu/publications/study-on-the-analysis-of-market-potentials-and-market-barriers-for-wind-propulsion-technologies-for-ships/ (accessed on 15 January 2025).
  18. Bentin, M.; Zastrau, D.; Schlaak, M.; Freye, D.; Elsner, R.; Kotzur, S. A New Routing Optimization Tool: Influence of Wind and Waves on Fuel Consumption of Ships with and without Wind-Assisted Propulsion Systems. Transp. Res. Procedia 2016, 14, 153–162. [Google Scholar] [CrossRef]
  19. Insight Maker. Insight Maker: Web-Based Modeling and Simulation Tool, 2025. Available online: https://insightmaker.com/ (accessed on 6 January 2025).
  20. Elkafas, A.G. Advanced Operational Measure for Reducing Fuel Consumption Onboard Ships. Environ. Sci. Pollut. Res. 2022, 29, 90509–90519. [Google Scholar] [CrossRef] [PubMed]
  21. Anemoi Marine Technologies. Ultramax Bulker Vessel Installed with Rotor Sails Named 2018’s ‘Ship of the Year’. Anemoi News, 12 December 2019. Available online: https://anemoimarine.com/ultramax-bulker-vessel-installed-with-rotor-sails-named-2018s-ship-of-the-year/ (accessed on 15 January 2025).
  22. Berge Bulk. Berge Neblina Sets Sail with Four Carbon-Saving Rotor Sails. Berge Bulk News, 8 July 2024. Available online: https://www.bergebulk.com/berge-neblina-sets-sail-with-four-carbon-saving-rotor-sails/ (accessed on 15 January 2025).
  23. Anemoi Marine Technologies. Anemoi Completes Installation of Rotor Sails Onboard Vale VLOC in Largest Wind-Propulsion Project to Date. Anemoi News, 17 December 2024. Available online: https://anemoimarine.com/anemoi-completes-largest-wind-propulsion-project-to-date/ (accessed on 15 January 2025).
  24. Norsepower. Norsepower Unveils First Tiltable Rotor Sail Installation with Sea-Cargo Agreement. Norsepower News, 29 June 2020. Available online: https://www.norsepower.com/post/norsepower-unveils-first-tiltable-rotor-sail-installation-with-sea-cargo/ (accessed on 15 January 2025).
  25. Ferry Shipping News. Norsepower Will Install Rotor Sails on CLdN’s DELPHINE, World’s Largest Shortsea RoRo. Ferry Shipping News, 10 March 2022. Available online: https://ferryshippingnews.com/norsepower-will-install-rotor-sails-on-cldns-delphine-worlds-largest-shortsea-roro/ (accessed on 15 January 2025).
  26. Pitkänen, P. Viking Line Abandons Rotor Sail on Viking Grace after Test Period. Ilta-Sanomat, 28 April 2021. Available online: https://www.is.fi (accessed on 15 January 2025).
  27. Chambers, S. 325,000 dwt Giant Bulker Gets the Wind Rotor Treatment, Vale Keen on Further Sail Investments. Splash247, 14 May 2021. Available online: https://splash247.com/325000-dwt-giant-bulker-gets-the-wind-rotor-treatment-vale-keen-on-further-sail-investments/ (accessed on 15 January 2025).
  28. Dry Cargo International. Tufton’s Kamsarmax Bulker Installed with Anemoi Rotor Sails. Dry Cargo International, 11 October 2023. Available online: https://www.drycargomag.com/tuftons-kamsarmax-bulker-installed-with-anemoi-rotor-sails (accessed on 15 January 2025).
  29. SSPA Sweden AB. Speed Trial and Route Analysis of M/V Copenhagen with Flettner Rotor; SSPA Report No. RE40201042-01-00-B; SSPA Sweden AB: Gothenburg, Sweden, 2023; Available online: https://vb.northsearegion.eu/public/files/repository/20230505141934_RE40201042-01-revBCopenhagen.pdf (accessed on 15 January 2025).
  30. SSPA Sweden AB. Speed Trial and Route Analysis of M/V Annika Braren with Flettner Rotor; SSPA Report No. RE40201042-03-00-A; SSPA: Gothenburg, Sweden, 2021; Available online: https://vb.northsearegion.eu/public/files/repository/20220707112458_RE40201042-03-00-A.pdf (accessed on 15 January 2025).
  31. De Marco, A.; Mancini, S.; Pensa, C.; Calise, G.; De Luca, F. Flettner Rotor Concept for Marine Applications: A Systematic Study. Int. J. Rotating Mach. 2016, 2016, 3458750. [Google Scholar] [CrossRef]
  32. Comer, B.; Chen, C.; Stolz, D.; Rutherford, D. Rotors and Bubbles: Route-Based Assessment of Innovative Technologies to Reduce Ship Fuel Consumption and Emissions; Working Paper 2019-11; The International Council on Clean Transportation (ICCT): Washington, DC, USA, 2019; Available online: https://theicct.org/sites/default/files/publications/Rotors_and_bubbles_2019_05_12.pdf (accessed on 15 January 2025).
  33. Smith, T.; Newton, P.; Winn, G.; Rosa, A.G.L. Analysis Techniques for Evaluating the Fuel Savings Associated with Wind Assistance. In Proceedings of the 2013 Low Carbon Shipping Conference, London, UK, 9–10 September 2013. [Google Scholar]
  34. Lu, R.; Ringsberg, J.W. Ship energy performance study of three wind-assisted ship propulsion technologies including a parametric study of the Flettner rotor technology. Ships Offshore Struct. 2019, 15, 249–258. [Google Scholar] [CrossRef]
  35. Mason, J.; Larkin, A.; Bullock, S.; van der Kolk, N.; Broderick, J.F. Quantifying Voyage Optimisation with Wind Propulsion for Short-Term CO2 Mitigation in Shipping. Ocean Eng. 2023, 289, 116065. [Google Scholar] [CrossRef]
Figure 1. Rotor Sail Investment simulation model. Source (interactive simulation model): InsightMaker (2025).
Sustainability 17 05909 g001
Figure 2. Rotor sail performance—savings, rotor total trust, and LOA by vessel.
Sustainability 17 05909 g002
Figure 3. Results of single simulation run (annual costs and savings) with default values of different parameters (CO2 emission savings on). Denotation (y-axis): k = thousands; M = millions.
Sustainability 17 05909 g003
Figure 4. Results of single simulation run (cash flow–payback time graph) with default values of different parameters (CO2 emission savings on). Denotation (y-axis): M = millions.
Sustainability 17 05909 g004
Figure 5. Monte Carlo simulation (100 runs) of default values, where diesel consumption and interest rates alter as given in the model based on statistical distributions (CO2 emission savings on). Denotation (y-axis): M = millions.
Sustainability 17 05909 g005
Figure 6. Results of single simulation run (cash flow–payback time graph) with a small change in default values of different parameters (CO2 emission savings off; rotor sail diesel savings 5%). Denotation (y-axis): M = millions.
Sustainability 17 05909 g006
Table 1. Rotor sail installations across vessel types.
Vessel NameDWT, tRotor ProducerInstallation Type
TypeGross Tonnage (GT)NumberYear
Year BuiltLOA, mConfiguration, mFuel Savings, %
Afros64,000AnemoiRetrofit
Bulk carrier36,45242018
201820016 × 212.5
Alcyone50,000NorsepowerRetrofit
Tanker29,50722024
202218335 × 58
Annika Braren5023EcoFlettnerRetrofit
Bulk carrier299612021
20208718 × 32–4.5, max 15.0
Berge Neblina388,000AnemoiRetrofit
Bulk carrier195,19942024
201336135 × 58
Berlin4814NorsepowerRetrofit
Ferry22,31912022
201617030 × 5N/A 3
Buran11,861NorsepowerNewbuild
Tanker18,50022025
202515024 × 4N/A
Ex Dietrich Oldendorf/Chinook Oldendorf100,117NorsepowerRetrofit
Bulk carrier53,21932024
202023524 × 410–15
Camellia Dream206,863NorsepowerRetrofit
Bulk carrier108,11522024
201430035 × 5N/A
Cemcommander5876NorsepowerRetrofit
Cement carrier435122024
202411324 × 4N/A
Copenhagen4814NorsepowerRetrofit
Ferry22,31912020
201617030 × 54
Delphine27,687NorsepowerRetrofit
Ro-Ro74,27322023
201823435 × 57–10
E-Ship 110,020EnerconRetrofit
Ro-Lo12,96842010
201013027 × 425
Estraden9741NorsepowerRetrofit
Ro-ro18,20522015
199916318 × 36.1
Koryu53,762NorsepowerRetrofit
Combination carrier30,78412024
201319035 × 5N/A
Northern PathfinderN/ANorsepowerNewbuild
Gas carrier10,62712024
202413028 × 4N/A
Northern PioneerN/ANorsepowerNewbuild
Gas carrier10,62712024
202413028 × 4N/A
Oceanus Aurora58,551NorsepowerNewbuild
VLGC53,53122024
202323020 × 44
Sea Zhoushan325,000NorsepowerNewbuild
Bulk carrier173,66652021
202134024 × 48
SC Connector8843NorsepowerRetrofit
Ro-ro12,25122021
199715535 × 525
Sohar Max400,315AnemoiRetrofit
Bulk carrier201,75752024
201236035 × 56
TR Lady82,000AnemoiRetrofit
Bulk carrier44,64232023
201722924 × 510
Viking Grace6107NorsepowerRetrofit
Ferry57,56512018–2021 1
201321824 × 4231–315 2
Yodohime85,022NorsepowerRetrofit
Bulk carrier47,18112024
201622924 × 4N/A
Ex. Maersk Pelican/Timberwolf/N/A109,647NorsepowerRetrofit
Tanker61,72422018
200824530 × 58.2
1 Period with rotor; 2 tons fuel/year; 3 data not available.
Table 2. Example of variety of rotor sail performance results.
StudyNameNumber
Rotor Configuration, m
MethodologySavings, % Per Rotor
Route
Traut et al. (2014), [15]N/A
RoRo
7000
1
35 × 5
Numerical modeling and wind data analysis4 1/r
Dunkirk to
Dover
N/A
Product tanker
8000
14 1/r
London to Milford Haven
N/A
General cargo
5500
21 1/r
Varberg to Gillingham
N/A
Bulk carrier
50,000
5 1/r
Tubarao to Grimsby
N/A
Container ship
30,000
2 1/r
Yantian to Felixstowe
Bentin et al. (2016), [18]BBC Hudson4
25 × 4
Real-world wind and wave data collection, route optimization simulations, and WASP mathematical modeling36 1, 6 1/r
(Great Circle Route),
up to 53 1, 13 1/r
(optimized route),
14 1–28 1, 3.5 1–7 1/r
(reverse route)
Baltimore–Wilhelmshaven
General cargo
17,500
De Marco et al. (2016), [31]N/A
74,983
2
28 × 4
Numerical modelingup to 30 2, 15 2/r
Comer et al. (2019), [32]E-Ship 1see Table 1Route-based simulation approach, AIS data, and global meteorological data8.3 1 (2.1 1/r) at low
Portugal–Uruguay
47 1 (11.8 1/r) at high
The Netherlands–Portugal
Estraden 1.6 1 (0.8 1/r) at low
UK–The Netherlands
9.0 1(4.5 1/r) at high
UK–The Netherlands
Viking Grace 0.4 1/r at low
Sweden–Finland
2.8 1/r at high
Sweden–Finland
Maersk Pelican 1.8 1 (0.9 1/r) at low
Algeria–Singapore
4.7 1 (2.4 1/r) at high
South Korea–Spain
Fehn Pollux1
18 × 3
1.0 1/r at low
Italy–Algeria
6.6 1/r at high
Spain–Egypt
Lu et al. (2020), [34]N/A
100,000–120,000
1
18 × 3
Simulation model “ShipJourney”8.9 1/r
Cape Lopez, Gabon–Point Tupper, Canada
6.5 1/r
Angra dos Reis, Brazil–Rotterdam, The Netherlands
Mason et al. (2024), [35]N/A
N/A
80,000 DWT
4
35 × 5
Simulation using the VOIDS routing model and Blue Wasp’s Pelican performance model4.9–8.7 3/r at high
14 routes
1.0–4.9 3/r at low
14 routes
Smith et al. (2013), Chou et al. (2021), [7,33]N/A
Chemical tanker
10,000 DWT
N/AN/A10–50 1/n/a
Buenos Aires–WesternApproaches
N/A
Ro-Ro
7000 DWT
4 1/n/a
Dunkirk–Dover
Vahs (2021), [16]Fehn Pollux1
18 × 3 m
Sea trials and real-world performance testing5 1–20 1/r
North Sea
General cargo
4211 DWT
1996
1 Average power contribution from one Flettner rotor; 2 portion of ship resistance; 3 carbon savings.
Disclaimer/Publisher’s Note: The statements, opinions and data contained in all publications are solely those of the individual author(s) and contributor(s) and not of MDPI and/or the editor(s). MDPI and/or the editor(s) disclaim responsibility for any injury to people or property resulting from any ideas, methods, instructions or products referred to in the content.

