Article

Choosing Sustainable and Traditional Public Transportation Alternatives Using a Novel Decision-Making Framework Considering Passengers’ Travel Behaviors: A Case Study of Istanbul

by
Pelin Büşra Şimşek
1,
Akın Özdemir
1,*,
Selahattin Kosunalp
2 and
Teodor Iliev
3
1
Department of Industrial Engineering, Ondokuz Mayıs University, Samsun 55139, Türkiye
2
Department of Computer Technologies, Gönen Vocational School, Bandırma Onyedi Eylül University, Bandırma 10200, Türkiye
3
Department of Telecommunications, University of Ruse, 7017 Ruse, Bulgaria
*
Author to whom correspondence should be addressed.
Sustainability 2025, 17(13), 5904; https://doi.org/10.3390/su17135904
Submission received: 7 May 2025 / Revised: 2 June 2025 / Accepted: 24 June 2025 / Published: 26 June 2025
(This article belongs to the Special Issue Transportation and Infrastructure for Sustainability)

Abstract

A public transportation system consists of complex processes and requires comprehensive planning activities for a city when dealing with the travel behavior decisions of passengers. Travel behavior decisions are important in selecting suitable transportation alternatives for passengers. In the literature, little attention has been paid to prioritizing the criteria and ranking the alternatives for assessing sustainable and traditional public transportation modes when considering the travel behavior decisions of passengers. In this paper, a five-phased novel decision analysis framework, including Analytic Hierarchy Process (AHP), Technique for Order of Preference by Similarity to Ideal Solution (TOPSIS), and VIekriterijumsko KOmpromisno Rangiranje (VIKOR) techniques, is proposed to evaluate the alternatives. In addition, to the best of our knowledge, the novel decision-making framework in this paper has not been employed before to assess sustainable transportation alternatives dealing with the travel behavior decisions of passengers. Next, the thirteen criteria are specified, including economics, safety, travel quality, and environmental and health aspects, to analyze the travel behavior decisions of passengers with regard to the experts’ notions, published reports, and papers. Then, the seven public transportation alternatives are determined, including sustainable and traditional transportation modes. A case study was carried out in Istanbul, Türkiye. Based on the results, service frequency, the vehicle type and its mechanism, and ease of accessibility were found to be the top three significant criteria that affect travel behavior decisions. Furthermore, metro, Marmaray, and metrobus are the top three public transportation alternatives. In addition, the results were verified. Moreover, managerial and theoretical recommendations are provided to policymakers. Lastly, sustainable development goals 11.2 and 11.b can be achieved by designing an accessible, affordable, environmentally friendly, safe, and sustainable public transportation system when analyzing the travel behavior decisions of passengers.

1. Introduction

Nowadays, people spend an increasing amount of time in traffic, especially in metropolitan cities, which affects travel behavior decisions. The most effective method that municipalities can implement to prevent traffic problems and stampedes that grow with the time people spend on the road is offering public transportation options. For example, Istanbul, one of the metropolitan cities in the world, has a wide coverage of the public transportation network, serving a population of 15,701,602 people [1]. Also, 18.3% of the population of Türkiye lives in Istanbul [1]. Moreover, the population of Istanbul increased by 45,678 people compared to the previous year [1]. Based on this awareness, increasing public transportation options and making them available will benefit cities by preventing traffic problems. Also, the use of public transportation may deter people from using individual vehicles because of heavy traffic. Moreover, different public transportation modes can provide more options and lead more people to use public transportation, decreasing traffic accidents and time spent in traffic. In addition, environmental damage, such as carbon footprint and exhaust emissions, which increases with the increased use of individual vehicles, can be prevented using sustainable transportation modes.
A number of public transportation modes can provide access to more people and meet the transportation needs of more people from a social perspective. Another benefit of several public transportation modes is that public transportation will contribute to city planning. Moreover, better and more organized public transportation networks will contribute to the sustainable and effective planning of cities. When examining all the reasons, the increase in public transportation usage and the diversity of public transportation open up many opportunities to make life easier. So, evaluating sustainable and traditional public transportation modes is a crucial issue when analyzing the travel behavior decisions of passengers. In the literature, there is a research gap when it comes to addressing this issue dealing with passengers’ travel behaviors. Based on the framework of this study, municipalities may carry out various projects to expand, improve, and tighten their public transportation networks for sustainable cities.

1.1. Literature Review

The relevant studies of sustainable and public transportation mode selections are reviewed in this subsection as follows. Particularly, Yedla et al. [2] investigated the effect of involving qualitative criteria for the choice of transportation alternatives in Delhi. In addition, 4-stroke 2-wheelers, CNG cars, and CNG buses were ranked as the three transportation options associated with the six criteria: adaptability, barrier, cost, energy, environment, and technology. Next, Aydın and Kahraman [3] specified the criteria under three main economic, technological, and social categories to choose between nine buses with different features. They used the analytic hierarchy process (AHP) and VIekriterijumsko KOmpromisno Rangiranje (VIKOR) methods for this particular purpose. Along the same lines, Camargo Pérez et al. [4] provided a comprehensive review of published papers between 1982 and May 2014 dealing with the decision-making framework for the urban passenger transportation system, including design and operation issues. Then, Bai et al. [5] introduced a sustainable transportation fleet assessment framework dealing with economic, environmental, and different vehicle performance criteria. Also, they presented a hybrid approach to evaluate and select the sustainable transportation vehicle when integrating an interval grey number with a three-parameter using a rough set approach and the VIKOR technique. Afterward, Barbosa et al. [6] introduced a multi-criteria approach to evaluate urban public transportation based on the perceptions of users. Moreover, the objective and subjective parameters were specified associated with the notions of users for the integrated public transportation system in Florianópolis and other cities in Brazil. Next, Ercan et al. [7] examined the transportation mode selection behavior for public transportation ridership. They also highlighted that mode choice behavior was affected by gasoline fuel sale taxes. It should be noted that they did not use the decision-making theory in their study.
Sustainable transportation alternatives are significant for environmental and social aspects. Notably, Büyüközkan et al. [8] presented a research study focusing on the choice of public bus technologies for sustainable transportation options. They also applied an intuitionistic fuzzy Choquet integral with a decision-making technique. Next, Saplıoğlu and Aydın [9] implemented the AHP technique to examine survey data from four hundred sixty participants and determined the efficient parameters of safe and serviceable bicycle routes when integrating cycling and public transport. On the other hand, researchers have paid attention to advanced transportation modes. In particular, Lee [10] presented a decision-making framework to rank the alternative advanced transportation modes, such as bus rapid transit, light rail transit, and bimodal tram, for new towns in Korea. Furthermore, the insights were provided for urban public transportation in Korea. Then, Jasti and Ram [11] used the AHP with fuzzy logic framework and direct weighting techniques to integrate a priority-related weighting system into benchmarking the Mumbai metro rail system. Moreover, the performance of the Mumbai metro rail system was investigated for multimodal integration. After that, Nalmpantis et al. [12] used the AHP technique to determine the weights of the three criteria: feasibility, innovativeness, and utility for public transportation. Furthermore, they drew a conclusion about which of the innovations were important and acquired recommendations for more attractive public transport.
The integrated public transit system is a crucial parameter to enhance public transit efficiency and usage. Thus, Errampalli et al. [13] presented a methodology to evaluate three policies when combining metro and bus services in Delhi. They also examined sustainability indicators to calculate the integration level. Next, Seker and Aydin [14] used interval-valued intuitionistic fuzzy AHP and combinative distance-based assessment (CODAS) techniques to evaluate public transportation options, such as automated guideway transit, battery electric buses, personal rapid transit, and trams. Also, they presented a case study on campus for 36,000 users. Along the same lines, Alkharabsheh et al. [15] introduced a grey theory-based AHP to rank the criteria of supply quality of the public transportation system for a case study of Amman City, Jordan, when dealing with non-expert respondents. Also, fare, service quality, tractability, and transportation quality were specified as the four main criteria. Afterward, Dahlgren and Ammenberg [16] applied the multi-criteria method to various bus technologies in the Swedish case and evaluated buses based on biomethane, diesel, electricity, ethanol, hydrotreated vegetable oil, fatty acid methyl ester, and natural gas. Furthermore, Görçün [17] integrated the criteria importance through intercriteria correlation (CRITIC) and the evaluation based on distance from average solution (EDAS) techniques to assess choosing urban rail vehicles for the part of public transportation. Then, Romero-Ania et al. [18] combined the ELECTRE TRI and the DELPHI algorithms in order to evaluate and classify public buses. The alternatives were determined as diesel, diesel hybrid, GNC, induction electric, and plug-in electric, where the costs and emissions criteria were specified. Along the same lines, Canbulut et al. [19] studied the tramway selection problem for a public transportation firm in Türkiye. For this purpose, they used the AHP to obtain the weights of the specified nine criteria and the grey relationship analysis to determine the best alternative among eight options.
Recently, Çelikbilek et al. [20] adopted a grey model of the best–worst method, AHP, and multi-objective optimization ratio analysis for evaluating the Budapest public transportation system. Also, they concluded that acquiring new buses was the first alternative to enhance urban transportation quality. Then, Derbel and Boujelbene [21] developed an assessment model to enhance the competitiveness of public transportation operators. In addition, economic efficiency, effectiveness, financial efficiency, pertinence, and service quality were denoted as the performance criteria by the authors. Further, Zhang et al. [22] employed a unified prior evaluation technique for guiding public transportation planning activities without using observational data. Along the same lines, Borghetti et al. [23] proposed an integrated method with AHP, ELimination Et Choix Traduisant la REalitè I (ELECTRE I), and a simple weighted sum model (SWSM) for choosing alternative fuels for a bus fleet. They also consider cost, environment, and lifecycle criteria when presenting an Italian case study. Next, Dilian et al. [24] investigated the effects of public transportation on the health of older adults. Furthermore, Kundu et al. [25] suggested fuzzy-based best–worst and fuzzy-based multi-attribute ideal–real comparative analysis methods to assess six transportation alternatives, such as bus rapid transport, commuter trains, light rail trams, metro, public buses, and trams associated with eleven specified criteria when consulting experts. Moreover, Zehra and Wong [26] systematically reviewed the four areas, such as infrastructure, transportation modes, networks, and planning, for considering wildfire evacuations. Then, Aghaabbasi and Sabri [27] reviewed the potential of digital twin approaches to obtain a holistic travel behavior representation for supporting planning activities and policymaking. Further, Alhassan and Anciaes [28] examined the literature to evaluate the effects of public transportation investments or disinvestments based on economic and social levels. Next, Lyu et al. [29] analyzed the data from two hundred fifteen Chinese cities between 2013 and 2018 to investigate whether urban sprawl may impact carbon emissions and public transportation efficiency. Lastly, Nilsson et al. [30] examined the decision-making mobility of senior citizens dealing with public transportation in three metropolitan areas in Sweden, and they observed that senior citizens want to see less car traffic.
Table 1 summarizes the relevant literature studies. As observed in Table 1, this study covers the thirteen criteria, involving economics, safety, travel quality, and environmental and health aspects, when evaluating the seven sustainable and traditional public transportation modes. Moreover, the presented five-phased technique in this study is comprehensive and novel, including AHP, TOPSIS, and VIKOR.

1.2. Research Contributions and Objectives

Public transportation is a comprehensive and extensive process that involves many factors and requires much planning effort. This study aims to select public transportation modes based on the travel behavior decisions of passengers when providing efficiency and enhancing planning activities. Moreover, the contributions of this study are summarized as follows. First, most relevant research studies about public transportation use the AHP technique to prioritize the criteria involving economic and non-polluting aspects. This paper proposes an integrated multi-criteria decision-making process that includes AHP, Technique for Order of Preference by Similarity to Ideal Solution (TOPSIS), and VIKOR techniques. The AHP part is used to determine the weights of the criteria based on the travel behavior decisions of passengers for the public transportation mode selection problem. Also, the TOPSIS and VIKOR methods are applied to rank the alternative transportation modes. The comparison analyses are conducted. Secondly, the thirteen criteria are specified based on published reports, papers, and expert opinions to analyze passengers’ travel behavior decisions. The seven alternative public transportation options, including sustainable and traditional vehicles, are considered. Third, this study is performed in a megacity, including different types of transportation modes when discussing sustainable development goals (SDGs). In addition, theoretical and managerial implications are provided for the policymakers.
The remainder of this work is presented in the following way. First, the integrated decision-making holistic framework is proposed in Section 2 with the problem definition, criteria, and alternatives. Next, a case study of Istanbul, Türkiye, is presented in Section 3. Then, the managerial and theoretical implications of the public transportation mode selection problem are provided in Section 4. Lastly, concluding remarks and potential future studies are summarized in Section 5.

2. Problem Definition, Criteria, and Proposing an Integrated Multi-Criteria Decision-Making Method

2.1. Problem Definition

Cities are complicated spatial structures with infrastructures such as transportation systems. Significant transportation problems take place when transportation systems may not appropriately fulfill the necessities of urban mobility. Notably, public transportation systems are either over- or underused because of the passengers’ demand associated with the public transportation alternatives. For example, crowdedness may cause discomfort for passengers and affect travel behavior and the selection of transportation modes during peak hours. Hence, adequate transit infrastructure should be provided that is associated with passengers’ expectations. Moreover, the public transportation system may not generate adequate income to keep the operations and costs financially sustainable without considering passengers’ expectations and travel behavior decisions. Also, the financial burden should be considered by municipalities when investing in a public transportation system. For all these reasons, the selection of public transportation alternatives is a crucial problem in providing efficiency, decreasing costs, and reducing the environmental effect and traffic congestion when meeting the passengers’ needs. So, the decision-making framework is useful for selecting suitable transportation alternatives when investigating the travel behavior decisions of passengers.

2.2. Specified Criteria and Alternatives

When examining the travel behavior decisions of passengers to specify the criteria in this paper, the published reports and papers in the literature [2,3,4,5,6,7,8,9,10,11,12,13,14,15,16,17,18,19,20,21,22,23,24,25,26,27,28,29,30] were reviewed, and experts’ notions (five decision-makers) were asked. Thirteen criteria are specified in this paper when considering the published reports, papers, and experts’ notions. Also, Table 1 shows the differences between the previously published works and this study. In this paper, the decision-makers consist of five engineers working on transportation planning. Each decision-maker has at least two years of work experience. Also, each decision-maker has a bachelor of science degree.
The thirteen criteria are explained as follows:
Pricing (C1): This criterion is related to the economic aspect. Each public transportation alternative has a different fee, and the pricing varies according to the distance. In addition, the monthly subscription opportunity offered for vehicles used with Istanbul Card reduces the fee for each ride in the case study of this paper.
Speed (C2): This criterion is associated with the aspect of time management. Passengers want to reach a location in a minimum time, so the speed of the vehicle is an important criterion. Notice that some transportation options may be slow due to the technical requirements or transportation infrastructure.
Ease of accessibility (C3): This criterion is based on the infrastructure aspect of public transportation. Passengers desire to experience ease of accessibility and save time while using public transportation.
Number of transfers (C4): This criterion is related to the aspect of passengers’ travel behavior. Passengers desire to complete their ride with the fewest number of transfers while traveling. Although transfers sometimes provide benefits in terms of time, they may not be preferred in terms of cost.
Crowdedness (C5): This criterion is related to the aspect of passengers’ travel behavior. During peak hours, the efficiency and quality of public transportation decrease due to crowdedness. Operating vehicles at optimum capacity ensures better service.
Security (C6): This criterion is associated with the safety concern. Since public transportation brings many people together, passengers want to complete their trip safely against possible problems. Also, sufficient security measures can reduce crime rates in public transportation.
Air conditioning (C7): This criterion is relevant to the technical conditions of public transportation vehicles that affect the travel behavior of passengers. Air conditioning in public transportation includes heating, cooling, and ventilation operations. Air conditioning provides passengers with a comfortable environment, cleans the air inside, and provides a healthier travel opportunity.
Vehicle type and its mechanism (C8): This criterion denotes a technical concern of public transportation alternatives that impact the travel behavior of passengers. Different types of vehicles can be used in public transportation. Some passengers may not prefer to travel on buses or minibuses because of sudden braking or shaking, which causes nausea and inability to stand. Due to environmental awareness, some passengers may prefer sustainable transportation alternatives.
Service Quality (C9): This criterion is directly related to the quality of the service for passengers. Making the necessary announcements in the vehicle and informing about the next stop or the stops where transfers can be made increases the service quality.
Service frequency (C10): This criterion is related to the services that directly affect the passengers’ decisions. High service frequencies make public transportation more accessible for passengers by reducing waiting time.
Noise (C11): This criterion is related to health and environmental concerns. The noise of vehicles is not desirable for passengers. Also, high noise levels negatively affect human health and cause environmental noise pollution.
Service comfort (C12): This criterion is based on the service of the transportation alternative. Passengers desire to increase their comfort levels when using public transportation. For instance, seated passengers can travel safely in the case of sudden stops or movements of the vehicle. In addition, public transportation alternatives with seating areas for pregnant, elderly, and disabled individuals increase the accessibility of these individuals to public transport.
Phobia (C13): This criterion specifies a psychological effect of passengers’ travel behavior decisions. Some people may fear one of the public transportation modes, such as sea services, metro, etc. For these reasons, people may turn to different public transportation options.
Sustainable and traditional public transportation modes can be determined as various alternatives for evaluating the public transportation systems of cities when investigating the travel behavior decisions of passengers. In this case study, the seven alternatives—bus, ferry, Marmaray, metro, metrobus, minibus, and tram—are specified based on the serving population of the metropolitan city. Notice that a few alternatives, such as ferry and minibus, in the case study may not be valid in other urban cities. Moreover, it is essential to determine the appropriate alternatives for evaluating the public transportation system used by people in a city.

2.3. An Integrated Multi-Criteria Decision-Making Method

An integrated decision-making framework consists of five main phases: (1) planning, (2) AHP, (3) TOPSIS, (4) VIKOR, and (5) concluding phases. First of all, the planning phase includes determining the experts, criteria, and alternatives for the problem. Second, the AHP technique is applied to prioritize the specified criteria. The geometric mean is utilized as an aggregation operator in the AHP technique. Indeed, this aggregation approach is suitable for the meaning of judgments and priorities [31]. Also, surveys are conducted for passengers, asking about their preferences. Third, the TOPSIS method is employed to rank the specified alternatives. Fourth, the VIKOR method is also applied to rank the determined alternatives. Finally, the TOPSIS and VIKOR methods are compared, and managerial recommendations are drawn for policymakers. The details of the five main phases are provided below.
Phase 1: The planning phase. This phase consists of five sub-phases, and it includes defining the problem, determining the group of experts, determining the criteria, and determining the alternatives.
Phase 1.1. Start the planning phase.
Phase 1.2. Define the problem. The choice of public transportation modes is a significant problem in increasing efficiency, decreasing costs, and eliminating adverse environmental effects and traffic congestion when satisfying the passengers’ requirements.
Phase 1.3. Determine the group of experts. The decision-makers should be knowledgeable and experienced in the studied problem.
Phase 1.4. Determine the criteria based on the published papers, reports, and experts’ notions. The specified criteria reflect the economic, safety, travel quality, environmental, and health aspects of the problem to investigate the travel behavior decisions of passengers.
Phase 1.5. Specify the alternatives. The alternatives are determined based on public transportation modes serving the population of a city. Then, go to Phase 2.
Phase 2: The AHP and data collection phase. The second phase involves seven sub-phases, and it is related to how the AHP procedure is executed to obtain weights of the specified criteria. Moreover, data is collected by surveying passengers.
Phase 2.1. Begin the AHP method.
Phase 2.2. Generate pairwise comparison matrices (PCMs) for the kth decision-maker (DM) using Equation (1). Each decision-maker is asked about the preferences individually.
P C M k = ( 1 a 12 a 1 n a 21 = 1 / a 12 1 a 2 n a n 1 = 1 / a 1 n a n 2 = 1 / a 2 n 1 ) n × n
where a i j denotes the scale of importance between the i and j criteria.
Phase 2.3. Obtain an aggregated pairwise comparison matrix (APCM) using the geometric mean as follows.
A P C M = ( a g 11 = ( 1 1 × × 1 k ) 1 / k a g 12 = ( a 12 1 × × a 12 k ) 1 / k a g 1 n = ( a 1 n 1 × × a 1 n k ) 1 / k a g 21 = ( 1 / a 12 1 × × 1 / a 12 k ) 1 / k a g 22 = ( 1 1 × × 1 k ) 1 / k a g 2 n = ( a 2 n 1 × × a 2 n k ) 1 / k a g n 1 = ( 1 / a 1 n 1 × × 1 / a 1 n k ) 1 / k a g n 2 = ( 1 / a 2 n 1 × × 1 / a 2 n k ) 1 / k a g n n = ( 1 1 × × 1 k ) 1 / k ) n × n
where a g i j represents the geometric mean of each decision-maker’s scale of importance between the i and j criteria.
Phase 2.4. Normalize the APCM in the following way.
a g i j = a g i j / i = 1 n a g i j ( i , j = 1 , 2 , , n )
Phase 2.5. Find the ith criterion weight, w g t i , by taking the sum of each row of the normalized APCM and dividing it by the matrix size.
w g t i = ( 1 / n ) i = 1 n a g i j ( i , j = 1 , 2 , , n )
Phase 2.6. Check the consistency ratio (CR) as follows:
C R = C I / R I
C I = ( Principal   Eigen   Value n ) / ( n 1 )
where CI and RI denote the consistency index and random index, respectively. If the value of CR is less than or equal to 0.10, the APCM is consistent. Notice that Tavana et al. [32] expressed the RI values for the AHP technique.
Phase 2.7. Survey the passengers who frequently use public transportation, asking for public transportation preferences. Next, go to Phase 3.
Phase 3: The TOPSIS phase. This phase includes seven sub-phases. The mathematical equations and details of the TOPSIS procedure are provided to rank the alternatives.
Phase 3.1. Begin the TOPSIS method.
Phase 3.2. A multi-criteria decision analysis matrix (MCDAM) is obtained by using the collected data from the surveys as follows:
M C D A M = [ f i j ] n × m
where f i j denotes a collected value for the ith alternative on the jth criterion.
Phase 3.3. The normalized MCDAM is calculated as follows:
f n o r m a l i z e d i j = f i j i = 1 n f i j 2
where f n o r m a l i z e d i j denotes the normalized value.
Phase 3.4. The positive, abbreviated as Pideal, and negative, abbreviated as Nideal, ideal solutions are found in the following way.
P i d e a l = [ f n o r m a l i z e d 1 + , , f n o r m a l i z e d m + ] N i d e a l = [ f n o r m a l i z e d 1 , , f n o r m a l i z e d m ] where   f n o r m a l i z e d j + = { max   f n o r m a l i z e d i j   for   benefit min   f n o r m a l i z e d i j   for   cos t f n o r m a l i z e d j = { min   f n o r m a l i z e d i j   for   benefit max   f n o r m a l i z e d i j   for   cos t
Phase 3.5. The weighted Euclidean distances are obtained associated with the positive and negative ideal solutions, abbreviated as E p o s i + and E p o s i , respectively, below.
E p o s i + = j = 1 n w g t j ( f i j f n o r m a l i z e d j + ) 2 E p o s i = j = 1 n w g t j ( f i j f n o r m a l i z e d j ) 2
Phase 3.6. The ith total performance score (TPSi) is calculated for the ith alternative as follows:
T P S i = ( E p o s i ) ( E p o s i + E p o s i + )
Phase 3.7. The alternatives are ranked based on the TPSs. Then, go to Phase 4.
Phase 4: The VIKOR phase. This phase consists of six sub-phases. The mathematical equations and details of the VIKOR procedure are presented to rank the alternatives.
Phase 4.1. Begin the VIKOR method.
Phase 4.2. Use the MCDAM in Equation (7).
Phase 4.3. Pideal and Nideal are found for the VIKOR technique as follows.
P i d e a l i = max f i j   and   N i d e a l i = min f i j   ( i = 1 , 2 , , n   and   j = 1 , 2 , , m )
where Pideal and Nideal represent positive and negative ideal solutions, respectively.
Phase 4.4. Sj and Rj values are calculated in the following way.
S j = i = 1 n w g t i ( P i d e a l i f i j ) / ( P i d e a l i N i d e a l i ) R j = max i w g t i ( P i d e a l i f i j ) / ( P i d e a l i N i d e a l i )
Phase 4.5. Qj values are computed as follows:
Q j = q ( S j S + ) ( S + S + ) + ( 1 q ) ( R j S + ) ( R + R + ) where   S + = min i S j , S = max i S j , R + = min i R j , R = max i R j ,   and   0 q 1
Phase 4.6. The specified alternatives are ranked based on the ascending order of the values. Next, go to Phase 5.
Phase 5: The concluding phase. This phase involves four sub-phases. A conclusion is drawn in this phase when comparing the TOPSIS and VIKOR methods. Moreover, the results are validated by previous works and experts’ notions. Next, a sensitivity analysis is carried out to assess the stability and robustness of the presented case study. Furthermore, managerial insights are provided for policymakers.
Phase 5.1. Draw a conclusion when comparing the TOPSIS and VIKOR method results. This phase is important for providing theoretical recommendations about the methods because the different multi-criteria methods may give different results for a case study.
Phase 5.2. Verify the results from the published reports, papers, and experts’ notions.
Phase 5.3. Perform the sensitivity analysis. A sensitivity analysis is conducted to check the stability and robustness of the case study.
Phase 5.4. Provide managerial recommendations associated with the results for policymakers.

3. A Case Study of Istanbul

3.1. The Planning Phase of the Case Study

The public transportation network in Istanbul, Türkiye, is spread over an area of 5712 km2. It has a wide coverage area, including trams, metros, buses, minibuses, metrobuses, ferries, and Marmaray, serving a population of 15,701,602 people [1]. In this paper, a case study is performed for the public transportation in Istanbul, Türkiye. The five experts’ opinions are asked individually in online meetings to generate PCMs in the first week of January 2024, as shown in Table 2, Table 3, Table 4, Table 5 and Table 6. Also, surveys were conducted voluntarily and individually between January and August 2024 through online meetings with one thousand five hundred people living in Istanbul, Türkiye, who use public transportation. Figure 1 shows the flowchart of the proposed integrated decision-making framework. Moreover, Figure 2 shows the map of Istanbul, Türkiye [33].
The seven alternatives as part of the planning phase of the proposed methodology are determined for the case study in this paper as follows:
Bus (A1): It denotes one of the public transportation alternatives when using buses.
Ferry (A2): It represents passengers carried by a boat on a body of water.
Marmaray (A3): It denotes a 76.6-kilometre-long commuter rail line in Istanbul, Türkiye.
Metro (A4): It denotes rapid transit, a type of high-capacity public transport.
Metrobus (A5): It denotes a 52 km (32.3 mi) bus rapid transit route in Istanbul, Türkiye.
Minibus (A6): It represents one of the public transportation modes constructed to carry between 9 and 16 passengers.
Tram (A7): It denotes a type of urban rail transit.
Marmaray, metro, and tram provide sustainability and offer energy-efficient, low-emission alternatives while decreasing traffic congestion and air pollution. So, Marmaray, metro, and tram are defined as sustainable transportation modes. On the other hand, in this paper, buses, ferries, metrobuses, and minibuses are specified as traditional transportation modes.

3.2. Results and Discussion for Prioritizing the Thirteen Criteria Employing the AHP and Data Collection Phase

The AHP results are obtained using Phases 2.1–2.6 to prioritize the thirteen criteria. The PCMs are presented in Table 2, Table 3, Table 4, Table 5 and Table 6 for each decision-maker (DM) using Equation (1).
Next, the APCM in Equation (2) and the normalized APCM in Equation (3) are shown in Table 7 and Table 8. Further, Table 9 shows the weights of the thirteen criteria using Equation (4). The CR value was found to be 0.036 when employing Equations (5) and (6). The APCM is consistent since the CR value is less than 0.10. Hence, the obtained weights in Table 9 are valid for the thirteen criteria.
In Table 9, service frequency (C10) is the most important criterion when analyzing the travel behavior decisions of passengers. Based on the results, the passengers desired more frequent services for public transportation. Indeed, the finding is consistent with the previous studies by Mouwen [34] and Brechan [35]. However, Kundu et al. [25] stated that frequency is the fifth most crucial criterion among the other eleven criteria in their work. The results show that the passengers’ travel behaviors are significant in evaluating the public transportation system to satisfy passengers’ needs. Next, the vehicle type and its mechanism (C8) is the second important criterion from the passengers’ perspective. Note that passengers have paid attention to using sustainable transportation alternatives. Following this, ease of accessibility (C3) is the third significant criterion. Everyone can easily access the public transportation system. Also, the finding of the importance of the ease of accessibility criterion is in agreement with the study of Lee [10], Friman et al. [36], and Zhang et al. [22]. The pricing and the number of transfers are the fourth and fifth significant criteria, respectively. As indicated in the previous research by Brechan [35], the price reduction did not substantially affect the usage of the public transportation system. As shown in Table 9, the pricing criterion is not as important as the service frequency criterion. Also, the transfers should not be ignored in public transportation modes, as indicated by Errampalli et al. [13], and the weight of C4 verifies this statement. After this, noise is the sixth significant criterion in Table 9. Noise annoyance is a critical concern, and it should be reduced to increase the convenience of passengers. In addition, the finding of the vehicle noise is consistent with the previous study by Seker and Aydin [14] in terms of environmental awareness. Furthermore, security and air conditioning are the seventh and eighth crucial criteria, respectively. Then, service quality, speed, and crowdedness are obtained as the ninth, tenth, and eleventh substantial criteria. Also, these three criteria account for approximately 17% of the total weight and should not be ignored to satisfy passengers’ needs. Lastly, service comfort and phobia are found to be the least significant criteria for the public transportation system when dealing with passengers’ priorities.

3.3. Results and Discussion for Ranking the Seven Alternatives Using the TOPSIS and VIKOR Phases of the Proposed Methodology

In this paper, MCDAM using Equation (7) is obtained using the data collected from the participants. The participants were asked about their preferences for all criteria separately. For example, based on the first criterion, 310 participants prefer A1, 87 participants prefer A2, 121 participants prefer A3, 588 participants prefer A4, 302 participants prefer A5, 40 participants prefer A6, and 52 participants prefer A7. These values indicate the performance values for alternatives based on the criteria. Then, a 7 × 13 MCDAM was obtained with values.
The TOPSIS technique in Phases 3.1–3.7 was applied to rank the alternatives. For comparison purposes, the VIKOR technique was also utilized to sort the specified alternatives when employing Phases 4.1–4.6. Table 10 and Table 11 show the weighted normalized MCDAMs for the TOPSIS employing Equations (8)–(10) and VIKOR techniques using Equation (12), respectively. Furthermore, Table 12 and Table 13 present the results of the TOPSIS phase using Equation (11) and the VIKOR phase employing Equations (13) and (14).
According to Table 12, the metro is the first transportation system alternative based on the choices of passengers. Then, the second alternative is Marmaray. The first and second alternatives in Table 12 validate the importance of the rail transportation network when decreasing adverse environmental effects and traffic congestion. These findings are also verified by the study by Güzel and Alp [37] when considering environmental impacts, such as greenhouse gas (GHG) emissions. Also, some metro lines are operated at a service frequency of approximately every two and a half minutes [38]. Due to the high frequency of service, it is observed that the metro is selected as the first choice by the passengers as well. Next, the service frequency is approximately every two minutes for the metrobus lines [39]. Also, there are some advantages of using metrobuses over buses. Hence, the third alternative is the metrobus, as per the selection of passengers. Furthermore, the fourth alternative is the bus. Afterward, the ferry is the fifth public transportation alternative. Furthermore, the minibus is the sixth alternative. Finally, the tram is the last alternative to the public transportation system in this study.
Table 13 shows the VIKOR results for ranking the seven alternatives. Based on the VIKOR results, the alternatives are ranked as follows: metro (A4), Marmaray (A3), metrobus (A5), bus (A1), ferry (A2), minibus (A6), and tram (A7). Notice that VIKOR and TOPSIS rankings are the same for the alternatives. Therefore, the ranking of sustainable and traditional public transportation alternatives is verified by the methods, published reports, and papers.

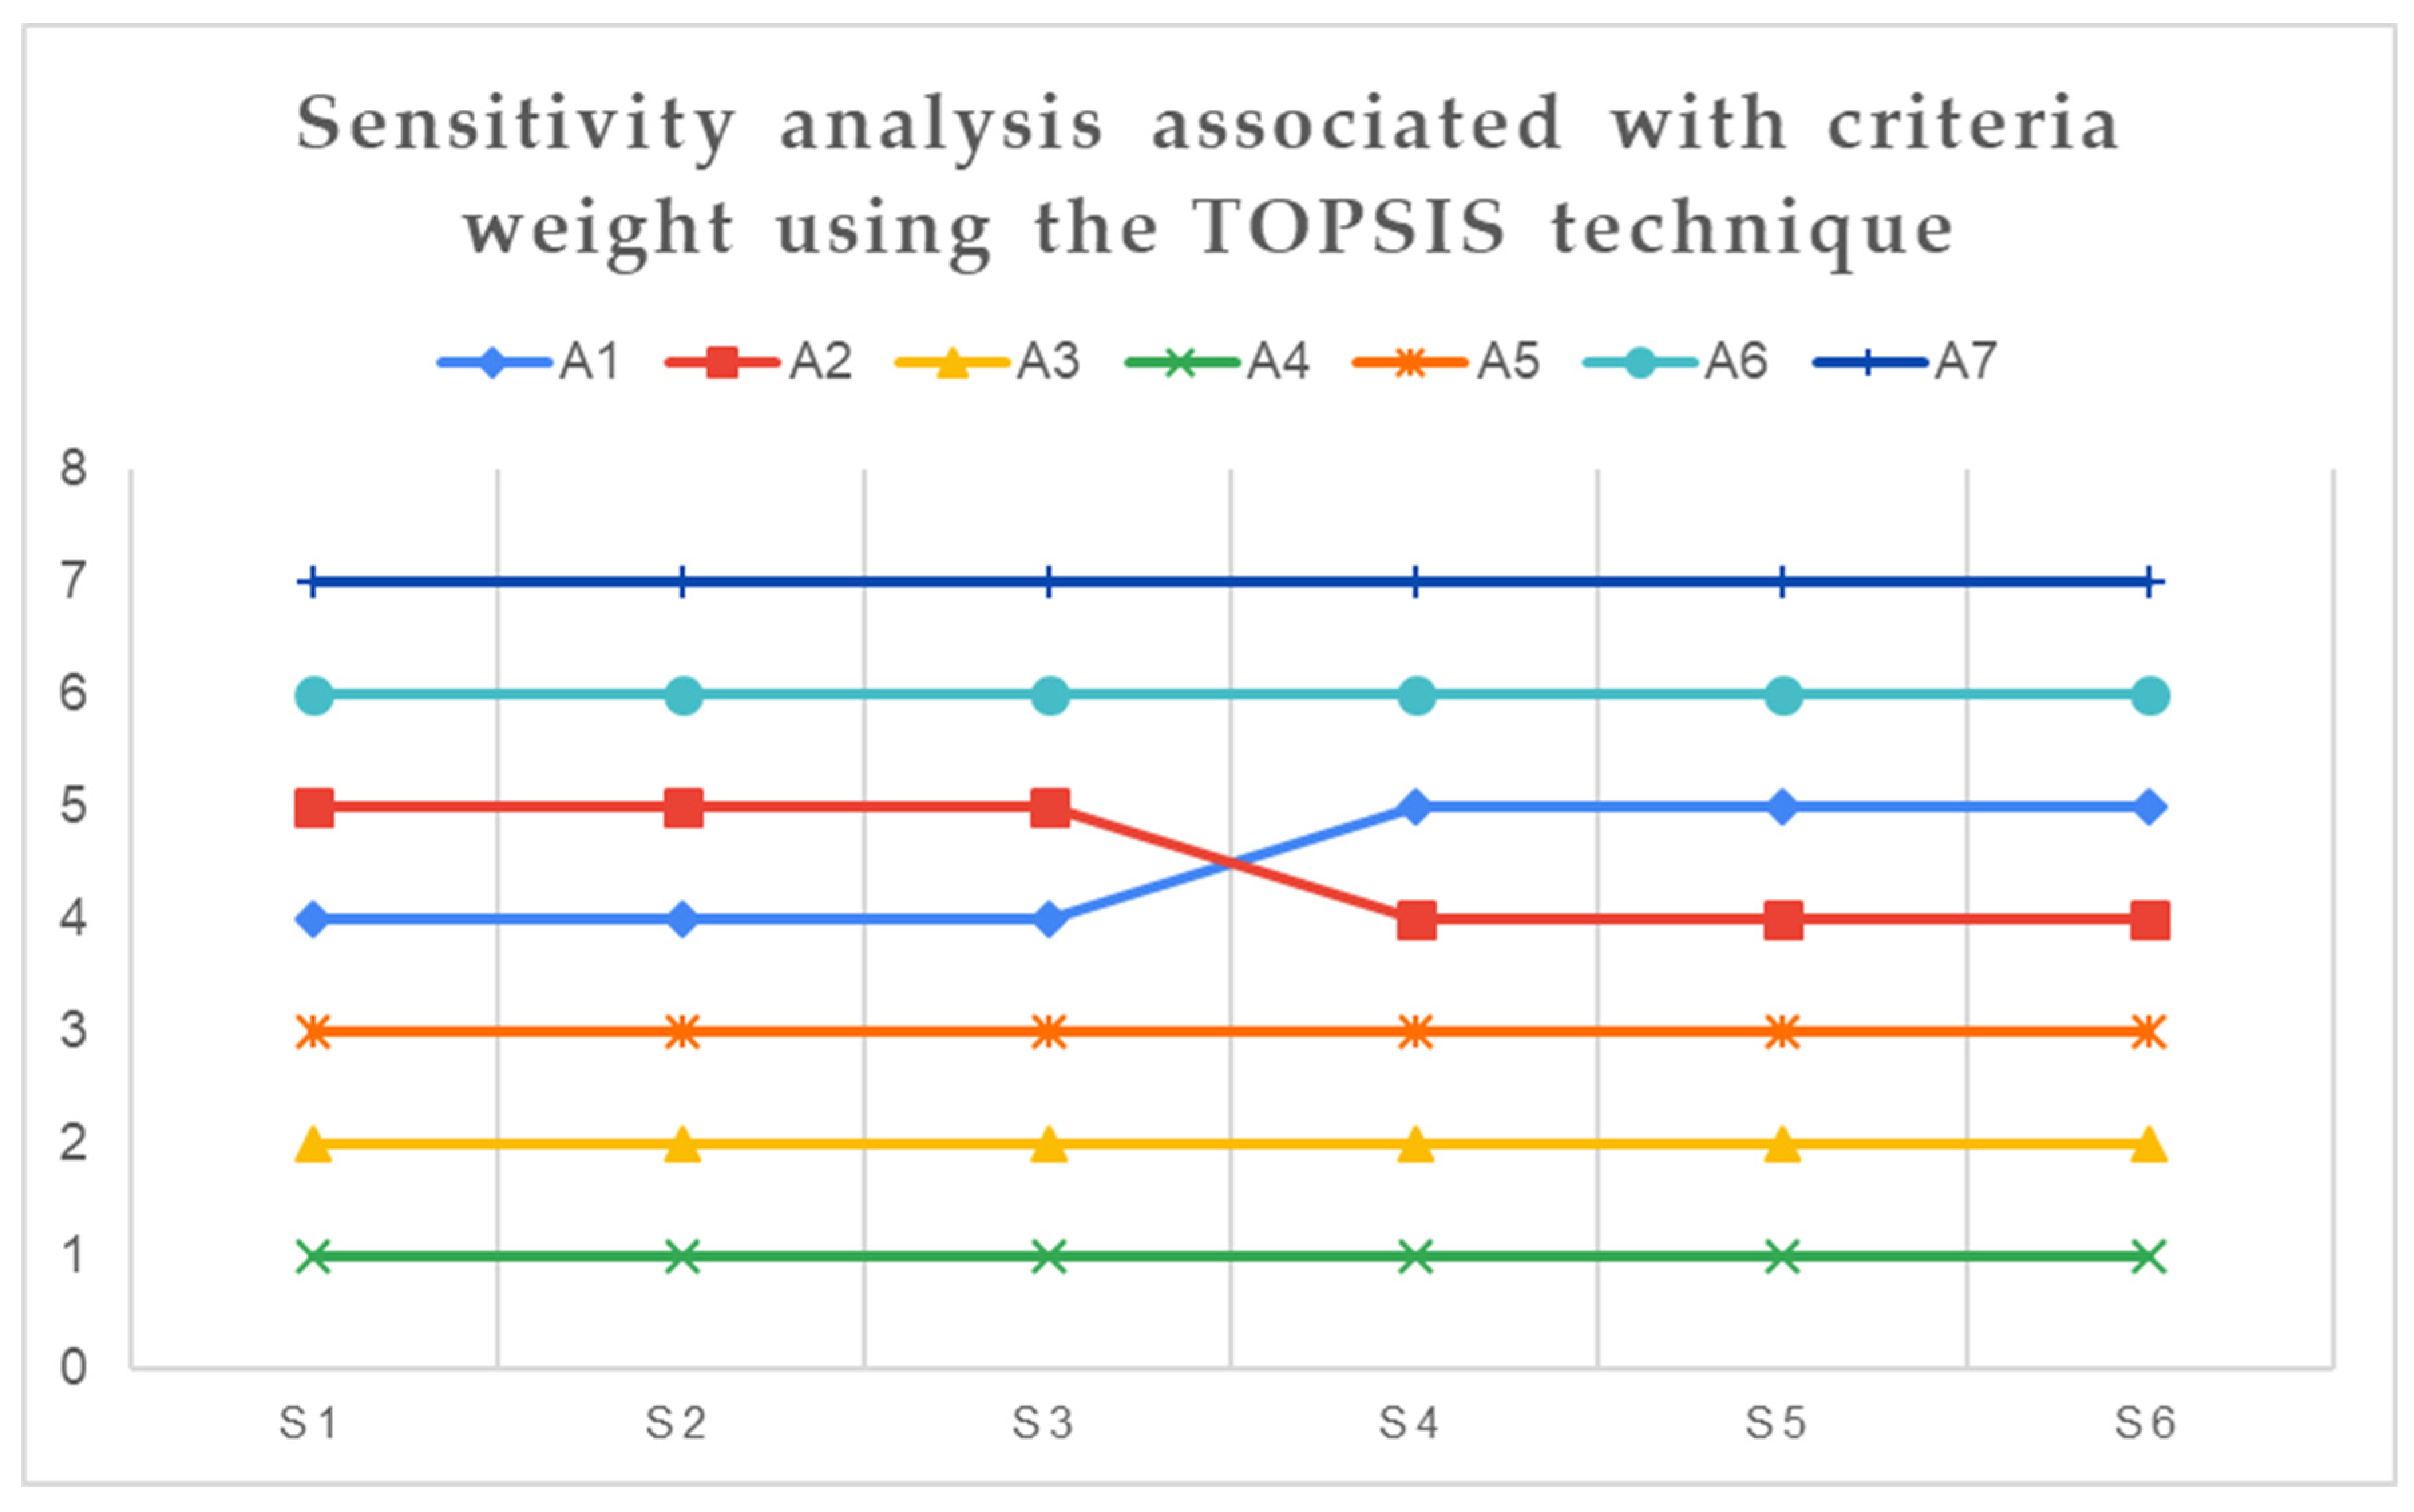
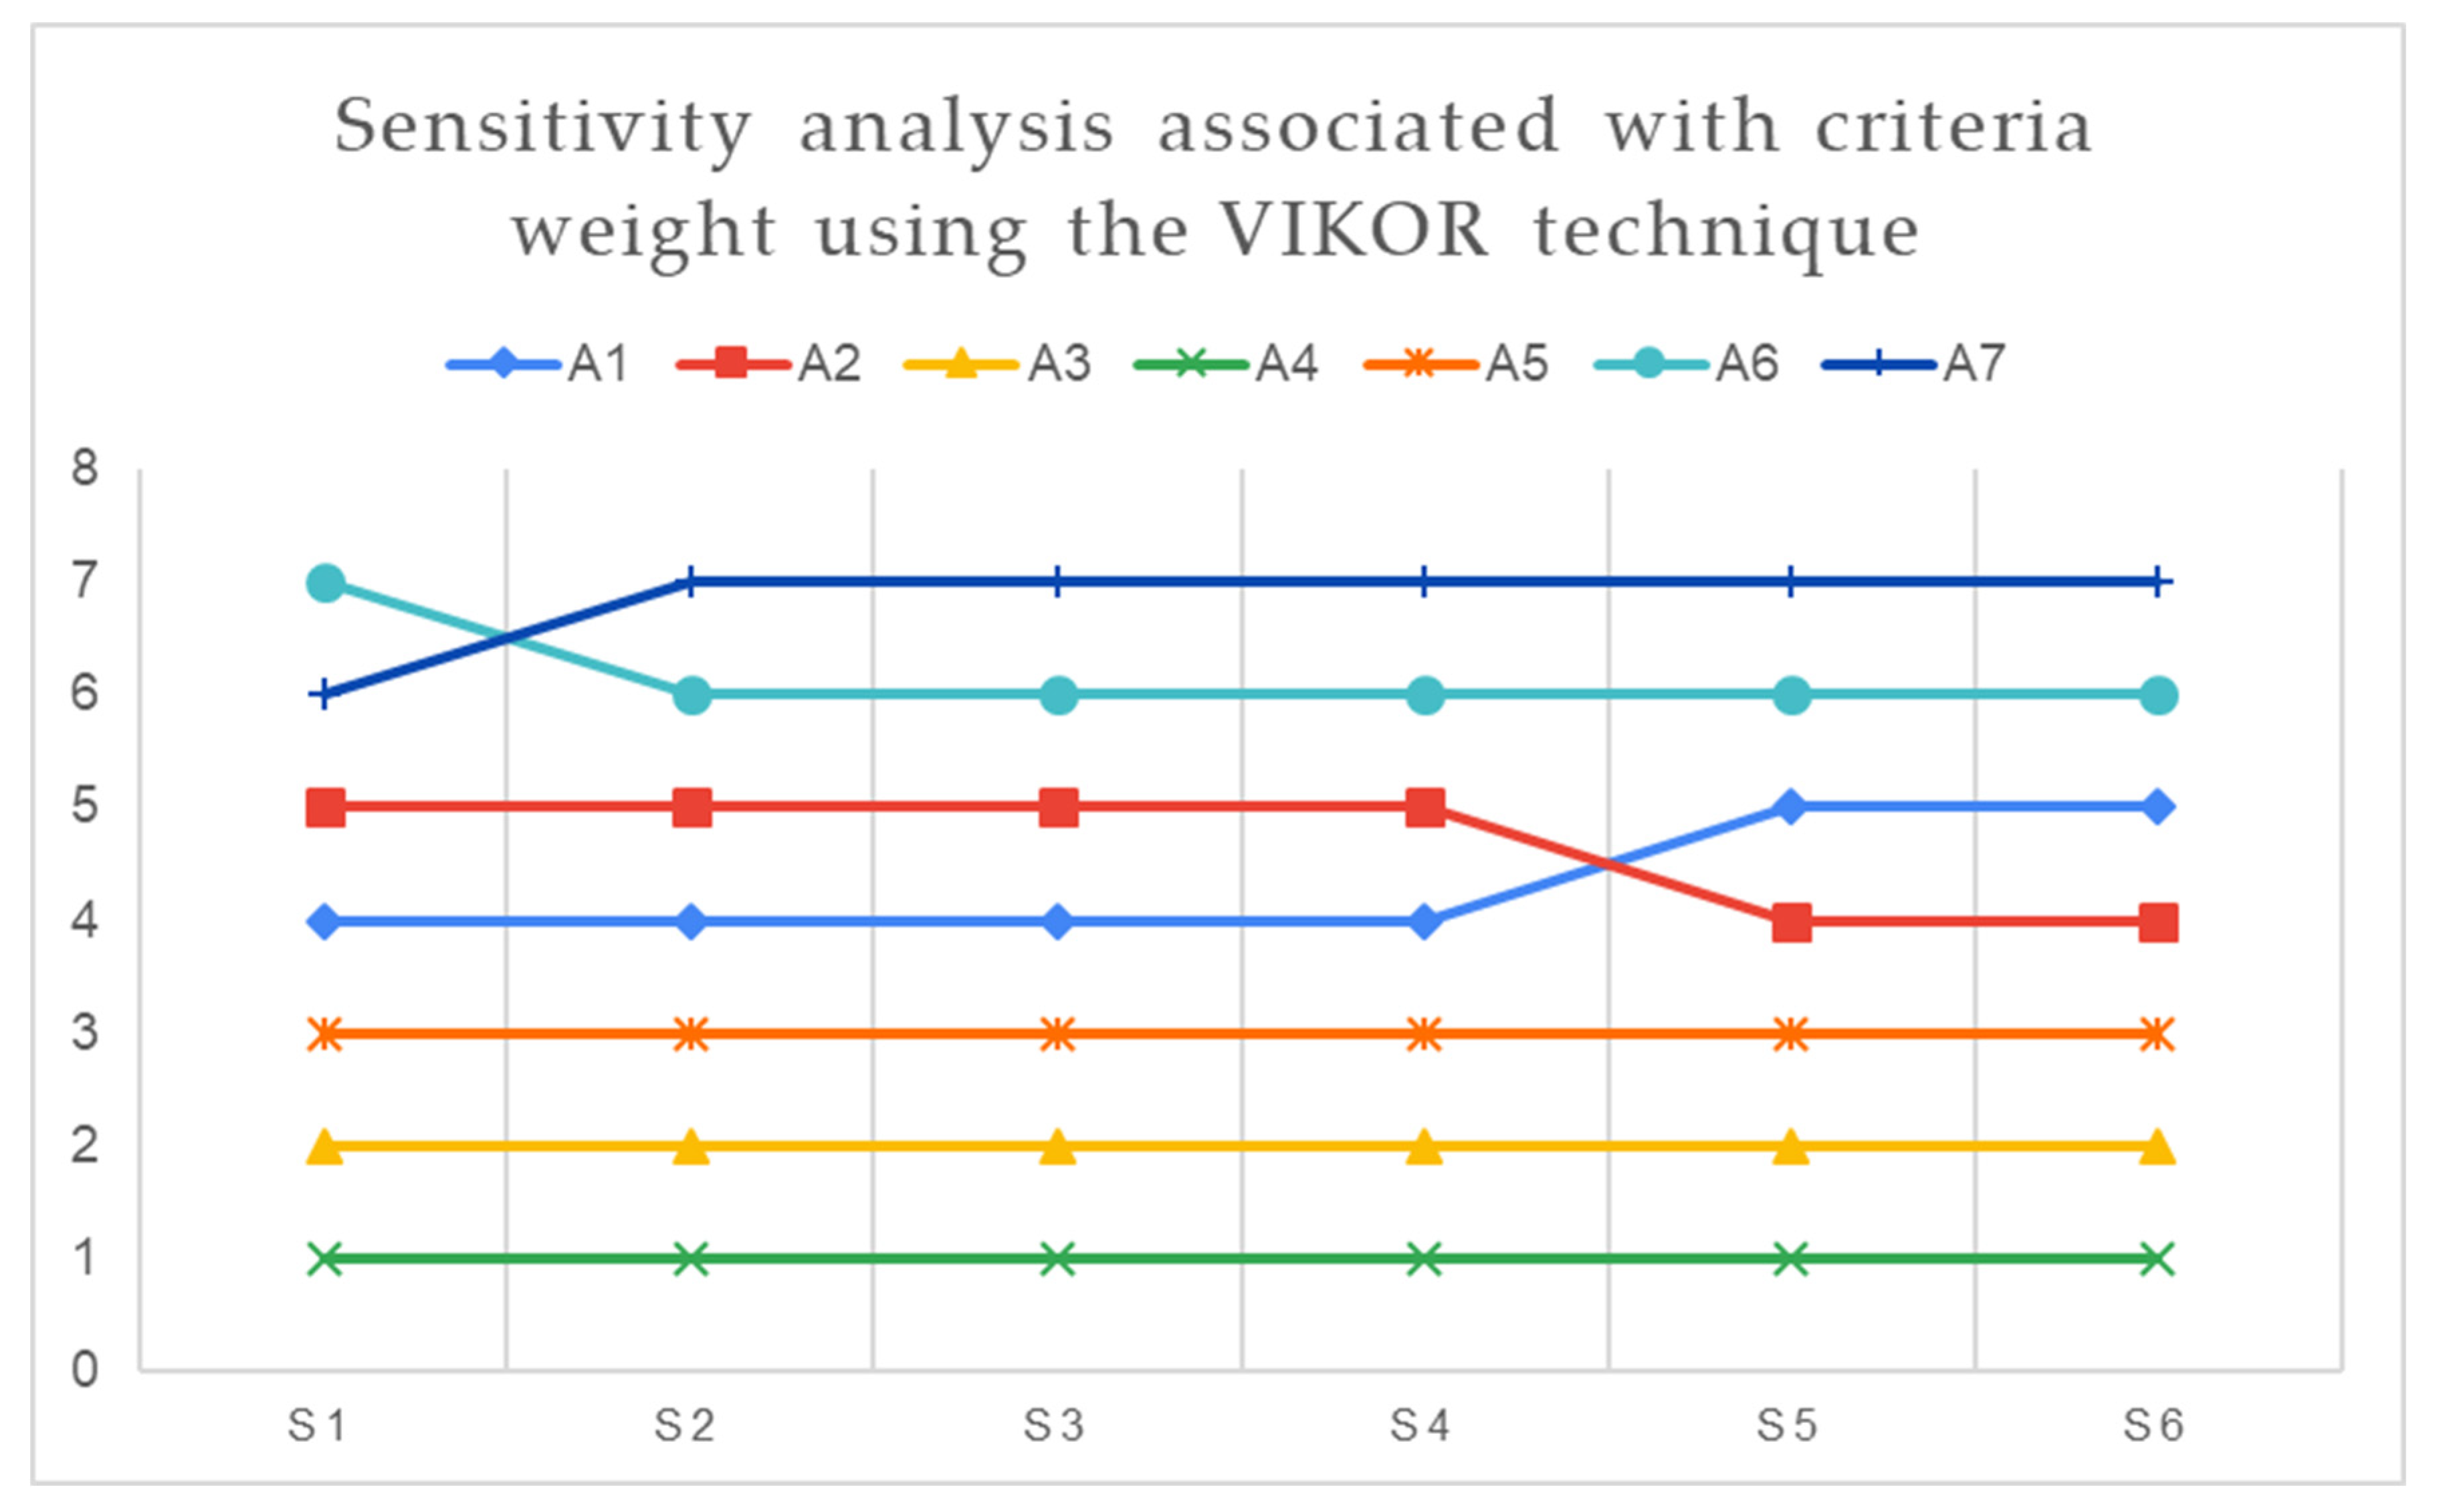
3.4. Sensitivity Analysis Using the Concluding Phase of the Proposed Methodology

The sensitivity analysis in this subsection is conducted with respect to the variation of the criteria weight [40,41]. The weight change limits, Δ x , are calculated between −0.129 and 0.871. Table 14 shows the new criteria weight with six different scenarios.
Figure 3 and Figure 4 show changes to the rankings using different criteria weights when performing the TOPSIS and VIKOR techniques. As shown in Figure 3 and Figure 4, very few alternatives changed when assigning different weights. Based on the results, the most important and the most sensitive criterion is the C10. It is also concluded that the first three rankings (metro, Marmaray, and metrobus) are the same for all scenarios when performing TOPSIS and VIKOR techniques. So, the stability and robustness results are provided for the three top-ranked alternatives.

4. Managerial Recommendations

Managerial recommendations are provided for policymakers associated with the results of this study when assessing sustainable and traditional public transportation modes. Based on the AHP results, the top three criteria are service frequency (C10), vehicle type and its mechanism (C8), and ease of accessibility (C3). These results indicate that transportation planning activities are crucial to meeting passengers’ expectations. The policymakers may focus on short-term and long-term planning activities for the public transportation system. Policymakers may plan daily operations based on the passengers’ behaviors, needs, and demands when increasing the frequency of service and accessibility of the public transportation system. Policymakers may also determine a pricing strategy when dealing with the number of transfers. When analyzing the TOPSIS and VIKOR methods, the top three rankings are metro (A4), Marmaray (A3), and metrobus (A5). The number of metro lines can be increased to satisfy passengers’ comfort and needs, so policymakers could make an investment program as a long-term strategy for building new metro lines.
Based on the results, passengers prefer sustainable public transportation alternatives. Indeed, the sustainable public transportation system may improve the economic growth and accessibility when negative environmental impacts are decreased and cities are provided with resilience. Sustainable transport-related sustainable development goals (SDGs) introduced by the UN [42] can be achieved based on the results of this study. Remarkably, the sustainable development goals (SDGs) 11.2 and 11.b can be achieved. Thus, an accessible, affordable, safe, and sustainable public transportation system can be designed in terms of the travel behavior decisions of passengers.
Theoretical recommendations are discussed as follows. The AHP method may suffer from the inconsistency ratio and may not be appropriate for some complex decision analysis problems. In this paper, there is no inconsistency concern, and the decision-making problem is suitable for generating PCMs when asking about notions of decision-makers. Many AHP applications use 7 ± 2 criteria in the literature [43]. However, the DMs are not confused or encounter any problems when generating PCMs for the thirteen criteria in this paper. Next, weights in the AHP method are used in TOPSIS. In addition, consistency is not checked using the TOPSIS method [43]. On the other hand, these situations are not concerns for the TOPSIS method. Further, the TOPSIS results are verified by using the VIKOR technique, as well as published reports and papers. The results are verified to rank the seven alternatives. Moreover, the stability and robustness of the results are provided by employing the sensitivity analysis regarding the variation of criteria weight.

5. Conclusions and Further Studies

A public transportation system is a complex and comprehensive process, including many parameters, and needs planning activities. In this paper, sustainable and traditional public transportation modes are evaluated in relation to the travel behavior decisions of passengers using the proposed integrated decision analysis framework. The findings of this study are summarized as follows:
A novel integrated five-phased decision analysis framework is introduced to prioritize the weights and rank the alternatives.
The thirteen criteria are specified using the five experts’ notions, published reports, and papers when dealing with the travel behavior decisions of passengers. Based on the AHP results, service frequency (C10), the vehicle type and its mechanism (C8), and ease of accessibility (C3) are the top three significant criteria. The findings are consistent with those of previous research.
The seven public transportation alternatives are determined, including sustainable and traditional ones. The top three alternatives are metro (A4), Marmaray (A3), and metrobus (A5) when applying the TOPSIS and VIKOR methods. Based on the results, passengers have paid attention to sustainable transportation alternatives due to the high service frequency and efficiency. The results also contribute to eliminating adverse environmental effects. Furthermore, the ranking is validated for this study.
Managerial insights are provided for policymakers. First of all, short-term and long-term planning activities may be determined by policymakers for the public transportation system. Second, policymakers may make a plan related to behaviors, needs, and demands when considering the service frequency and accessibility. Third, a suitable pricing strategy may be specified for the number of transfers. Fourth, new metro lines might be constructed by municipalities to satisfy the expectations of passengers.
The theoretical recommendations for the AHP, TOPSIS, and VIKOR methods are presented. In this paper, there are no theoretical concerns about the results. In addition, the sensitivity analysis is performed to check the stability and robustness of the results.
SDGs 11.2 and 11.b can be achieved when designing an accessible, affordable, environmentally friendly, safe, and sustainable public transportation system.
There could be possible extensions of this research. First, other multi-criteria decision analysis techniques could be employed for evaluating public transportation systems. Next, fuzzy set theory could be applied to integrate the proposed decision analysis framework when dealing with uncertainty. Then, the proposed methodology in this paper could be applied to other cities to evaluate their public transportation systems. However, some cities cannot have water transportation systems due to geography. So, in this case, the ferry alternative could be omitted, and others could be evaluated. Moreover, the proposed methodology relies on static expert and survey data. So, dynamic real-time data could be studied for further research.

Author Contributions

P.B.Ş. and A.Ö.: methodology; P.B.Ş. and A.Ö.: software; P.B.Ş., A.Ö., S.K., and T.I.: validation; P.B.Ş. and A.Ö.: investigation; P.B.Ş., A.Ö., S.K. and T.I.: writing—original draft preparation; P.B.Ş., A.Ö., S.K. and T.I.: writing—review and editing; P.B.Ş., A.Ö., S.K. and T.I.: visualization. All authors have read and agreed to the published version of the manuscript.

Funding

This study is partially financed by the European Union-NextGenerationEU through the National Recovery and Resilience Plan of the Republic of Bulgaria, project № BG-RRP-2.013-0001.

Institutional Review Board Statement

Not applicable.

Informed Consent Statement

Not applicable.

Data Availability Statement

Dataset available on request from the authors.

Conflicts of Interest

The authors declare no conflicts of interest.

References

  1. TUIK. Address-Based Population Registration System Results. 2025. Available online: https://data.tuik.gov.tr/Bulten/Index?p=Adrese-Dayali-Nufus-Kayit-Sistemi-Sonuclari-2024-53783 (accessed on 31 May 2025).
  2. Yedla, S.; Shrestha, R.M. Multi-criteria approach for the selection of alternative options for environmentally sustainable transport system in Delhi. Transp. Res. Part A Policy Pract. 2003, 37, 717–729. [Google Scholar] [CrossRef]
  3. Aydın, S.; Kahraman, C. Vehicle selection for public transportation using an integrated multi criteria decision making approach: A case of Ankara. J. Intell. Fuzzy Syst. 2014, 26, 2467–2481. [Google Scholar] [CrossRef]
  4. Camargo Pérez, J.; Carrillo, M.H.; Montoya-Torres, J.R. Multi-criteria approaches for urban passenger transport systems: A literature review. Ann. Oper. Res. 2015, 226, 69–87. [Google Scholar] [CrossRef]
  5. Bai, C.; Fahimnia, B.; Sarkis, J. Sustainable transport fleet appraisal using a hybrid multi-objective decision making approach. Ann. Oper. Res. 2017, 250, 309–340. [Google Scholar] [CrossRef]
  6. Barbosa, S.B.; Ferreira, M.G.G.; Nickel, E.M.; Cruz, J.A.; Forcellini, F.A.; Garcia, J.; de Andrade, J.B.S.O. Multi-criteria analysis model to evaluate transport systems: An application in Florianópolis, Brazil. Transp. Res. Part A Policy Pract. 2017, 96, 1–13. [Google Scholar] [CrossRef]
  7. Ercan, T.; Onat, N.C.; Tatari, O.; Mathias, J.D. Public transportation adoption requires a paradigm shift in urban development structure. J. Clean. Prod. 2017, 142, 1789–1799. [Google Scholar] [CrossRef]
  8. Büyüközkan, G.; Feyzioğlu, O.; Göçer, F. Selection of sustainable urban transportation alternatives using an integrated intuitionistic fuzzy Choquet integral approach. Transp. Res. Part D Transp. Environ. 2018, 58, 186–207. [Google Scholar] [CrossRef]
  9. Saplıoğlu, M.; Aydın, M.M. Choosing safe and suitable bicycle routes to integrate cycling and public transport systems. J. Transp. Health 2018, 10, 236–252. [Google Scholar] [CrossRef]
  10. Lee, D.J. A multi-criteria approach for prioritizing advanced public transport modes (APTM) considering urban types in Korea. Transp. Res. Part A Policy Pract. 2018, 111, 148–161. [Google Scholar] [CrossRef]
  11. Jasti, P.C.; Vinayaka Ram, V. Integrated and sustainable benchmarking of metro rail system using analytic hierarchy process and fuzzy logic: A case study of Mumbai. Urban Rail Transit 2019, 5, 155–171. [Google Scholar] [CrossRef]
  12. Nalmpantis, D.; Roukouni, A.; Genitsaris, E.; Stamelou, A.; Naniopoulos, A. Evaluation of innovative ideas for Public Transport proposed by citizens using Multi-Criteria Decision Analysis (MCDA). Eur. Transp. Res. Rev. 2019, 11, 22. [Google Scholar] [CrossRef]
  13. Errampalli, M.; Patil, K.S.; Prasad, C.S.R.K. Evaluation of integration between public transportation modes by developing sustainability index for Indian cities. Case Stud. Transp. Policy 2020, 8, 180–187. [Google Scholar] [CrossRef]
  14. Seker, S.; Aydin, N. Sustainable public transportation system evaluation: A novel two-stage hybrid method based on IVIF-AHP and CODAS. Int. J. Fuzzy Syst. 2020, 22, 257–272. [Google Scholar] [CrossRef]
  15. Alkharabsheh, A.; Moslem, S.; Oubahman, L.; Duleba, S. An integrated approach of multi-criteria decision-making and grey theory for evaluating urban public transportation systems. Sustainability 2021, 13, 2740. [Google Scholar] [CrossRef]
  16. Dahlgren, S.; Ammenberg, J. Sustainability assessment of public transport, part ii—Applying a multi-criteria assessment method to compare different bus technologies. Sustainability 2021, 13, 1273. [Google Scholar] [CrossRef]
  17. Görçün, Ö.F. Evaluation of the selection of proper metro and tram vehicle for urban transportation by using a novel integrated MCDM approach. Sci. Prog. 2021, 104, 0036850420950120. [Google Scholar] [CrossRef]
  18. Romero-Ania, A.; Rivero Gutiérrez, L.; De Vicente Oliva, M.A. Multiple criteria decision analysis of sustainable urban public transport systems. Mathematics 2021, 9, 1844. [Google Scholar] [CrossRef]
  19. Canbulut, G.; Köse, E.; Arik, O.A. Public transportation vehicle selection by the grey relational analysis method. Public Transp. 2022, 14, 367–384. [Google Scholar] [CrossRef]
  20. Çelikbilek, Y.; Moslem, S.; Duleba, S. A combined grey multi criteria decision making model to evaluate public transportation systems. Evol. Syst. 2023, 14, 1–15. [Google Scholar] [CrossRef]
  21. Derbel, A.; Boujelbene, Y. Performance classification of Tunisian public transport operators. Public Transp. 2023, 15, 535–574. [Google Scholar] [CrossRef]
  22. Zhang, L.; Liu, Y.; Li, S.; Chen, H.; Liu, Y. Evaluating public transport performance to guide public transport planning: A unified prior method. Travel Behav. Soc. 2023, 33, 100605. [Google Scholar] [CrossRef]
  23. Borghetti, F.; Carra, M.; Besson, C.; Matarrese, E.; Maja, R.; Barabino, B. Evaluating alternative fuels for a bus fleet: An Italian case. Transp. Policy 2024, 154, 1–15. [Google Scholar] [CrossRef]
  24. Dilian, O.; Beckers, C.; Witlox, F.; Davidovitch, N.; Martens, K. Examining the health effects of public transport use on older adults: A systematic review. J. Transp. Health 2024, 39, 101931. [Google Scholar] [CrossRef]
  25. Kundu, P.; Görçün, Ö.F.; Garg, C.P.; Küçükönder, H.; Çanakçıoğlu, M. Evaluation of public transportation systems for sustainable cities using an integrated fuzzy multi-criteria group decision-making model. Environ. Dev. Sustain. 2024, 26, 27655–27684. [Google Scholar] [CrossRef]
  26. Zehra, S.N.; Wong, S.D. Systematic review and research gaps on wildfire evacuations: Infrastructure, transportation modes, networks, and planning. Transp. Plan. Technol. 2024, 47, 1364–1398. [Google Scholar] [CrossRef]
  27. Aghaabbasi, M.; Sabri, S. Potentials of digital twin system for analyzing travel behavior decisions. Travel Behav. Soc. 2025, 38, 100902. [Google Scholar] [CrossRef]
  28. Alhassan, J.A.K.; Anciaes, P. Public transport investments as generators of economic and social activity. J. Transp. Health 2025, 41, 101989. [Google Scholar] [CrossRef]
  29. Lyu, S.; Huang, Y.; Sun, T. Urban sprawl, public transportation efficiency and carbon emissions. J. Clean. Prod. 2025, 489, 144652. [Google Scholar] [CrossRef]
  30. Nilsson, J.; Jansson, J.; Nicholas, K.; Zhao, C. Examining senior citizens’ in public transport: The role of digitalization, environmental concern, and traveler satisfaction. Travel Behav. Soc. 2025, 38, 100924. [Google Scholar] [CrossRef]
  31. Forman, E.; Peniwati, K. Aggregating individual judgments and priorities with the analytic hierarchy process. Eur. J. Oper. Res. 1998, 108, 165–169. [Google Scholar] [CrossRef]
  32. Tavana, M.; Soltanifar, M.; Santos-Arteaga, F.J. Analytical hierarchy process: Revolution and evolution. Ann. Oper. Res. 2023, 326, 879–907. [Google Scholar] [CrossRef]
  33. Google. The Google Maps. 2025. Available online: https://www.google.com/maps/place/%C4%B0stanbul/@41.1061466,28.936207,10.48z/ (accessed on 26 May 2025).
  34. Mouwen, A. Drivers of customer satisfaction with public transport services. Transp. Res. Part A Policy Pract. 2015, 78, 1–20. [Google Scholar] [CrossRef]
  35. Brechan, I. Effect of price reduction and increased service frequency on public transport travel. J. Public Transp. 2017, 20, 139–156. [Google Scholar] [CrossRef]
  36. Friman, M.; Lättman, K.; Olsson, L.E. Public transport quality, safety, and perceived accessibility. Sustainability 2020, 12, 3563. [Google Scholar] [CrossRef]
  37. Güzel, T.D.; Alp, K. Modeling of greenhouse gas emissions from the transportation sector in Istanbul by 2050. Atmos. Pollut. Res. 2020, 11, 2190–2201. [Google Scholar] [CrossRef]
  38. IETT. Railway Station Transportation in Istanbul. 2024. Available online: https://iett.istanbul/icerik/Railway-Station-Transportation (accessed on 2 January 2025).
  39. IETT. Metrobus in Istanbul. 2024. Available online: https://iett.istanbul/icerik/Metrobus (accessed on 2 January 2025).
  40. Yazdani, M.; Chatterjee, P.; Pamucar, D.; Abad, M.D. A risk-based integrated decision-making model for green supplier selection: A case study of a construction company in Spain. Kybernetes 2020, 49, 1229–1252. [Google Scholar] [CrossRef]
  41. Więckowski, J.; Sałabun, W. Sensitivity analysis approaches in multi-criteria decision analysis: A systematic review. Appl. Soft Comput. 2023, 148, 110915. [Google Scholar] [CrossRef]
  42. UN. Sustainable Transport. 2024. Available online: https://sdgs.un.org/topics/sustainable-transport (accessed on 22 December 2024).
  43. Shih, H.S.; Shyur, H.J.; Lee, E.S. An extension of TOPSIS for group decision making. Math. Comput. Model. 2007, 45, 801–813. [Google Scholar] [CrossRef]
Figure 1. The flowchart of the proposed integrated decision-making framework.
Sustainability 17 05904 g001
Figure 2. Map of Istanbul, Türkiye [33].
Sustainability 17 05904 g002
Figure 3. Changes to the rankings of the seven alternatives with the TOPSIS technique.
Sustainability 17 05904 g003
Figure 4. Changes to the rankings of the seven alternatives with the VIKOR technique.
Sustainability 17 05904 g004
Table 1. Brief literature review on public transportation selection.
Studied byCriteriaAlternativesTechniques
Yedla et al. [2]Both qualitative and quantitative criteria4-stroke 2-wheelers, CNG cars, and CNG buses Multi-criteria approach
Aydın and Kahraman [3]Economic, technological, and social categories Nine buses with different featuresAHP and VIKOR
Bai et al. [5]Economic, environmental, and different vehicle performance criteriaTransport vehicle fleet (ten vehicles with different attributes)A rough set approach and VIKOR
Büyüközkan et al. [6] Economical, technical, environmental, and socialPublic bus technologiesIntuitionistic fuzzy Choquet integral with a decision-making technique
Saplıoğlu and Aydın [9] Parameters for bicycle route selectionSafe and serviceable bicycle routes when integrating cycling and public transportAHP
Lee [10] Provider and user as main criteria for metropolis and small- and medium-scale citiesA railway-type public transport, a dual mode of tram and bus, and a bus transit systemA multi-criteria approach
Jasti and Ram [11]Performance indicatorsMetro rail systemAHP and fuzzy logic
Nalmpantis et al. [12]Feasibility, utility, and innovativenessFour lists of innovations were derived and ranked.AHP
Errampalli et al. [13]Economic, social, and environmentalMetro rail and busMulti-criteria analysis
Seker and Aydin [14]Economic, environmental, usage, safety, and technical conditionsAutomated guideway transit, battery electric buses, personal rapid transit, and tramsInterval-valued intuitionistic fuzzy AHP and CODAS
Alkharabsheh et al. [15]The criteria of supply quality of the public transportation systemRank the criteria of supply quality of the public transportation system. A grey theory-based AHP
Dahlgren and Ammenberg [16]The costs and emissions criteria Bus technologiesA multi-criteria method
Görçün [17]Performance indicators for twenty-two criteriaUrban rail vehiclesCRITIC and EDAS
Romero-Ania et al. [18]The costs and emissions criteria Classify public buses.ELECTRE TRI and DELPHI
Canbulut et al. [19]Performance indicators for nine criteriaTramway selectionAHP and grey relationship analysis
Çelikbilek et al. [20]Performance indicatorsBusesA grey model of the best–worst method, AHP, and multi-objective optimization ratio
Borghetti et al. [23]Cost, environment, and lifecycle criteriaAlternative fuels for a bus fleetAHP, ELECTRE I, and SWSM
Kundu et al. [25]Eleven specified criteriaBus rapid transport, commuter trains, light rail trams, metro, public buses, and tramsFuzzy-based best–worst and fuzzy-based multi-attribute ideal–real comparative analysis methods
This studyThe thirteen specified criteria, including economics, safety, travel quality, and environmental and health aspectsThe seven public transportation alternatives, including sustainable and traditional transportation modesA five-phased novel decision analysis framework, including AHP, TOPSIS, and VIKOR
Table 2. The PCM for the first DM.
Criteria
DM112345678910111213
11.0002.0000.5000.5000.5002.0001.0001.0002.0000.5002.0001.0002.000
20.5001.0000.3330.3330.3331.0000.5000.5001.0000.3331.0000.5001.000
32.0003.0001.0001.0001.0003.0002.0002.0003.0001.0003.0002.0003.000
42.0003.0001.0001.0001.0003.0002.0002.0003.0001.0003.0002.0003.000
52.0003.0001.0001.0001.0003.0002.0002.0003.0001.0003.0002.0003.000
60.5001.0000.3330.3330.3331.0000.5000.5001.0000.3331.0000.5001.000
71.0002.0000.5000.5000.5002.0001.0001.0002.0000.5002.0001.0002.000
81.0002.0000.5000.5000.5002.0001.0001.0002.0000.5002.0001.0002.000
90.5001.0000.3330.3330.3331.0000.5000.5001.0000.3331.0000.5001.000
102.0001.0001.0001.0001.0003.0002.0002.0003.0001.0003.0001.0003.000
110.5001.0000.3330.3330.3331.0000.5000.50011.0000.3331.0000.5001.000
121.0002.0000.5000.5000.5002.0001.0001.0002.0001.0002.0001.0002.000
130.5001.0000.3330.3330.3331.0000.5000.5001.0000.3331.0000.5001.000
Table 3. The PCM for the second DM.
Criteria
DM212345678910111213
11.0001.0001.0001.0005.0005.0009.0005.0007.0001.0007.0007.0007.000
21.0001.0001.0001.0005.0005.0009.0005.0007.0001.0007.0007.0007.000
31.0001.0001.0001.0005.0005.0009.0005.0007.0001.0007.0007.0007.000
41.0001.0001.0001.0001.0005.0009.0005.0007.0001.0007.0007.0007.000
50.2000.2000.2001.0001.0001.0005.0001.0003.0000.2003.0003.0003.000
60.2000.2000.2000.2001.0001.0005.0001.0003.0000.2003.0003.0003.000
70.1110.1110.1110.1110.2000.2001.0000.2000.3330.1110.3330.3330.333
80.2000.2000.2000.2001.0001.0005.0001.0003.0000.2003.0003.0003.000
90.1430.1430.1430.1430.3330.3333.0000.3331.0000.1431.0001.0001.000
101.0001.0001.0001.0005.0005.0009.0005.0007.0001.0007.0007.0007.000
110.1430.1430.1430.1430.3330.3333.0000.33311.0000.1431.0001.0001.000
120.1430.1430.1430.1430.3330.3333.0000.3331.0000.1431.0001.0001.000
130.1430.1430.1430.1430.3330.3333.0000.3331.0000.1431.0001.0001.000
Table 4. The PCM for the third DM.
Criteria
DM312345678910111213
11.0001.0000.2500.2004.0000.2500.3330.2000.2000.2000.2000.3330.250
21.0001.0000.2500.2004.0000.2500.3330.2000.2000.2000.2000.3330.250
34.0004.0001.0000.5007.0001.0002.0000.5000.5000.5000.5002.0001.000
45.0005.0002.0001.0008.0002.0003.0001.0001.0001.0001.0003.0002.000
50.2500.2500.1430.1251.0000.1430.1670.1250.1250.1250.1250.1670.143
64.0004.0001.0000.5007.0001.0002.0000.5000.5000.5000.5002.0001.000
73.0003.0000.5000.3336.0000.5001.0000.3330.3330.3330.3331.0000.500
85.0005.0002.0001.0008.0002.0003.0001.0001.0001.0001.0003.0002.000
95.0005.0002.0001.0008.0002.0003.0001.0001.0001.0001.0003.0002.000
105.0002.0002.0001.0008.0002.0003.0001.0001.0001.0001.0003.0002.000
115.0005.0002.0001.0008.0002.0003.0001.00011.0001.0001.0003.0002.000
123.0003.0000.5000.3336.0000.5001.0000.3330.3330.3330.3331.0000.500
134.0004.0001.0000.5007.0001.0002.0000.5000.5000.5000.5002.0001.000
Table 5. The PCM for the fourth DM.
Criteria
DM412345678910111213
11.0002.0001.0001.0001.0001.0001.0001.0001.0001.0001.0004.0006.000
20.5001.0000.5000.5000.5000.5000.5000.5000.5000.5000.5003.0005.000
31.0002.0001.0001.0001.0001.0001.0001.0001.0001.0001.0004.0006.000
41.0002.0001.0001.0001.0001.0001.0001.0001.0001.0001.0004.0006.000
51.0002.0001.0001.0001.0001.0001.0001.0001.0001.0001.0004.0006.000
61.0002.0001.0001.0001.0001.0001.0001.0001.0001.0001.0004.0006.000
71.0002.0001.0001.0001.0001.0001.0001.0001.0001.0001.0004.0006.000
81.0002.0001.0001.0001.0001.0001.0001.0001.0001.0001.0004.0006.000
91.0002.0001.0001.0001.0001.0001.0001.0001.0001.0001.0004.0006.000
101.0001.0001.0001.0001.0001.0001.0001.0001.0001.0001.0004.0006.000
111.0002.0001.0001.0001.0001.0001.0001.00011.0001.0001.0004.0006.000
120.2500.3330.2500.2500.2500.2500.2500.2500.2500.2500.2501.0003.000
130.1670.2000.1670.1670.1670.1670.1670.1670.1670.1670.1670.3331.000
Table 6. The PCM for the fifth DM.
Criteria
DM512345678910111213
11.0005.0005.0006.0005.0004.0002.0001.0005.0003.0005.0004.0005.000
20.2001.0001.0002.0001.0000.5000.2500.2001.0000.3331.0000.5001.000
30.2001.0001.0002.0001.0000.5000.2500.2001.0000.3331.0000.5001.000
40.1670.5000.5001.0000.5000.3330.2000.1670.5000.2500.5000.3330.500
50.2001.0001.0002.0001.0000.5000.2500.2001.0000.3331.0000.5001.000
60.2502.0002.0003.0002.0001.0000.3330.2502.0000.5002.0001.0002.000
70.5004.0004.0005.0004.0003.0001.0000.5004.0002.0004.0003.0004.000
81.0005.0005.0006.0005.0004.0002.0001.0005.0003.0005.0004.0005.000
90.2001.0001.0002.0001.0000.5000.2500.2001.0000.3331.0000.5001.000
100.3333.0003.0004.0003.0002.0000.5000.3333.0001.0003.0002.0003.000
110.2001.0001.0002.0001.0000.5000.2500.20011.0000.3331.0000.5001.000
120.2502.0002.0003.0002.0001.0000.3330.2502.0000.5002.0001.0002.000
130.2001.0001.0002.0001.0000.5000.2500.2001.0000.3331.0000.5001.000
Table 7. The APCM.
Table 7. The APCM.
Criteria
APCM12345678910111213
11.0001.8210.9100.9032.1871.5851.4311.0001.6950.7861.6952.0632.537
20.5491.0000.5300.5821.2720.7920.7150.5490.9310.4070.9311.1181.543
31.0991.8881.0001.0002.0361.4961.5521.0001.6000.6991.6002.2372.631
41.1081.7191.0001.0001.3201.5851.6091.1081.6000.7581.6002.2372.631
50.4570.7860.4910.7581.0000.7350.8390.5491.0240.3841.0241.1491.505
60.6311.2620.6680.6311.3611.0001.1080.5741.2460.4411.2461.6442.048
70.6991.3980.6440.6211.1910.9031.0000.5060.9770.5170.9771.3201.516
81.0001.8211.0000.9031.8211.7411.9741.0001.9740.7861.9742.7023.245
90.5901.0740.6250.6250.9770.8031.0240.5061.0000.4371.0001.2461.644
101.2721.4311.4311.3202.6052.2681.9331.2722.2901.0002.2902.7873.764
110.5901.0740.6250.6250.9770.8031.0240.50611.0000.4371.0001.2461.644
120.4850.8940.4470.4470.8710.6080.7580.3700.8030.3590.8031.0001.431
130.3940.6480.3800.3800.6650.4880.6600.3080.6080.2660.6080.6991.000
Table 8. The normalized APCM.
Criteria
Normalized APCM12345678910111213
10.1010.1080.0930.0920.1200.1070.0920.1080.0630.1080.1010.0960.093
20.0560.0590.0540.0590.0700.0540.0460.0590.0350.0560.0560.0520.057
30.1110.1120.1030.1020.1110.1010.0990.1080.0600.0960.0960.1040.097
40.1120.1020.1030.1020.0720.1070.1030.1200.0600.1040.0960.1040.097
50.0460.0470.0500.0770.0550.0500.0540.0590.0380.0530.0610.0540.055
60.0640.0750.0690.0640.0740.0680.0710.0620.0470.0610.0740.0770.075
70.0710.0830.0660.0630.0650.0610.0640.0550.0370.0710.0580.0620.056
80.1010.1080.1030.0920.1000.1180.1260.1080.0740.1080.1180.1260.120
90.0600.0640.0640.0640.0530.0540.0660.0550.0370.0600.0600.0580.061
100.1290.0850.1470.1350.1430.1530.1240.1380.0860.1370.1370.1300.139
110.0600.0640.0640.0640.0530.0540.0660.0550.4110.0600.0600.0580.061
120.0490.0530.0460.0460.0480.0410.0480.0400.0300.0490.0480.0470.053
130.0400.0390.0390.0390.0360.0330.0420.0330.0230.0370.0360.0330.037
Table 9. Weights of the thirteen criteria.
Criterionwgti
Pricing (C1)0.0987
Speed (C2)0.0548
Ease of accessibility (C3)0.1001
Number of transfers (C4)0.0986
Crowdedness (C5)0.0538
Security (C6)0.0677
Air conditioning (C7)0.0624
Vehicle type and its mechanism (C8)0.1078
Service quality (C9)0.0581
Service frequency (C10)0.1293
Noise (C11)0.0868
Service comfort (C12)0.0460
Phobia (C13)0.0359
Table 10. The weighted normalized MCDAM for the TOPSIS technique.
Criteria
12345678910111213
A10.0410.0030.0640.0290.0130.0150.0150.0310.0260.0250.0080.0080.009
A20.0120.0010.0010.0140.0210.0040.0390.0060.0270.0260.0050.0010.018
A30.0160.0300.0160.0290.0270.0390.0320.0640.0180.0700.0550.0070.017
A40.0780.0400.0580.0750.0370.0510.0310.0770.0240.0980.0630.0360.023
A50.0400.0220.0380.0450.0140.0130.0120.0230.0300.0260.0190.0260.008
A60.0050.0030.0260.0040.0040.0050.0040.0040.0120.0120.0030.0020.001
A70.0070.0030.0100.0130.0050.0030.0050.0090.0080.0050.0090.0020.001
Table 11. The weighted normalized MCDAM for the VIKOR technique.
CriteriaSiRi
12345678910111213
A10.0500.0530.0000.0640.0390.0510.0430.0680.0100.1020.0810.0360.0230.6200.102
A20.0900.0550.1000.0850.0260.0650.0000.1060.0080.1000.0840.0460.0070.7720.106
A30.0840.0150.0770.0640.0160.0170.0130.0190.0300.0390.0110.0380.0100.4340.084
A40.0000.0000.0090.0000.0000.0000.0140.0000.0150.0000.0000.0000.0000.0390.015
A50.0520.0260.0410.0430.0380.0530.0480.0800.0000.1000.0630.0130.0240.5820.100
A60.0990.0530.0610.0990.0540.0640.0620.1080.0480.1200.0870.0450.0360.9350.120
A70.0970.0530.0860.0870.0520.0680.0610.1010.0580.1290.0790.0440.0350.9510.129
Table 12. The results of the TOPSIS technique for the seven alternatives.
Alternative E p o s i + E p o s i T P S i Rank
A10.1380.0880.3904
A20.1760.0530.2325
A30.1040.1240.5442
A40.0120.1970.9451
A50.1280.0840.3973
A60.1890.0260.1196
A70.1900.0140.0697
Table 13. The results of the VIKOR technique for the seven alternatives.
SjRankRjRankQjRankAlternative
0.62040.10240.7014A1
0.77250.10650.7985A2
0.43420.08420.5202A3
0.03910.01510.0001A4
0.58230.10030.6693A5
0.93560.12060.9486A6
0.95170.12971.0007A7
S+ and R+0.039 0.015
S and R0.951 0.129
Table 14. The six different scenarios obtained from the sensitivity analysis.
ScenarioS1S2S3S4S5S6
Δ x −0.1290.0000.2500.5000.7500.871
New weights
C10.11340.09870.07040.04200.01370.0000
C20.06290.05480.03910.02330.00760.0000
C30.11500.10010.07140.04260.01390.0000
C40.11320.09860.07030.04200.01370.0000
C50.06180.05380.03840.02290.00750.0000
C60.07780.06770.04830.02880.00940.0000
C70.07170.06240.04450.02660.00870.0000
C80.12380.10780.07680.04590.01490.0000
C90.06670.05810.04140.02470.00810.0000
C100.00000.12930.37930.62930.87931.0000
C110.09970.08680.06190.03700.01200.0000
C120.05280.04600.03280.01960.00640.0000
C130.04120.03590.02560.01530.00500.0000
Disclaimer/Publisher’s Note: The statements, opinions and data contained in all publications are solely those of the individual author(s) and contributor(s) and not of MDPI and/or the editor(s). MDPI and/or the editor(s) disclaim responsibility for any injury to people or property resulting from any ideas, methods, instructions or products referred to in the content.

