1. Introduction
South Africa has multiple challenges that can collapse the economy, and among them is energy unsustainability for the consumption of the current energy supply, which can be inferred through load shedding. Interchanging energy sources has become necessary to address the challenges faced by the energy system in a developing country like South Africa. For conventional fossil fuels such as coal, there is a possible transformation into renewable energy as a replacement [
1]. Based on the historical sphere of energy generation, a larger percentage is produced from fossil fuels. Based on the negative environmental impact of fossil fuels, an interchange of energy systems to renewable energy has become an alternative source of energy with the aim of protecting the environment [
2]. In developing countries such as South Africa and other African countries, renewable energy is classified as an alternative source of energy and has been reported to have drawbacks based on the findings from countries that have successfully incorporated renewable energy into their energy mix globally [
3]. There are numerous types of renewable energy that developing countries could utilize based on their ecological strength. South Africa has solar radiation as one of its ecological strengths that can serve as a renewable energy resource.
South Africa has several provinces that are divided into numerous ecosystems, which are affected by climate change caused by greenhouse gas emissions, thus justifying the need for renewable energy. The South African government has supported the promotion of renewable energy throughout the globe but has focused on the techniques implemented by developed countries such as China [
4]. Ref. [
5] Believes that improving renewable energy quality needs clear direction and proper predictions first. Secondly, it needs adequate control and management of the system throughout.
One of the many renewable energies that the South African government has shown interest in is solar energy [
6]. This is due to the country’s high abundance of solar energy. Solar energy is reliable and readily available throughout the year in most provinces, such as the Western Cape (WC) and KwaZulu Natal (KZN). However, previous studies indicate that the Western Cape has more solar irradiance compared to the KZN region, but that does not mean the KZN region is a failure to install a successful solar system. The is a high irradiance during the day in the KZN region, as
Figure 1 indicates the clearness of a solar panel receiving solar energy.
The above
Figure 1 demonstrates the installed solar energy within the retail sector in KwaZulu Natal. It harvests sufficient energy to operate light and retail equipment such as computers. The solar panels within this sector face north to obtain more sunlight irradiance and convert it for use. There is less incentive to install solar energy in the KZN region due to its location. Therefore, businesses are not keen to stay longer in less profitable areas such as the KZN region. The positioning of solar panels differs from province to province, and it is guided by the large harvest positioning.
The Western Cape province (Cape Town) represents approximately 25% of beverage production and has irradiation during dry summers and hot weather, regardless of its location. Some researchers believe that KZN province has one of the lowest irradiations and makes it low on beverage production by at least 10% [
7]. South Africans looked up to countries such as Germany, America, and China, which have successfully installed solar energy and developed relevant technology that promotes or improves their ecological situation [
8]. From one South African Province to another, the comparison and implementation of solar energy has not been largely successful. KZN is one of the provinces with the highest solar irradiate in the country. Though solar energy is the most favored renewable energy, there are still numerous players that need to be part of the energy mix/replacement regulation processes. The National Energy Regulator of South Africa (NERSA) is one of the main stakeholders that regulate energy implementation within the country, regardless of province. Every province follows the NERSA energy policies.
The literature indicates a few aspects to achieve sustainability, such as the belief [
6] has regarding the government’s capacity to support the power sector can prevent negative effects on the sustainability of the power supply. Ref. [
9] believes that energy security does not affect fully developed countries such as China, and improvements must be made throughout the globe. Pakistan also approves the shift to renewable energy and plans to reach 30% by 2030 of renewable sources [
10].
Several solar energy harvesters have been installed in KZN. SA’s primary biomass resources are in KZN but also in Mpumalanga and Limpopo [
11]. However, the failure rate has consistently gone down through the infrastructure and technological installation. This has increased the energy burden on the energy sector. Ref. [
12] believes that KZN citizens can be rescued by the use of renewable Energy instead of coal energy to avoid the disastrous consequences of fossil fuels. While [
13] noticed that three KZN solar irradiation data sets for Kwazulu-Natal show on average decreases in size by 3 kW of PV panels. During the KZN case study performed by [
14], the PV system is of clear and environmentally friendly technology to produce electricity. The photovoltaic (PV) system is one of the most promising solar energy harvesting technologies compared to other technologies like concentrated solar power (CSP). The study intends to demonstrate solar PV adaptability in the region of KZN throughout the year, as research believes that the Photovoltaic system is one of the profitable systems to society without expensive storage technology [
15]. Based on the advantage of PV systems, Ref. [
16] found that solar PV plants are on a continued improvement to maximize cleanliness, which is one of the major challenges the globe is trying to eliminate climate change. Improve solar implementation in low-developed regions such as KZN for small-scale businesses using multiple regression and solar system analysis for planning and managing the system on a small scale. Ref. [
11] cited that energy production through environmental data is the major component of solar PV systems. Most studies look at the broader view of the country. If the KZN region (eThekwini municipality) is measured based on the amount of sunlight it receives, it will be easy to plan for transitioning from fossil fuel to solar energy. Ref. [
10] believes that it is vital to understand the amount of solar for the location in order to design solar PV. The high demand for the development of sustainable renewable energy balance requires more contributions to RE understanding. This is due to a growing understanding of how RE contributes to the development of a more sustainable energy consumption balance [
11]. The distributed generation of photovoltaic (PV-DG) is the cleanest energy solution for the power system [
13]. The research questions that the article will focus on:
What diverse KZN region is leading in solar energy implementation?
Is solar harvest in the region of KZN favorable or easily affected by the moisture?
Based on the scarcity of skills to implement a successful solar rate, what can be in place to control the solar energy failure rate?
Thus, the research focused on the PV technology implementation in the KZN region.
Useful justification:
The energy exchanged by a solar PV system can be used in areas the high solar radiation, such as the KZN region, to provide clean energy.
Solar PV system is continuously improved and protective of the environment.
The cost of the solar PV system is very affordable, and it is profitable, which forces the interchange to be supported.
The sufficient energy efficiency to be produced by the solar PV system in the eThekwini region is proven by the regression analysis to determine:
- (a)
Risks of transitioning to implementing solar PV at a high rate.
- (b)
Failure rate of the system.
- (c)
Cost related to the implementation of the solar PV system.
Section 1 provided an introduction to the study.
Section 2: Methodology: this section discusses the research strategy and the methodology used to approach the problem and explains how the data was gathered.
Section 3: this section focuses on the analysis of results using the regression analysis technique as well as statistical tools such as ANOVA to conduct multiple regression and discusses the suggestions emanating from the results.
Section 4: it concludes the study by providing answers to the research questions and objectives and makes some valuable recommendations.
2. Materials and Methods
The role of Renewable energy in South Africa is very important. Solar energy, because it is a renewable energy that is more dominant in the country, in KZN, to be more specific. The KZN region needs to deal with solar energy unsustainability to take advantage of the sunlight energy that is found to be dominant in the region.
This section focuses on the actual technicality of proclaiming the research technique to the relevant audience. Given the way energy is important to developing countries, it is viable to conduct relevant research. This section focuses more on the research model to deal with crises facing the KZN region on solar energy, which is slow growth and unsustainable solar energy in the region of KwaZulu Natal. This section discusses how and where data was collected to try and solve the unsustainability of solar power in the region. It further discusses and justifies the methods applied in the study. Data utilized in this research on solar energy was extracted from the database of the regional municipality within eThekwini under the department of renewable energy that specializes in solar energy for the period of 2015 to 2020.
2.1. Sample and Population
The target population for this study was the directly involved users of regional municipality solar power projects developed in the past decade, which are available in the regional municipality database. The installed solar system within the eThekwini region of 50 sites, and of 20 m
2 size plot each site. The data was for the period of 5 years from 2015 to 2020. Due to the high number of variables, this study will focus on the high-impact variables that led to multiple regression. The database has multiple buildings that have installed solar power, which was used to apply these variables (solar harvested and consumption). The regional municipal historic solar energy for these buildings was utilized to conduct a comparison between the variables. The previous studies confirm that most energy is consumed in buildings, with China and the USA contributing 14% of the global final energy consumption through buildings [
17].
2.2. Data Analysis Implementation
Statistical techniques are basically for describing and understanding the variables used to address the transition from fossil fuel to solar PV. It is relevant for this study to utilize solar power, energy consumption, solar self-consumption, importing and exporting of solar energy from the system as useful factors to be compared to make a prediction of solar energy performance. The regression analysis, as part of the quantitative approach, was adopted for the correlation between the variable vitalness of solar PV in the region of KZN.
A predictive analysis tool that examines the relationship between independent and dependent variables is a regression overview, while Ref. [
17] recommended regression analysis as a reasonable statistical approach to make predictions. Therefore, in this study, regression analysis appeared to be a useful technique to have been used to predict the future performance of solar energy in the KwaZulu-Natal region. Having mentioned that, regression also assists in predicting the demand for solar energy. There are several regression forms, such as simple regression, multiple regression, quantile regression, as well as logistic regression.
Multiple regression analysis is the most suitable regression approach since it is a statistical technique that mostly analyzes the relationship between a single dependent variable and several independent variables. As Ref. [
18] believes that the accuracy of multi-source remote sensing over the past 25 years required multiple regression analysis due to the number of variables’ estimations of plant phosphorus concentrations. Multiple regression analyses are just as important as simple regression analyses, but it is more reliable since they test more than one independent variable. The dependent variable in this study is solar energy consumption (Y), and a few independent variables are solar self-consumption (×1), export energy (×2), and import energy (×3). The independent variables are only considered to be significant if the probability value (
p-value) [
p < 0.05]. The results are presented graphically in the next section.
According to [
19], it is necessary to estimate the true effects of local energy consumption data for energy consumption that can help to solve different problems of energy prediction, particularly when there is a scarcity of literature. The useful formula utilized in this study is as follows:
where
Y0 is the dependent variable (overall output);
: independent variable (input);
a: intercept (Y value at x = 0);
: gradient of the regression line (it is the same throughout);
ε: accidental error.
Funding decisions to ensure solar energy sustainability are influenced by the results obtained from the analysis, including the regression results of comparing different data groupings from different seasons [
19]. To improve the status, it is necessary to identify the cause of failure or possible causes of failure, but also to address a better way to implement solar energy in developing regions. As ref. [
18] believes that the ability to produce cheap coal-based electricity lies within the inability and unwillingness to address the socio-economic challenges. The analysis of variance will be computed through Microsoft Excel.
The coefficient of determination (r
2) in this study was investigated to show how well the data fits the regression equation during the calculation of multiple regression, given its strength to determine the relationship between the response variable and the covariates. Ref. [
20] finds it necessary to investigate the correlation among the variables amid a growing economy and worsening ecological changes. The correlation between variables was also researched to investigate whether there was a relationship between the variables. The coefficient of r
2 was calculated to see how strong the relationship is between solar production, solar installation, and solar consumption, etc. Measurement of correlation needs a coefficient that represents the linear association between the variables investigated.
2.3. Data Validation Equation
The mathematical coefficient formula used in this research is:
where
n = number approach;
x = variables;
y = solar system production.
In the case of this study, if it means that solar energy in the region of KZN can be sustainable, then prioritization is necessary.
3. Results
The results are based on the forecasting of the KZN region for the period of 12 months, which is equivalent to the four data groupings discussed in this section below. The result section will provide an overview of the variable, data grouping, and related analysis.
There are a number of variables to be tested in the period mentioned above. The table below presents all variables considered for statistical modeling of solar power data through a multiple regression model.
Table 1 below demonstrates the parameters that are considered in the study, where Y represents the dependent variable (solar power production), and x indicates independent variables (e.g., solar power consumption, Temperature (℃)). The information will be used in the eThekwini municipality for the available variables. A detailed description of all variables is given in
Table 1 below for better understanding.
Regression analysis was then utilized to check the relationship between solar power system production and the associated independent variables presented in the table above. This will assist in decision-making on solar sustainability in the KZN region. It will also help determine the impact of each independent variable.
The annual data from the database was categorized according to the season of the year found in South Africa, using months.
Table 2 below shows the grouping of data from prior analyses to make it more understandable. There are four categories in the table below, namely: autumn, winter, spring, and summer. The reason for grouping into seasons is to understand and determine the favorable season for solar power implementation in the region of KZN. Moreover, it is to statistically embrace the high solar availability to configure the variable correlation for prediction. Day-to-day analysis will not give us seasonal clarification and solar expectancy, but has the possibility to mislead the actual solar availability. The range of data categories was specified to clearly group data for analyses in the later stage. The data obtained from the eThekwini municipality renewable office for the period of 12 months and analyzed using regression with an aim to determine the suitable reason why the KZN region is not one of the suitable regions when it comes to solar energy implementation.
3.1. Data Grouping (DG) Analyses Overview and Relation Comparison
After noticing that the season has four categories, a consideration of these categories was given the necessary respect and acknowledgement it deserves to check the adaptation of solar power throughout the changing weather. The solar power is grouped using categories of months in
Table 2. The solar power parameters’ relationships are investigated using the scatter plot diagram for each of the sets of parameters [
21]. The solar system parameter, which is the dependent variable, is investigated throughout all independent variables (consumption, solar import, energy export, solar self-consumption, and temperature) throughout the financial year in data grouping form.
Ref. [
10] accepts as true that a linear relationship among two variables can be interrogated through linear regression for satisfactory data. Each data group consists of four correlation investigations based on the seasonal solar energy availability. All investigations are conducted between energy consumption and one of the parameters (solar system production, solar power imported, solar power exported, and solar self-consumption).
3.2. Data Group 1 (DG 1): Analyses of Correlation Among Parameters
The below consolidated figure addresses the correlation between the data grouping 2. The analyses of these consolidated figures will include
Figure 2,
Figure 3,
Figure 4 and
Figure 5.
Figure 2 of DG 1 investigated the correlation between energy consumption and solar system production. The increase in solar system production shows an increase in energy consumption. The correlation among these two parameters seems not to be strong since the r
2-value is 0.49, which is below 0.50; the correlation among the parameters is not that strong.
Figure 2 of DG 1 investigated the relationship between energy consumption and solar self-consumption amount.
Figure 2 of DG 1 investigated the relationship between energy consumption and solar self-consumption amount. The figure below shows a good relationship among them since r
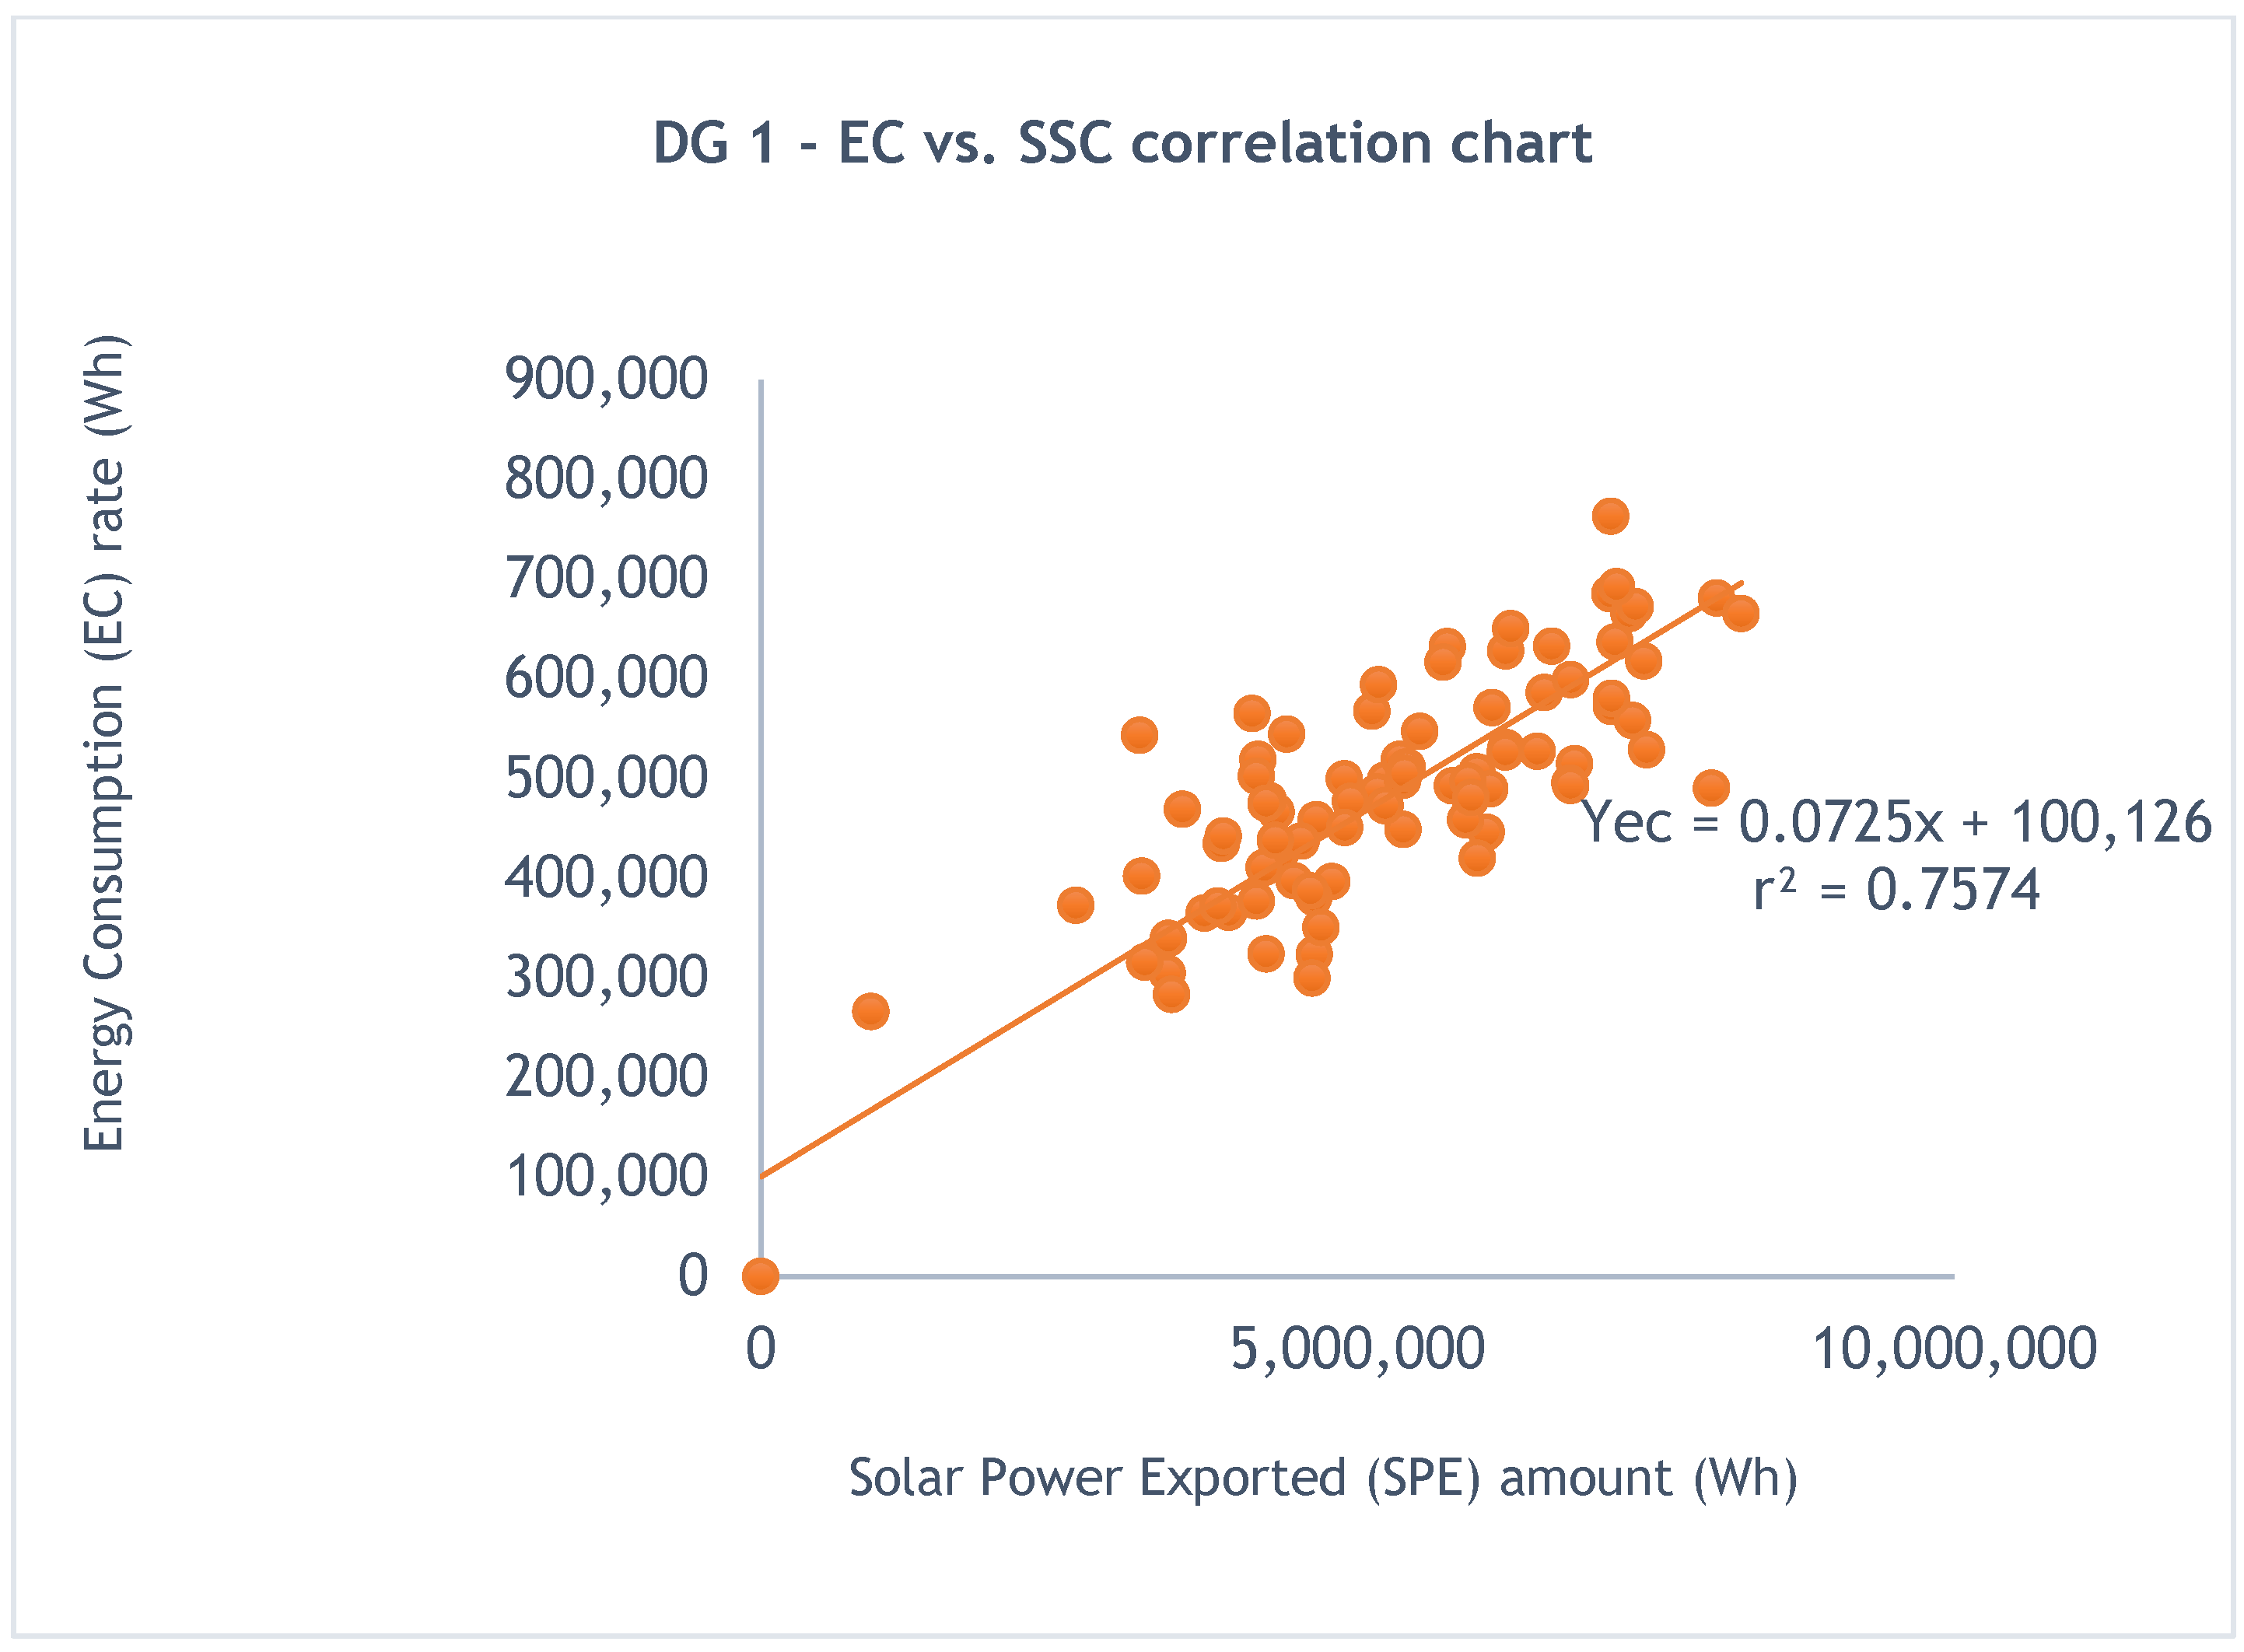
2-value is 0.57, which is above 0.50. However, it does not come close to 1.0, which means it is not very strong, but there is a trustworthy relationship. An increase in solar self-consumption amount also demonstrates an increase in energy consumption rate. A strong relationship between energy consumption (EC) and solar power exported (SPE) amount, since it consists of an r
2-value of 0.76 as shown in
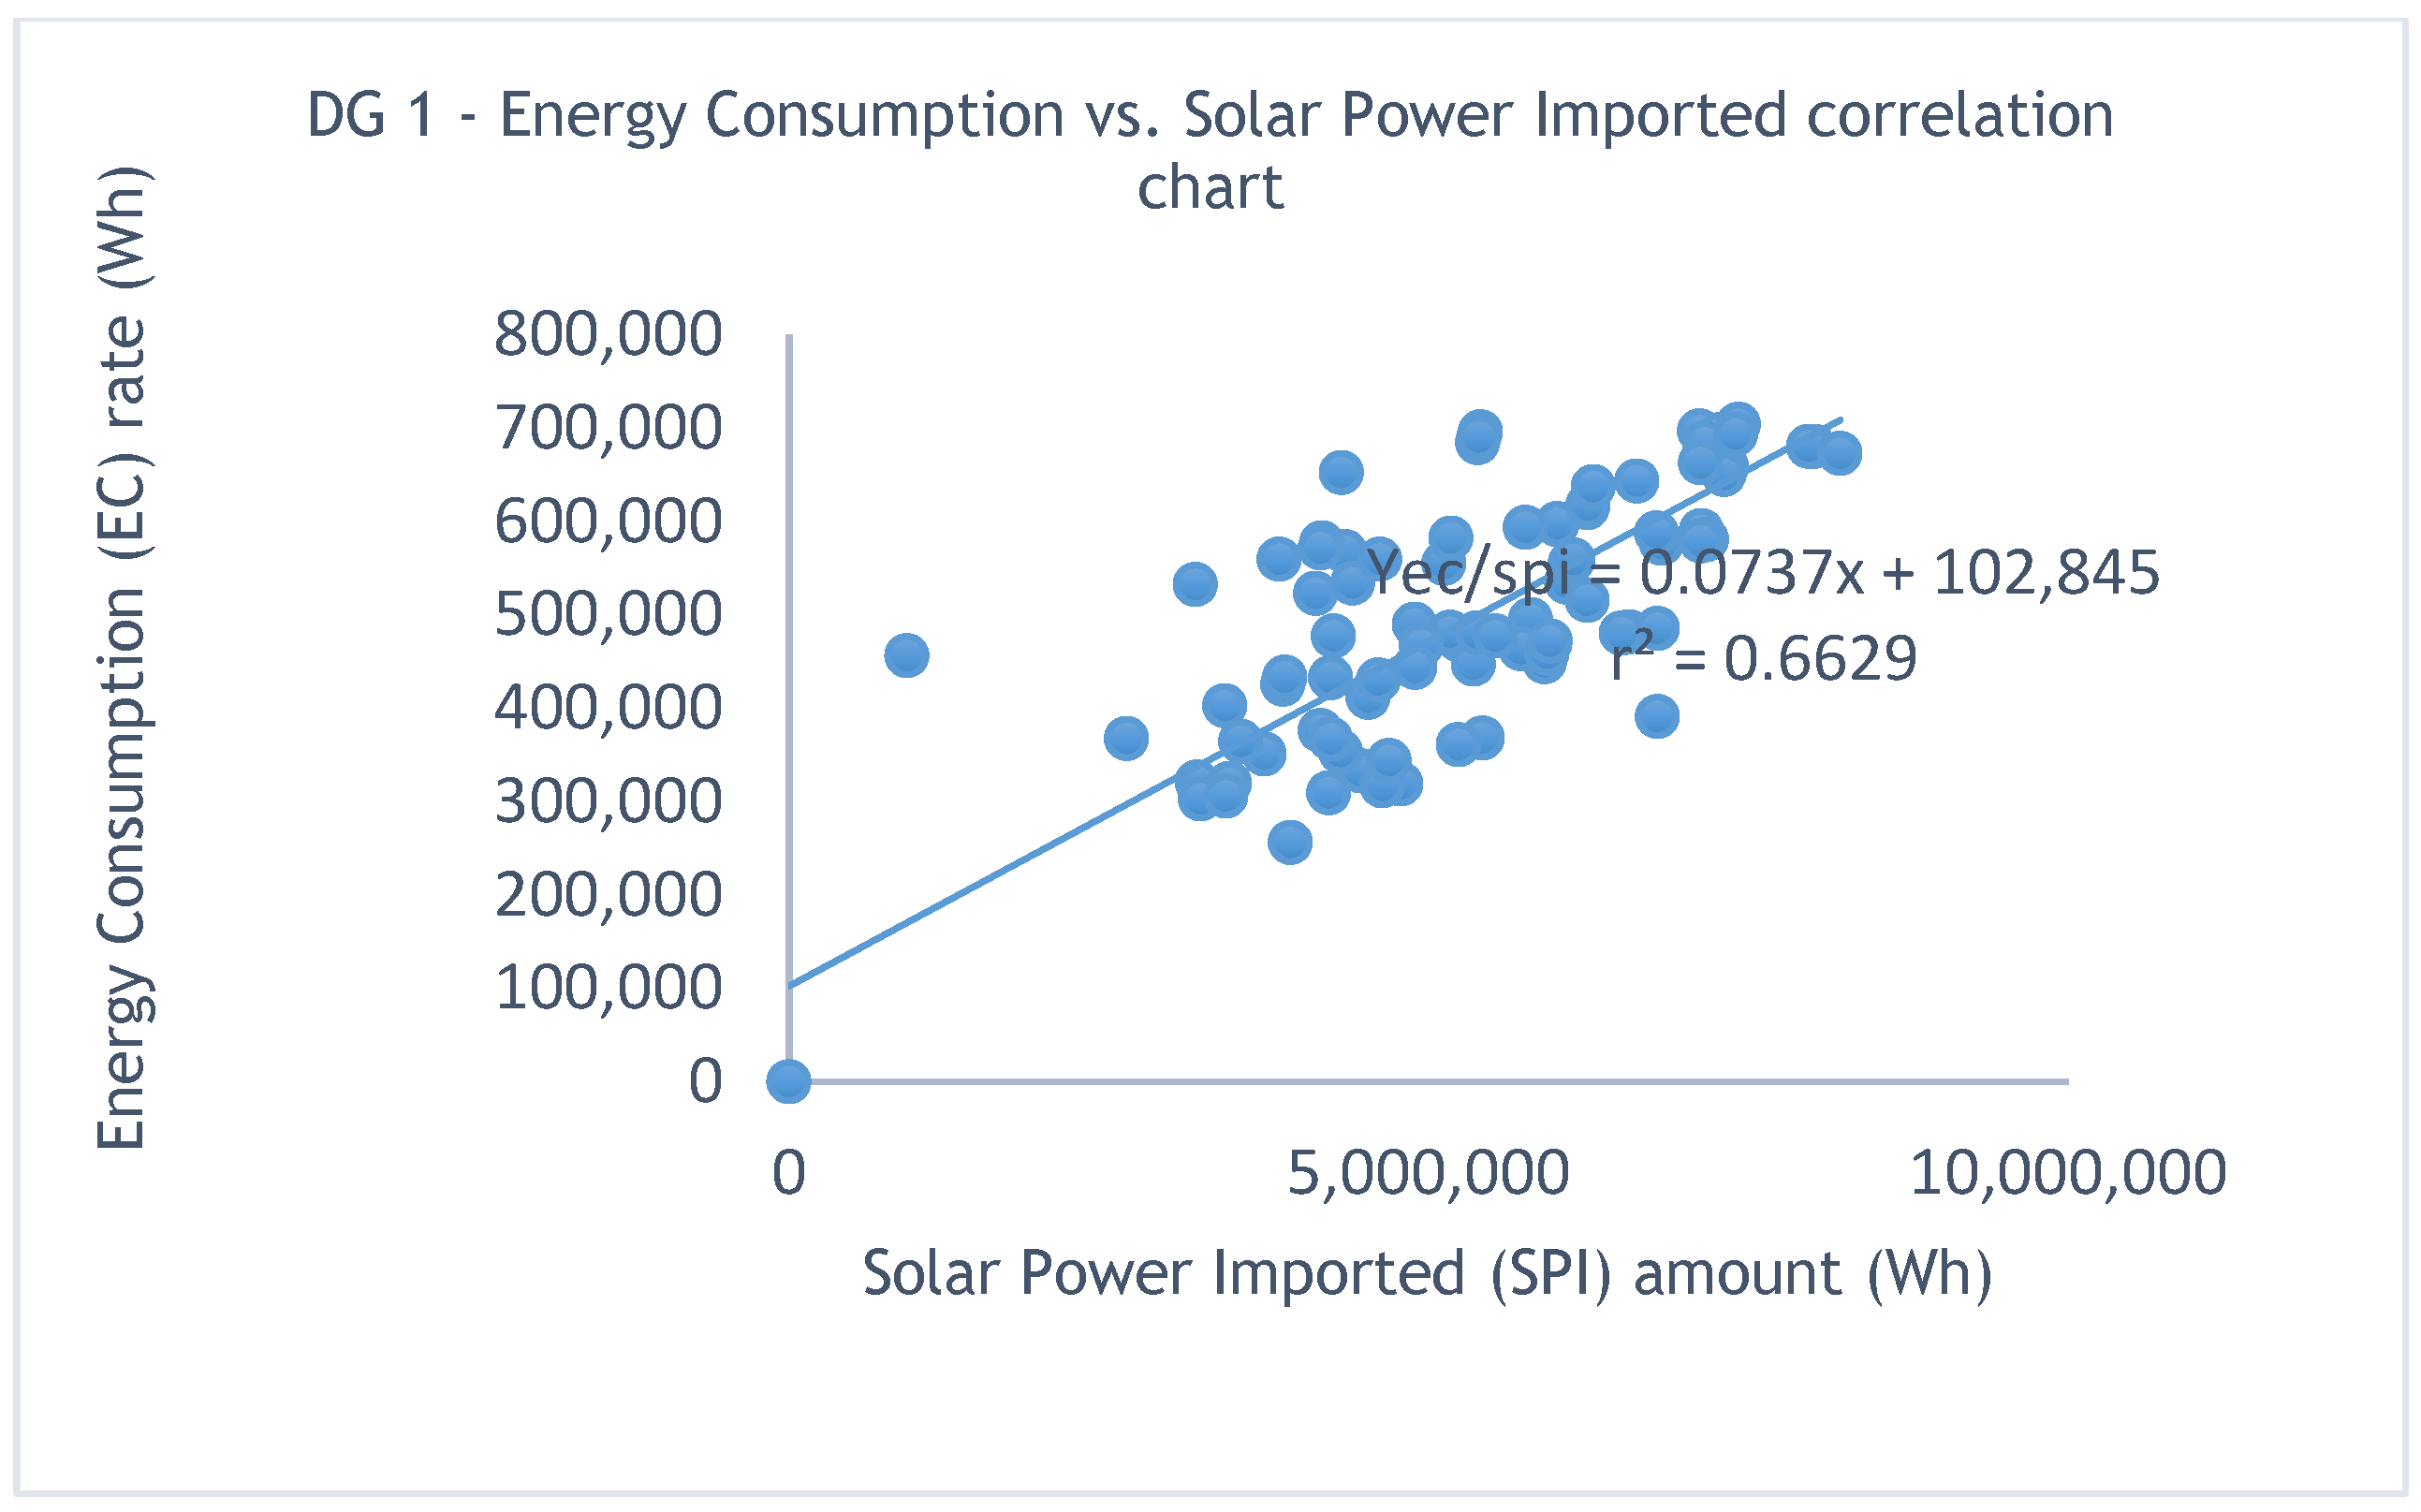
Figure 4. This value shows that the more solar power is exported, the more energy is consumed. The imported energy and energy consumption are investigated as well, and the relationship between these parameters seems to be strong, since it has an r
2-value of 0.67. This value demonstrates a good relationship among these parameters. For every amount of solar power imported, there is a consumption that imported solar power.
Figure 5 below better demonstrates the relationship among the parameters.
3.3. Data Group 2 (DG 2): Analyses of Correlation Among Parameters
The below consolidated figure addresses the correlation between the data grouping 2. The analyses of these consolidated figures will include
Figure 6,
Figure 7,
Figure 8 and
Figure 9.
Figure 6 of DG 2 investigated the relationship between energy consumption and solar system production amount. The figure further shows the good relationship among the variables since r
2-value is 0.66, which is above 0.50. An increase in solar self-consumption amount also demonstrates an increase in energy consumption rate.
Figure 7 of DG 2 investigated the relationship between energy consumption and solar self-consumption amount. The figure below shows a good relationship among the variables since r
2-value is 0.67, which is above 0.50. An increase in solar self-consumption amount also demonstrates an increase in energy consumption rate.
Figure 9 of DG 2 investigated the correlation between energy consumption and solar power exported. The increase in solar system production shows an increase in energy consumption. The correlation among these two parameters seems to be strong since the r
2-value is 0.65, since it is above 0.50, the correlation among the parameters is not that strong.
Figure 8 of DG 2 investigated the correlation be energy consumption and solar power imported. The increase in solar system production shows an increase in energy consumption. The correlation among these two parameters seems to be strong, since the r
2-value is 0.73, which is above 0.50; the correlation among the parameters is the strong.
3.4. Data Group 3 (DG 3): Analyses of Correlation Among Parameters
The below consolidated figure addresses the correlation between the data grouping 3. The analyses of these consolidated figures will include
Figure 10,
Figure 11,
Figure 12 and
Figure 13.
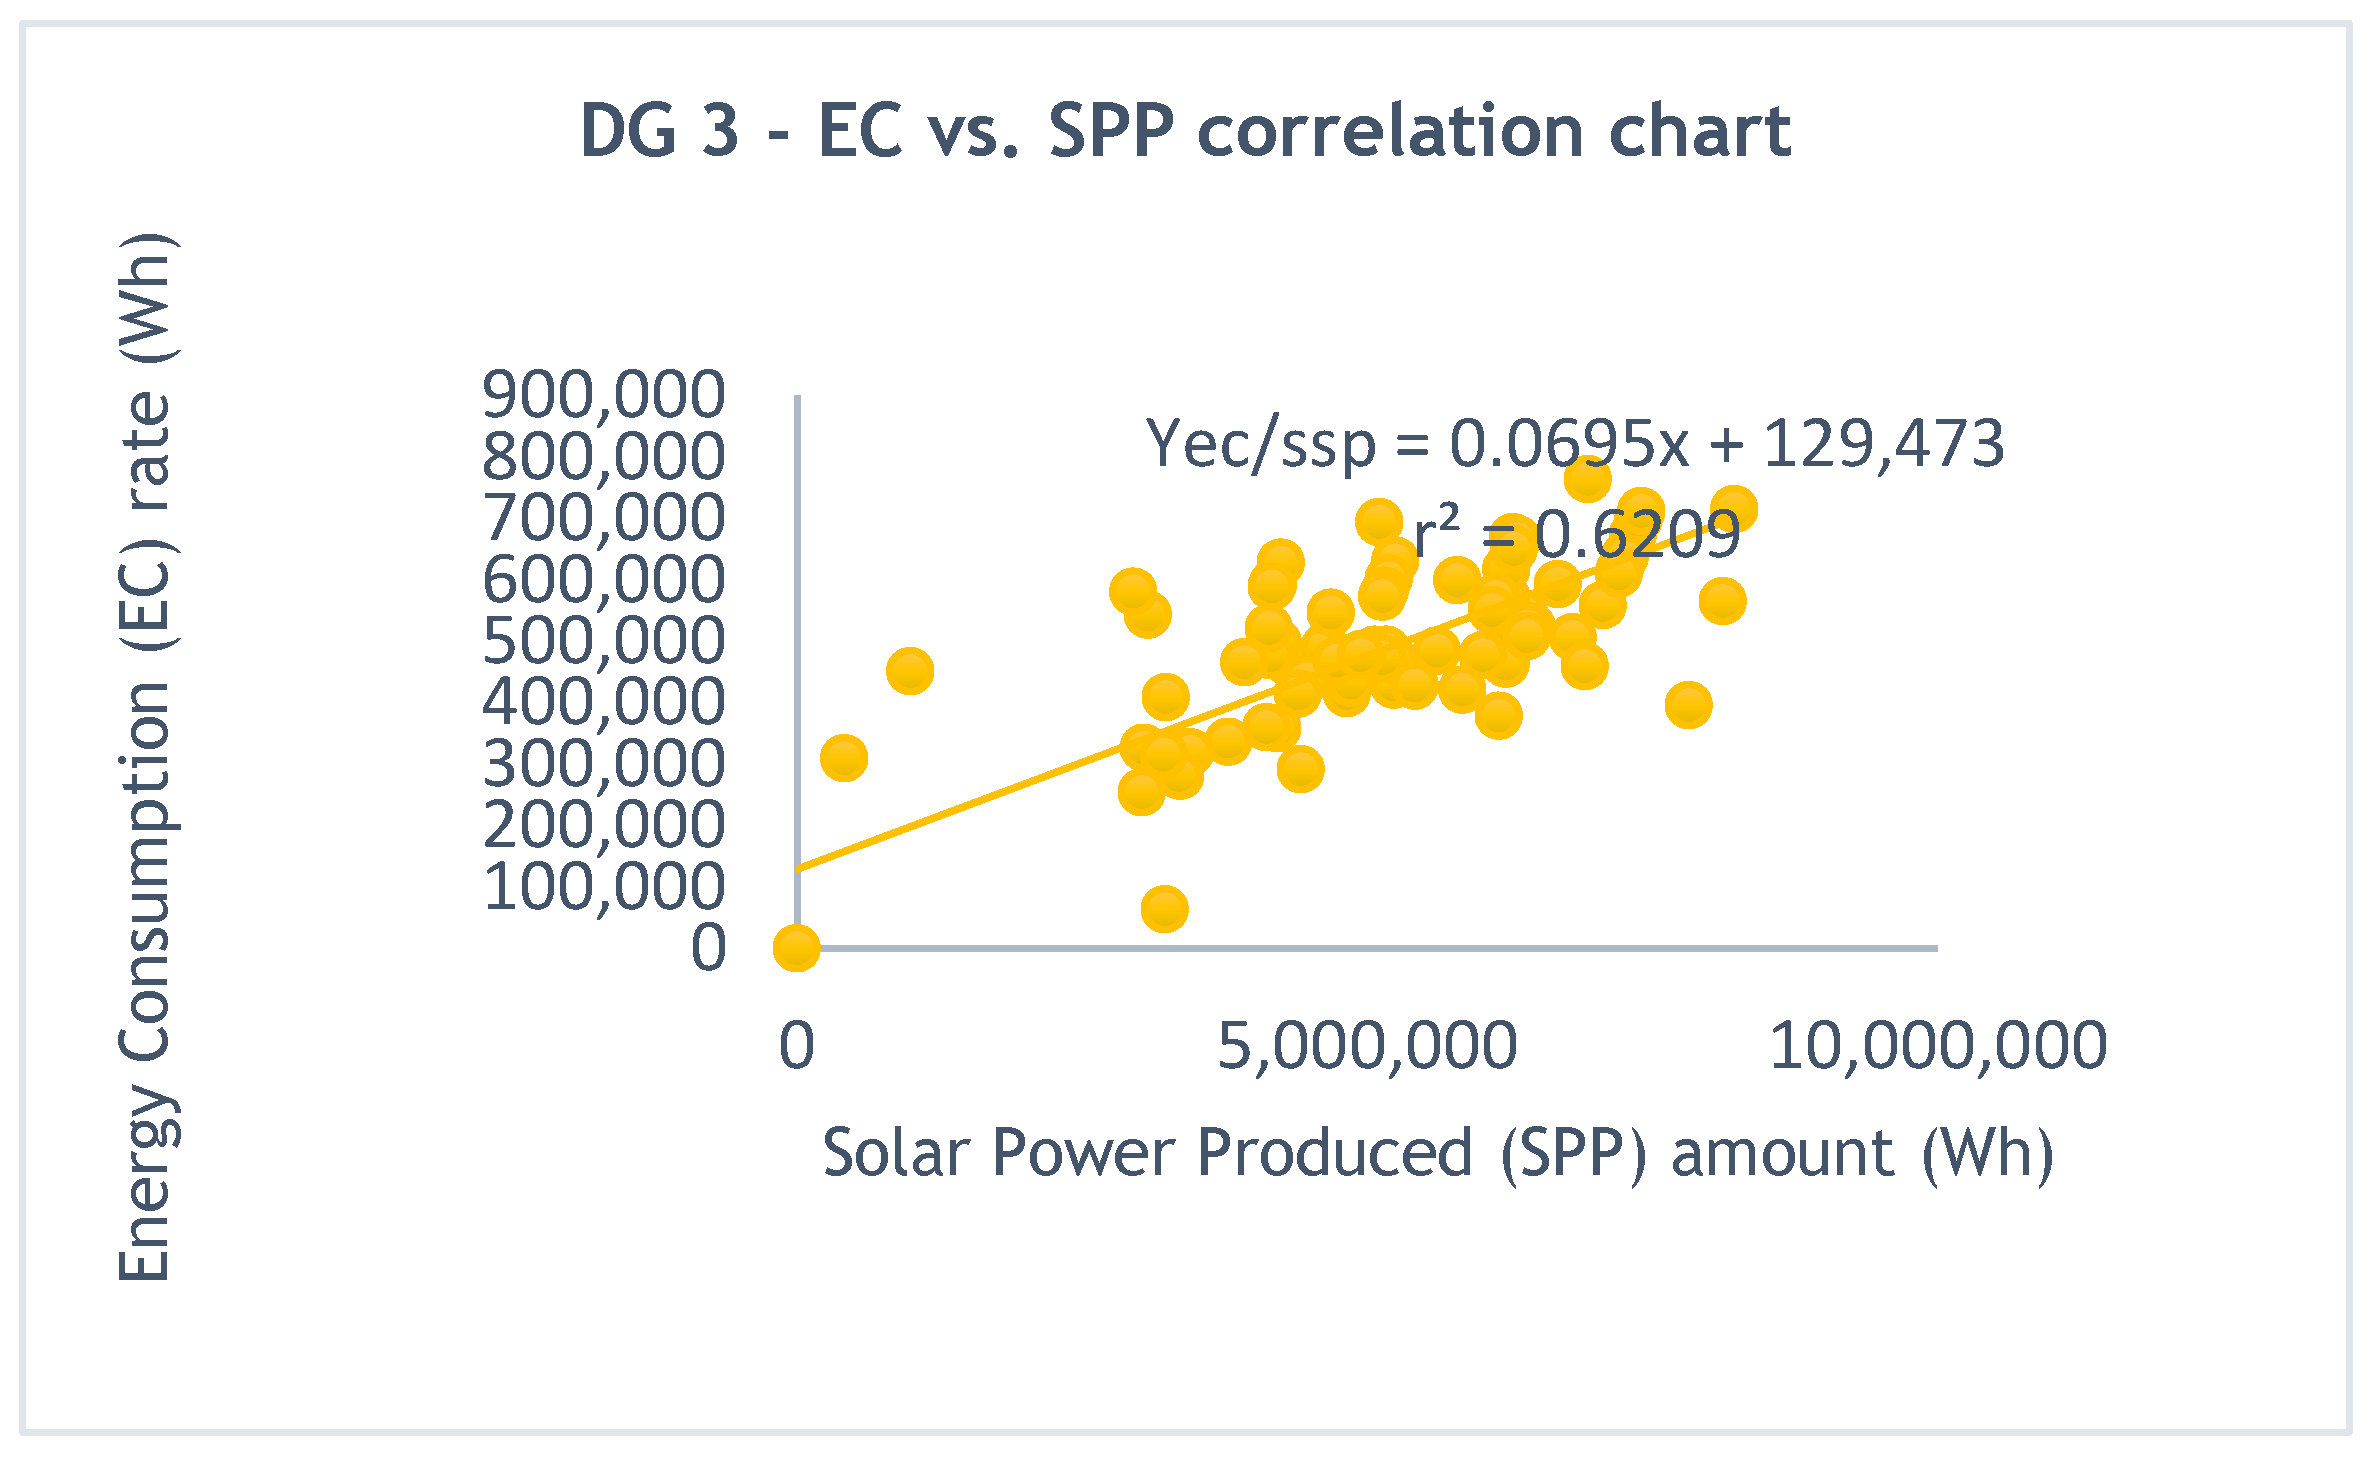
Figure 9 of DG 3 investigated the relationship between energy consumption and solar power produced. The figure below shows a good relationship since the r
2-value is 0.63, which is above 0.50. An increase in solar self-consumption amount also demonstrates an increase in energy consumption rate.
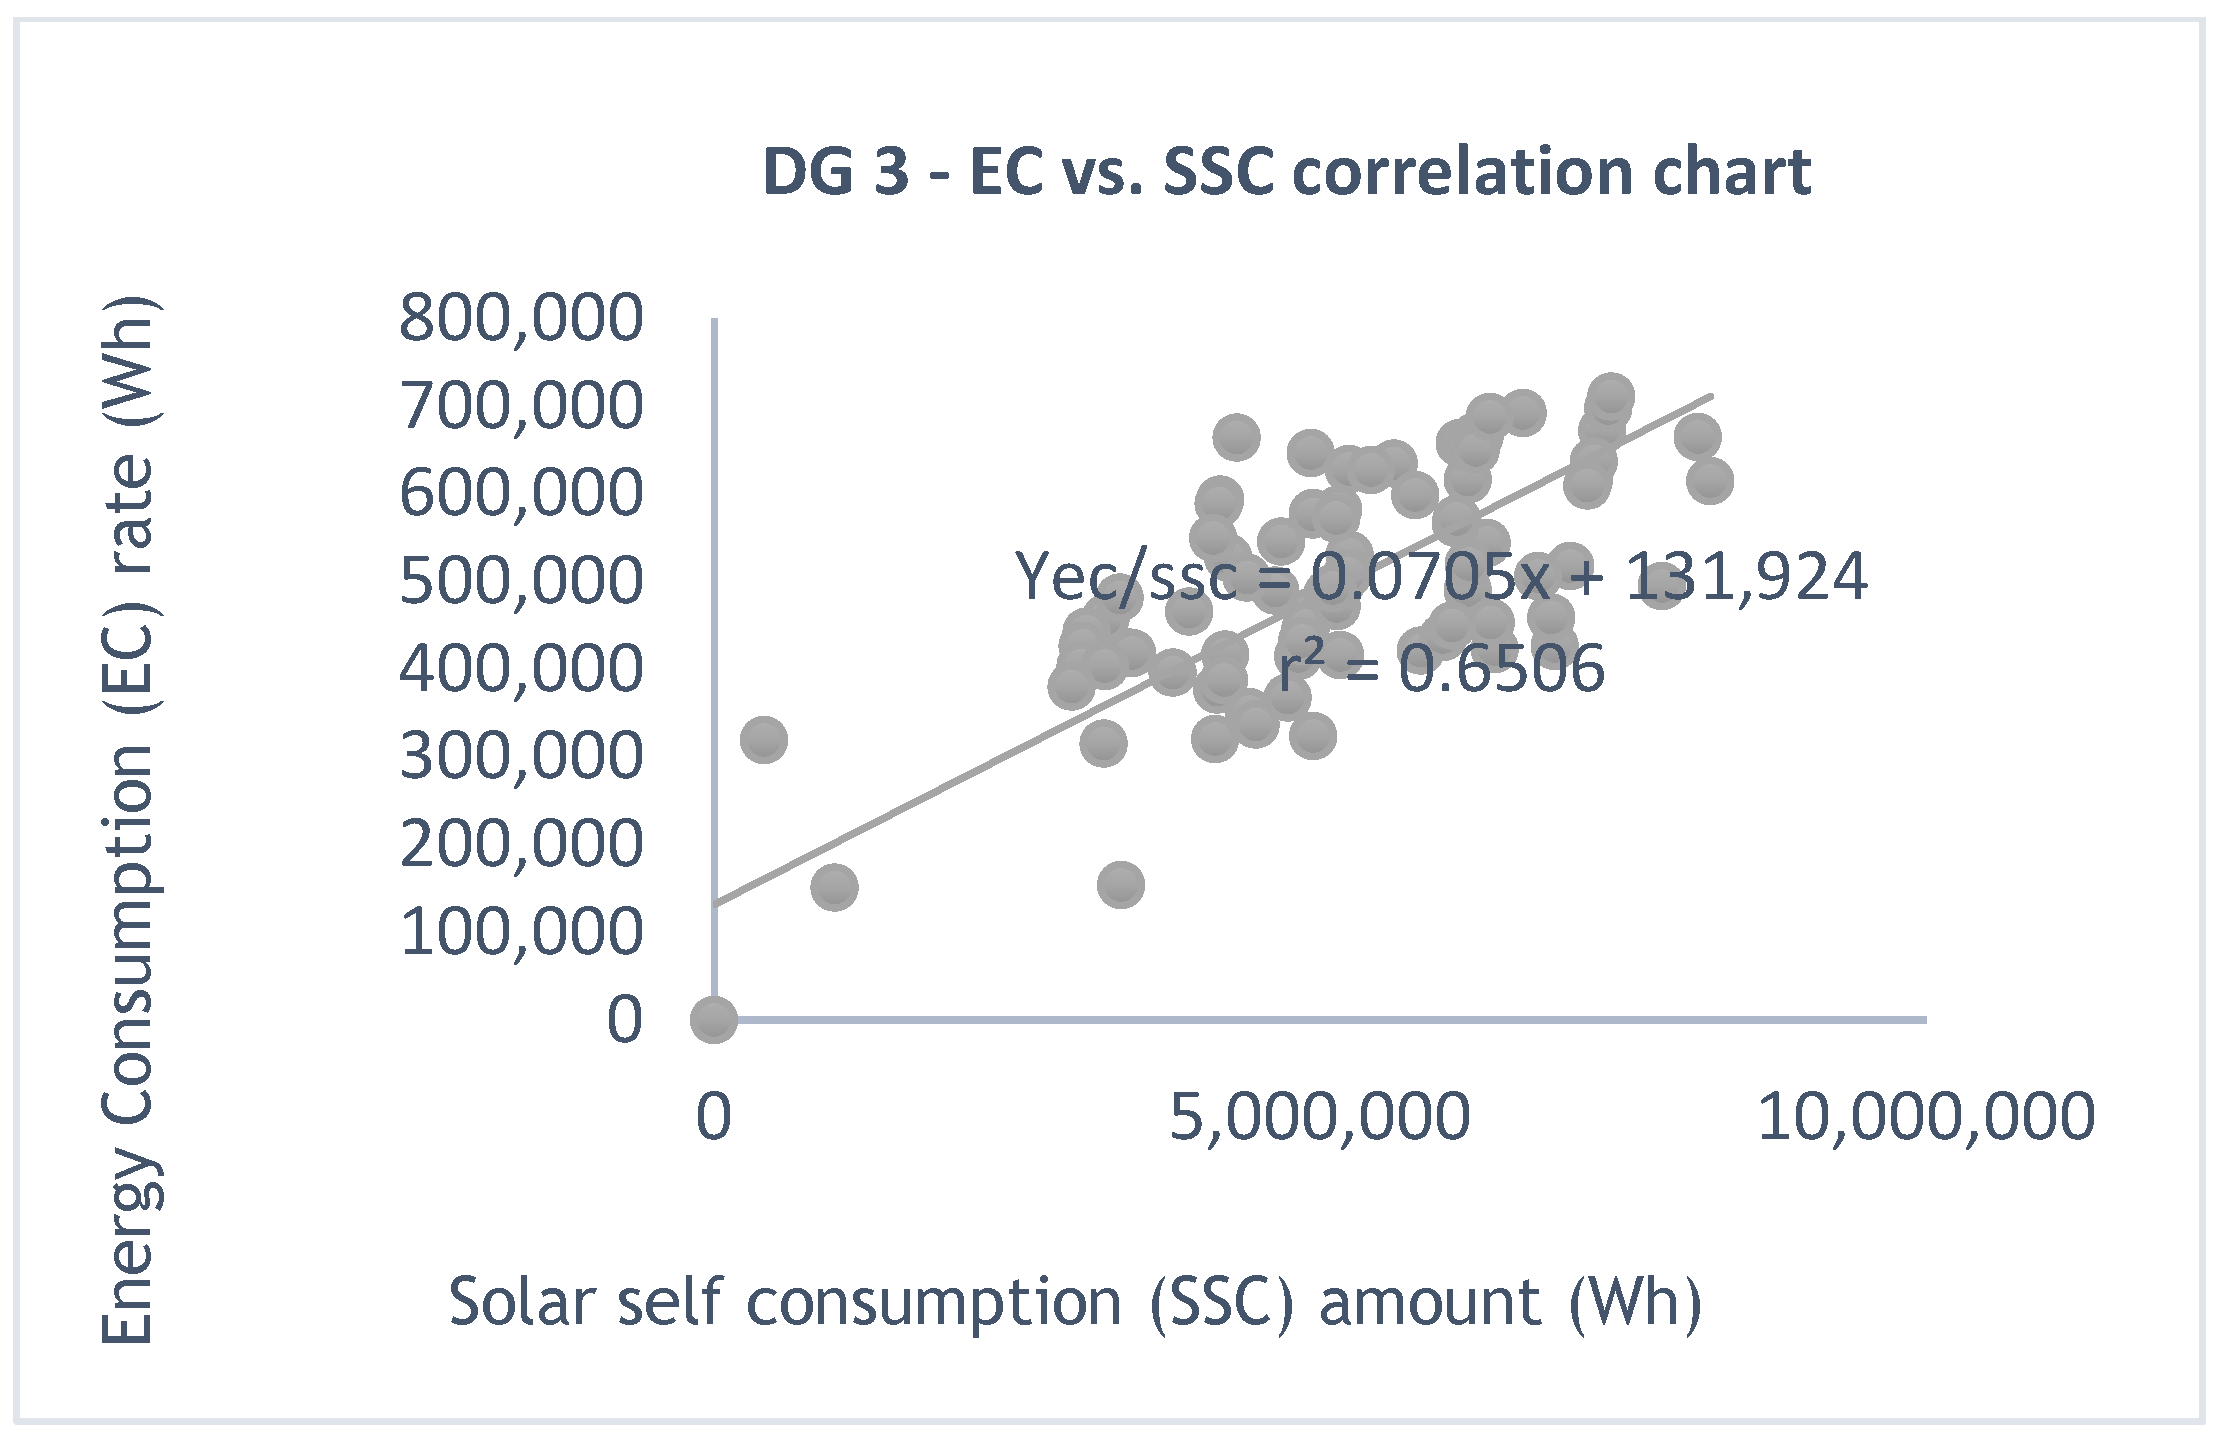
Figure 10 of DG 3 investigated the relationship between energy consumption and solar self-consumption amount. The figure below shows a good relationship among the variables since r
2-value is 0.65, which is above 0.50. An increase in solar self-consumption amount also demonstrates an increase in energy consumption rate.
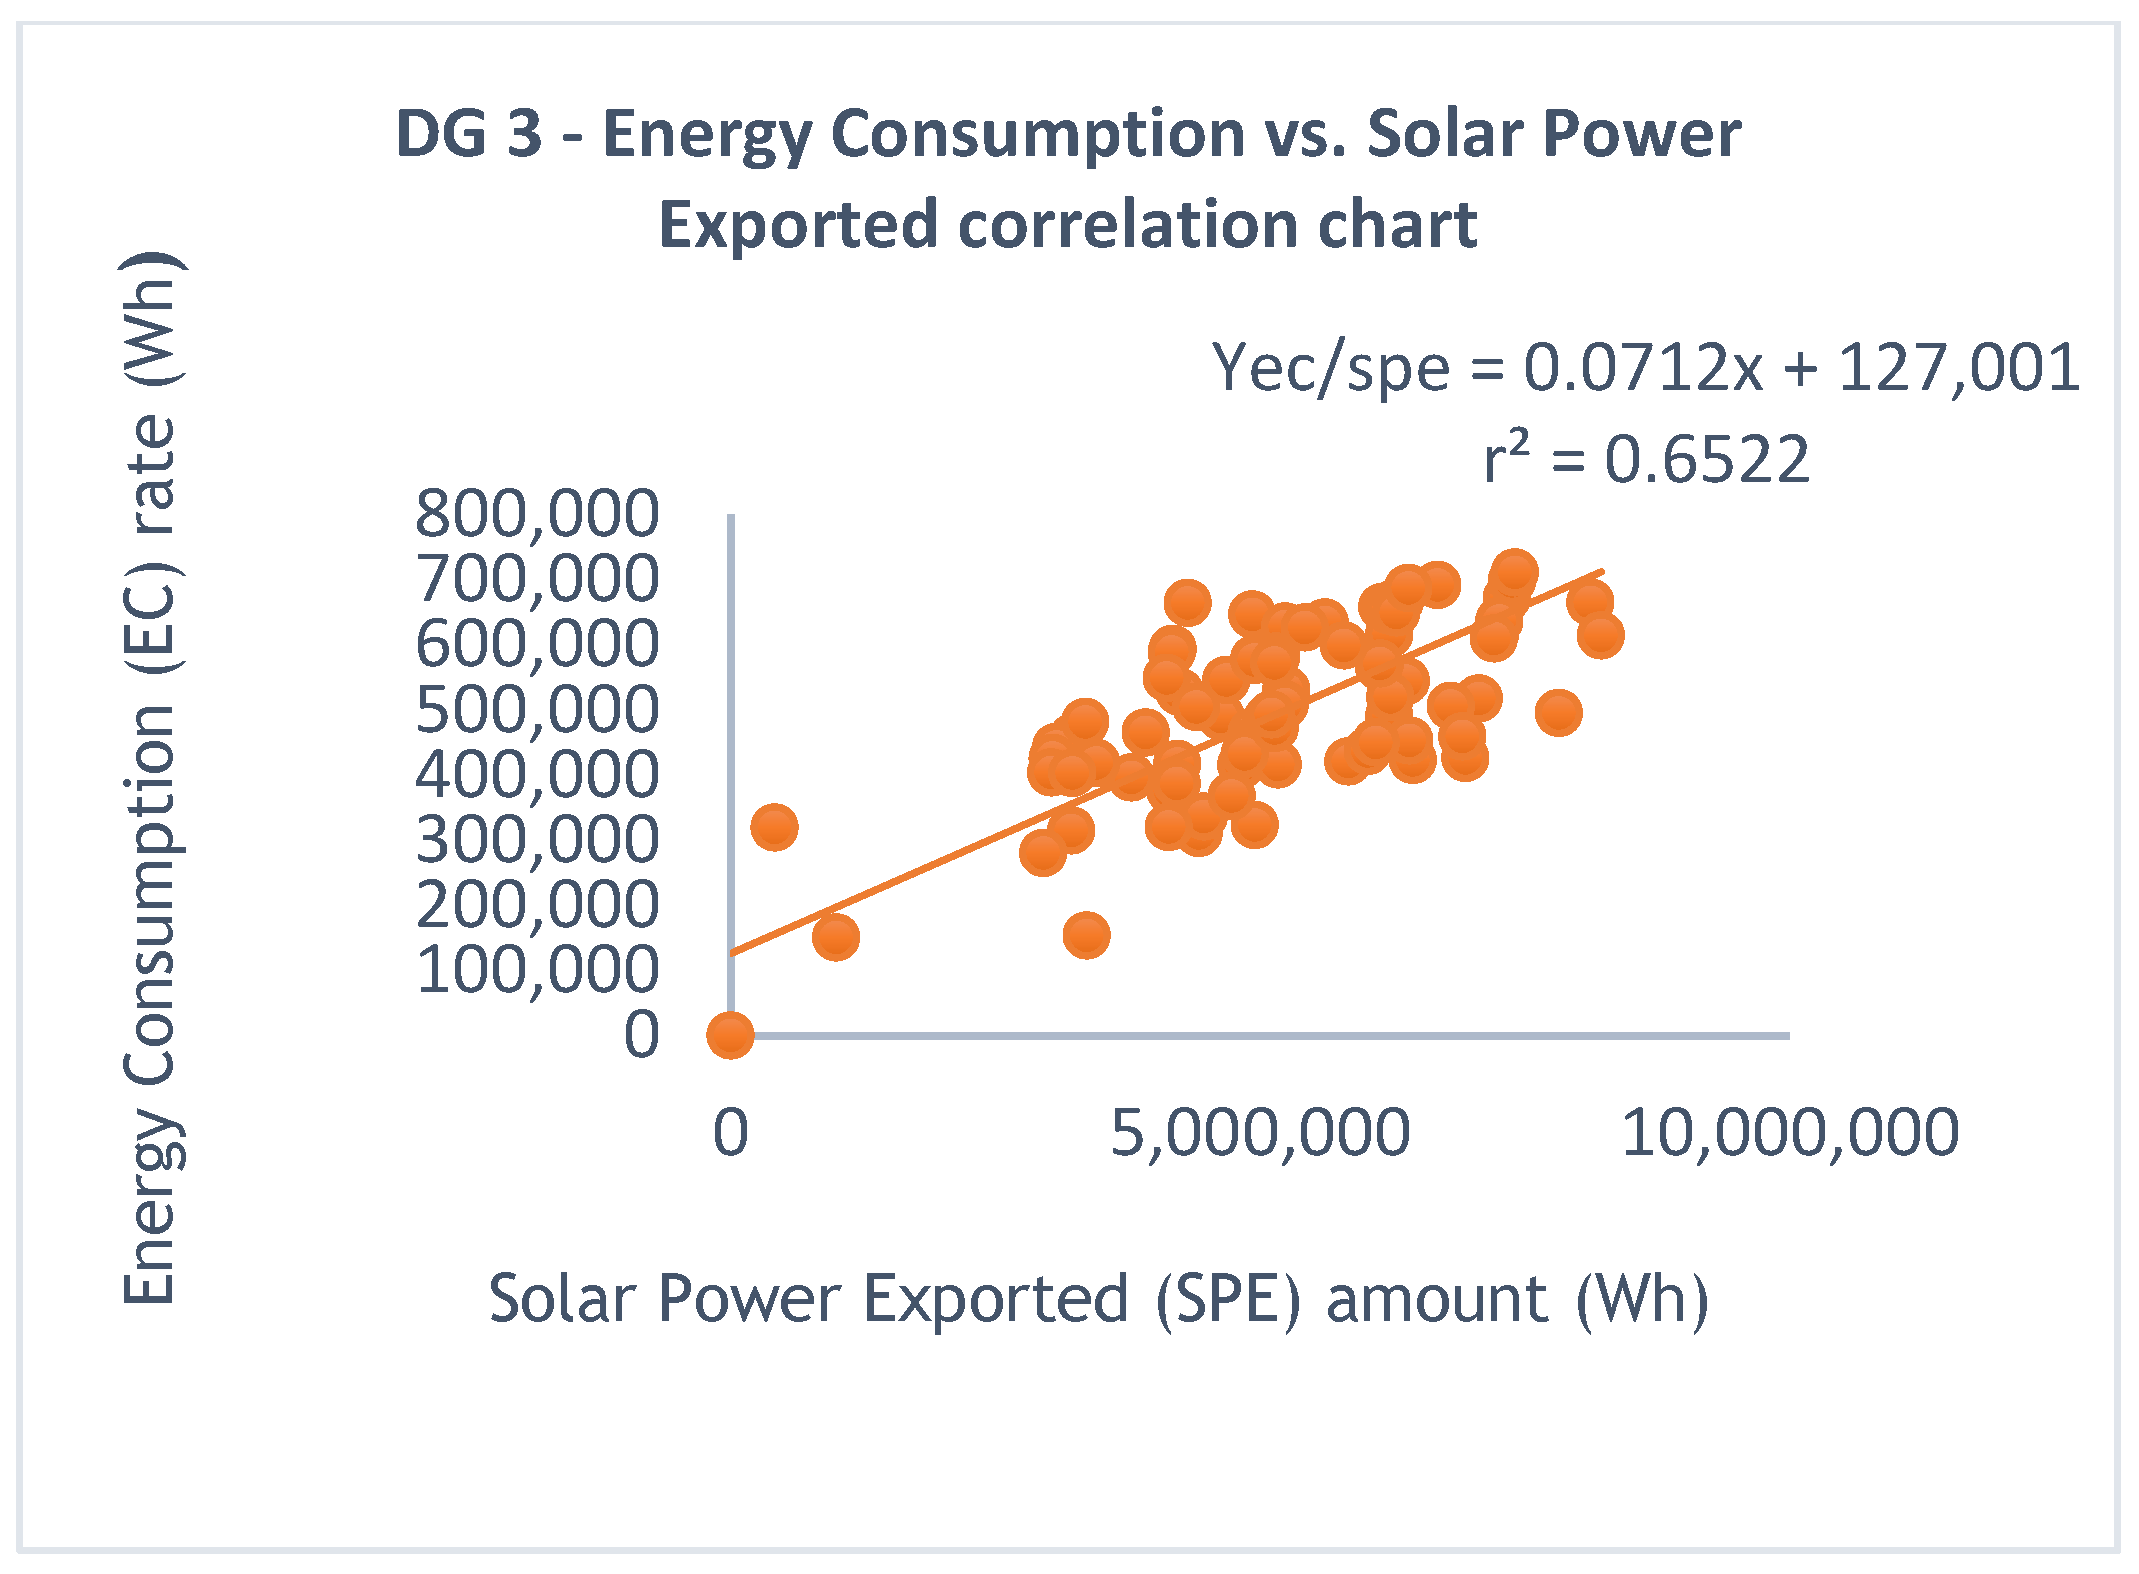
Figure 11 of DG 3 investigated the relationship between energy consumption and solar self-consumption amount. The figure shows a good relationship since r
2-value is 0.65, which is above 0.50. An increase in solar power exported also demonstrates an increase in the energy consumption rate.
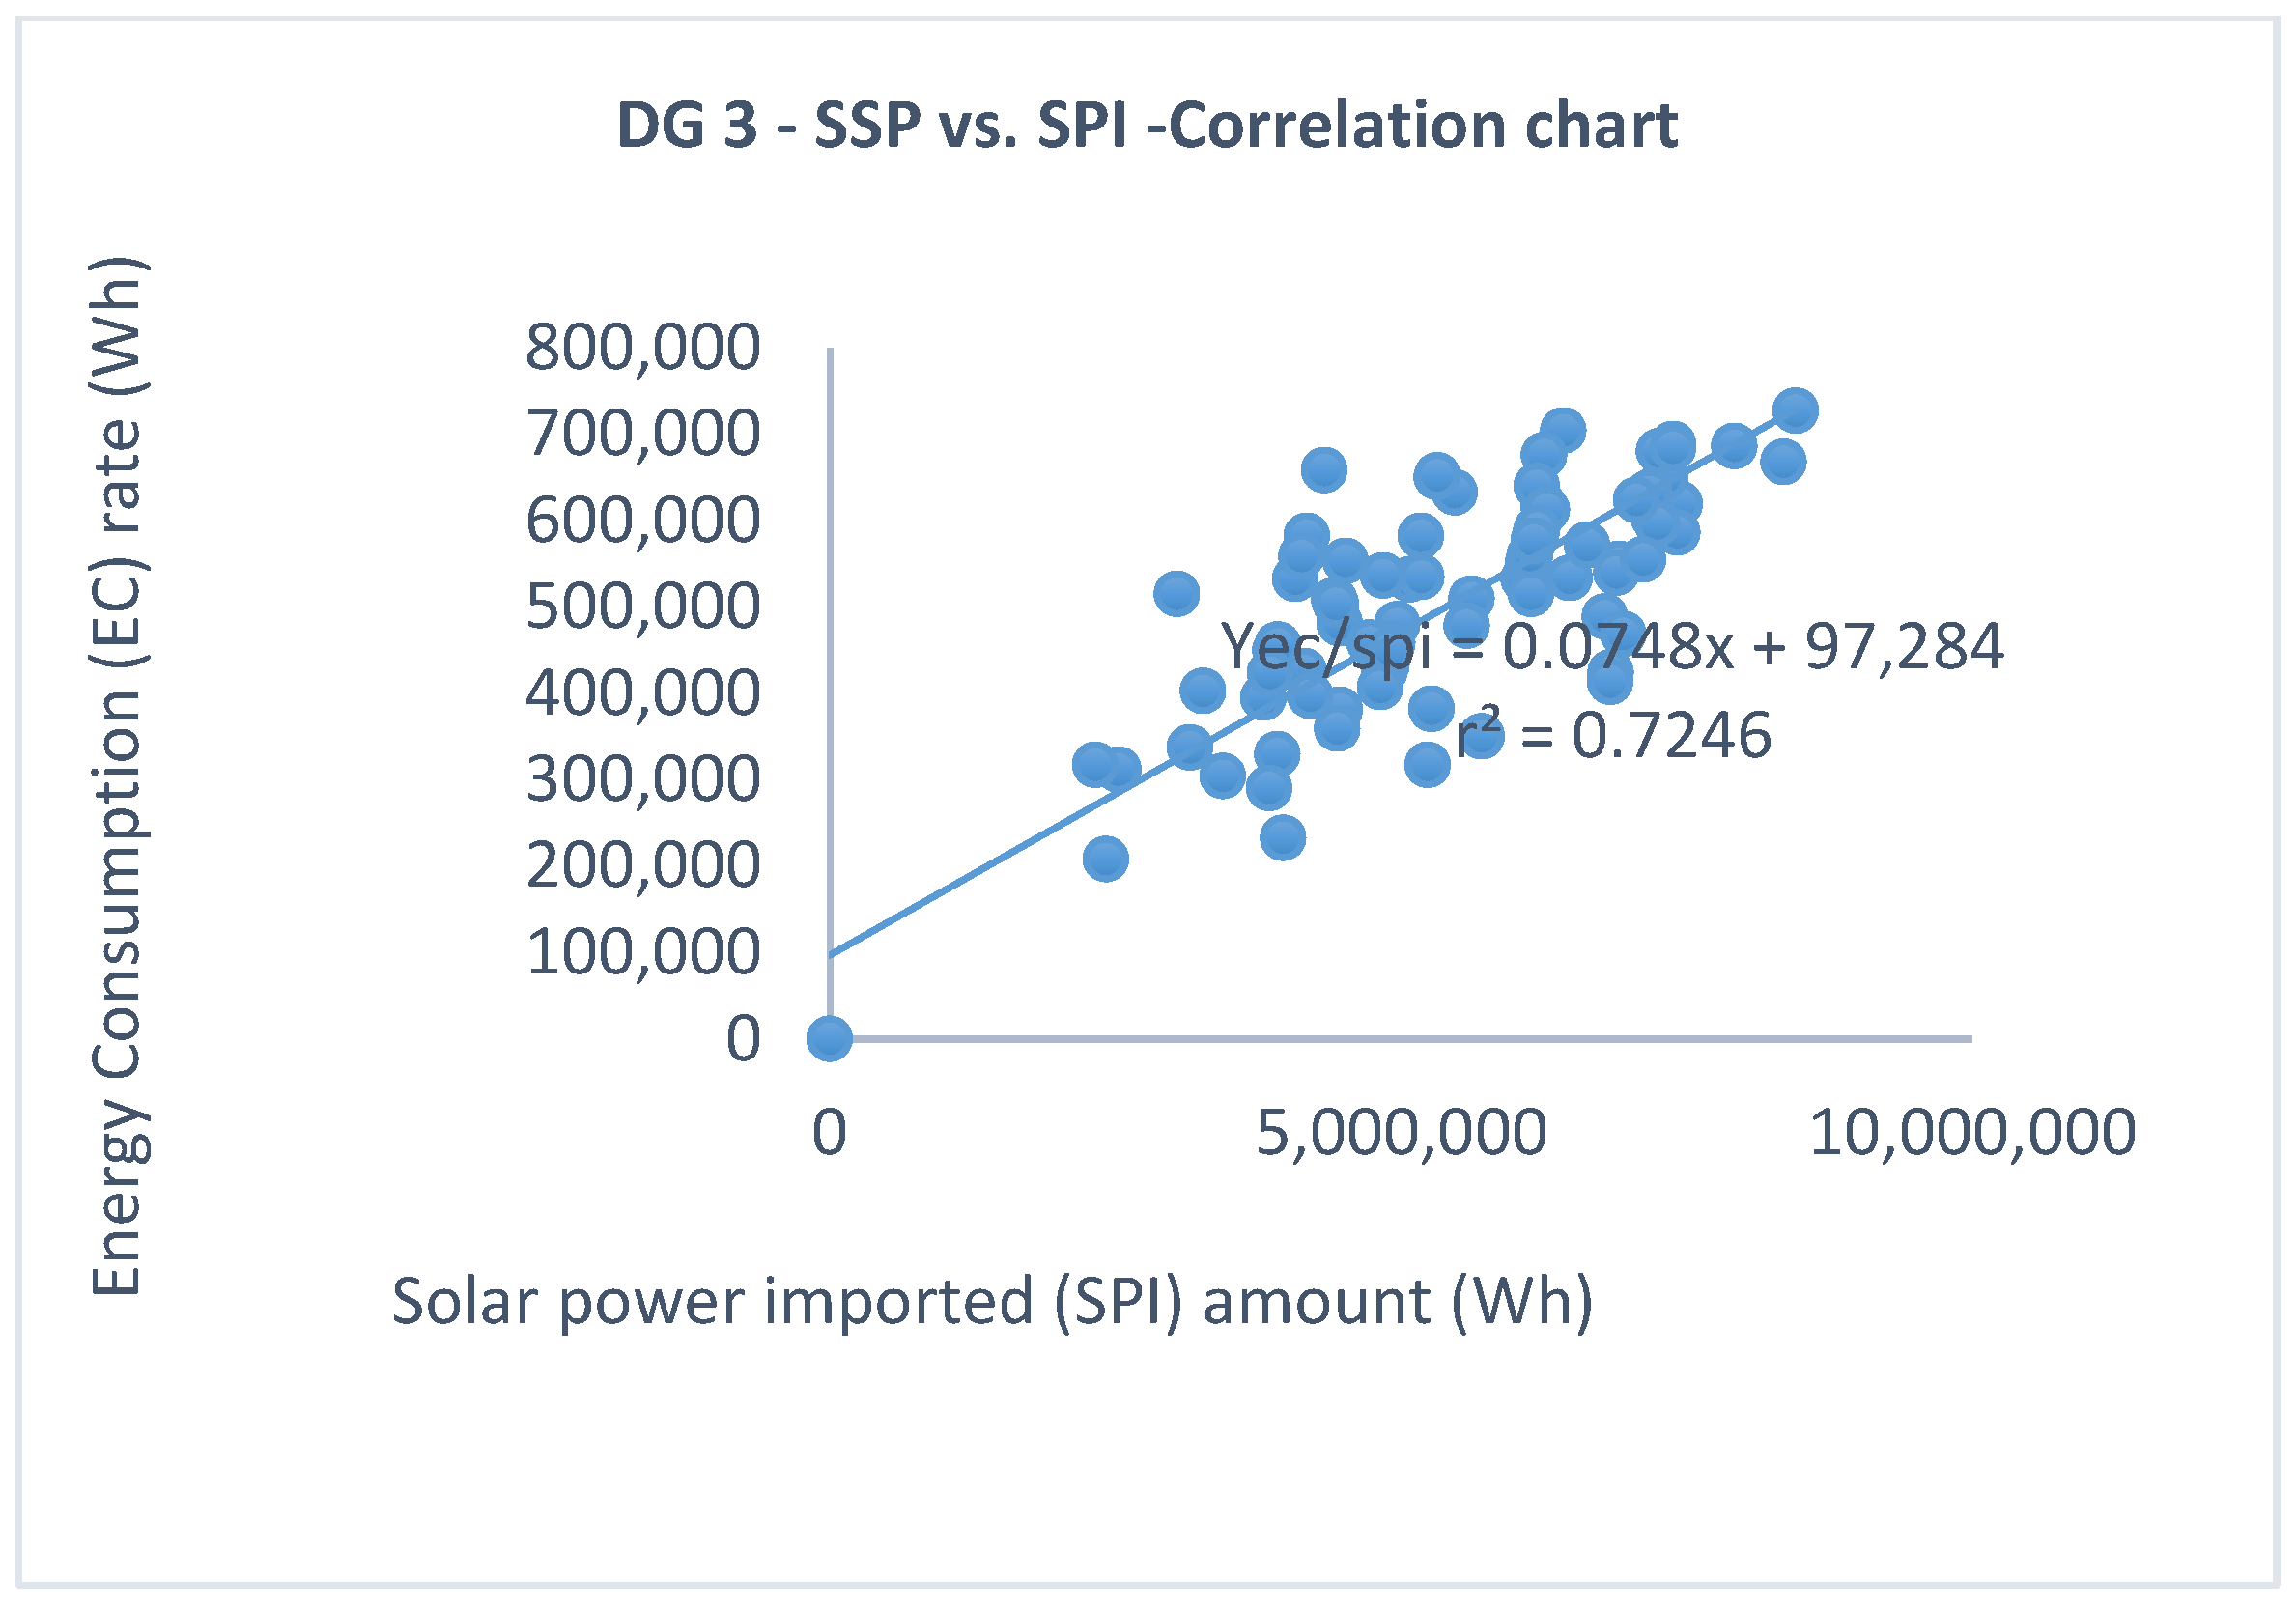
Figure 13 of DG 3 investigated the relationship between energy consumption and solar power imported. The figure shows a good relationship since r
2-value is 0.66, which is above 0.50. An increase in solar self-consumption amount also demonstrates an increase in energy consumption rate.
3.5. Data Group 4 (DG 4): Analyses of Correlation Among Parameters
The below consolidated figure addresses the correlation between the data grouping 4. The analyses of these consolidated figures will include
Figure 14,
Figure 15,
Figure 16 and
Figure 17.
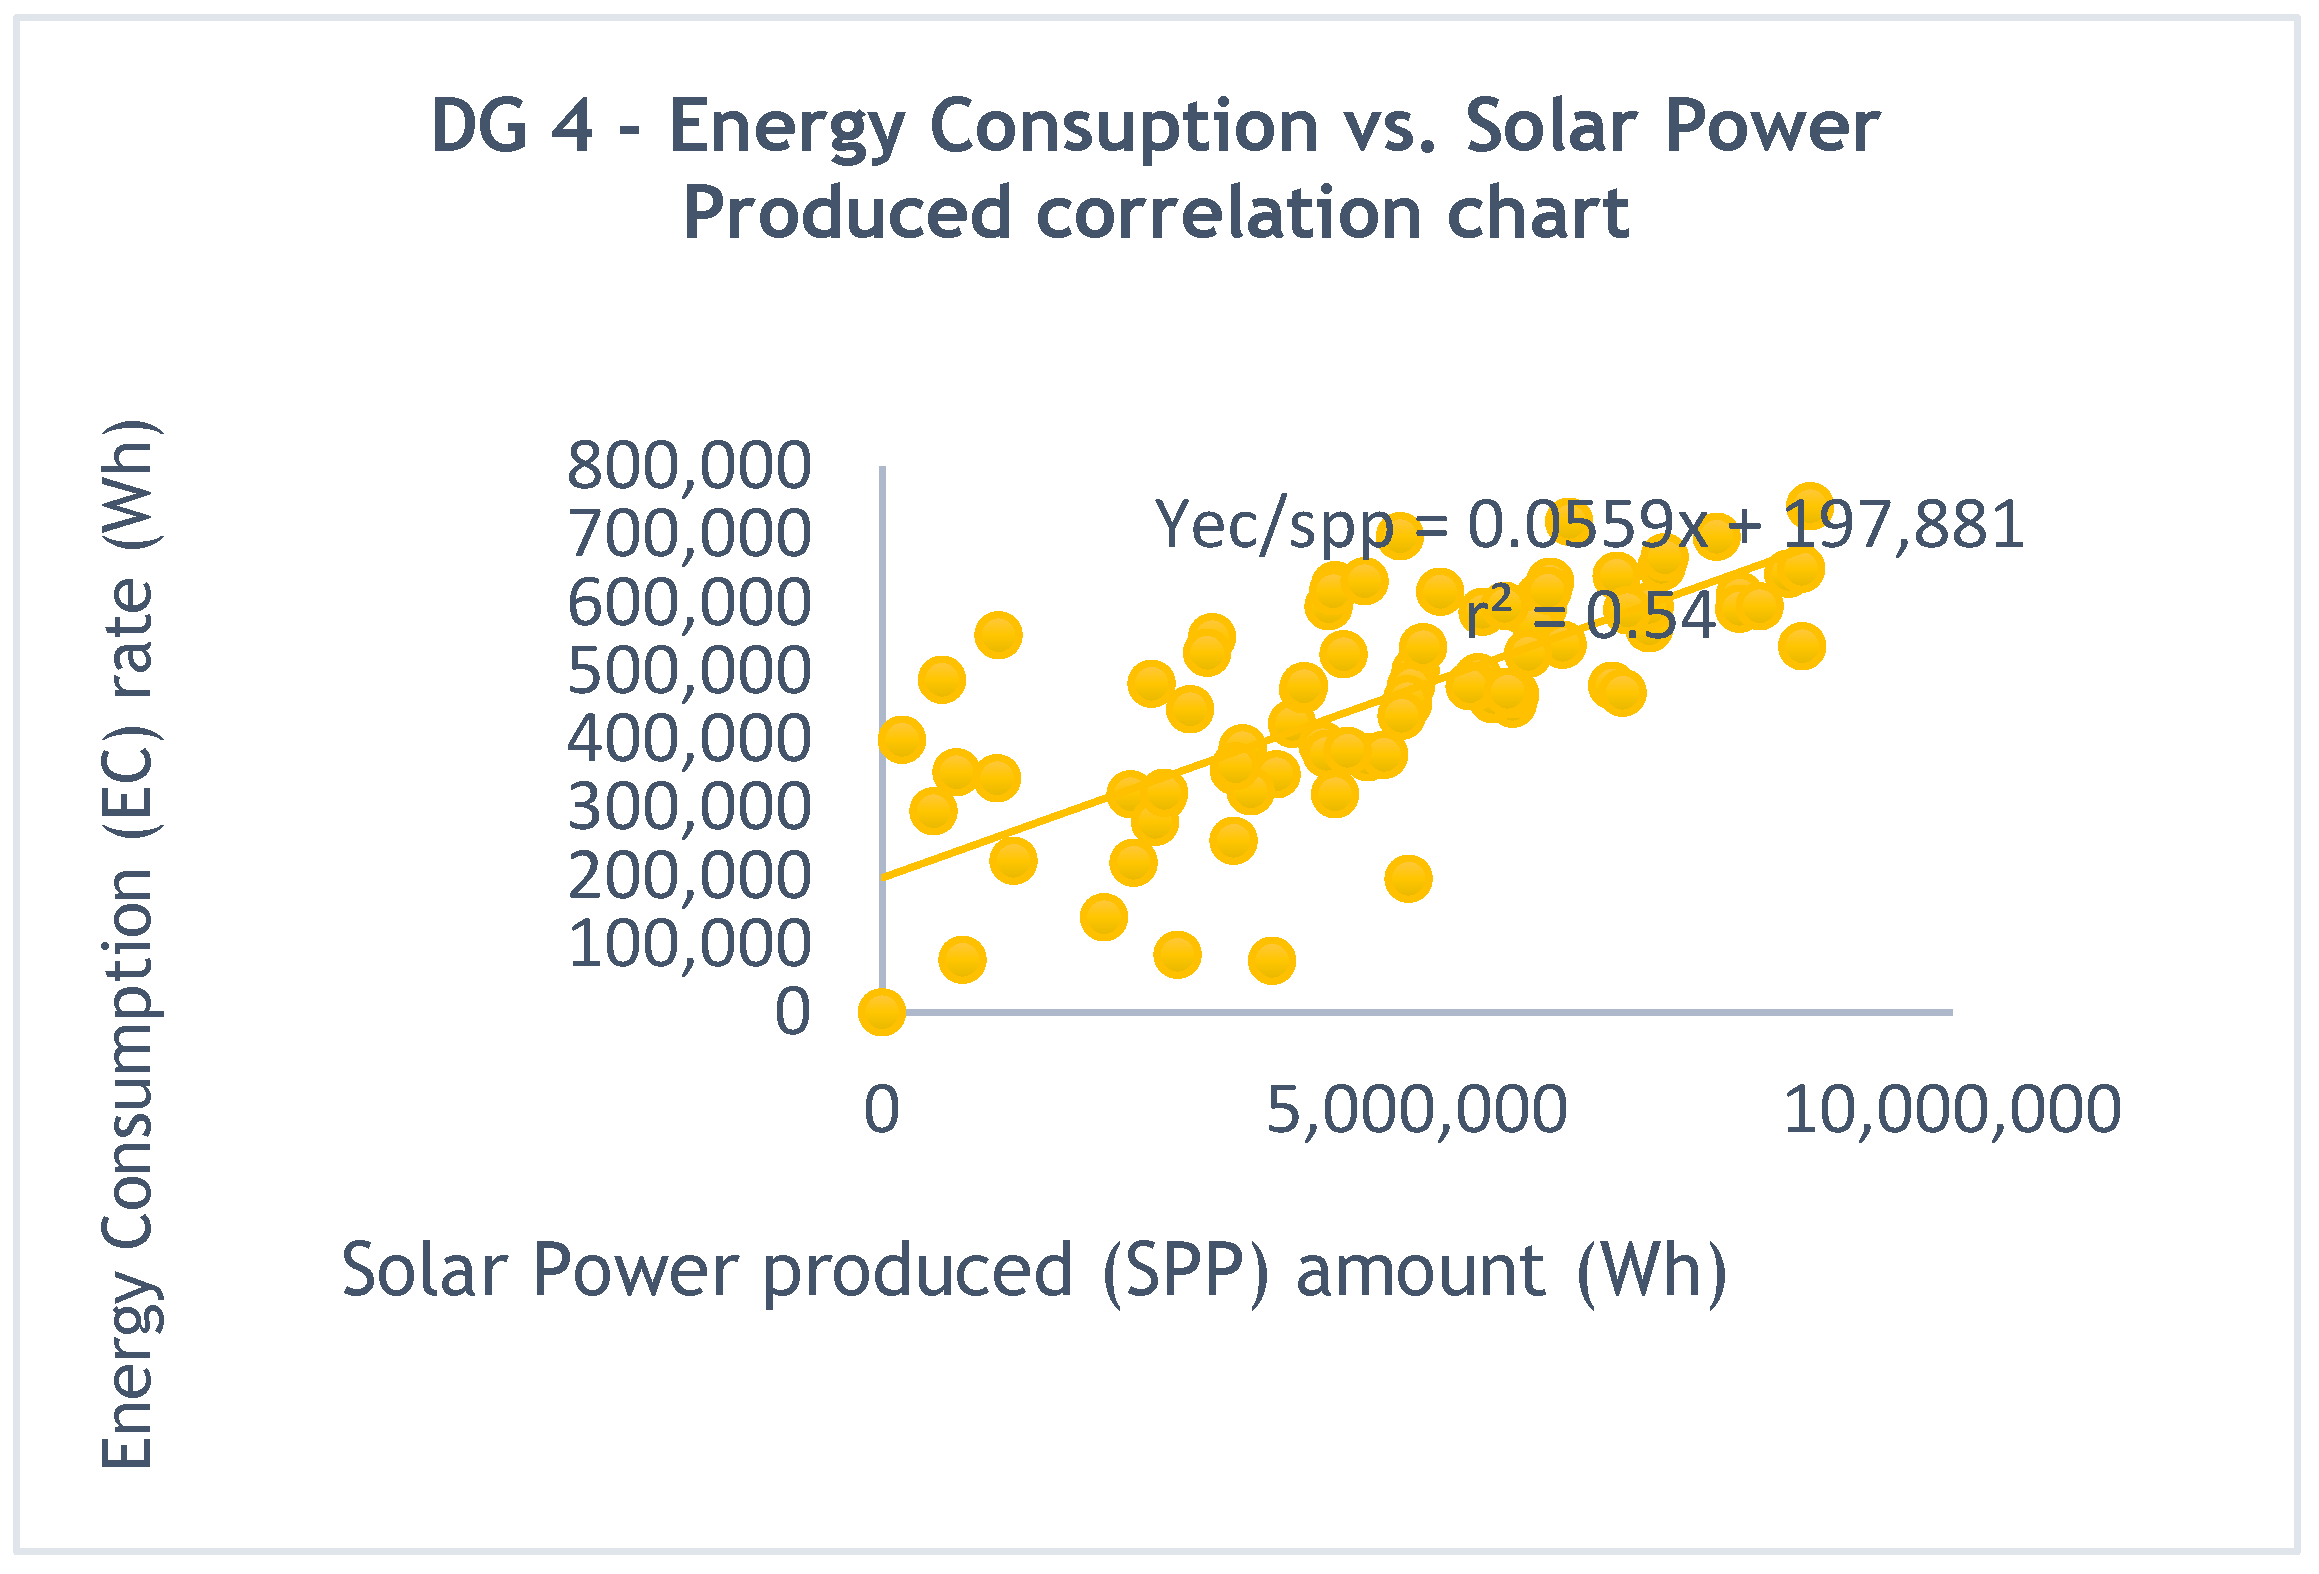
Figure 14 of DG 4 investigated the relationship between energy consumption and solar power produced. The figure below shows a strong relationship among parameters since r
2-value is 0.54. An increase in solar self-consumption amount also demonstrates an increase in energy consumption rate.
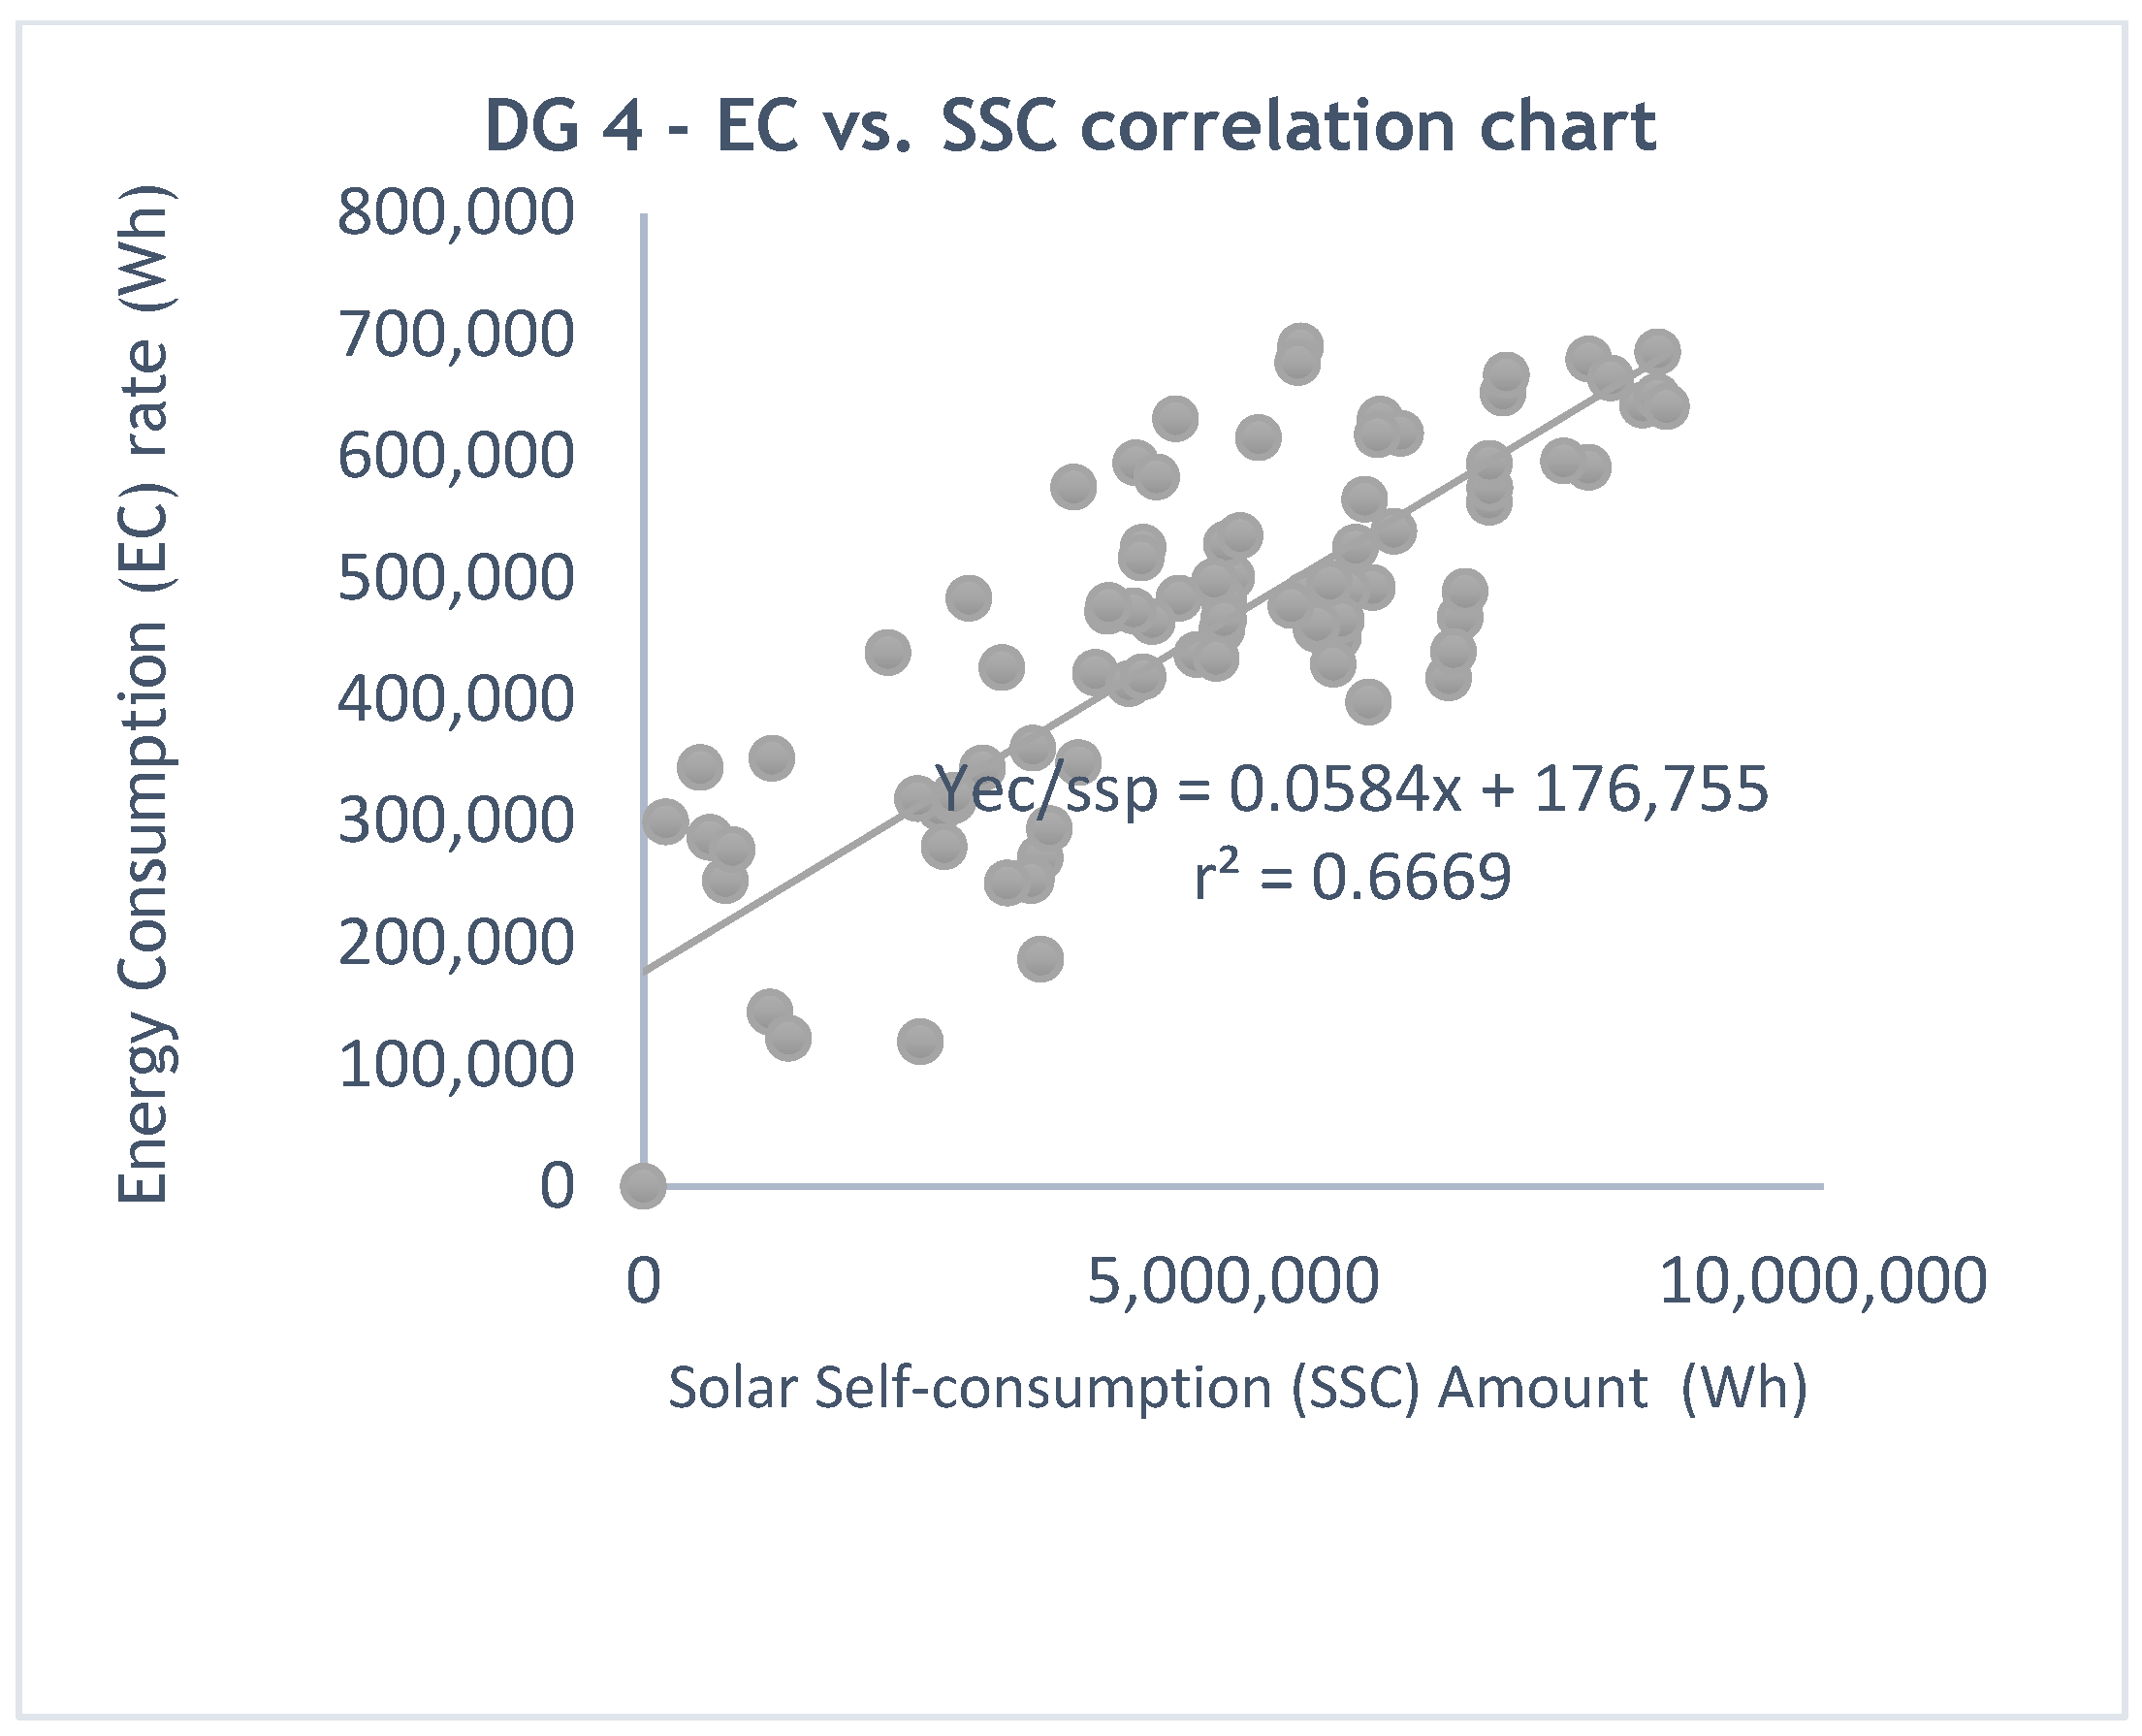
The solar self-consumption energy and energy consumption are investigated as well, and the relationship between these parameters seems to be strong, since it has an r
2-value of 0.67. This value demonstrates a good relationship among these parameters.
Figure 15 better demonstrates the relationship among the parameters.
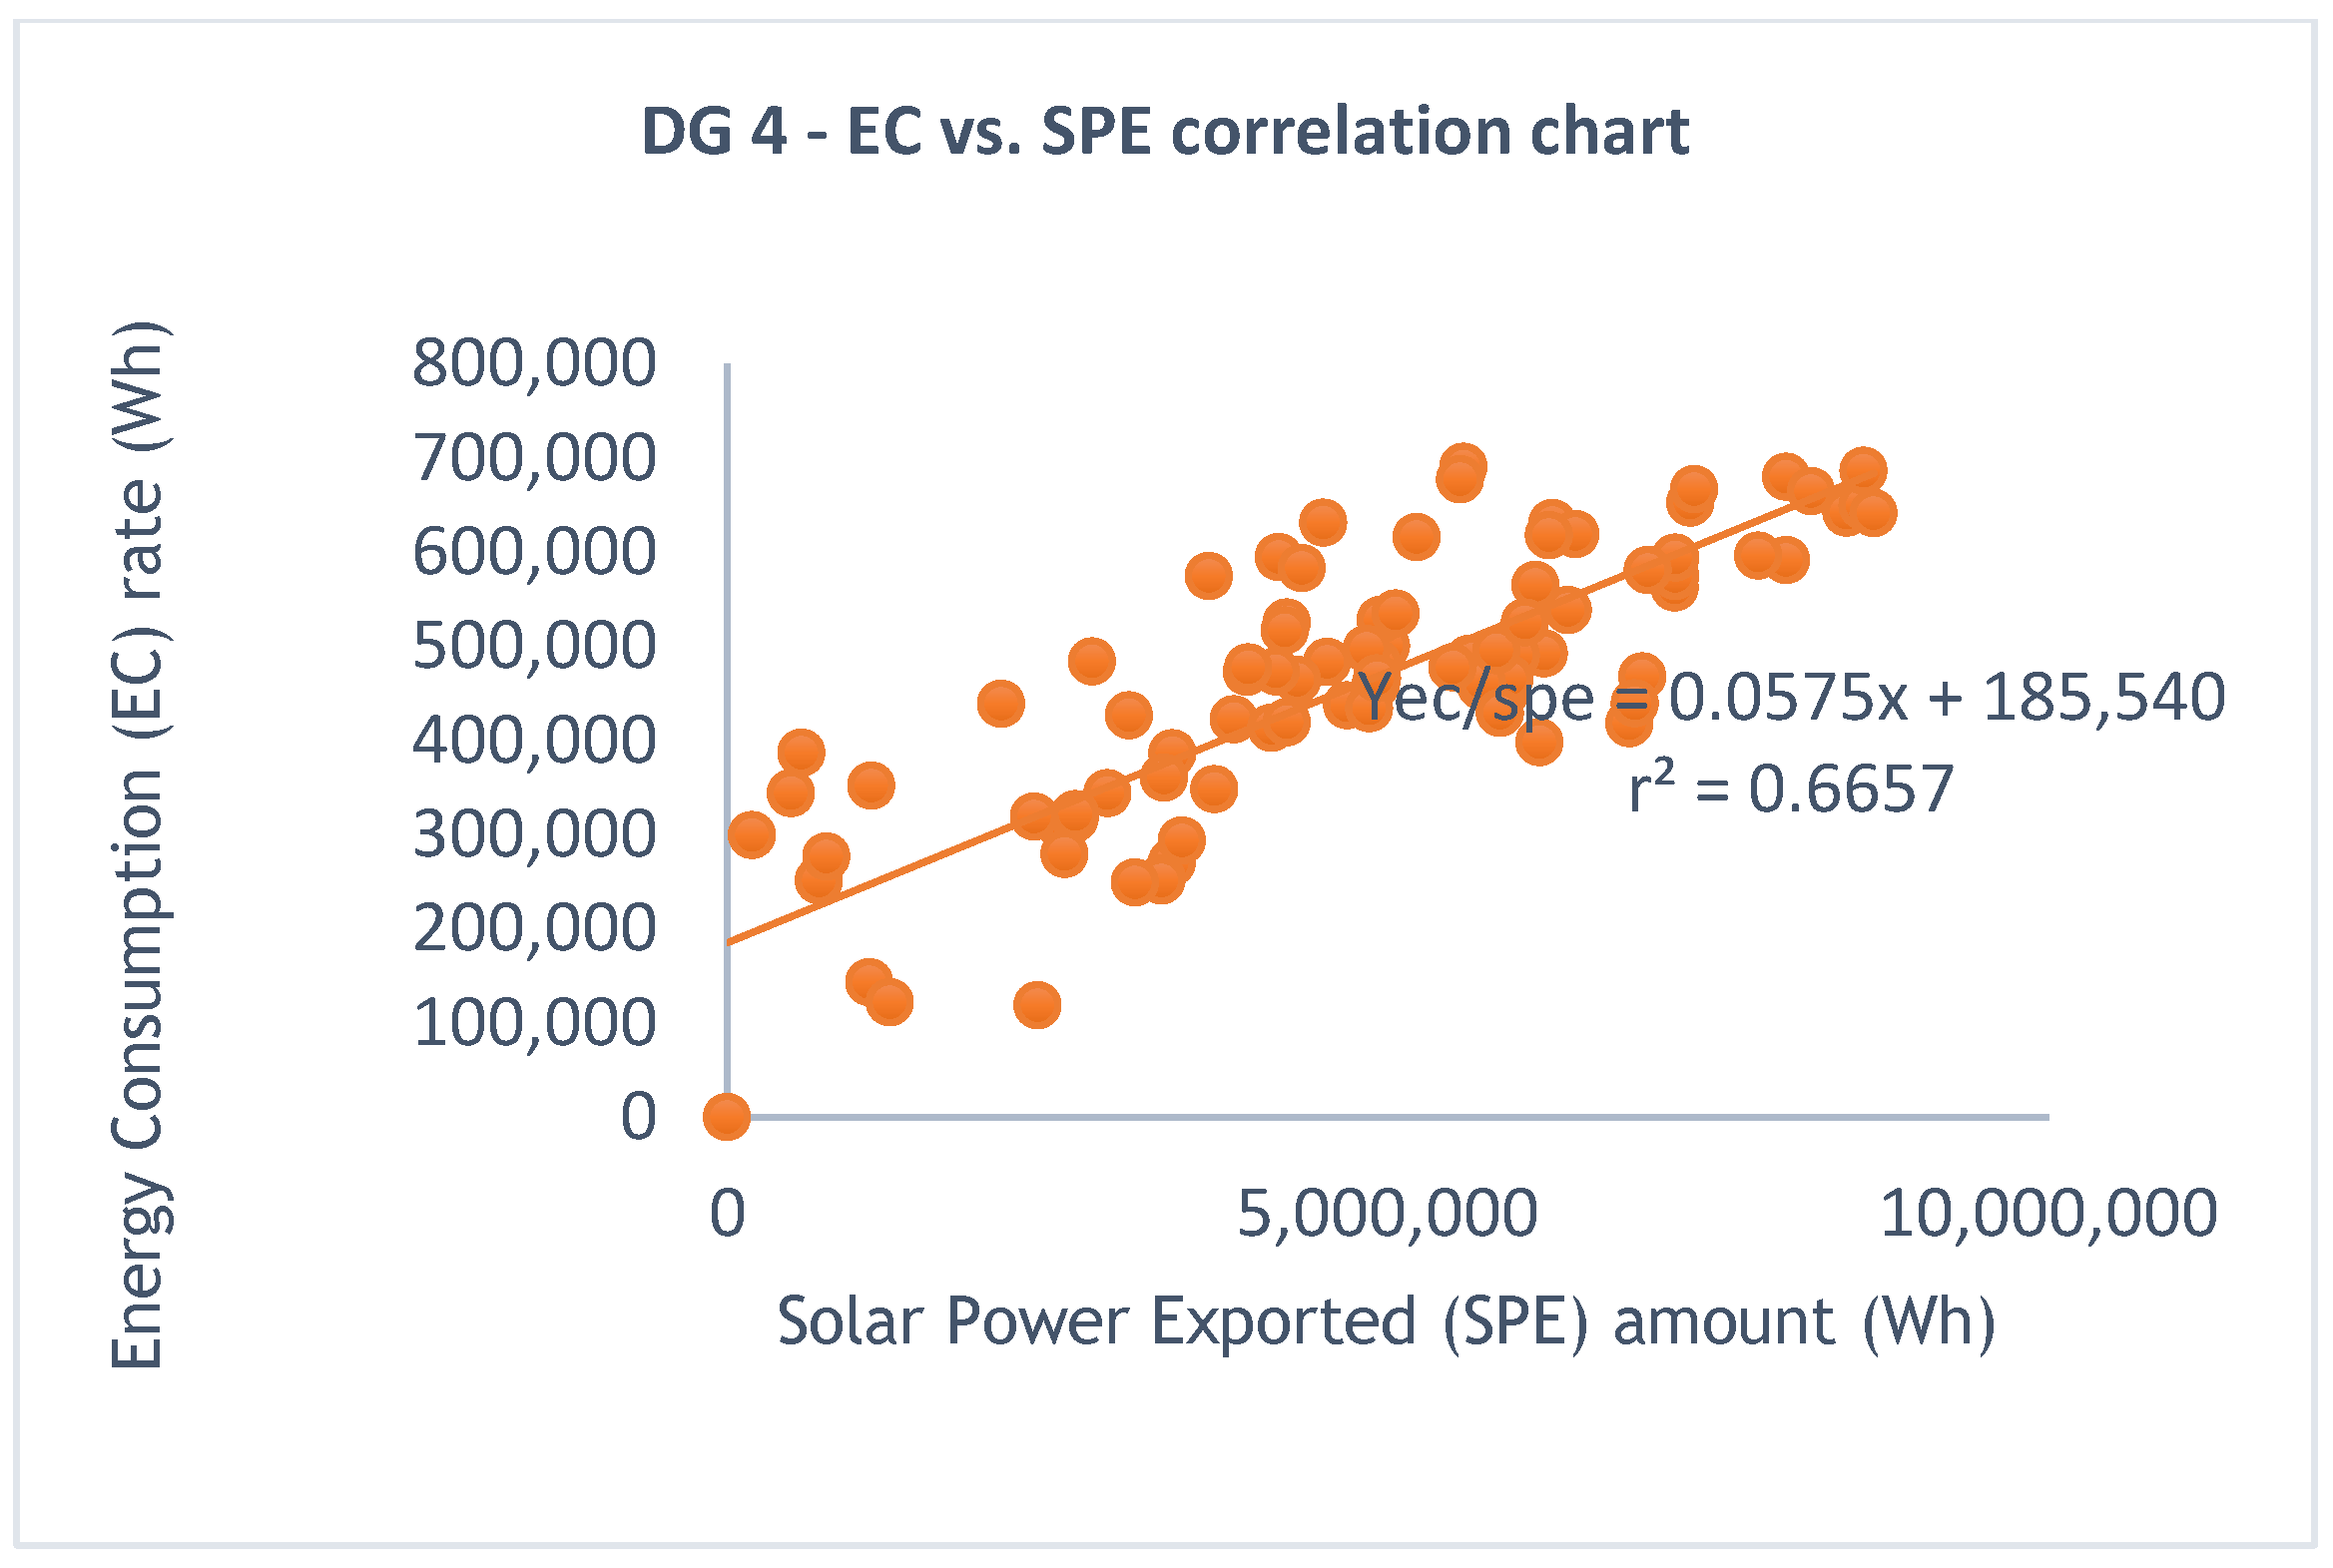
Figure 16 investigates the relationship between energy consumption and solar power exported. The graph below demonstrates a strong relationship between the two parameters. The slope of a graph is seen to be growing with 0.057 at all points and shows a high relationship with parameters. Furthermore, the systematically calculated r
2-value predicts a high level of solar power, as the r
2-value is above 0.5, and it is 0.67. However, most relationship shows a positive r
2-value that is more than 0.5. The relationship between energy consumption and solar self-consumption of DG 4 presented, shows a slight drop compared to others. Their r
2-value is found to be 0.537, which is high risk compared to others, but it is above the minimum expected value. However, the relationship is available, but not stronger than the other parameters compared before in the DG 4.
The y-intercept shows a growth of 0.0583 of all points, even though it is a small growth, it shows the positive relationship among the parameters.
The reason for outlining data grouping is to demonstrate the performance among the parameters during the different seasons and weather conditions. This assisted mostly in understanding the correlation among the parameters for different seasons of the year. Data grouping 1 (DG1) was the only data grouping that did not show a solid correlation by r2-value of 0.49 between energy consumption (EC) and solar system production (SSP). Nevertheless. All other parameters in all-data groupings (DG2, DG3, and DG4) show good correlation among each other as all have an r2-value above 0.50.
3.6. Application of Multiple Regression Model
The major purpose of applying a multiple regression model is to predict solar power production, numerous solar power routines. As well as trying to predict the solar power performance in the region of KZN, specify the morals of solar factors.
Based on multiple regression data, the observed variables all seem to have high levels of significance values. As all independent variables consist of
p < 0.05. The historical data was applied to the multiple regression to be able to analyze the future performance of the solar system.
Table 3 is the statistical summary of all variables.
Table 3 below clearly demonstrates the significance of each independent variable. The unpresented variable below, such as temperature, did not meet the significance requirement of 5% or less.
In summary,
Table 4 below demonstrates the following:
All the clarifying parameters remain statistically significant as they indicate positive correlation amongst the variables throughout the year, presented by seasons.
All have positive coefficients, which display that each clarifying variable a greater percentage is associated with a higher level of solar power production.
For every 1 Wh increase in the Wh of solar self-consumption and over, there will be an increase of 1.36%, 44.25%, 16.67% and 15,54% in the predicted value of consumption, import, export, and solar production, respectively.
The p-value clearly shows that the prediction is more likely to end in favor of the prediction as it is above 0.5.
Based on the correlation coefficient outcome suggests a very strong relationship between solar power production and the solar power factor (consumption, import, export, and solar self-consumption) [
18]. The coefficients of determination of solar power production (Y) with an r
2-value of 0.75 remained adequate to encounter the solar power consumption, for instance.
Table 5 below demonstrates all the regression statistical models. The actual strong relationships of solar production regression between solar consumption, solar power imported, solar power exported, and solar self-consumption suggest that the application of solar power production to solar power factors is even more suitable for reliably signifying the degree of solar power sustainability.
With four predictors together with a constant, there is an explanation of almost 75% of the variation in solar power production in the region of KwaZulu Natal. Fortunately, there are no exponential terms in equations, as exponential terms are considerably more complex, especially if the number of exponential terms keeps rising [
22].
4. Discussion
The ordinary temperature is seen to be between 22 °C and 25 °C on average for the region (KZN). Yet the lowest temperature seems to take place in June, July, and August, with a value of 11 °C, 10 °C, and 13 °C, respectively, based on the achieved results. This is the coldest period of the KwaZulu Natal region, as well as other parts of the country. According to the temperature forecasting presented in this study, the results will determine the amount of solar energy that can be produced during the period of lowest and highest temperatures. The colder it is, the more energy will be consumed; therefore, solar energy should be reliable and sustainable to be utilized by the citizens. Ref. [
23] cited that conventional energy sources are not reliable due to numerous factors such as high expense associated with them and poor maintenance policies.
The number of days was extracted from the previous solar power data to manage the prediction of future solar power production. The Yv is used to present solar power production as the dependent variable. As all coefficient gradients are positive, the slope shows a positive increase. The gradient of this line from interchanging fossil fuel to solar consumption, import, export, and solar self-consumption is 0.0136, 4425, 0.1667 and 0.1554, respectively, which designates that for an increase of 1 month in a year the predictable increase in solar production (Wh) is 0.0136, 4425, 0.1667 and 0.1554 units. Ref. [
24] has a strong belief that solar irradiance is a substantial factor affecting the efficiency of the system, which varies in different regions, as indicated in the KZN region. The predicted solar production each month, for example, the following table, provides values for each first day and month to make future predictions of solar power production.
where
Yv—represents a solar variable in a monthly day.
The y-intercept is 42,604 Wh; this simply means if the line were extended back to zero solar consumption, solar imported, solar exported, and solar self-consumption, then the solar produced value would be 42,604 Wh. The error also indicates satisfaction of 0.25 with the result, which shows a low level of possible error occurrences in solar systems in the KZN region. The amount of solar energy that can be harvested according to the projected result clearly demonstrates that solar energy, especially the PV system, is in good standing to be utilized by the KZN region.
5. Conclusions
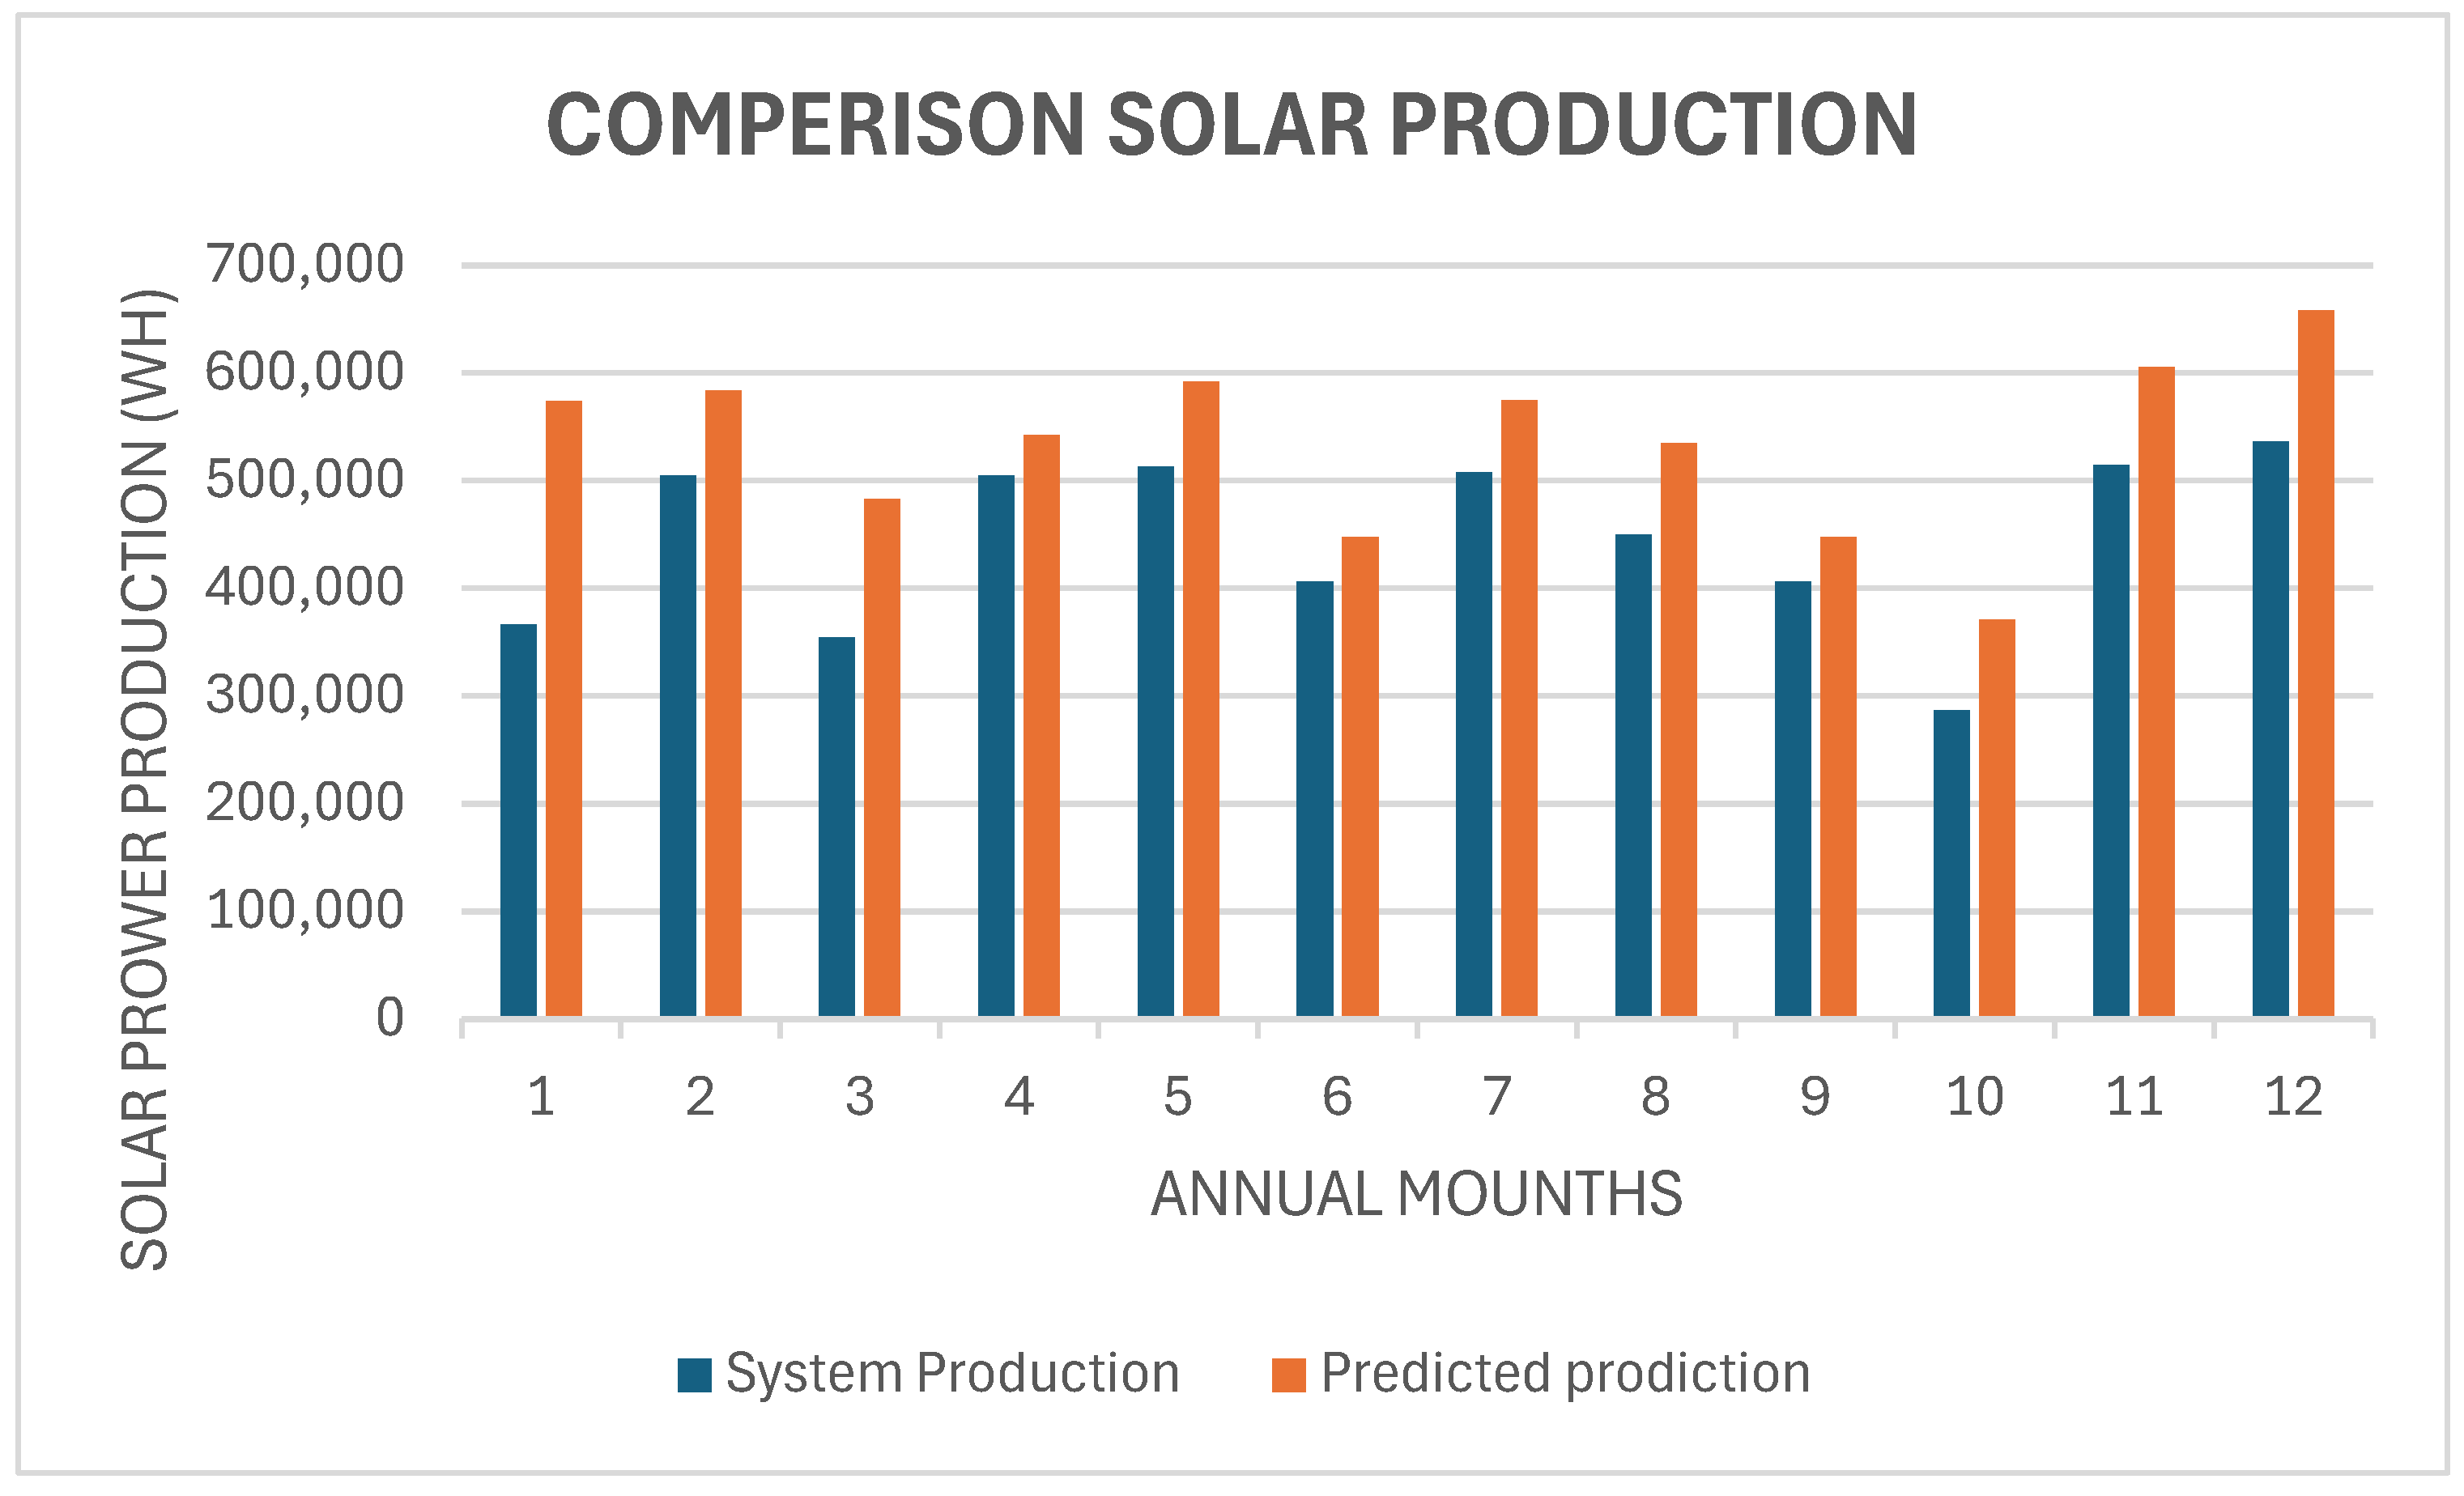
The above calculations, a predictive chart to give a better review of solar production in the region of KZN yearly. The seasonal grouping variable assisted in determining the correlation of each month. The minimum solar power that could be produced is 42,608 Wh, as indicated in
Figure 18 below in months 3 and 4, respectively. The minor decrease in solar power production is predicted to be in months 2, 6, and 8 of 5.6%, 3.9% and 3.9%, respectively. The factors that seem to have major effects are solar radiance and temperature. The predicted increase is expected for every month throughout the financial year, 36%, 14%, 27%, 7%, 13%, 9%, 12%, 16%, 9%, 23%, 15% and 19%. However, there are months where there are very minimal predicted increases, such as months 4, 6, and 9.
The expected performance of solar power in the region of KwaZulu Natal is graphically summarized. The summary shows the next 360 days of solar power production using the same period as the database (March to February). The performance of solar power production as per data grouping (DG) scale shows that solar power production varies according to solar availability. The solar power production at a small scale (100 MW) is summarized based on the four data groupings. Solar power production (Wh) in the DG 1 shows almost 32% of solar power to be produced in this term [
25]. This brings confidence that electricity can be produced using solar power and generate household activity without a negative effect, such as load shading [
26]. The solar power production drop is expected in DG 2 and DG 3 as predicted earlier in the study.
The solar power production in DG 2 and 3 will be almost 26% and 27%, respectively. As the purpose of regression models is to find the most efficient equation to represent the link between the output parameter of volumetric efficiency and other input parameters, including load [
27], the best season to harvest solar energy is the one with DG 4, based on the high amount of solar energy. However, it is necessary to have more solar storage compared to other seasons because it will be insufficient for the data group 4. To address the issue of less solar implementation due to well-known solar challenges, an interpolation management system is applied to the data grouping.
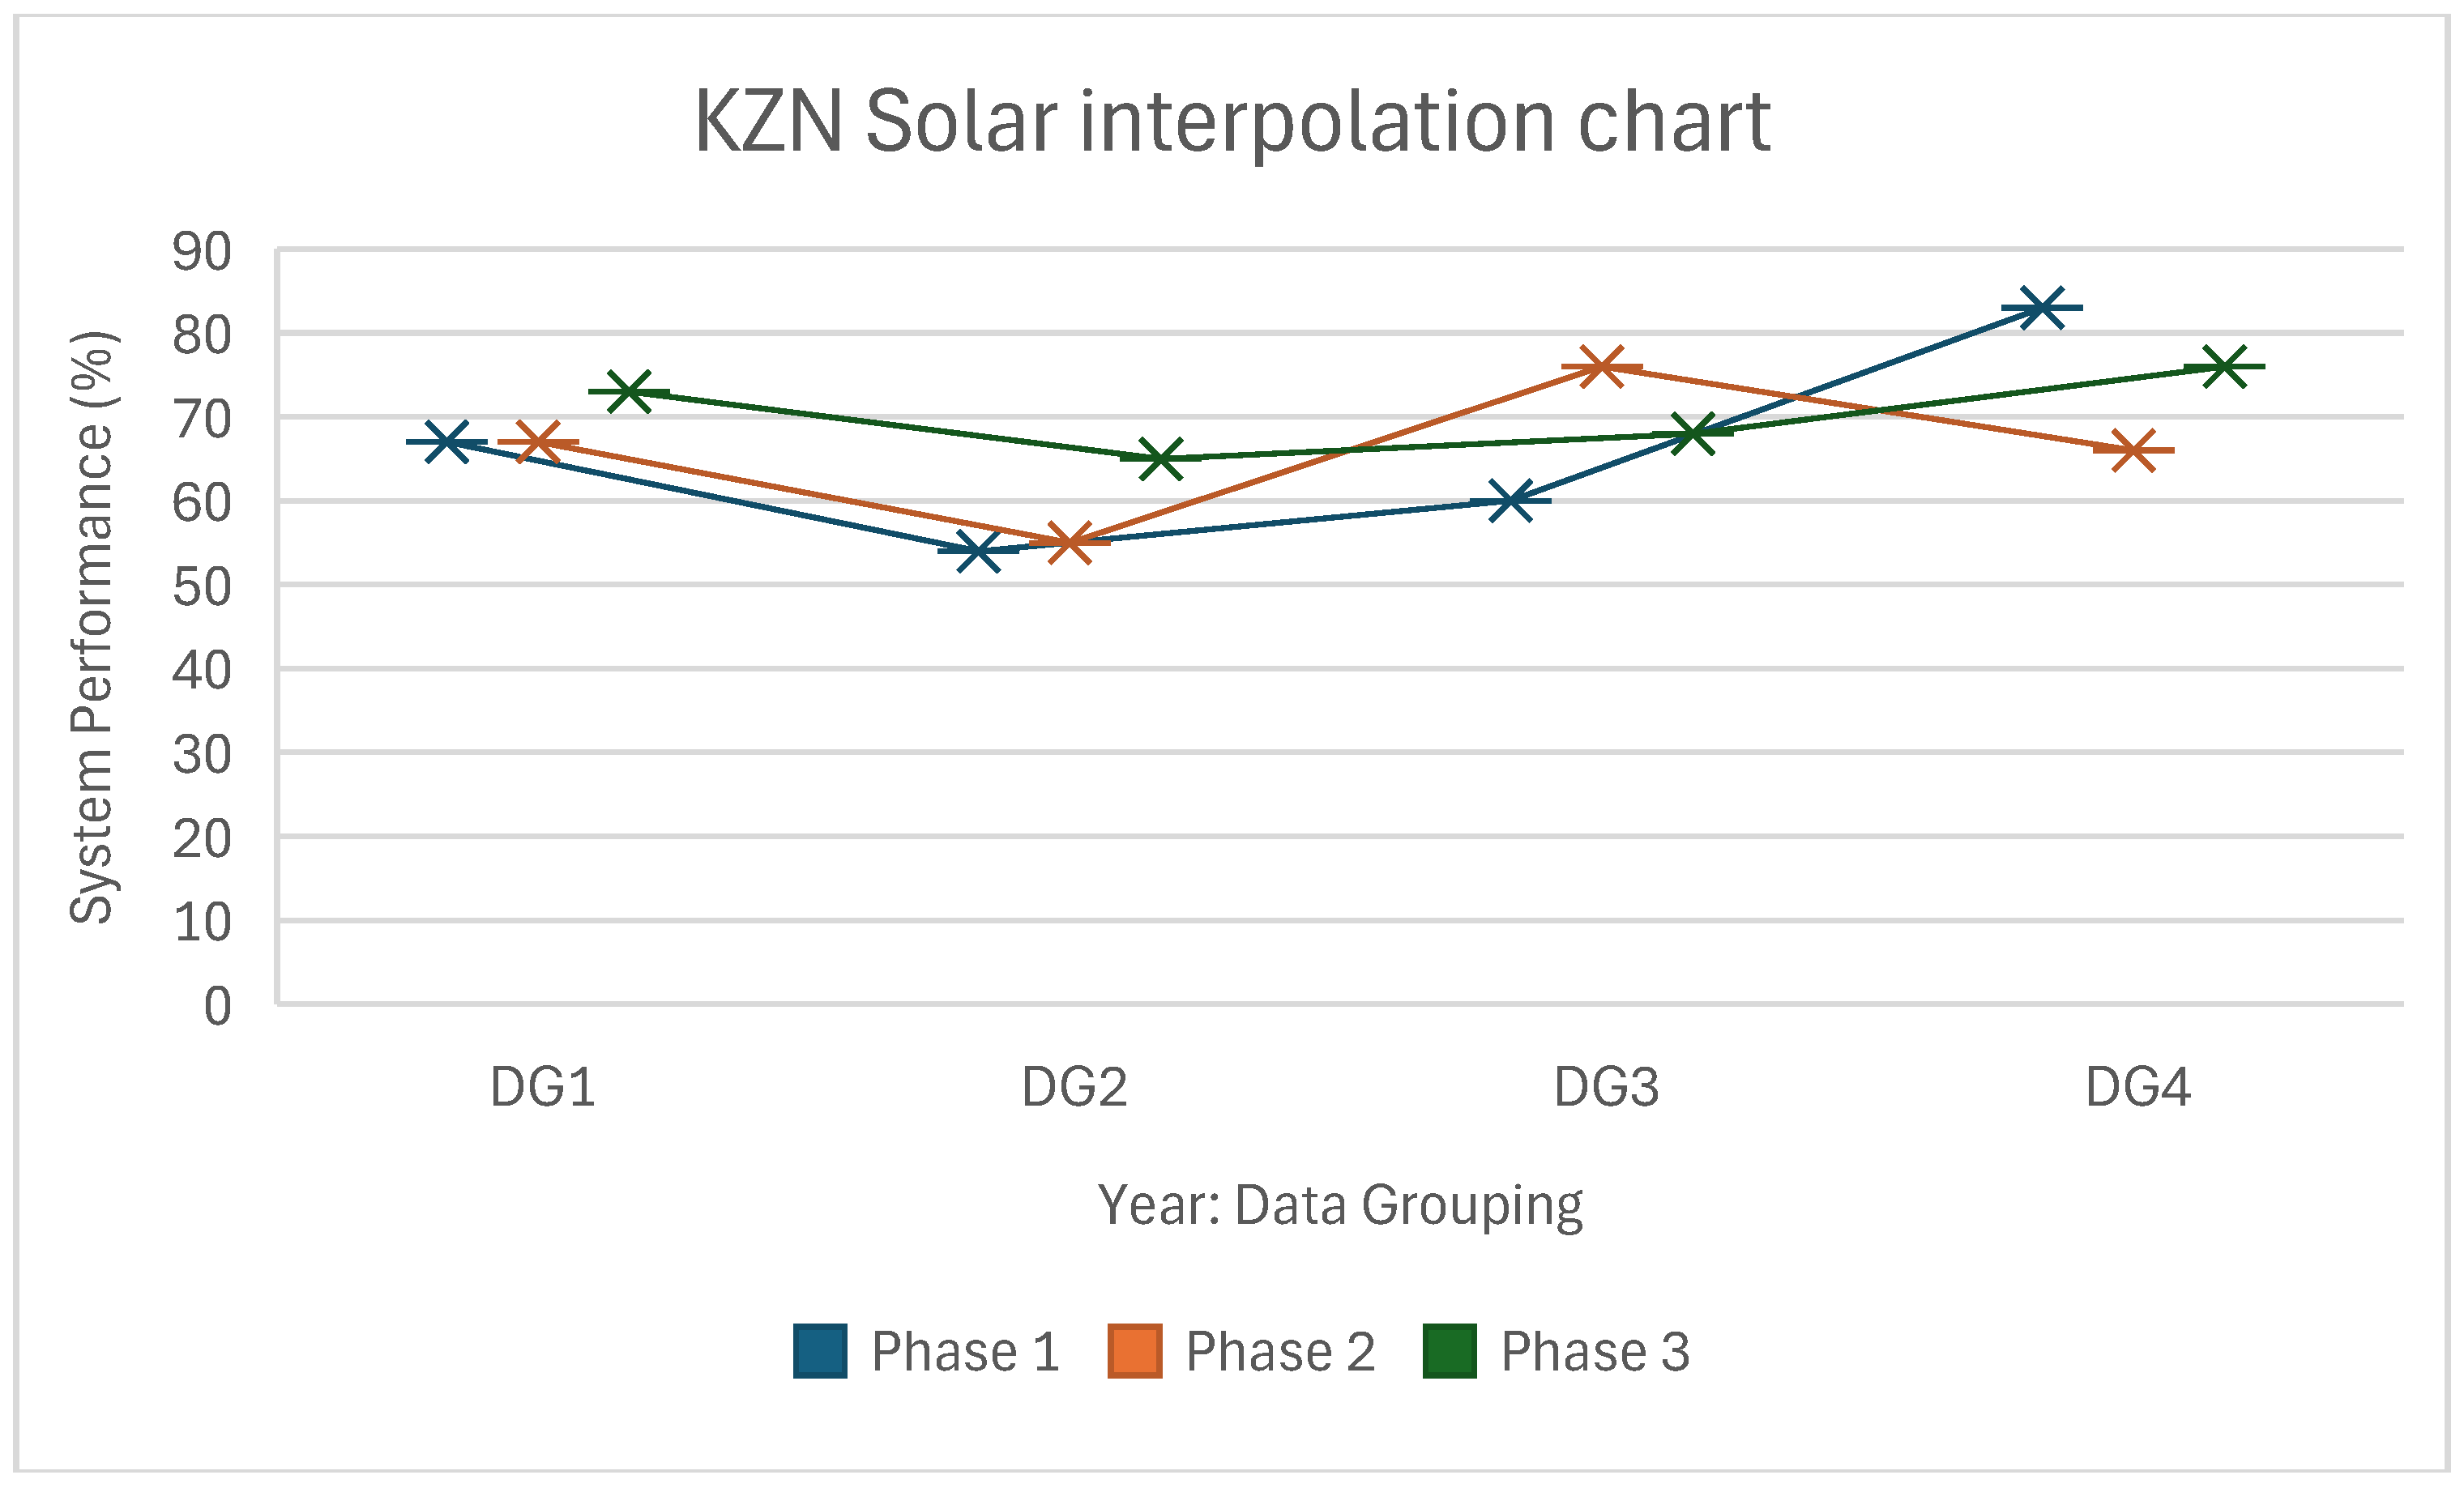
Figure 19 reflects the results of interpolation based on the relationship of all the variables.
The main reason for this chart is to address the well-known challenges that are of main concern to the investors and people who are interested in utilizing solar energy soon. Solar system performances are based on the data grouping result and are used to determine how the system can be monitored. DG1 demonstrates that all phases range between 60% and 75% which has the best performance. Same as for DG3 (range 60–75%) and DG4 (range 60–85%). These are the tolerated performances of the solar system where more energy can be consumed. Looking closely at DG 2 phase are lower than 60% except phase 3, which simply indicates the system implementation point or maintenance point. In this way KZN region can implement a successful solar system. Ref. [
28] agrees that there is a need to monitor the solar system in order to make knowledgeable improvements as they insert an inorganic buffer layer between the electrode and active layer to address life span, among other things.
The correlation of all variables indicates positivity that will be helpful in the region of KZN during solar implementation. Based on the outcome of the data grouping, solar power production is favorable throughout the year in the region of KZN, like all other regions in South Africa. Solar economic and social challenges, such as intermittency, cost, and recycling, can be addressed through continuous improvement after carefully determining the deterioration of the system throughout the year.
The last solar power production in DG 4 is expected to be 38%, which is a high level of solar production that can be produced in a region, according to data gathered. It is achieved that the highest solar shine can be in mid-November, with almost 68% and the lowest around August with 32% [
29]. So, as the study predicts that during the data grouping 4, the KZN region will be highly productive in solar production. KZN still needs to be investigated further to accommodate all developing and developed regions. The hybrid solar panel system that will be in line with a low solar energy harvest area must be researched in the near future.


