Abstract
The U.S. ironmaking sector plays a key role in global greenhouse gas emissions, mainly due to long-standing practices such as blast furnaces (BFs) and direct reduction (DR). In this work, we develop a new mathematical approach to estimate future CO2 emissions from the U.S. ironmaking industry through 2050. Our approach uses historical data from 2005 to 2021 and incorporates economic and energy use indicators to explore how emissions might change over time. According to our results, unless significant technological improvements and stronger energy policies are implemented, the industry is likely to continue producing large amounts of CO2. These findings highlight the pressing need to adopt cleaner alternatives—such as hydrogen-based direct reduction—to help meet international climate goals. Supporting the transition to low-emission technologies contributes to broader efforts in sustainable industrial development and long-term climate resilience.
1. Introduction
Climate change is a global problem and is not limited to a single country. Approximately half of the carbon dioxide (CO2) emitted by human activities remains in the Earth’s atmosphere [1,2,3,4]. In general, climate change and its consequences—such as global warming and the increasing occurrence of wildfires—have significant implications for achieving the goals outlined in the UN Climate Change Conference 2021 statement, which aims to limit fossil fuel consumption by 2050. Additionally, according to the Paris Agreement, mitigating global warming to below 1.5 °C requires adjustments in both the timing and volume of emission reductions [5].
The ferrous metallurgy sector, which includes iron and steel production, is one of the largest and most impactful industries worldwide. It produces approximately 1900 million tons (Mt) of material each year and is responsible for nearly 70% of greenhouse gas emissions from metal manufacturing. The sector also ranks fourth globally in fossil fuel consumption [6,7]. Producing one ton of iron typically results in the emission of approximately 1.5 tons of carbon dioxide [8].
As a result, this sector is responsible for around 8% of global final energy consumption and 7% of CO2 emissions tied to the energy sector, including emissions from industrial processes. Forecasts show that steel demand could rise by 50% by 2050 [9]. Still, climate targets aim to cut carbon emissions from this sector by 35% of total industrial reductions [10]. Meeting these goals will require reducing the iron and steel industry’s emissions share from 8% to 3% or even lower by 2050 [11]. One study found that improving the world’s iron and steel production infrastructure could reduce carbon emissions by 58.7 gigatons between 2020 and 2050—approximately equivalent to two years’ worth of net global carbon emissions [12].
Currently, most iron is produced using BFs and direct reduction furnaces (DRs) [13,14]. The products of these furnaces are known as pig iron and sponge iron, respectively. Sponge iron, also referred to as direct reduction iron (DRI), is produced by conventional processes such as MIDREX [15] and HYL III [16]. Additionally, some processes have been developed that consume biomass (e.g., non-coking coal) and are referred to as smelting reduction (SR) processes, such as FINEX [17] and COREX [18]; others use hydrogen gas as a clean energy source with almost no emissions—a process called Hydrogen Direct Reduction Iron (HDRI) [19,20,21]—or utilize plasma hydrogen for reduction [22]. These processes emit less CO2 than BF and more than DR processes [14]. Pig iron or sponge iron, along with scrap iron, is then loaded into an electric arc furnace (EAF) to produce steel—a process known as steelmaking [23,24,25]. The production of pig iron and DRI consumes significant amounts of coke (<80% C) and natural gas (<70% CH4), respectively, as shown in the following basic reactions:
On average, the production of one ton of pig iron and DRI consumes approximately 400 kg of coke and 200 kg of natural gas, respectively. Therefore, these ironmaking processes emit significant amounts of CO2 into the atmosphere. For example, the BF process emits about 1.9 tons of CO2 per ton of iron [14], while emissions are approximately 1.1 tons for DR [26] and 1.5 tons for SR [27], respectively. In addition, CO2 emissions from electricity generation should also be taken into account, as the ironmaking processes discussed here require substantial electrical energy. Much of this electricity is generated by thermal power plants that rely on fossil fuels such as coal and natural gas.
As the demand for iron and steel production continues to rise in the future, the associated energy consumption and CO2 emissions will also increase. Therefore, forecasting and managing iron production, energy consumption, and CO2 emissions in the future are necessary. A number of studies have explored projections of energy use and CO2 emissions in metallurgical sectors. For example, Tian et al. assessed strategies for reducing CO2 emissions in the aluminum supply chain from 2010 to 2050 using developed modeling approaches [28]. Similarly, Zhang et al. investigated emission reduction in steelmaking plants through a physical modeling approach [9]. In another example, Benjamin and Lin studied how economic factors influence carbon emissions using a quantile-based method [29].
Regarding the proposed scenarios for the future of ironmaking and steelmaking worldwide [30], recent models and predictions have been developed based on the specific conditions of different regions. According to the IPCC (Intergovernmental Panel on Climate Change) and IEA (International Energy Agency) reports, achieving carbon neutrality depends on indirect emissions reaching net-zero earlier than direct emissions from the steel industries. It is suggested that achieving net-zero emissions for the heavy industry sector will require net-negative emissions from electricity generation. This presents a significant regenerative sustainability challenge to maintain consistency with the 1.5 °C pathway [31].
In 2022, Suer et al. [32] carried out a life cycle assessment (LCA) to analyze the environmental impacts of two main steel production routes: primary steel using the blast furnace process and secondary steel via the EAF. Their study highlighted the importance of moving from coal-based practices toward hydrogen- and electricity-powered technologies to support decarbonization in the steel industry. They also noted that interim steps—such as hydrogen injection or using pre-reduced iron in blast furnaces—can already cut greenhouse gas (GHG) emissions by up to 200 kg CO2 for every ton of hot metal produced. Globally, blast furnaces remain the dominant ironmaking method, though several countries—particularly in Europe and East Asia—are actively advancing hydrogen-based direct reduction technologies. The U.S. decarbonization pathway differs due to its energy mix, policy structure, and legacy infrastructure, highlighting the importance of region-specific emissions forecasting [33].
Morfeldt et al. took a closer look at how global climate objectives might shape technological choices in the iron and steel sector, with special attention to scrap utilization. By combining a global energy system model with a scrap availability framework, they assessed how shifts in steel demand, recycling behavior, and scrap supply could affect the selection of production technologies [34]. In addition, Shen et al. focused on China to develop a comprehensive model for exploring potential CO2 emission pathways in the country’s iron and steel industry, based on nationally determined contributions and climate targets in line with the Paris Agreement. They projected total CO2 emissions from 2015 to 2050. Through this analysis, they discussed potential barriers and strategies related to hydrogen steelmaking, carbon capture and storage (CCS), and the transformation of the electricity generation structure in the iron and steel industry [35].
This study proposes a novel mathematical model to forecast CO2 emissions in the U.S. ironmaking industry by 2050, using data collected from 2005 to 2021. The U.S. is the sixth-largest pig iron producer in the world [36]. The model aims to comprehensively forecast and analyze CO2 emissions across the main ironmaking methods through 2050. The accuracy of carbon emission predictions depends on the quality of the algorithm and the inclusion of influencing factors such as the production rate, type and quantity of fuel consumption, and electrical energy consumption, among others. The model specifically focuses on fuel consumption to forecast carbon emissions, which may support the development of energy policies, the optimization of energy consumption structures, and the implementation of new methods in ironmaking processes.
2. Methodology
2.1. The Economic Model for Predicting Iron Production
To develop an economic model for predicting iron production up to 2050, we use the Klein model [37,38], which has been modified based on econometric parameters specific to the U.S. iron sector. This modification incorporates relevant parameters that may influence iron production.
For data inputs, we use a range of indicators covering 2005 to 2022. These include GDP, population growth, and government spending—sourced from the Federal Reserve Economic Data. We also consider pig iron production, the amount consumed domestically, and the amount exported (the latter two obtained from U.S. Department of the Interior reports). Overall, the model reflects both domestic use and exports. These parameters shape the projected output and capture iron demand from both sides. Based on these inputs, the model uses a linear equation as follows:
where in Equation (3), represents the production of pig iron in year y, denotes Gross Domestic Product in year y, is the population in year y, refers to the domestic consumption of pig iron in year , represents the export of pig iron in year , indicates government expenditures in year y, refers to the Consumer Price Index in year y, and represents the ratio of GDP to population in year y. to are constant coefficients of the linear Equation (3). This model can be solved using programming software such as Python, MATLAB, etc., provided that an accurate database is available for a specific region or country.
2.2. Modeling Energy Consumption and CO2 Emissions
In this study, we use applied machine learning models to predict CO2 emissions and energy consumption for the pig iron smelting process during the period 2015–2050 in the U.S. The main methods of ironmaking in the U.S. are BF and DR [13]. We collect historical data on iron produced by these methods during 2005–2022 from the U.S. Department of the Interior. It is necessary to gather two major influencing factors related to energy consumption—coke and natural gas—for the production of pig iron (using the BF method) and sponge iron (using the DR method), respectively.
Based on the collected information, we calculate the amount of iron production for the specified period (2005–2050) using the linear economic model explained in Section 2.1. Then, we compute the total carbon emissions, including both the carbon consumed during the iron production process and the carbon emitted from electricity generation. This electricity is consumed throughout the ironmaking processes. The flow diagram of the proposed model for carbon dioxide emission prediction is displayed in Figure 1.
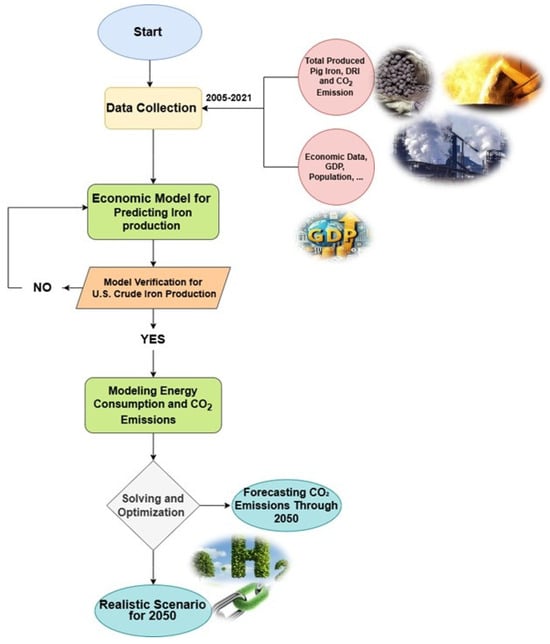
Figure 1.
The flow diagram of the proposed model for carbon dioxide emission prediction.
To solve and complete the model, we make the following assumptions based on current technologies:
- The U.S. economy will continue to grow steadily without significant economic disruptions.
- Demand is assumed to equal production.
- Under current conditions, energy requirements for BF and DR processes are approximately 12.4 and 9.2 GJ/ton, respectively [14]. Furthermore, they consume approximately 575 and 256 kWh of electrical energy per ton, respectively. Employing modern technologies (e.g., using hydrogen as a reductant) may reduce these values.
- CO2 emission factors for BF and DR processes are approximately 1.8 tons [39] and 1.1 tons [40,41] per ton of produced iron, respectively.
- The production of each kilowatt-hour (kWh) of electrical energy emits approximately 0.4 kg of CO2 [42].
We note that the adoption of modern technologies could help reduce these values. In particular, the use of renewable energy for electricity generation could significantly lower the emissions associated with electrical energy production.
2.2.1. Consumption of Energy
An energy model is introduced to assess the energy consumption of the U.S. ironmaking industry as follows:
where in Equation (4), represents the total energy consumption of crude iron production (e.g., pig iron or sponge iron) in year y (kWh), and , , and refer to the production of crude iron in process i (e.g., Midrex or HYL (III) processes in DR technology), the unit energy consumption (kWh/t), and the implementation rate of process i in year y, respectively. and denote the energy-saving potential of technology j (e.g., BF, DR, and HDRI) in year y and the implementation rate of technology j in year y, respectively.
The cumulative energy consumption per ton of produced iron (CEC) over the years can be calculated using the following equation:
2.2.2. Carbon Dioxide Emission
The CO2 emissions from the production of crude iron can be calculated using the following equation, referred to as carbon emission (CE):
where denotes the CO2 emission factor, which depends on the type of fuel used and the efficiency of process i.
3. Results and Discussion
3.1. Model Verification and Production Trends Analysis for the U.S. Crude Iron Production
Having access to consistent and accurate data on U.S. crude iron demand and output—including both pig iron and DRI—is key for evaluating the CO2 emissions associated with this industrial activity. These data also serve as a foundation for developing strategies aimed at reducing emissions and meeting global climate targets. A proposed model for predicting crude iron production (described in Section 2.1) has been verified using real production data from 2005 to 2022. Figure 2 compares the modeled results with the actual crude iron production data. As shown in Figure 2, the modeled crude iron production closely matches the real data for the 2005–2022 period. Approximately 70% of this crude iron has been produced by the BF process, and 30% by the DR process. This good agreement suggests that the model can be reliably used to predict pig iron production trends through 2050.
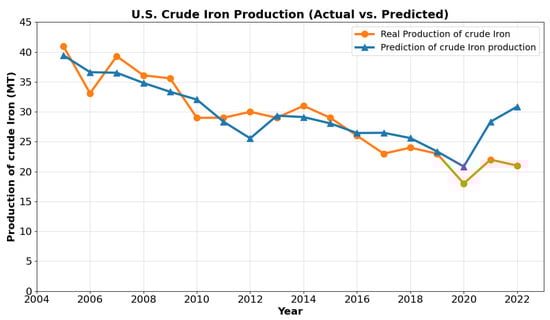
Figure 2.
Comparison of modeled and actual iron production in the U.S. (2005–2022).
Figure 3 shows the results of the proposed model for crude iron production through 2025. While Figure 3 depicts a slight decrease in crude iron production by 2025, this does not necessarily indicate a shortage of steel. The decrease—potentially caused by factors such as a shift toward more efficient steel production methods that use less crude iron, like electric arc furnaces (EAFs) relying on scrap steel [43], and stricter environmental regulations—reflects broader production trends.
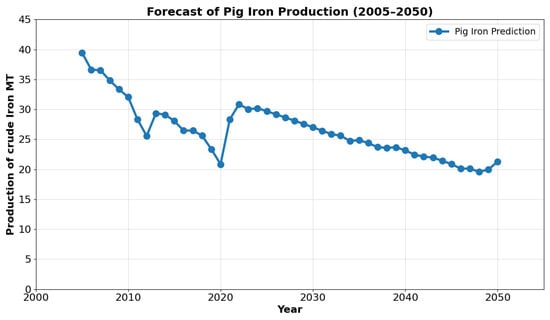
Figure 3.
Predicted crude iron production by 2050.
However, the paper emphasizes the distinction between production and consumption. Even if production declines, the overall demand for iron and steel may still rise due to population growth and economic expansion, leading to increased consumption. This potential rise in consumption highlights the paper’s central objective: to control emissions from ironmaking industries. By implementing effective strategies, the paper aims to achieve this goal and minimize the environmental impact of crude iron production, regardless of any slight decrease in output.
The current production of crude iron—considering a production rate and implementation rate of 10,000 MT/day and 95% for the BF process [14,44]—accounts for approximately 70%. Additionally, the production rate and implementation rate of 3600 MT/day and 95% for the DR process account for approximately 30% [15]. Assuming no further development in crude iron production by 2050, the CO2 emissions during this period can be plotted in Figure 4. This figure illustrates that emissions from the DR process are much lower than those from the BF process; however, the production and implementation rates of the DR process are lower than those of the BF process. Since the DR process consumes natural gas, its associated CO2 emissions are lower than those of the BF process, which consumes coke.
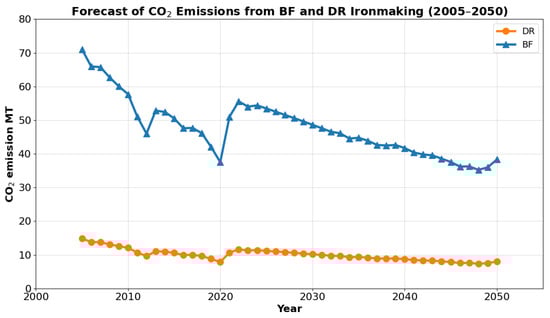
Figure 4.
CO2 emissions prediction for crude iron production.
As outlined in the introduction regarding international agreements, the CO2 emission reduction target for iron and steelmaking in the U.S. should decrease from 8% to 3%. Therefore, considering the total emissions in 2005 as 86 MT CO2, this value should be reduced to approximately 32.25 MT. According to Figure 4 and Figure 5, in 2050, the predicted production of crude iron will release 47 MT of CO2 into the atmosphere and consume 76 MWh of energy. To meet the international agreements and reduce CO2 emissions, it is essential to focus on developing new and cleaner ironmaking technologies. These advancements have the potential to significantly reduce emissions while accommodating the growing demand for iron and steel.
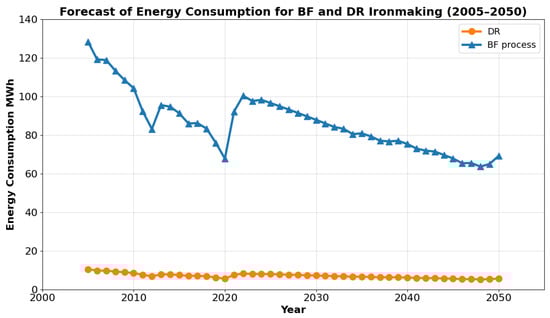
Figure 5.
Prediction of electrical energy consumption for crude iron production.
3.2. Considering Thermodynamic and Kinetic Aspects of Crude Iron Production
In this section, we briefly consider the kinetic aspects of iron oxide reduction to metallic iron. Generally, the thermodynamic chemical equation for iron oxide reduction is presented as follows:
In chemical Equation (7), IO represents iron oxide reactants, including hematite (Fe2O3), magnetite (Fe3O4), and wustite (FeO), while RG denotes reducing gases such as H2 and CO. IM stands for metallic iron (Fe), and NRG represents non-reducing gases such as H2O and CO2. The symbols b, c, and d are stoichiometric coefficients. The principal emission factor in ironmaking using carbon-based materials (e.g., carbon and natural gas) is the production of carbon dioxide (CO2) [45,46]. For the mass transfer-controlled reaction of Equation (1), we have
where X denotes the fraction of the reacted IO, is the mass transfer coefficient, and represent the concentration of RG in the bulk of the reducing gases and the concentration of NRG in the bulk of the non-reducing gases, respectively, denotes the porosity of IO, is the molar density of the IO reactants, and and denote the volume and surface area of the solid oxides, respectively. The variable t represents time, and is the equilibrium constant [47]. The value of is expressed according to the Arrhenius equation:
where , , T, and R denote the constant coefficient, activation energy, absolute temperature, and universal gas constant, respectively [48].
Regarding Equation (7), for the ironmaking reduction equation, if all kinetic factors in Equation (8) except the absolute temperature (T) are assumed constant, then according to the Arrhenius equation in Equation (9), the rate of the reduction reaction depends solely on T. This factor determines the reaction rate and, in turn, the production rate. In the BF process, the temperature typically ranges between 1800 and 2000 °C [14], while in the DR process (which produces DRI), the maximum temperature is around 950 °C [15]. From Equation (9), and assuming and remain constant, we have
Therefore, the temperature increase from 950 °C to 2000 °C results in a 1.72-fold increase in . Consequently, according to Equation (9), at a constant time, the rate of the reaction in Equation (1) at 2000 °C is approximately twice that of the same reaction at 950 °C. As a result, in Figure 4, CO2 emissions during the DR process are much lower than those of the BF process, along with its production rate. Even with a 100% implementation rate, it is not possible to reach the total production capacity currently achieved by both BF and DR processes combined.
If we hypothetically assume that, in the future, all crude iron production could be achieved using the DR process with an implementation rate of 300% (i.e., exceeding the current capacity), the CO2 emissions from this scenario could potentially be plotted as shown in Figure 6.
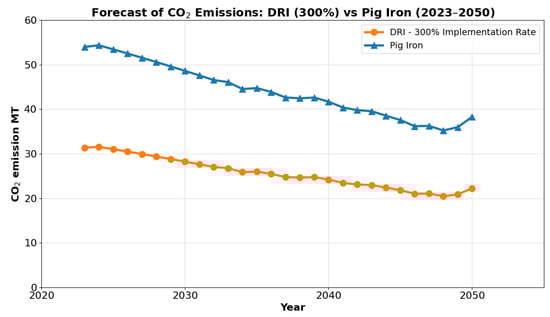
Figure 6.
Hypothetical CO2 emissions from crude iron production using DR process.
Figure 6 depicts a hypothetical scenario in which the entire crude iron industry relies solely on the DR process, exceeding its current capacity by 300%. This complete shift away from traditional blast furnaces has the potential to dramatically reduce CO2 emissions, potentially reaching levels aligned with international agreements. However, making this transition a reality would require major technological advancements, large-scale investments, and expanded infrastructure—particularly to support the use of natural gas, which is commonly used in DR processes. Although there are obstacles to overcome, the environmental benefits suggest that it is worth pursuing bold and innovative approaches, such as fully adopting DR-based technologies, to move toward a more sustainable future for crude iron production.
Looking beyond the scenario of full DR process adoption, it is important to consider a broader range of potential technological advances and implementation trends in crude iron production. Among these are innovations such as the use of clean energy carriers—like hydrogen gas (H2) or plasma hydrogen—as part of the reduction process [21,40].
Although the DR method already offers a notable emissions advantage over conventional blast furnaces, further innovations could lead to even greater environmental benefits. For example, hydrogen generated via renewable energy sources [49], including electrolysis [50], may serve as an effective reductant in DR systems. This could help reduce the carbon intensity of crude iron production even further [51,52].
That said, turning these potential gains into reality would require a significant increase in the speed and scale at which emerging technologies are adopted. Expanding the infrastructure needed to support clean hydrogen production and integrating it effectively into DR systems presents a major technical and logistical challenge.
Even so, the opportunity to significantly reduce CO2 emissions through new technologies and broader deployment remains a compelling objective for the steel sector. With continued focus on innovation, the industry has a chance to move toward a more sustainable future—one that supports its critical role in both economic development and global infrastructure.
3.3. Realistic Scenario for 2050
Table 1 shows the main methods for iron production based on current technologies. While advancements in technologies such as clean hydrogen-based DR hold promise for a more sustainable future, blast furnaces are likely to remain a mainstay of iron production until 2050 due to the existing infrastructure, potential efficiency improvements, and cost considerations. However, a gradual increase in DR implementation—particularly hydrogen-based ironmaking—is expected as the technology matures and environmental concerns become more pressing.

Table 1.
Environmental impact and implementation of iron production technologies.
As shown in Table 1, the allocation of crude iron production should be optimized across various methods to minimize CO2 emissions in line with international targets, including a cap of 47 MT of CO2 emissions and 76 MWh of electricity usage (refer to Figure 2). Therefore, by considering Equations (2)–(4) and applying the model for optimal crude ironmaking contribution, the results can be plotted in Figure 7.
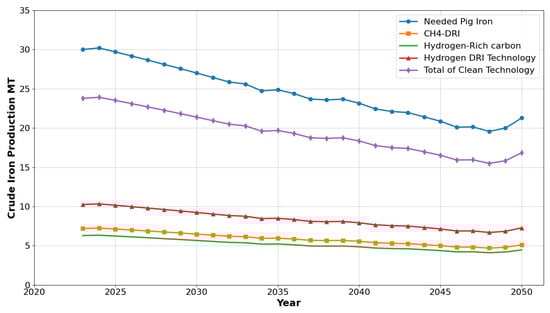
Figure 7.
Optimal contribution of crude iron production methods by 2050, based on model Equations (2)–(4).
As depicted in Figure 7, by leveraging the existing cleaner technologies, we can approach the required crude iron production by 2050. For example, in 2050, we could potentially produce 16.85 MT of crude iron out of the required 21.28 MT. It is evident that the maximum production of pig iron through the BF process is approximately 4.43 MT. Figure 8 illustrates the contribution of each method to crude iron production in 2050.
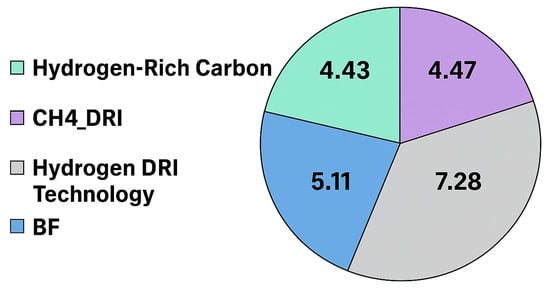
Figure 8.
Contribution of each iron production method to crude iron production (MT) in 2050.
This discussion emphasizes the role of cleaner technologies in reaching crude iron production targets by 2050. By adopting these methods efficiently, we can take meaningful steps toward fulfilling international CO2 emission agreements while promoting sustainable practices in ironmaking.
Assuming this scenario is applied to produce crude iron using cleaner methods, we can anticipate carbon emissions through 2050. This prediction is plotted in Figure 9. Assuming these methods are applied starting from 2023, compared with previous years, carbon emissions have significantly decreased without any significant impact on the production rate of crude iron.

Figure 9.
Predicted carbon emissions through 2050 with implementation of cleaner iron production methods, compared to previous years.
3.4. Forecast Accuracy Using LSTM-Based Time Series Modeling
As part of our broader modeling effort, we extend our analysis to include a deep learning method: a Long Short-Term Memory (LSTM) network. LSTM networks are a type of recurrent neural network (RNN) architecture designed to capture long-range dependencies in sequential data while addressing the vanishing gradient problem inherent in traditional RNNs. An LSTM unit consists of a memory cell and three gates: the input gate , forget gate , and output gate . These gates regulate the flow of information into, within, and out of the memory cell. At each time step t, the LSTM updates its internal state according to the following equations:
Here, is the input vector at time t, is the hidden state from the previous time step, denotes the sigmoid activation function, tanh is the hyperbolic tangent function, and ⊙ represents element-wise multiplication. The matrices , , and the bias vectors are trainable parameters learned during model training. The forget gate determines which information to discard from the cell state, the input gate decides what new information to store, and the output gate controls how much of the cell state contributes to the hidden state. This structure enables the LSTM to selectively maintain and update its internal memory across long sequences, making it particularly suitable for time series forecasting tasks such as CO2 emission modeling [53].
The goal is to forecast CO2 emissions from U.S. ironmaking between 2022 and 2050. We train the model using emissions data from 2005 through 2021. To structure the learning process, we use a five-year sliding window to predict one year ahead. The setup features 64 memory units in the core layer, with dropout added to help avoid overfitting, and a final dense node for output. The LSTM produces a more gradual, nearly level decline—likely reflecting real-world delays in policy implementation or the phased adoption of new technologies. The model appears to better capture this uneven pattern compared to a basic linear forecast.
In terms of performance, the LSTM performs slightly better. Its root mean square error (RMSE) is 0.92 MT of CO2, compared to 1.02 MT for the linear model. Although the difference is modest, it represents a meaningful improvement given the limited training data. The LSTM ultimately enhances our forecasting framework and illustrates how blending machine learning with traditional methods can provide fresh perspectives on uncertainty—insights particularly valuable to both researchers and decision-makers. Figure 10 illustrates the full CO2 emissions forecast, including both the LSTM and linear model projections, along with their 95% confidence intervals, which visibly increase over time to reflect long-term predictive uncertainty.
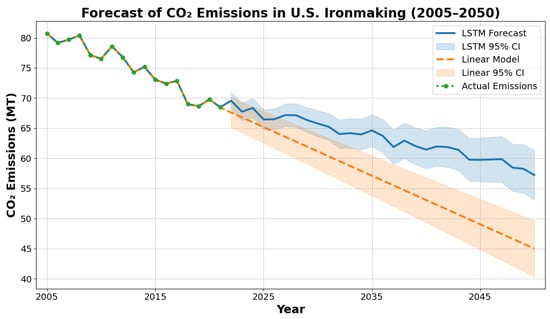
Figure 10.
Forecast of CO2 emissions in U.S. ironmaking from 2005 to 2050 using LSTM and linear regression models. Shaded regions represent 95% confidence intervals for each model, reflecting increasing uncertainty over time. The LSTM forecast captures a more gradual and variable decline in emissions, while the linear model projects a steady downward trend. Historical emissions data (2005–2021) are included for reference.
4. Conclusions
This paper presents an in-depth evaluation of CO2 emissions from the U.S. ironmaking sector, projecting future trends through 2050 using a custom-built mathematical model. According to the findings, unless there are major shifts in current technology and economic strategies, the industry will likely fall short of meeting the emission reduction goals established in international climate agreements, including the Paris Agreement.
The presented model relies on historical data (2005–2022) to establish baseline trends. The dataset includes macroeconomic indicators such as GDP, population, and government expenditures, as well as factors affecting the economics of the iron and steel industries, such as demand, supply, production, and exports over the past 17 years in the U.S. This model does not assume a static technological landscape. Instead, our projections consider current industry trajectories and anticipated changes in production methods, including efficiency improvements in BF and DR processes with cleaner fuels.
That said, future changes—whether driven by technology, policy, or energy transitions such as electrification or hydrogen-based reduction—could reshape these emission patterns. Although such changes are not explicitly modeled here, the structure of our framework allows for updates to incorporate new developments as they arise. Additionally, we incorporate the LSTM neural network into our analysis to enhance forecasting accuracy. The LSTM model slightly outperforms the linear model, offering a more realistic projection of future CO2 emissions by capturing nonlinear trends and delayed policy effects. This demonstrates the value of combining traditional modeling with deep learning techniques to better understand long-term emission dynamics.
At this stage, it appears that the U.S. ironmaking industry will continue to be a major source of CO2 emissions unless there is substantial technological progress alongside stronger energy policies. While BFs are efficient at high temperatures, they are also emissions intensive. This underlines the importance of exploring lower-carbon methods. Among them, hydrogen-based DR stands out as a strong candidate, offering emission reductions that align with broader climate goals.
According to our results, expanding DR capacity by 300% could make a meaningful difference—though achieving this would require coordinated investment in both hydrogen infrastructure and technology. Long-term success will hinge on consistent innovation and large-scale deployment. Still, reaching this scale would involve major investment in infrastructure for clean hydrogen production and distribution, as well as ongoing advances in DR technology. Realizing the full potential of cleaner ironmaking will require a sustained commitment to both innovation and infrastructure development.
As a direction for future research, we acknowledge that the current model does not explicitly incorporate potential structural changes such as technological breakthroughs, regulatory shifts, or major economic disruptions. While fuel consumption remains a key driver of emissions, other dynamic factors—such as hydrogen adoption, changes in carbon policy, or energy market volatility—may significantly alter future trends. Incorporating these uncertainties through scenario-based forecasting, policy-sensitive modeling, or hybrid simulation approaches could improve the robustness and applicability of long-term projections.
Additionally, our forecasts assume economic stability and balanced supply-demand conditions. While these assumptions enable tractable long-term modeling, they do not capture potential disruptions such as recessions, supply chain shocks, or sudden policy interventions. Future work could relax these assumptions and adopt stochastic or stress-testing frameworks to evaluate system behavior under more volatile economic scenarios.
Finally, while this study focuses on the dominant ironmaking routes—BF, DR, and HDRI—it does not capture the full spectrum of emerging technologies, including plasma hydrogen reduction, molten oxide electrolysis, or carbon capture-integrated systems. Although these innovations are not yet widely adopted, they could significantly reshape decarbonization pathways. As these methods mature and more performance data become available, the modeling framework presented here can be extended to explore their long-term impacts. While our current work emphasizes a baseline projection grounded in historical data, we recognize that alternative scenario modeling—such as varying policy conditions or technology adoption rates—could complement this approach in future studies and broaden the understanding of uncertainty.
Author Contributions
Methodology, M.M. (Mohammad Meysami); Validation, M.M. (Mohammad Merhi); Writing—original draft, A.M. (Alex Meisami), H.D. and A.M. (Amirhossein Meysami). All authors have read and agreed to the published version of the manuscript.
Funding
We gratefully acknowledge the financial support provided by Indiana University-South Bend.
Institutional Review Board Statement
Not applicable.
Informed Consent Statement
Not applicable.
Data Availability Statement
The data presented in this study are available on request from the corresponding author.
Acknowledgments
This work was performed before Amirhossein Meysami joined the University of Utah. The University of Utah has no involvement and, therefore, no responsibility for the data and views expressed in this manuscript. The authors would like to thank the three anonymous reviewers for their constructive and insightful comments which helped improve the quality of this paper.
Conflicts of Interest
The authors declare no conflicts of interest.
References
- Keller, D.P.; Lenton, A.; Littleton, E.W.; Oschlies, A.; Scott, V.; Vaughan, N.E. The effects of carbon dioxide removal on the carbon cycle. Curr. Clim. Chang. Rep. 2018, 4, 250–265. [Google Scholar] [CrossRef] [PubMed]
- Edo, G.I.; Itoje-akpokiniovo, L.O.; Obasohan, P.; Ikpekoro, V.O.; Samuel, P.O.; Jikah, A.N.; Nosu, L.C.; Ekokotu, H.A.; Ugbune, U.; Oghroro, E.E.A.; et al. Impact of environmental pollution from human activities on water, air quality and climate change. Ecol. Front. 2024, 44, 874–889. [Google Scholar] [CrossRef]
- Seydi, S.; Haghighatjoo, F.; Rahimpour, M.R. Non-CO2 Greenhouse Gases. In Reference Module in Earth Systems and Environmental Sciences; Elsevier: Amsterdam, The Netherlands, 2024. [Google Scholar]
- Deknatel, N.; van der Loos, A. The intangible technological innovation system: The role and influence of voluntary and compliance carbon markets on carbon dioxide removal in the European Union. Energy Res. Soc. Sci. 2025, 119, 103851. [Google Scholar] [CrossRef]
- van Asselt, H.; Fragkos, P.; Peterson, L.; Fragkiadakis, K. The environmental and economic effects of international cooperation on restricting fossil fuel supply. Int. Environ. Agreem. Politics Law Econ. 2024, 24, 141–166. [Google Scholar] [CrossRef]
- Raabe, D. The materials science behind sustainable metals and alloys. Chem. Rev. 2023, 123, 2436–2608. [Google Scholar] [CrossRef]
- Bui, H.H.; Wang, L.; Tran, K.Q.; Skreiberg, Ø.; Luengnaruemitchai, A. CO2 gasification of charcoals in the context of metallurgical application. Energy Procedia 2017, 105, 316–321. [Google Scholar] [CrossRef]
- Suer, J.; Traverso, M.; Ahrenhold, F. Carbon footprint of scenarios towards climate-neutral steel according to ISO 14067. J. Clean. Prod. 2021, 318, 128588. [Google Scholar] [CrossRef]
- Zhang, H.; Dong, J.; Wei, C.; Cao, C.; Zhang, Z. Future trend of terminal energy conservation in steelmaking plant: Integration of molten slag heat recovery-combustible gas preparation from waste plastics and CO2 emission reduction. Energy 2022, 239, 122543. [Google Scholar] [CrossRef]
- Zhong, Y.; Xu, S.; Zhang, B.; Cheng, H.; Wang, M.; Niu, Y.; Li, R. A study on carbon dioxide emissions of high-polymer road maintenance technology based on life cycle assessment evaluation. J. Clean. Prod. 2023, 426, 138944. [Google Scholar] [CrossRef]
- Boldrini, A.; Koolen, D.; Crijns-Graus, W.; Worrell, E.; van den Broek, M. Flexibility options in a decarbonising iron and steel industry. Renew. Sustain. Energy Rev. 2024, 189, 113988. [Google Scholar] [CrossRef]
- Lei, T.; Wang, D.; Yu, X.; Ma, S.; Zhao, W.; Cui, C.; Meng, J.; Tao, S.; Guan, D. Global iron and steel plant CO2 emissions and carbon-neutrality pathways. Nature 2023, 622, 514–520. [Google Scholar] [CrossRef] [PubMed]
- Ramakgala, C.; Danha, G. A review of ironmaking by direct reduction processes: Quality requirements and sustainability. Procedia Manuf. 2019, 35, 242–245. [Google Scholar] [CrossRef]
- Sohn, H.Y. Energy consumption and CO2 emissions in ironmaking and development of a novel flash technology. Metals 2019, 10, 54. [Google Scholar] [CrossRef]
- Moziraji, M.R.; Tehrani, A.A.; Reshadi, M.A.M.; Bazargan, A. Natural gas as a relatively clean substitute for coal in the MIDREX process for producing direct reduced iron. Energy Sustain. Dev. 2024, 78, 101356. [Google Scholar]
- Dutta, S.K.; Chokshi, Y.B. Basic Concepts of Iron and Steel Making; Springer Nature: Berlin/Heidelberg, Germany, 2020. [Google Scholar]
- Jeong, S.J. System dynamics approach for the impacts of FINEX technology and carbon taxes on steel demand: Case study of the POSCO. Int. J. Precis. Eng. Manuf.-Green Technol. 2015, 2, 85–93. [Google Scholar] [CrossRef]
- Zhan, W.l.; Wu, K.; He, Z.j.; Liu, Q.h.; Wu, X.j. Estimation of energy consumption in COREX process using a modified rist operating diagram. J. Iron Steel Res. Int. 2015, 22, 1078–1084. [Google Scholar] [CrossRef]
- Kovtun, O.; Levchenko, M.; Ilatovskaia, M.O.; Aneziris, C.G.; Volkova, O. Results of hydrogen reduction of iron ore pellets at different temperatures. Steel Res. Int. 2024, 96, 2300707. [Google Scholar] [CrossRef]
- Wang, R.; Zhao, Y.; Babich, A.; Senk, D.; Fan, X. Hydrogen direct reduction (H-DR) in steel industry—An overview of challenges and opportunities. J. Clean. Prod. 2021, 329, 129797. [Google Scholar] [CrossRef]
- Choisez, L.; Hemke, K.; Özgün, Ö.; Pistidda, C.; Jeppesen, H.; Raabe, D.; Ma, Y. Hydrogen-based direct reduction of combusted iron powder: Deep pre-oxidation, reduction kinetics and microstructural analysis. Acta Mater. 2024, 268, 119752. [Google Scholar] [CrossRef]
- Jovičević-Klug, M.; Souza Filho, I.R.; Springer, H.; Adam, C.; Raabe, D. Green steel from red mud through climate-neutral hydrogen plasma reduction. Nature 2024, 625, 703–709. [Google Scholar] [CrossRef]
- Pfeiffer, A.; Wimmer, G.; Schenk, J. Investigations on the interaction behavior between direct reduced iron and various melts. Materials 2022, 15, 5691. [Google Scholar] [CrossRef] [PubMed]
- Irawan, A.; Kurniawan, T.; Alwan, H.; Muslim, Z.A.; Akhmal, H.; Firdaus, M.A.; Bindar, Y. An energy optimization study of the electric arc furnace from the steelmaking process with hot metal charging. Heliyon 2022, 8, e11448. [Google Scholar] [CrossRef] [PubMed]
- Bailera, M.; Lisbona, P.; Peña, B.; Romeo, L.M. A review on CO2 mitigation in the Iron and Steel industry through Power to X processes. J. CO2 Util. 2021, 46, 101456. [Google Scholar] [CrossRef]
- Metius, G.; McClelland, J.; Hornby-Anderson, S. Comparing CO2 emissions and energy demands for alternative ironmaking routes. Steel Times Int. 2006, 30, 32. [Google Scholar]
- Hasanbeigi, A.; Arens, M.; Price, L. Alternative emerging ironmaking technologies for energy-efficiency and carbon dioxide emissions reduction: A technical review. Renew. Sustain. Energy Rev. 2014, 33, 645–658. [Google Scholar] [CrossRef]
- Tian, S.; Di, Y.; Dai, M.; Chen, W.; Zhang, Q. Comprehensive assessment of energy conservation and CO2 emission reduction in future aluminum supply chain. Appl. Energy 2022, 305, 117796. [Google Scholar] [CrossRef]
- Benjamin, N.I.; Lin, B. Quantile analysis of carbon emissions in China metallurgy industry. J. Clean. Prod. 2020, 243, 118534. [Google Scholar] [CrossRef]
- Rumsa, M.; John, M.; Biswas, W. Global steel decarbonisation roadmaps: Near-zero by 2050. Environ. Impact Assess. Rev. 2025, 112, 107807. [Google Scholar] [CrossRef]
- Yamada, K.; Ii, R.; Yamamoto, M.; Ueda, H.; Sakai, S. Japan’s greenhouse gas reduction scenarios toward net zero by 2050 in the material cycles and waste management sector. J. Mater. Cycles Waste Manag. 2023, 25, 1807–1823. [Google Scholar] [CrossRef]
- Suer, J.; Traverso, M.; Jäger, N. Review of life cycle assessments for steel and environmental analysis of future steel production scenarios. Sustainability 2022, 14, 14131. [Google Scholar] [CrossRef]
- Yu, S.; Lehne, J.; Blahut, N.; Charles, M. 1.5 C steel: Decarbonizing the Steel Sector in Paris-Compatible Pathways. Pacific Northwest National Laboratory. 2021. Available online: https://www.e3g.org/wp-content/uploads/1.5C-Steel-Report_E3G-PNNL-1.pdf (accessed on 19 April 2025).
- Morfeldt, J.; Nijs, W.; Silveira, S. The impact of climate targets on future steel production–An analysis based on a global energy system model. J. Clean. Prod. 2015, 103, 469–482. [Google Scholar] [CrossRef]
- Shen, J.; Zhang, Q.; Xu, L.; Tian, S.; Wang, P. Future CO2 emission trends and radical decarbonization path of iron and steel industry in China. J. Clean. Prod. 2021, 326, 129354. [Google Scholar] [CrossRef]
- World Steel Association. Available online: https://worldsteel.org/ (accessed on 19 April 2025).
- Visco, I. Lawrence R. Klein: Macroeconomics, econometrics and economic policy. J. Policy Model. 2014, 36, 605–628. [Google Scholar] [CrossRef]
- Muwanguzi, A.J.; Olowo, P.; Sebukeera, H.; Guloba, A.; Mezulic, D.; Bonci, P.; Muvawala, J. Modelling the Growth Trend of the Iron and Steel Industry: Case for Uganda. Am. J. Ind. Bus. Manag. 2020, 10, 1640. [Google Scholar] [CrossRef]
- Zhao, Z.; Yu, X.; Shen, Y.; Li, Y.; Xu, H.; Hu, Z. Model study of shaft injection of reformed coke oven gas in a blast furnace. Energy Fuels 2020, 34, 15048–15060. [Google Scholar] [CrossRef]
- Boretti, A. The perspective of hydrogen direct reduction of iron. J. Clean. Prod. 2023, 429, 139585. [Google Scholar] [CrossRef]
- Astoria, T. Dealing with an Uncertain Future: Direct Reduction in the Hydrogen Economy. Direct from Midrex. 2022. Available online: https://www.midrex.com/tech-article/dealing-with-an-uncertain-future-direct-reduction-in-the-hydrogen-economy/ (accessed on 19 April 2025).
- U.S. Energy Information Administration. U.S. Energy Information Administration (EIA). Available online: https://www.eia.gov/ (accessed on 19 April 2025).
- Yang, L.; Hu, H.; Yang, S.; Wang, S.; Chen, F.; Guo, Y. Life cycle carbon footprint of electric arc furnace steelmaking processes under different smelting modes in China. Sustain. Mater. Technol. 2023, 35, e00564. [Google Scholar] [CrossRef]
- Kunitomo, K.; Takamoto, Y.; Naito, M.; Yag, J. Blast furnace ironmaking system using partially reduced iron ore reduced by an energy source with low carbon content. J. Jpn. Inst. Energy 2005, 84, 126–133. [Google Scholar] [CrossRef]
- Hasannezhad, H.; Meysami, A. Effects of porosity and electrical resistance of metallurgical coke and semicoke on silicon recovery in an electric arc furnace. JOM 2019, 71, 336–341. [Google Scholar] [CrossRef]
- Hasannezhad, H.; Meysami, A. Comparison of Biomass and Coal in the Recovery Process of silicon in an Electric Arc Furnace. JOM 2021, 73, 1030–1036. [Google Scholar] [CrossRef]
- Szekely, J. Gas-Solid Reactions; Elsevier: Amsterdam, The Netherlands, 2012. [Google Scholar]
- Ponugoti, P.V.; Garg, P.; Geddam, S.N.; Nag, S.; Janardhanan, V.M. Kinetics of iron oxide reduction using CO: Experiments and Modeling. Chem. Eng. J. 2022, 434, 134384. [Google Scholar] [CrossRef]
- Hosseini, S.E.; Wahid, M.A. Hydrogen production from renewable and sustainable energy resources: Promising green energy carrier for clean development. Renew. Sustain. Energy Rev. 2016, 57, 850–866. [Google Scholar] [CrossRef]
- Kumar, S.S.; Lim, H. An overview of water electrolysis technologies for green hydrogen production. Energy Rep. 2022, 8, 13793–13813. [Google Scholar] [CrossRef]
- Rechberger, K.; Spanlang, A.; Sasiain Conde, A.; Wolfmeir, H.; Harris, C. Green hydrogen-based direct reduction for low-carbon steelmaking. Steel Res. Int. 2020, 91, 2000110. [Google Scholar] [CrossRef]
- Lan, C.; Hao, Y.; Shao, J.; Zhang, S.; Liu, R.; Lyu, Q. Effect of H2 on blast furnace ironmaking: A review. Metals 2022, 12, 1864. [Google Scholar] [CrossRef]
- Hochreiter, S.; Schmidhuber, J. Long short-term memory. Neural Comput. 1997, 9, 1735–1780. [Google Scholar] [CrossRef]
Disclaimer/Publisher’s Note: The statements, opinions and data contained in all publications are solely those of the individual author(s) and contributor(s) and not of MDPI and/or the editor(s). MDPI and/or the editor(s) disclaim responsibility for any injury to people or property resulting from any ideas, methods, instructions or products referred to in the content. |
© 2025 by the authors. Licensee MDPI, Basel, Switzerland. This article is an open access article distributed under the terms and conditions of the Creative Commons Attribution (CC BY) license (https://creativecommons.org/licenses/by/4.0/).