Abstract
In this study, the aerodynamic performance of the NACA 6412 wing, which is widely used in aerodynamic systems with its high-performance ratio feature, is optimized using the Taguchi Method to simultaneously evaluate the effects of multiple parameters and to reduce the number of Computational Fluid Dynamics (CFD) experiments to an optimum level. Within the framework of the Design of Experiments (DOE) methodology, the analyses were carried out in the Reynolds number range Re = 100,000–200,000 to determine the optimum design conditions by considering five main factors: maximum camber (bmax), maximum camber position (x), angle of attack (α), maximum thickness (tmax), and free-flow velocity (V). In this direction, CFD simulations based on the Taguchi L16 orthogonal array were performed and the data obtained were statistically evaluated using Analysis of Variance (ANOVA). The lift-to-drag ratio (CL/CD) obtained from the optimum experimental parameter combination (NACA5310) determined by the Taguchi method is compared with the basic NACA 6412 airfoil and 16 other configurations included in the analysis. The results show that the optimized airfoil provides an improvement in performance of approximately 17% compared to the NACA 6412 airfoil.
1. Introduction
NACA airfoils, known for their high lift and low drag forces, are blade profiles with excellent aerodynamic performance that meet the blade requirements of a wide range of applications, including underground mine ventilation fans [1,2,3,4], wind turbines [5,6,7,8,9,10,11,12,13,14], racing vehicles [15,16], unmanned aerial vehicles (UAVs) [17,18], and passenger aircraft [19], among others. The broad scope of these applications makes it highly attractive to thoroughly understand NACA airfoils and the parameters affecting blade performance and improve energy efficiency effectively by either optimizing existing profiles or replacing older blades with NACA airfoils to achieve higher-performance blades. The aerodynamic performance of a NACA airfoil is measured by the performance ratio, defined as the lift coefficient to drag coefficient (CL/CD). The primary parameters that influence this performance ratio are the airfoil’s maximum camber (bmax), the position of maximum camber (x), and the maximum thickness (tmax). Additionally, airfoil performance is evaluated in conjunction with the performance of the system in which the airfoil is used [2]. In this context, the literature frequently features studies involving additional design elements such as flow-directing deflectors or Gurney flaps—aimed at enhancing the performance of airfoils within a system [5,8]. However, selecting an optimal airfoil by also taking into account system-specific parameters such as the required angle of attack (α) and fluid velocity (V) plays a crucial role in overall system performance [3]. This necessitates examining the effects of a broader set of parameters—including both the geometric properties of the airfoil and system-related variables—on the aerodynamic performance of the airfoil.
In recent years, advanced techniques such as multi-objective genetic algorithms (e.g., NSGA-II), particle swarm optimization (MOPSO), surrogate modelling, and generative artificial intelligence methods (e.g., Bézier-GAN) have been increasingly used in the optimization of wing geometries. Although these approaches can address multiple design variables simultaneously, they often require high computational cost and involve complex geometric representations of the wing shape [20,21,22,23,24]. The Taguchi optimization method preferred in this study offers the possibility of a systematic and interpretable experiment (DoE) that allows the identification of optimal combinations with a limited number of CFD analyses. It allows direct focus on a specific performance metric, such as the lift-to-drag ratio, and provides significant advantages in terms of computational efficiency in the early stages of the design process [5,6,7,8,9,10,11,12,13]. Hassen (2021) [2] compared the performance of two selected NACA airfoils using CFD analysis with the aim of enhancing the performance of underground mine fans and emphasized that airfoil performance should be evaluated in conjunction with the system. In his study using different blade types derived from the NACA 6412 airfoil at 30° and 40° angles of attack, he argued that various airfoil configurations could improve fan performance. Taşkaya and Erdoğan (2024) [3] aimed to improve performance by redesigning the blades of a low-speed axial fan used in underground mine auxiliary ventilation. They used CFD analysis to determine the performance ratios of NACA 747A315, NACA 6412, and NACA 63-412 airfoils at different angles of attack. Based on their analyses, they found that at the system’s optimal attack angle of 7°, the NACA 63-412 airfoil exhibited the best performance ratio. Using this airfoil, they created a new fan geometry, and their CFD simulations showed that, under constant rotational speed and constant pressure difference, the system’s flow rate increased by at least 25%.
Chen et al. (2021) [5] used the Taguchi method to evaluate the effects of design parameters on the performance of a vertical-axis wind turbine composed of three NACA 0015 airfoils. They applied Analysis of Variance (ANOVA) and also examined the aerodynamic characteristics around the turbine blades. They reported that by designing a deflector to direct the airflow within the turbine, they were able to increase the power coefficient (Cp) of the turbine. Ouyang et al. (2024) [6] systematically optimized the rotor blade geometry of a horizontal-axis micro wind turbine using the Taguchi method. The study employed the NACA 4412 airfoil and investigated three key geometric parameters affecting rotor performance: number of blades, solidity ratio, and installation angle. The effects of these parameters on the turbine’s power output were analyzed in detail. Aerodynamic analyses revealed that the optimized rotor induced greater airflow into the channel, which increased the pressure difference across the blade surfaces and thus improved the power coefficient. It was also stated that replacing the untwisted blade geometry, which causes low torque generation at the blade tips, with a twisted blade structure could further enhance torque generation and overall turbine efficiency. Dey and Saha (2018) [15] investigated the aerodynamic effects of the rear blade of a sports car using the NACA 2412 airfoil through CFD analysis. The simulations were carried out in ANSYS 15.0 FLUENT using the k-epsilon turbulence model under a velocity condition of 60 m/s. The study aimed to visualize the aerodynamic impact of the rear blade on the vehicle by comparing parameters such as drag and lift coefficients, velocity streamlines, pressure distribution, and turbulent kinetic energy. It was concluded that the use of a rear blade enhances the aerodynamic efficiency of the car and improves acceleration performance by reducing drag. Kulkarni et al. (2024) [19] conducted CFD analyses of the NACA 2408, 2412, and 2415 airfoils to improve the aerodynamic performance of racing cars. The study aimed to compare these three airfoils in terms of aerodynamic parameters such as drag coefficient (CD), lift coefficient (CL), contours, downforce, and drag force. The results showed that the NACA 2415 airfoil offered a higher CL/CD ratio compared to the other two profiles, indicating superior aerodynamic efficiency and a significant potential to enhance vehicle performance.
Durmuş (2023) [16] compared the aerodynamic performance of different airfoils on unmanned aerial vehicles (UAVs). The airfoils examined included MH60, TL54, Eppler 339, and TsAGI 12%. The study concluded that the TL54 and MH60 airfoils were the most suitable options for UAV design in terms of maximum range, minimum landing speed, and maximum endurance performance. In a subsequent study, Durmuş (2025) [17] investigated the aerodynamic efficiency of blended blade-body designs and explored the impact of flap selection on UAV performance. Using the MH60 and NACA 6412 airfoils, comparative analyses conducted with XFLR5 flow5 v7.01 software showed that the MH60 airfoil achieved a maximum lift-to-drag ratio of 26.98, while applying the NACA 6412 airfoil to the outer blade increased this ratio to 31.83, resulting in an 18% improvement in aerodynamic efficiency.
Suprayitno et al. (2020) [9] conducted a blade shape optimization study using the Taguchi optimization method for the NACA 0012 reference blade and increased the aerodynamic efficiency of the NACA0012 by 69% in this study. Hwas and Hatab (2020) [10] used the Taguchi experimental design to optimize the lift, drag, and power coefficients to improve the performance of a three-bladed wind turbine. In experiments conducted with the L9 orthogonal array, they examined the effects of parameters such as the airfoil profile, angle of attack, and Reynolds number. They found that the Reynolds number had the largest impact on airfoil coefficients, contributing 72.6%, followed by angle of attack with 16.8%, interaction with 9.1%, and the airfoil profile with 1.5%. Kaushik et al. (2022) [11] optimized turbine blades consisting of NACA 4412, 4712, and 4421 profiles using the Taguchi method with three different Mach numbers, Reynolds numbers, and angles of attack. They reported that the NACA 4712 profile provided the best performance ratio. Evran and Yıldır (2024) [12] examined the lift and drag coefficients of NACA0009 and NACA 4415 airfoils under different angles of attack at a constant wind speed. Angle of attack and airfoil type were considered key factors, and the effects of these factors on performance were analyzed using the L16 orthogonal array based on the Taguchi method. They found that the NACA 4415 airfoil had higher lift and lower drag coefficients compared to the NACA 0009. They also determined that an increase in angle of attack resulted in higher lift and drag coefficients for both airfoils. Sanaye and Farvizi (2024) [13] optimized a wind turbine using the NACA 0021 airfoil with three different parameters (tip speed ratio, helix angle, and chord length) and five different variables using the Taguchi method. They noted that at the optimal point, the average power coefficient increased to 0.17542.
Although numerous studies have investigated multi-parameter optimization in aerodynamic systems, many have been limited to a narrow set of design variables or have not considered the simultaneous effects of key geometric and operational factors that directly affect aerodynamic efficiency and system-level sustainability under real-world conditions. In this study, the NACA 6412 airfoil, which is widely used in aerodynamic systems, is optimized through the simultaneous evaluation of five important parameters: maximum camber, camber position, angle of attack, maximum thickness, and free-flow velocity. In order to meet the increased need for experimentation resulting from multi-parameter analysis, the Taguchi method was employed by selecting an L16 orthogonal array, significantly reducing the number of CFD simulations required while providing a systematic and interpretable design of experiments. The study was carried out in the range of 100,000 to 200,000 Reynolds numbers encountered in low-speed aerodynamic systems. The results showed a significant improvement of 17% in the lift-to-drag ratio (CL/CD) compared to the original NACA 6412 airfoil. The recommended optimization not only improves aerodynamic efficiency and reduces energy consumption but also contributes to sustainable engineering goals by optimizing resource use. It also provides environmentally sound and economically viable design solutions for the next generation of aerodynamic systems based on low-cost, simulation-based strategies.
2. Materials and Methods
In this study, the effects of five different controllable parameters—maximum camber (bmax), camber position (x), angle of attack (α), maximum thickness (tmax), and free-stream velocity (V)—on airfoil performance were examined. To manage the increased number of CFD analyses resulting from the diversity of parameters, the Taguchi Method was chosen within the framework of experimental design, and CFD analyses will be conducted accordingly.
2.1. Analytical Approach
Before proceeding to the optimization process, it is necessary to define the NACA airfoil to be studied along with its geometric and aerodynamic parameters. The general representation of the aerodynamic forces acting on an airfoil and the basic profile parameters is shown in Figure 1 [25]. The fluid enters the airfoil from the leading edge (LE) and exits from the trailing edge (TE). The force component created in the direction of flow is the drag force (FD), defined by Equation (1), while the force occurring perpendicular to this is the lift force (FL), expressed by Equation (2). The lower pressure on the upper surface and relatively higher pressure on the lower surface of the airfoil result in the generation of a lift force.
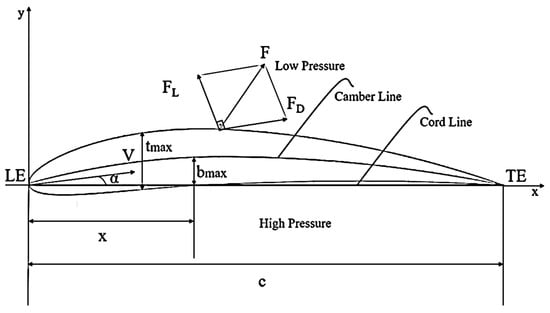
Figure 1.
Representation of the parameters the performance ratio on the NACA 6412 [26].
Blade performance is typically evaluated through the performance ratio (CL/CD), which is the ratio of the lift coefficient (CL) to the drag coefficient (CD). This ratio is a key measure of the aerodynamic efficiency of the airfoil. One of the important parameters related to the profile geometry is the maximum camber (bmax), which represents the greatest distance between the camber line and the chord line. The horizontal distance to this maximum point is defined as the maximum camber position (x). The linear distance between the leading and trailing edges is referred to as the blade chord length (c). Additionally, the angle between the direction of the airflow and the chord line is known as the angle of attack (α), which is one of the primary parameters directly affecting the performance of the airfoil.
In Equations (1) and (2), FL represents the lift force (N), FD represents the drag force (N), CL represents the lift coefficient, CD represents the drag coefficient, and CL/CD represents the performance ratio. In Figure 1, LE represents the leading edge, TE represents the trailing edge, bmax represents the maximum camber (m), x represents the maximum camber position (m), α represents the angle of attack (°), tmax represents the maximum thickness (m), V represents the free-stream velocity (m/s), and c represents the chord length (m).
2.2. Taguchi Method
The Taguchi method is a statistical optimization technique developed to enhance quality in process and product design while minimizing performance variability. This approach aims to achieve more stable and reliable results by reducing the influence of uncontrollable external factors. Its ability to deliver effective outcomes with a reduced number of experimental runs, compared to traditional DOE methods, has made it a widely preferred tool in engineering applications. In the implementation of the Taguchi method, various statistical and algorithmic tools are employed to carry out the optimization process efficiently. First, an appropriate orthogonal array (e.g., L8, L16) is selected based on the number of factors and levels, minimizing the total number of required experiments. Next, given Equation (3), signal-to-noise (S/N) ratios are calculated for each parameter combination to assess the stability of system responses, using different criteria such as “larger-the-better,” “smaller-the-better,” and “nominal-the-best” depending on the performance objective [27]. The resulting data are then statistically analyzed using Analysis of Variance (ANOVA) to determine the contribution of each parameter to overall performance. Additionally, main-effect plots are employed to visually examine the average influence of each factor, facilitating the identification of optimal level combinations. Finally, the optimal parameter combination predicted by the Taguchi method is validated through confirmation tests using CFD analysis to assess the reliability and accuracy of the model. This integrated approach supports the goal of achieving maximum performance at minimum cost in engineering systems.
2.2.1. Optimization
In NACA 4-digit series, the first digit (A factor) represents the maximum camber ratio (bmax, %) of the profile [28]. For example, in the NACA 6412 profile, this ratio corresponds to 6% of the chord length (Figure 2). In the literature, it was observed that the 6% camber ratio (A factor—level 2) is commonly used, while studies related to the values of 5%, 7%, and 8% (A factor—levels 1, 3, and 4) are limited.
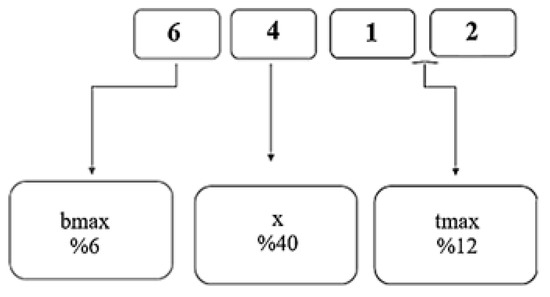
Figure 2.
Geometric parameters expressed in numbers on the NACA 6412 airfoil.
The second digit represents the value of x (%) that determines the maximum camber position, and multiplying this number by 10 gives the percentage position on the chord (B factor). In this context, in the NACA 6412 profile, x corresponds to 40% of the chord length. In NACA 4-digit series, it has been observed that the x position generally ranges between 0 and 40%, while there are limited studies on values of 30%, 50%, and 60% (B factor—levels 1, 3, and 4). Considering the stall condition of the blade (where there is a sudden drop in the maximum lift coefficient), computational fluid dynamics (CFD) analyses for the α (C factor) parameter showed that stall formation was observed after a 14° angle of attack (C factor—level 4); therefore, higher angle values were not included in the study. For the blade’s maximum thickness ratio, tmax (D factor), three different thickness levels were defined, with the third level being based on the original profile thickness, along with the first, second, and fourth levels. Finally, based on the assumption that increasing the free stream velocity V (E factor) would enhance the performance ratio, two different values for Reynolds number in the range of 100,000–200,000 were chosen (Table 1).

Table 1.
Variable parameters for the Taguchi method.
2.2.2. Parameters
In the NACA 4-digit series, the first digit provides information about bmax (A factor) [22]. For NACA 6412, this value corresponds to 6% of the chord length (Figure 2). A review of the literature shows that this value is commonly used for 6% (A factor—level 2), but there is limited research on values for 5%, 7%, and 8% (A factor—levels 1, 3, and 4). The second digit multiplied by 10 represents x as a percentage (B factor). This corresponds to 40% of the chord length. In the NACA 4-digit series, it is known that x typically ranges between 0% and 40%. However, there are very few studies for values of 30%, 50%, and 60% (B factor—levels 1, 3, and 4). The angle of attack, α (C factor), was determined considering the stall condition of the blade (the condition where the lift coefficient (CL) rapidly decreases after reaching its maximum). Computational fluid dynamics (CFD) analyses observed stall formation after 14° (C factor—level 4), so higher values were not considered. For the blade’s maximum thickness parameter, tmax (D factor), three additional levels close to the original blade’s thickness (D factor—level 3) were defined (D factor—levels 1, 2, and 4). Finally, based on the assumption that increasing V (E factor) levels would enhance the performance ratio, two levels of Reynolds number in the range of 100,000–200,000 were selected (E factor—levels 1 and 2). In this study, the L16 (21 × 44) series was preferred as the most appropriate Taguchi method. A total of 16 experiments were planned. The series obtained by the Taguchi method is shown in Table 2.
Table 2.
Analysis plan according to the L16 (21 and 44) series.
2.3. Numerical Modeling
ANSYS Student version of 2025 R1 software was used for all analyses in this study. A C-type grid consisting of 55,000 hexahedral elements was used to mesh the flow field. A total pressure outlet condition with a gauge pressure of 0 Pa was set at the outlet, and a velocity inlet boundary condition was applied at the inlet. A non-slip wall is used to represent the airfoil surface. A k-ω SST turbulence model was employed, and a convergence criterion of 10−6 was set in order to precisely represent the flow separations surrounding the airfoil.
2.3.1. Validation
For the validation study, the reference study [29] selected the flow parameters of the NACA 0012 and NACA 6412 airfoils, which were obtained and compared using different methods: CFD and experimental (PIV). Since the optimization of the NACA 6412 airfoil was the goal of this study, a validation study was conducted using the geometry and mesh model of the NACA 6412 airfoil under the analysis conditions given in Table 3. The flow domain was modeled as a C-type. The mesh structure was created with the optimum number of elements (around 64,000) determined by the reference study (Figure 3).
Table 3.
Analysis conditions.
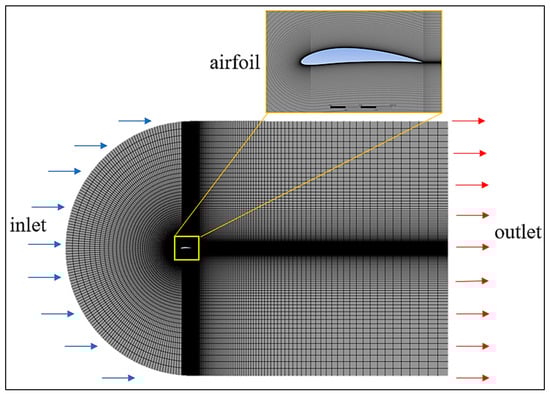
Figure 3.
NACA 6412 Hexa mesh and boundary conditions.
The CL and CD values obtained from the CFD analysis of the NACA 6412 airfoil in the reference study, along with the coefficients obtained from the CFD analysis conducted in this study and the deviation rates from the reference results, are presented in Table 4. Accordingly, the coefficients obtained from the 2D mesh and solution model created for the NACA 6412 appear to be consistent with those from the reference study.
Table 4.
Analysis results.
In the reference study, four different positions were determined for the NACA 6412 airfoil, and the velocities in the x-direction at these positions were normalized by the chord length and compared along the y-axis in a way suitable for comparison with other methods. In this study, the first of the four positions for the NACA 6412 airfoil was used as a reference, and the results obtained were compared with those from the reference study. Accordingly, the velocities in the x-direction at the first position of the NACA 6412 airfoil were found to be the same in both studies (Figure 4).
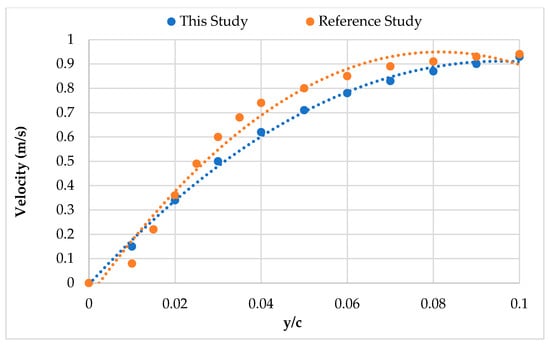
Figure 4.
Comparison graph of x-directional velocities at x/c=0.0.
2.3.2. Mesh Independence and Solution
The flow field geometry and mesh model were designed similarly to the structure used in the validation study, with a hexagonal (hexa) cell structure created using a C-type flow field. To accurately model the flow around the blade, a distance of 10 times the chord length was included in the upper and lower regions of the blade, and a distance of 20 times the chord length was included in the rear region to observe potential vortex structures. The optimal cell count was determined based on a mesh independence study, and it was found that a mesh structure with 55,000 cells provided sufficient accuracy (Table 5, Figure 5).
Table 5.
Mesh quality of Experiment 1 (5308) and precision between solutions.
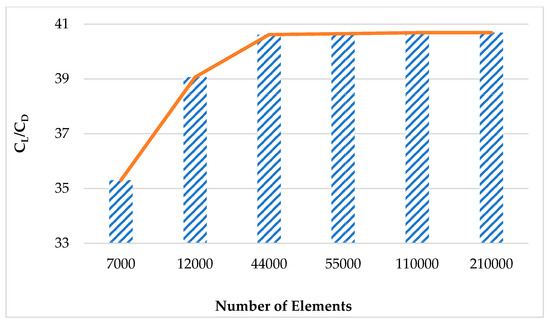
Figure 5.
Plot of the mesh independence study for Experiment 1 (5308).
Boundary conditions were modeled similarly to the validation study, with a velocity inlet at the entrance, a pressure outlet at the exit, and a no-slip wall condition on the blade surface. To successfully model flow separations in all simulations, the k-w SST turbulence model was used. Convergence was achieved with a precision of 10−6 while ensuring the y+ < 1 condition (Figure 6). Figure 6 shows the variation of the y+ value along the airfoil surface with respect to position. Initially, particularly around 0.1 m, the y+ value exceeds 2.5, which may indicate insufficient mesh resolution in the entry region or the presence of sharp velocity gradients.
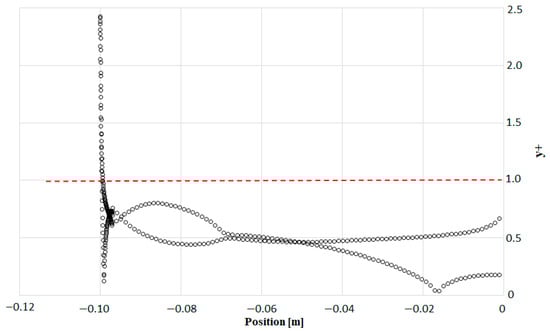
Figure 6.
y+ plot of Experiment 1 (5308).
The y+ value rapidly decreases and remains between 0.05 and 0.5 over a large portion of the airfoil, staying below the red reference line of y+ = 1. This indicates that the boundary layer solution was made with high accuracy, and the y+ < 1 condition was largely met. Overall, the graph demonstrates successful mesh resolution and an appropriate y+ distribution on the airfoil surface.
3. Results and Discussion
This study focuses on enhancing the aerodynamic performance (CL/CD) of the NACA 6412 airfoil by effectively optimizing multiple parameters. For this purpose, the coordinates of the profiles determined through 16 experiments created using the Taguchi L16 (21 × 44) series were obtained from the official Airfoil Tools website [24], and 2D geometries were generated.
Results of the Taguchi Method
In the Taguchi Method, a total of 16 analyses were performed according to the L16 (21 × 44) series. The first experimental analysis has the folloblade parameter combination: maximum camber: 5% (A-1), maximum camber position: 30% (B-1), angle of attack: 12° (C-3), Maximum thickness: 8% (D-1), Free stream velocity: 15 (E-1). This configuration has both the highest S/N ratio and the highest blade performance ratio. The S/N graph based on the performance ratio of the experiments is shown in Figure 7. As a result of the analyses, the first experiment (5308) achieved the highest S/N ratio.
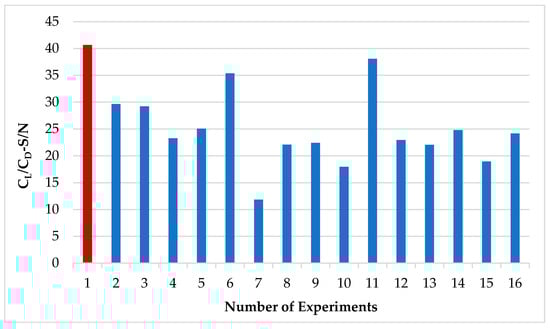
Figure 7.
S/N graph of CFD analysis.
To evaluate the effects of the factors within their respective levels, it is necessary to examine the main effects through the averages of the S/N ratios. This method allows for identifying the differences between the levels of each factor. An increase in the slope between levels indicates that the effect of the factor on the results is more pronounced. The differences between the levels of the factors are shown in detail in Figure 8.
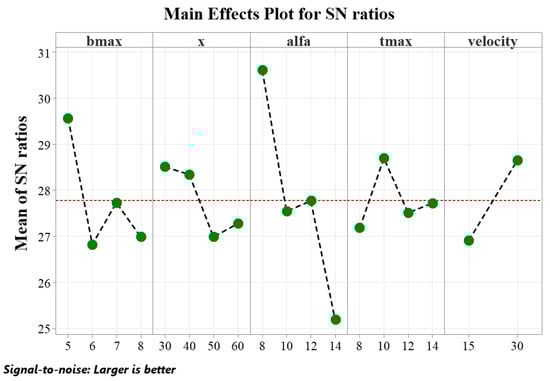
Figure 8.
Main effects on performance ratio according to S/N ratio averages.
In order to determine the contribution rates of the factors affecting the airfoil performance, an analysis of variance (ANOVA) was conducted. These analyses were performed using the optimal lambda value and within the scope of the General Linear Model at a 97.95% confidence level. According to the ANOVA results, the parameter with the greatest influence on airfoil performance was the angle of attack (Alpha, Factor C) with a contribution of 56.66%. Another significant parameter was the camber amount (bmax, Factor A), contributing 18.16%. The profile thickness (Factor D) was found to have the least effect on performance, with a contribution of 4.89%. Detailed results of the ANOVA analysis are presented in Table 6.
Table 6.
ANOVA analysis results.
According to the Taguchi method, the optimal parameter combination was determined as A1B1C1D2E2 (Airfoil configuration 5310). The performance ratio obtained from the CFD analysis of this combination was higher than that of all 16 experiments. Compared to the original NACA 6412 airfoil, a 17% improvement in performance was achieved with the new combination (Figure 9).
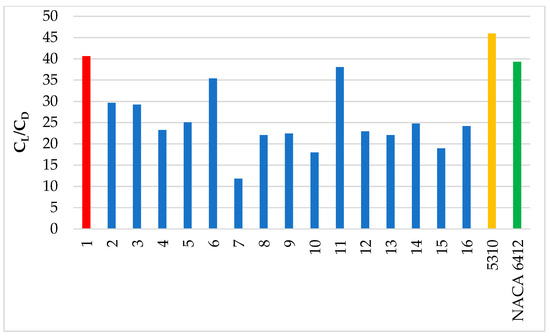
Figure 9.
A1B1C1D2E2 (5310) and NACA 6412 airfoil performance ratio.
According to the CFD analysis results comparing the new airfoil configuration 5310 and the NACA 6412 airfoil, it was determined that the velocity values near the trailing edge are notably higher for the 5310 profile. This indicates that flow separation begins later on the 5310 airfoil (Figure 10). Additionally, the new 5310 airfoil exhibits a more uniform flow distribution compared to the NACA 6412. The streamlines travel closely along the airfoil surface and separate from the trailing edge later than those of the NACA 6412 airfoil (Figure 11).
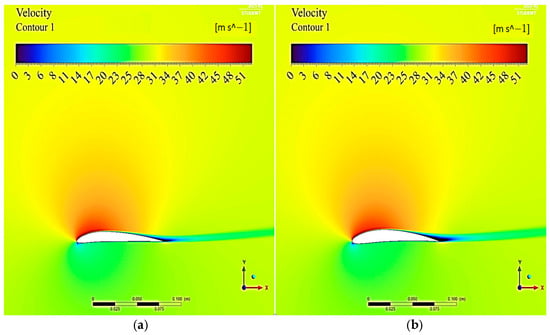
Figure 10.
Velocity contour comparison of the new airfoil 5310 (a) and NACA 6412 (b).
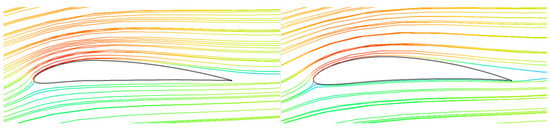
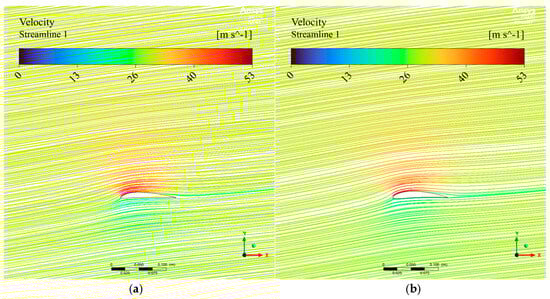
Figure 11.
Comparison of the new airfoil 5310 (a) and NACA 6412 (b) airfoil streamlines.
4. Conclusions
In this study, in order to improve the aerodynamic performance of the NACA 6412 airfoil, which is widely used in aerodynamic systems, airfoil optimization was performed using the Taguchi method, which allows multiple parameter combinations. The method simultaneously optimizes the maximum hump, hump position, angle of attack, maximum thickness, and free-flow velocity, which are five important parameters contributing to the airfoil performance ratio, in the range of 100,000 to 200,000 Reynolds numbers, resulting in a significant performance improvement and reducing the number of experiments. The ANOVA results confirmed that each parameter and its interactions are statistically significant. The optimized combination (NACA5310) provided an aerodynamic increase of 17% in performance ratio (CL/CD) over the original NACA 6412 profile.
Beyond the aerodynamic benefits, this work is expected to contribute to sustainable engineering goals by providing higher performance than the original airfoil in all systems where the 6412 airfoil is commonly used. The optimized airfoil results in lower energy consumption and higher efficiency, especially in low-speed applications. This low-cost, simulation-based optimization approach offers a scalable alternative to more computationally demanding methods and is important for global efforts to develop greener technology.
Author Contributions
Methodology: B.E. and G.T.; validation, B.E. and G.T.; formal analysis, B.E. and G.T.; investigation, B.E. and G.T.; writing—original draft, B.E. and G.T.; writing—review and editing, B.E. and G.T. All authors have read and agreed to the published version of the manuscript.
Funding
This research received no external funding.
Institutional Review Board Statement
Not applicable.
Informed Consent Statement
Not applicable.
Data Availability Statement
The original contributions presented in this study are included in the article. Further inquiries can be directed to the corresponding author.
Conflicts of Interest
The authors declare no conflicts of interest.
Abbreviations
The following abbreviations are used in this manuscript:
| FL | Lift Force (N) |
| FD | Drag Force (N) |
| CL | Lift Coefficient |
| CD | Drag Coefficient |
| CL/CD | Performance Ratio |
| bmax | Maximum Camber (%) |
| x | Position of Maximum Camber (%) |
| α | Attack of Angle (°) |
| tmax | Maximum Thickness (%) |
| V | Velocity (m/s) |
| c | Chord Length (m) |
References
- Drwiga, A.; Szelka, M.; Turewicz, A. Improvement of auxiliary ventilation efficiency in underground workings. IOP Conf. Ser. Earth Environ. Sci. 2019, 261, 012007. [Google Scholar] [CrossRef]
- Hassen, A.E. Flow characterization in mine ventilation fan blade design using CFD. J. Sustain. Min. 2021, 20, 144–156. [Google Scholar] [CrossRef]
- Taşkaya, G.; Erdogan, B. Investigation of a New Blade Design to Improve the Efficiency of an Axial Fan Used in an Underground Mine. Karaelmas J. Sci. Eng. 2024, 14, 144–162. [Google Scholar]
- Moralar, A.; Ekim, S. Application of NACA 6412 airfoil for noise and vibration reduction in evaporator fan blades. Processes 2024, 12, 2377. [Google Scholar] [CrossRef]
- Chen, W.-H.; Wang, J.-S.; Chang, M.-H.; Mutuku, J.K.; Hoàng, A.T. Efficiency improvement of a vertical-axis wind turbine using a deflector optimized by Taguchi approach with modified additive method. Energy Convers. Manag. 2021, 245, 114609. [Google Scholar] [CrossRef]
- Ouyang, K.; Chen, T.-Y.; You, J.-J. Utilizing the Taguchi Method to Optimize Rotor Blade Geometry for Improved Power Output in Ducted Micro Horizontal-Axis Wind Turbines. Sustainability 2024, 16, 4692. [Google Scholar] [CrossRef]
- Al-Hinai, A.H.; Karu, C.V.; Kumar, V.V. Performance optimization of a horizontal axis wind turbine simulator under the effects of blade’s pitch angle variation. Res. Eng. Struct. Mater. 2024, 10, 15–27. [Google Scholar] [CrossRef]
- Çakıroğlu, R.; Tanürün, H.E.; Acır, A.; Üçgül, F.; Olkun, S. Optimization of NACA 4412 augmented with a gurney flap by using grey relational analysis. J. Braz. Soc. Mech. Sci. Eng. 2023, 45, 167. [Google Scholar] [CrossRef]
- Suprayitno; Yu, J.C.; Aminnudin; Wulandari, R. Airfoil aerodynamics optimization under uncertain operating conditions. J. Phys. Conf. Ser. 2020, 1446, 012014. [Google Scholar] [CrossRef]
- Hwas, A.M.; Hatab, A.M. Effects of design parameters of wind turbine on airfoil coefficients using grey-based Taguchi method. J. Multidiscip. Eng. Sci. Technol. (JMEST) 2020, 7, 13103. [Google Scholar]
- Kaushik, V.; Shankar, R.N.; Rashid, N.I.H.; Khope, P.B. Implementation of Taguchi method for designing a robust wind energy system—A wind turbine. J. Eng. Sci. 2022, 13, 165–185. [Google Scholar] [CrossRef]
- Evran, S.; Yıldır, S.Z. Numerical and statistical aerodynamic performance analysis of NACA0009 and NACA4415 airfoils. Politek. Derg. 2024, 27, 849–856. [Google Scholar] [CrossRef]
- Sanaye, S.; Farvizi, A. Optimizing a vertical axis wind turbine with helical blades: Application of 3D CFD and Taguchi method. Energy Rep. 2024, 12, 2527–2547. [Google Scholar] [CrossRef]
- Yetis, Y.; Tehrani, K.; Jamshidi, M. Wind Speed Forecasting using Machine Learning Approach based on Meteorological Data-A case study. Energy Environ. Res. 2022, 12, 11–25. [Google Scholar] [CrossRef]
- Dey, S.; Saha, R. CFD study on aerodynamic effects of NACA 2412 airfoil as rear blade on a sports car. In Proceedings of the International Conference on Mechanical Engineering and Renewable Energy (ICMERE), Khulna, Bangladesh, 23–24 December 2018. [Google Scholar]
- Durmuş, S. Aerodynamic performance comparison of airfoils in flying blade UAV. Int. J. Innov. Eng. Appl. 2023, 7, 123–127. [Google Scholar] [CrossRef]
- Durmuş, S. Impact of airfoil type and placement on aerodynamic performance of blended blade body aircraft. Fırat Üniversitesi Mühendislik Bilim. Derg. 2025, 37, 351–361. [Google Scholar] [CrossRef]
- Fernando, V.N.; Mudunkotuwa, D.Y. Bio-Inspired Aircraft Blade Modification Analysis in ANSYS Fluent. In Proceedings of the 10th International Conference on Information and Automation for Sustainability, Negambo, Sri Lanka, 11–13 August 2021. [Google Scholar] [CrossRef]
- Kulkarni, S.; Malasane, P.; Zanje, N.; Metkari, Y.; Ghadge, N.; Athawale, S.; Kothmire, P. CFD analysis of drag reduction system (DRS) in cars. In Lecture Notes in Mechanical Engineering: Fluid Mechanics and Fluid Power; Springer Nature: Singapore, 2024; Volume 3, pp. 415–426. [Google Scholar] [CrossRef]
- Tehrani, K.; Beikbabaei, M.; Mehrizi-Sani, A.; Jamshidi, M. A smart multiphysics approach for wind turbines design in Industry 5.0. J. Ind. Inf. Integr. 2024, 42, 100704. [Google Scholar] [CrossRef]
- He, C.; Zhong, P.; Li, M.; Jie, L.; Li, Z. An evolutionary many-objective algorithm based on a novel tournament selection strategy. J. Comput. Commun. 2021, 9, 238–248. [Google Scholar] [CrossRef]
- Coello Coello, C.A. MOPSO: A proposal for multiple objective particle swarm optimization. In Proceedings of the 2002 Congress on Evolutionary Computation, Honolulu, HI, USA, 12–17 May 2002. [Google Scholar]
- Forrester, A.I.J.; Sóbester, A.; Keane, A.J. Engineering Design via Surrogate Modelling: A Practical Guide; John Wiley & Sons: Hoboken, NJ, USA, 2008. [Google Scholar]
- Chen, W.; Chiu, K.; Fuge, M.D. Airfoil design parameterization and optimization using Bézier generative adversarial networks. AIAA J. 2020, 58, 4723–4735. [Google Scholar] [CrossRef]
- Yılmaz, M.; Koten, H.; Çetinkaya, E.; Coşar, Z. A comparative CFD analysis of NACA0012 and NACA4412 airfoils. J. Energy Syst. 2018, 2, 145–154. [Google Scholar] [CrossRef]
- NACA 4 Digit Airfoil Generator (NACA 2412 AIRFOIL). Available online: http://airfoiltools.com/airfoil/details?airfoil=naca6412-il (accessed on 22 June 2025).
- Zengin, İ.; Erdoğan, B.; Benim, A.C. CFD and Taguchi based optimization of air driven single stage partial admission axial turbine blade profiles. Energy 2024, 290, 130333. [Google Scholar] [CrossRef]
- Fayyad, S.M.; Al Alawin, A.; Shabi, O.A.; Abulghanam, Z.; Abu-Ein, S.; Alsabagh, A.S.; Abu-Rahmeh, T.; Rawashdeh, M.O.; Momani, M.; Momani, W.; et al. Aerodynamics analysis comparison between NACA 4412 and Falco airfoils. J. Harbin Eng. Univ. 2024, 45. Available online: https://harbinengineeringjournal.com/index.php/journal/article/view/2526 (accessed on 22 June 2025).
- Berger, M.; Raffeiner, P.; Senfter, T.; Pillei, M. A comparison between 2D DeepCFD, 2D CFD simulations and 2D/2C PIV measurements of NACA 0012 and NACA 6412 airfoils. Eng. Sci. Technol. Int. J. 2024, 45, 101794. [Google Scholar] [CrossRef]

Disclaimer/Publisher’s Note: The statements, opinions and data contained in all publications are solely those of the individual author(s) and contributor(s) and not of MDPI and/or the editor(s). MDPI and/or the editor(s) disclaim responsibility for any injury to people or property resulting from any ideas, methods, instructions or products referred to in the content. |
© 2025 by the authors. Licensee MDPI, Basel, Switzerland. This article is an open access article distributed under the terms and conditions of the Creative Commons Attribution (CC BY) license (https://creativecommons.org/licenses/by/4.0/).