Abstract
The acceleration of industrialization and urbanization worldwide has dramatically improved living standards but has also introduced serious environmental and public health challenges. One of the most critical challenges is air pollution, particularly indoors, where individuals typically spend over 90% of their time. Ensuring good Indoor Air Quality (IAQ) is essential, especially in heavily frequented public spaces such as shopping malls. This study focuses on assessing IAQ in a large shopping mall located in Tabuk, Saudi Arabia, covering retail zones as well as an attached underground parking area. Monitoring is conducted over a continuous two-month period using calibrated instruments placed at representative locations to capture variations in pollutant levels. The investigation targets key contaminants, including carbon monoxide (CO), carbon dioxide (CO2), fine particulate matter (PM2.5), total volatile organic compounds (TVOCs), and formaldehyde (HCHO). The data are analyzed and compared against international and national guidelines, including World Health Organization (WHO) standards and Saudi environmental regulations. The results show that concentrations of CO, CO2, and PM2.5 in the shopping mall are generally within acceptable limits, with values ranging from approximately 7 to 15 ppm, suggesting that ventilation systems are effective in most areas. However, the study identifies high levels of TVOCs and HCHO, particularly in zones characterized by poor ventilation and high human occupancy. Peak concentrations reach 1.48 mg/m3 for TVOCs and 1.43 mg/m3 for HCHO, exceeding recommended exposure thresholds. These findings emphasize the urgent need for enhancing ventilation designs, prioritizing the use of low-emission materials, and establishing continuous air quality monitoring protocols within commercial buildings. Improving IAQ is not only crucial for protecting public health but also for enhancing occupant comfort, satisfaction, and overall building sustainability. This study offers practical recommendations to policymakers, building managers, and designers striving to create healthier indoor environments in rapidly expanding urban centers.
1. Introduction
Indoor environments are generally perceived as safer and more habitable than outdoor environments, with buildings serving as protective barriers that shield occupants from exposure to harmful pollutants present in the ambient air [1,2]. Properly designed indoor spaces are expected to offer a controlled atmosphere that minimizes the infiltration of outdoor contaminants, promoting a healthier and more comfortable living environment. Air pollution is intimately related to climate change because both issues are fundamentally generated from the same sources, such as combustion engine emissions [3] and hazardous substances from both human-made and natural sources [4]. Over the past two decades, air pollution in various forms has been responsible for more than 6 million fatalities each year globally, a number that has increased [5,6,7]. Natural air pollution occurs when hazardous substances, such as methane from decomposing organics or volcanic eruption gas and ash, are released into the air and accumulate near the surface. Human-made air pollution includes power generation by-products, vehicle emissions, and combustion from natural gas and other fuel oils used to heat residential, commercial, and industrial properties [8]. Traffic-Related Air Pollution (TRAP), which is a combination of particulates and gases, contains nitrogen oxides, carbon, ground-level ozone, sulfur oxides, volatile organic compounds (VOCs), fine particulate matter, and other pollutants [8,9,10]. When at ground level, TRAP forms an atmospheric gas known as smog, chemically reacting in sunlight. Smog also forms from gases emitted by power plants, refineries, industrial boilers, and vehicles, including carbon monoxide, carbon dioxide, sulfur oxides (SOx), and nitrogen oxides (NOx), which are all emitted either as industrial by-products or emissions from motor vehicles [10]. Another element contributing to smog is particulate matter (PM), which comprises chemicals like nitrate, carbon, sulfate, and mineral dust. The concentration level of PM provides information on air quality. Industrial and vehicle emissions, along with forest fires, brush fires, and cigarette smoke, contribute to environmental PM levels [10,11]. A finer PM subset, known as PM2.5, is especially hazardous to those suffering from respiratory conditions and diseases. These particulates are up to 30 times thinner than a single strand of a human hair [12,13] and can be deeply inhaled into lung tissue, causing permanent damage [13,14]. Like smog, PM and PM2.5 volatile organic compounds can contribute enormously to air pollution, both indoors and out. Pesticides, cleaning products, paint, glue, etc., all emit VOCs, as do natural gas and gasoline during combustion. Polycyclic aromatic hydrocarbons (PAHs) [15,16] also contribute to air pollution. To date, more than 100 PAHs are reported to be widespread, particularly in urban environments; of these, 15 are known to be carcinogenic [17,18]. Several industrial processes create PAHs as a by-product, including power generation and the manufacturing of steel, iron, and rubber. Particulate matter may also include PAHs [19,20]. No region on Earth is currently exempt from air pollution [21,22]. Poor air quality, both indoors and out, has become an unfortunate standard for most people in the world [21,22]. However, air pollution causes major problems not only for the environment in general but also for humans due to serious health risks [21]. Healthcare providers have become increasingly worried about the steep rise in diseases caused solely by environmental exposure, particularly to air pollutants. Air pollution is estimated to cause 9 to 12 million premature deaths worldwide each year, making it one of the leading environmental risk factors for mortality [23]. A substantial body of toxicological research indicates that exposure to poor air quality has both short- and long-term effects on human health and emotional well-being. Furthermore, existing literature has highlighted that air pollution not only poses significant risks to physical health but also exerts a detrimental influence on consumer decision-making processes, potentially altering purchasing behaviors and overall consumer experiences. A significant share of indoor air pollution results from everyday human activities within homes, schools, day-care centers, and other communal spaces, as well as in transit environments such as cars, buses, trains, and airplanes. Globally, air pollution contributes to around 800,000 deaths from chronic obstructive pulmonary disease (COPD) and 280,000 deaths from lung cancer. The health effects of indoor and outdoor air pollution are closely linked, as are the diseases associated with exposure. Although most research to date on pollution-related mortality has focused on outdoor pollutant levels, Indoor Air Quality (IAQ) is influenced not only by outdoor pollutants infiltrating indoor spaces but also by indoor emission sources, building design and construction, and occupant behavior [24,25]. Furthermore, air pollution is a major environmental health risk, with outdoor fine particulate matter (PM2.5) exposure ranking as the fifth leading cause of death globally, responsible for 4.2 million deaths and over 103 million disability-adjusted life years lost [25]. These deaths result from diseases affecting the cardiovascular, respiratory, immunological, and other bodily systems. Since the early 1970s, sick building syndrome (SBS) has affected those working in office environments, especially high-rise buildings with windows that cannot be opened [26]. As engineers and architects grew increasingly conscious of the costs associated with heating and cooling a building, they began to focus their designs on reducing energy needs, which usually involved replacing natural ventilation systems with mechanical air recirculation ventilation ones [27,28,29]. However, despite being cost-effective, such designs severely limit fresh air intake into a closed structure, which leads to a build-up of indoor pollutants. Earlier research identifies IAQ as a critical factor in SBS and its related symptoms, such as respiratory conditions [30,31,32]. However, improving air quality requires not just a reconsideration of building designs but a coordinated effort from governments, industry, and individuals [33,34]. Measures such as reducing emissions from transportation and industry could be implemented, along with those promoting the use of clean energy sources and the improvement of public transportation infrastructure [35,36]. Cleaning our air indoors and out also involves raising public awareness of the importance of air quality and encouraging individuals to take actions such as reducing personal vehicle use and properly disposing of waste [37,38,39].
Aiming to improve air quality in Saudi Arabia, the Saudi government has formed a central environment agency called the General Authority for Meteorology and Environmental Protection (here, shortened to GAMEP). This agency has been given the mandate to both set and follow up on the application of air quality standards and to do so within Saudi Arabia’s general policy framework that acts in accordance with existing government statutes. GAMEP’s primary goal is to protect human health and the environment, which it does by monitoring and maintaining acceptable air quality and protecting the nation from different emission sources. Accordingly, GAMEP has paid increasing attention to controlling the sources of air pollution emissions within Saudi Arabia. It also actively contributes to initiatives involving the international community through international environmental conventions and treaties, as well as protocols regulating international efforts. Air quality is crucial in supermarkets and malls, as these are typically indoor spaces with high levels of human traffic [40,41]. Poor air quality can result in a range of negative health effects for shoppers and employees, such as respiratory problems, headaches, and fatigue [42]. It can also negatively impact the shopping experience, leading to discomfort and reduced productivity. In addition, poor air quality in supermarkets and malls can affect the quality and shelf life of products [41,43]. For example, high levels of humidity can cause perishable foods to spoil more quickly, while pollutants such as VOCs can affect the taste, smell, and appearance of food products. To ensure good air quality in supermarkets and malls, it is important to have proper ventilation systems in place, with air quality monitoring systems being used to detect and address any potential issues. Moreover, it is important to promote sustainable practices in supermarkets and malls, such as reducing waste and promoting the use of environmentally friendly products and materials [44,45]. This can help to reduce the environmental impact of these facilities and improve overall air quality.
This study focuses on assessing key indoor air pollutants, including carbon monoxide (CO), carbon dioxide (CO2), fine particulate matter (PM2.5), total volatile organic compounds (TVOCs), and formaldehyde (HCHO). These pollutants were selected based on their known prevalence in commercial indoor environments such as shopping malls, their significant health impacts, and the ability to reliably monitor them with available instruments. The research was conducted in a large shopping mall in Tabuk, Saudi Arabia, where continuous air quality monitoring was performed over a two-month period across multiple zones, including retail areas and the underground parking garage.
To conduct the research, concentrations of key indoor air pollutants CO, CO2, PM2.5, TVOCs, and HCHO were measured using calibrated portable sensors placed strategically in representative locations to capture spatial and temporal variations. Data were collected continuously and logged at regular intervals to ensure comprehensive coverage. The measured pollutant concentrations were then systematically analyzed by comparing them with relevant national standards set by the Saudi Environmental Authority as well as international guidelines, including those published by the World Health Organization (WHO). Statistical analyses, including descriptive statistics and time-series trend evaluation, were conducted to identify periods and zones with pollutant levels exceeding recommended thresholds. This allowed for the identification of pollution hotspots and temporal patterns linked to mall activities, such as peak visitor hours or specific operational sources.
The study outcomes revealed that while most pollutant levels generally remained within acceptable limits, certain areas—particularly the underground parking garage—exhibited elevated concentrations of CO and PM2.5 during busy periods, indicating insufficient ventilation or pollutant accumulation. Elevated TVOCs and HCHO levels were also noted in some retail zones, likely linked to off-gassing from materials and products. These findings highlight the varying air quality challenges within different functional zones of the mall. To complement this empirical analysis, a systematic literature review of IAQ studies in Saudi Arabia was performed. The review identified key research themes and gaps, particularly the lack of detailed assessments in large commercial complexes, supporting the relevance and originality of the current study. It is worth noting that measuring for pollutants such as sulfur oxides (SOx), nitrogen oxides (NOx), polycyclic aromatic hydrocarbons (PAHs), and BTEX compounds (benzene, toluene, ethylbenzene, and xylene) was not performed in this work due to their generally low indoor concentrations in fully enclosed commercial buildings, the specific focus of this research, and practical limitations related to measurement feasibility and resources.
2. Significance of This Research
Indoor Air Quality (IAQ) is an essential aspect of environmental health with profound effects on human well-being, especially in enclosed commercial spaces. While significant research exists on IAQ in residential and office environments, there are few studies focusing on large enclosed retail complexes with multiple integrated facilities [41,46,47,48]. Along with shopping areas, these complexes often include parking garages, restaurants, and entertainment zones. Each of these components contributes unique sources of indoor pollutants and challenges for air quality management.
The present study addresses this critical gap in the literature by investigating IAQ in a large, fully enclosed shopping complex in Tabuk, Saudi Arabia. The facility includes retail stores, multiple markets, restaurants, and a parking area. Among the specialty shops are numerous perfume stores that contribute to the complex indoor environment with diverse pollutant sources. Thanks to Tabuk’s hot desert climate, the mall relies on artificial ventilation systems to keep the facility at a comfortable temperature. However, considering the complex mixture of emission sources—ranging from vehicle exhaust in the parking areas to volatile compounds in the perfume shops to cooking emissions in the restaurants—understanding IAQ is particularly important.
Our research focuses on measuring the key indoor pollutants, namely carbon monoxide (CO), carbon dioxide (CO2), fine particulate matter (PM2.5), total volatile organic compounds (TVOCs), and HCHO. These pollutants pose significant health risks when present at elevated concentrations indoors. By evaluating the concentrations of these pollutants throughout the shopping complex, the study identifies the main sources of pollution and assesses the effectiveness of ventilation and air quality control measures in maintaining a healthy indoor environment for shoppers and employees. The originality of this work lies in its comprehensive approach to a multi-functional enclosed retail complex, an approach that has not been extensively studied, particularly in Saudi Arabia. While conventional studies are limited to single-use indoor environments, this research accounts for a variety of emission profiles, highlighting the complexity of IAQ management in such settings. The study also evaluates compliance with national and international IAQ standards, providing a benchmark for environmental safety and consumer health protection.
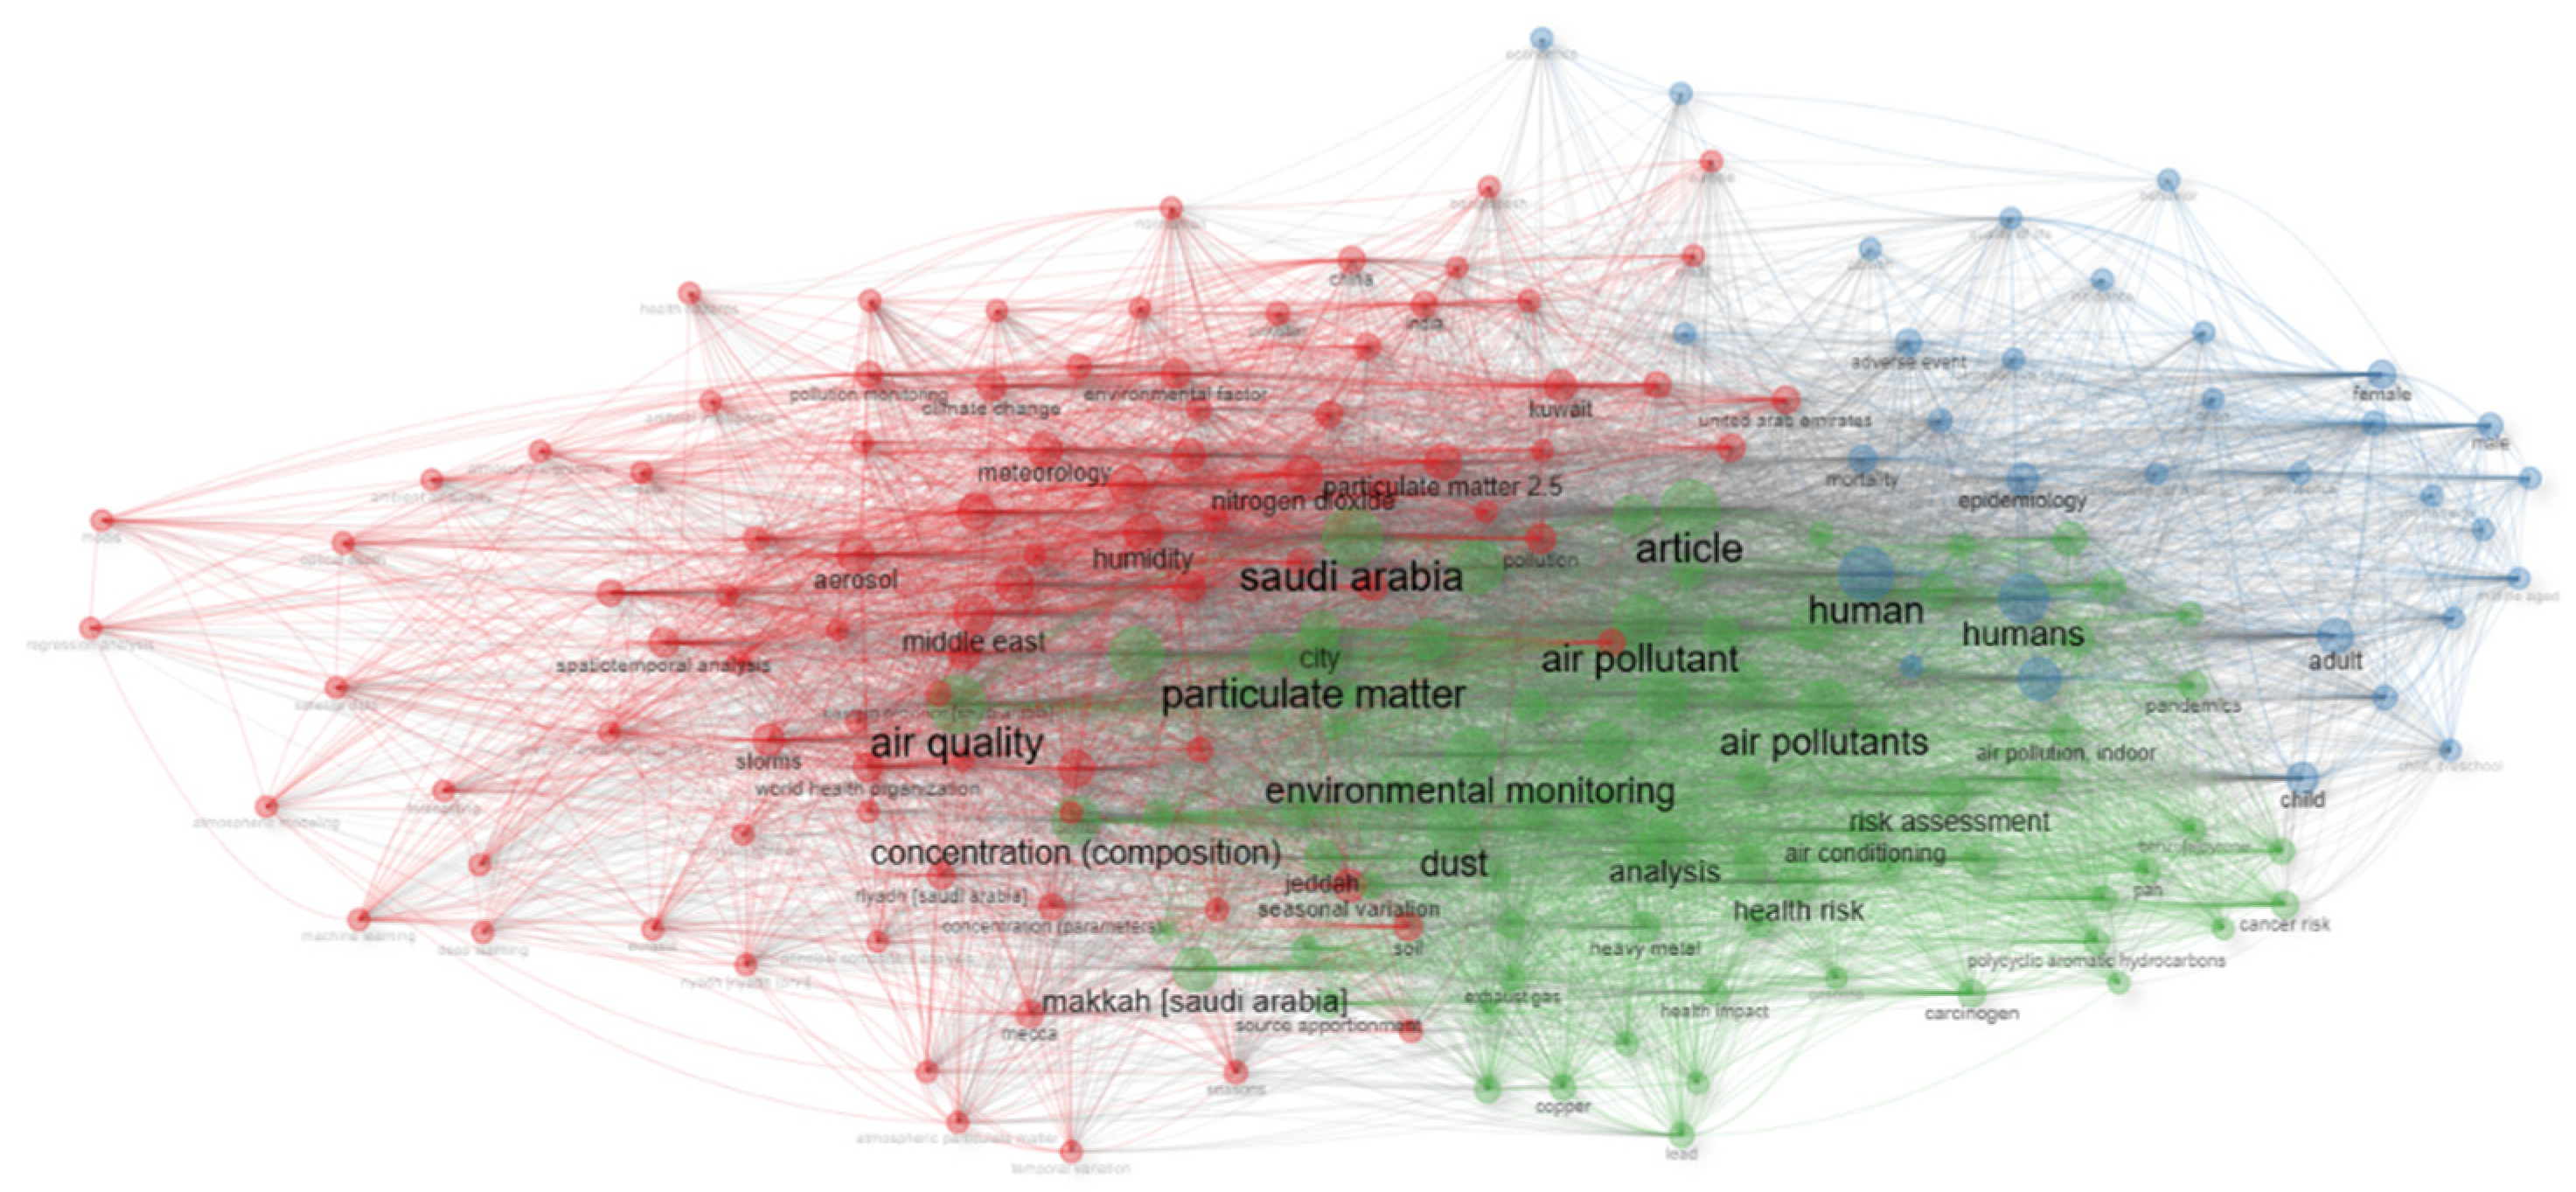
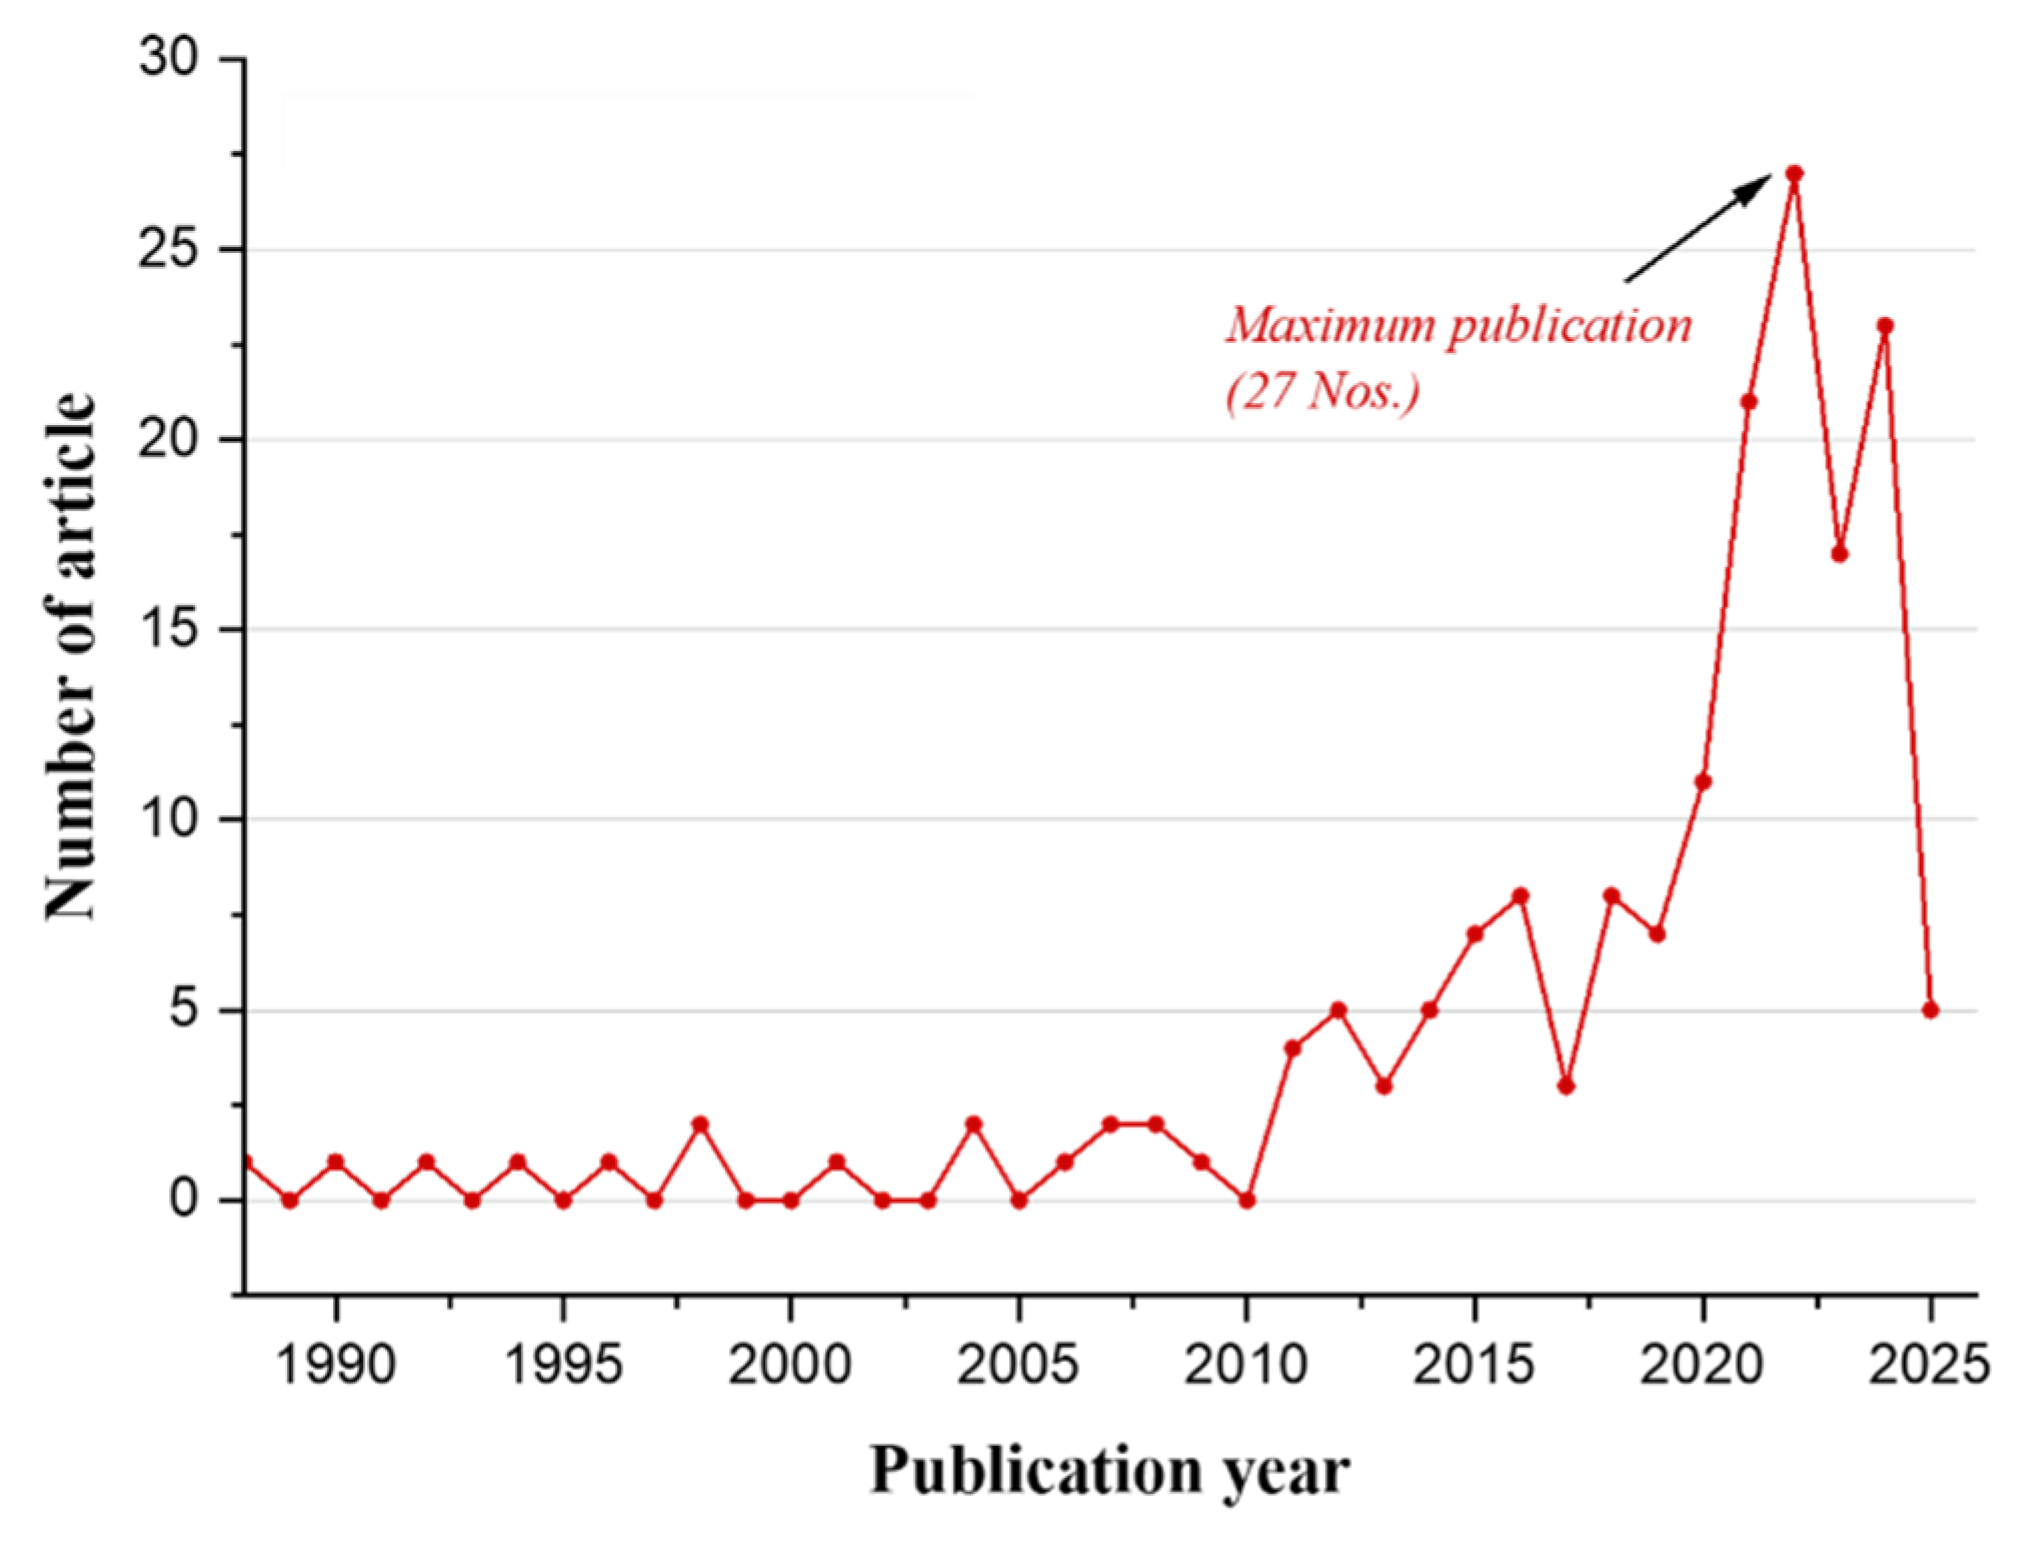
To support the empirical data, a systematic literature review on IAQ research in the Kingdom of Saudi Arabia (KSA) was conducted. The thematic analysis, visualized here through keyword clustering in Figure 1, reveals dominant research themes and existing gaps, notably the underrepresentation of studies focused on large commercial complexes. Figure 2 highlights the limited focus on human well-being in indoor commercial environments, reinforcing the significance of the current study. The figure shows the number of studies conducted on IAQ in Saudi Arabia KSA over time. As can be seen, there is a slow and relatively stable trend from 1988 until around 2010, with very few publications per year. However, starting in 2012, there is a noticeable increase in research activity, with a sharp rise after 2016. The peak occurred in 2021, with the highest number of publications (27). This suggests growing awareness and academic interest in IAQ issues in KSA, likely driven by increasing urbanization, health concerns, and environmental policies in recent years. The findings offer valuable insights for facility managers, policymakers, and health officials identifying pollutant hotspots and ventilation challenges within a complex enclosed retail environment. The integrated assessment, combining pollutant measurements with a literature review, bridges the gap between localized empirical evidence and broader research trends.
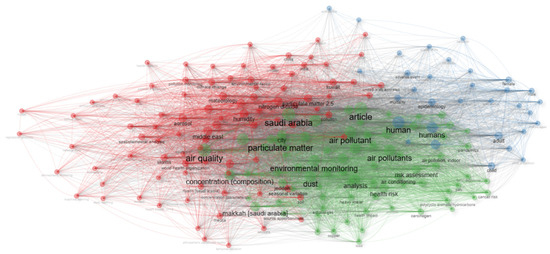
Figure 1.
Thematic map of keywords for evaluating current research trends.
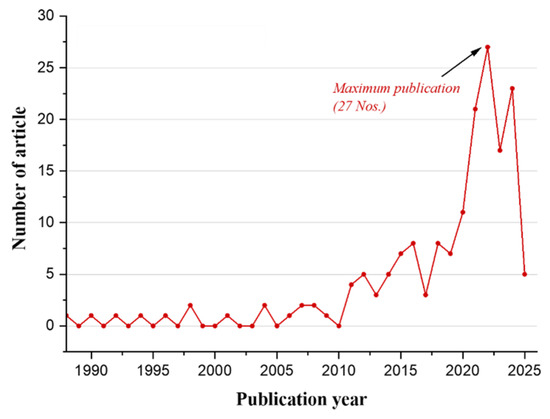
Figure 2.
Number of studies conducted on IAQ in KSA.
3. Research Methodology
3.1. Site Location
Tabuk is situated in northwestern Saudi Arabia (28°23′50″ N and 36°34′44″ E), as illustrated in Figure 3. It is a rapidly growing industrial and economic region that is also renowned for being one of the most beautiful cities in the northern part of the country. Tabuk includes numerous hotels and commercial centers and has become a major tourist and entertainment destination both domestically and internationally. Some of the newest additions to Tabuk are shopping and entertainment malls, one of which has been selected as the object of the present study. The mall covers around 165,000 square meters and consists of ground (first) and second floors. It includes 289 stores and exhibition sites, indoors and outdoors, along with parking spaces for around 2500 cars. There is also an indoor parking garage with space for up to 90 cars. The study area and the location of the sampling points are shown in Figure 4.

Figure 3.
Map of KSA showing the location of Tabuk.

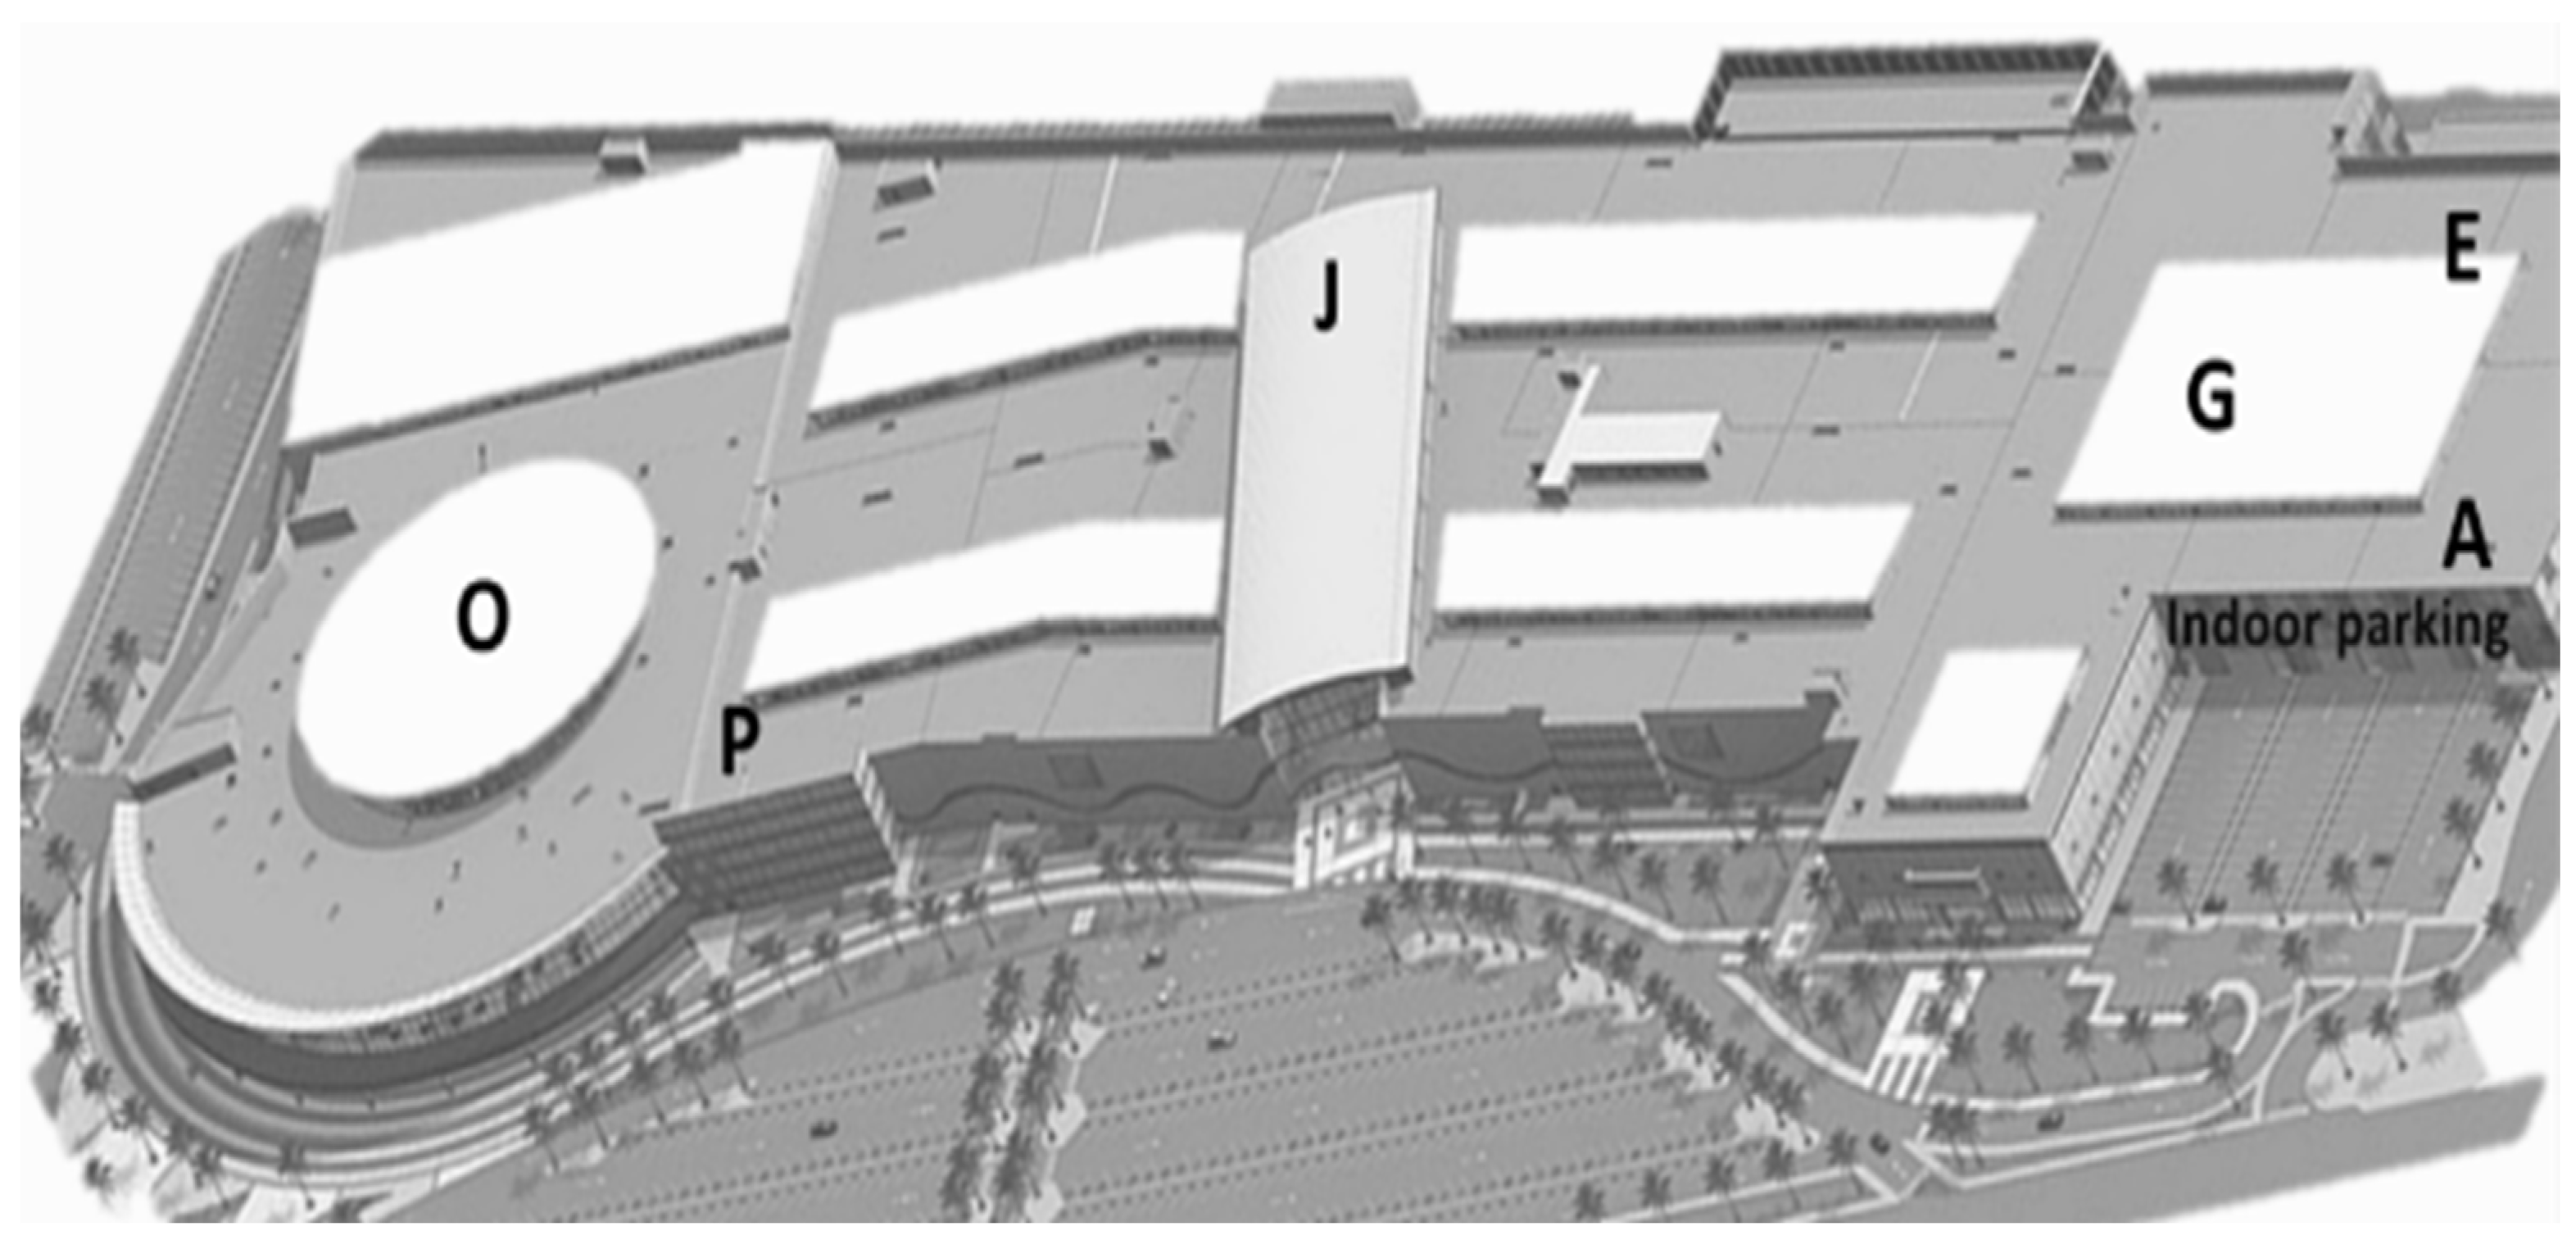
Figure 4.
Location of measurement points and the indoor parking garage at the shopping mall.
For the present study, six sampling points were selected to conduct a comprehensive investigation of IAQ in the shopping mall and its parking garage (Figure 4). Points A, E, and G are located within the parking garage area. These points were chosen to represent different zones of the garage, including areas near vehicle entry and exit points, as well as more central locations, to capture spatial variations in pollutant concentrations influenced by vehicle emissions and ventilation effectiveness. Inside the shopping mall, points J, O, and P were selected to represent diverse indoor environments. Point J corresponds to a high-traffic retail zone, point O is situated near food service outlets, and point P is in a common area with significant occupant density. The selection of these points ensures a balanced assessment of air quality across both parking and retail zones, enabling a better understanding of pollutant distribution and potential health risks in various sections of the complex.
3.2. Data Collection and Sampling Strategy
To ensure a comprehensive assessment, data collection was conducted over two months, with air quality measurements taken across multiple time intervals to account for daily variations in indoor air pollution levels. Sampling was conducted during both peak and off-peak hours to analyze differences in pollutant concentrations when foot traffic was at its highest and lowest. Measurement points were carefully selected to capture variations in IAQ across different locations within the mall. Sampling sites included indoor shopping areas, corridors, food courts, and recreational spaces, as well as the parking garage, which was expected to have higher pollutant concentrations due to vehicular emissions. Moreover, ventilation points such as air vents and Heating, Ventilation, and Air Conditioning (HVAC) system outlets were included in the study to evaluate air circulation effectiveness. Each sampling location was chosen based on factors such as space enclosure, proximity to pollution sources, and potential risk to human health. The study design incorporated repeated measurements at each sampling point to ensure consistency and to reduce the impact of transient fluctuations in air quality.
3.3. Factors Measurement Techniques
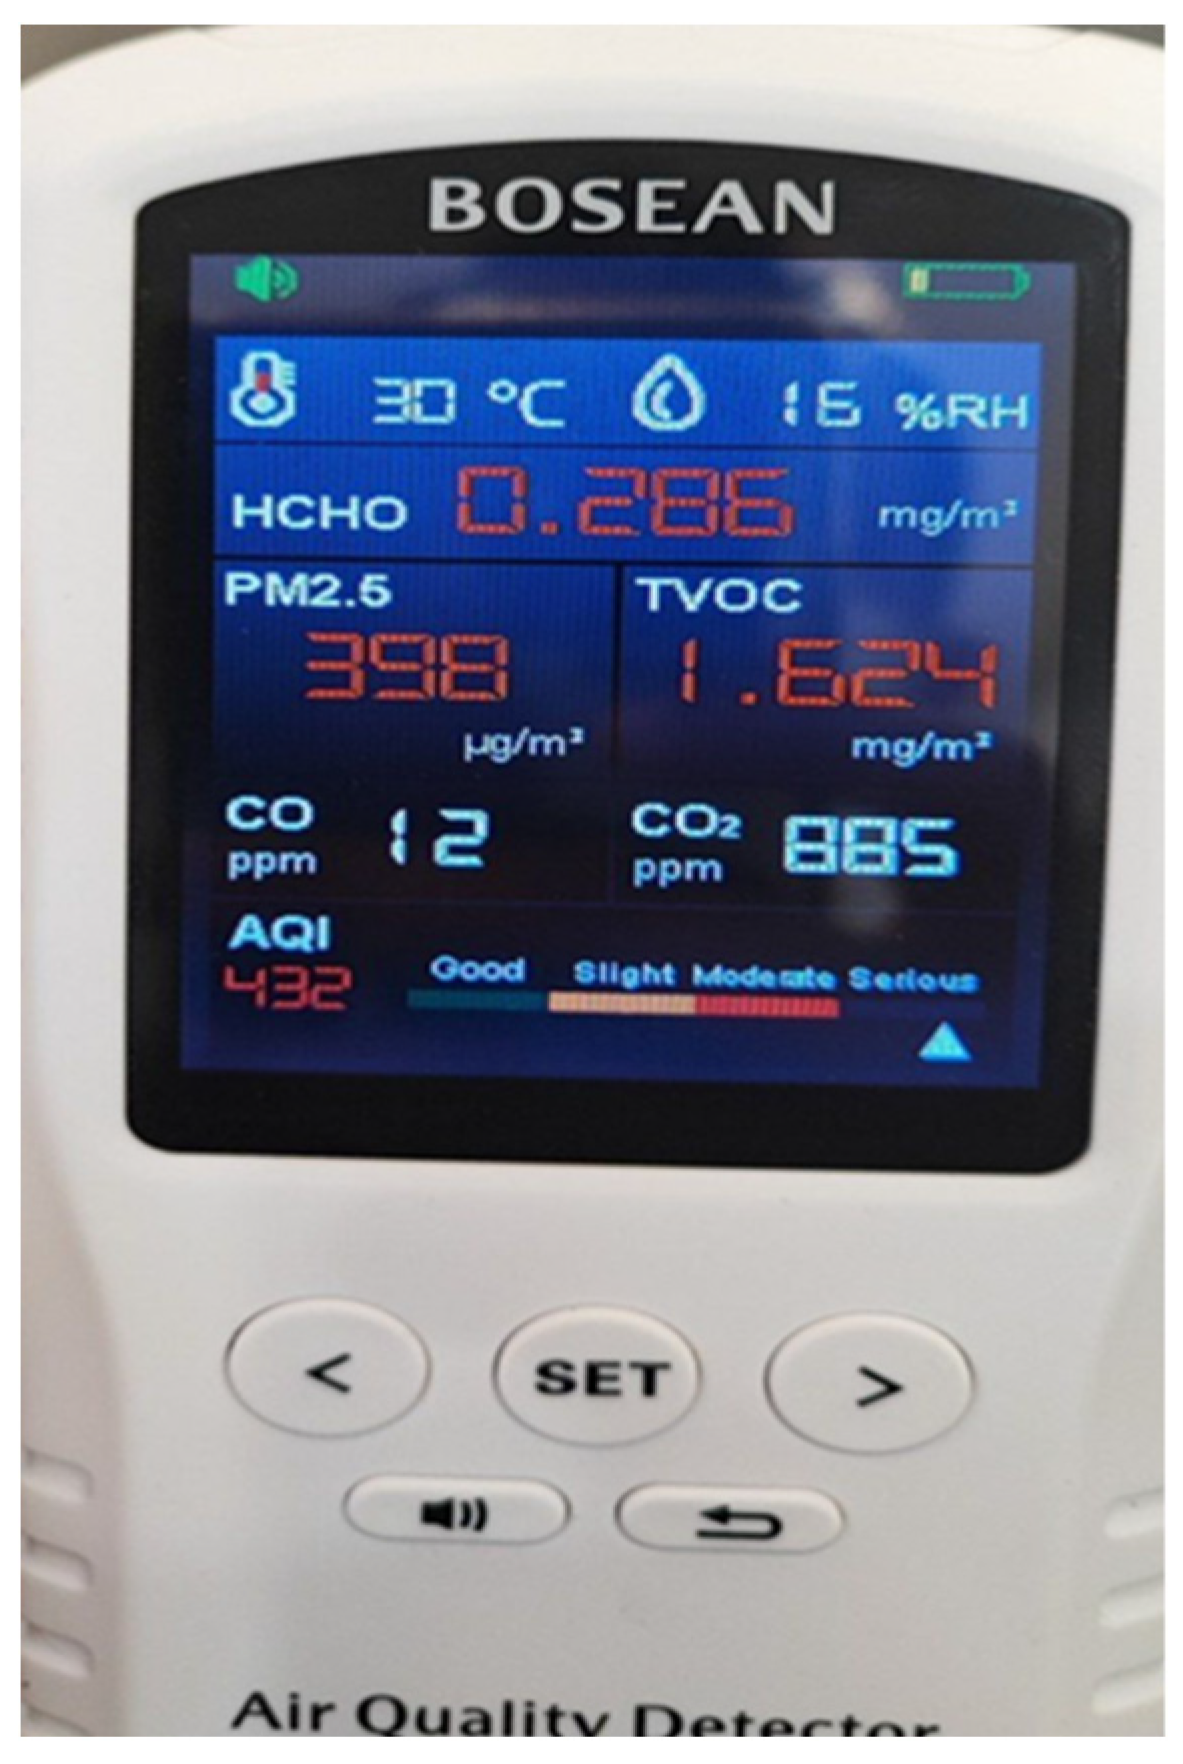
Air quality parameters were measured using high-precision portable gas detectors, namely the BTMETER HP-5800S (Zhuhai JiDa Huapu Instrument Co., Ltd., Zhuhai, China) and BOSEAN T-Z01pro (Henan Bosean Electronic Co., Ltd., Zhengzhou, China) (Figure 5). These devices were selected based on their sensitivity, accuracy, and capability to detect multiple air pollutants in real time. The BTMETER HP-5800S was used to measure PM2.5, TVOCs, HCHO, CO, and CO2, while the BOSEAN T-Z01pro provided cross-validation for these measurements. The calibration of both instruments was performed prior to data collection to ensure the reliability of the readings. The devices were operated under controlled conditions to minimize external interferences and fluctuations in environmental variables, such as temperature and humidity, that could affect sensor performance. Measurements were taken at each site for a standardized duration, with multiple readings recorded at different times of the day to assess fluctuations in pollutant levels. The specifications are provided in Table 1.

Figure 5.
Detector used for air quality parameters.

Table 1.
Parameters and measurement ranges of pollutants considered in this study.
3.4. Selection and Analysis of Pollutants
The study focused on five major air pollutants that significantly impact indoor environments and human health: CO, CO2, PM2.5, TVOCs, and HCHO. These pollutants were selected based on their known adverse effects on respiratory health, cognitive function, and overall well-being. Carbon monoxide is an odorless, colorless gas produced primarily by incomplete combustion of hydrocarbons. High concentrations of CO can lead to severe health complications, including dizziness, headaches, and, in extreme cases, fatal poisoning due to its interference with oxygen transport in the bloodstream. CO2 is another key indicator of IAQ, as elevated levels suggest poor ventilation and insufficient air exchange, which can cause cognitive impairment and discomfort among occupants. PM2.5 consists of ultrafine particles that can penetrate deep into the lungs and bloodstream, increasing the risk of cardiovascular and respiratory diseases. TVOCs, which include a broad range of organic chemicals emitted from cleaning products, paints, and furniture, are known to contribute to indoor air pollution and long-term health risks, including neurological effects and respiratory irritation. Formaldehyde, a common indoor air pollutant emitted from building materials, adhesives, and textiles, is classified as a carcinogen and can cause irritation of the eyes, nose, and throat, as well as exacerbate respiratory conditions such as asthma.
4. Results and Discussion
4.1. Carbon Monoxide Measurements
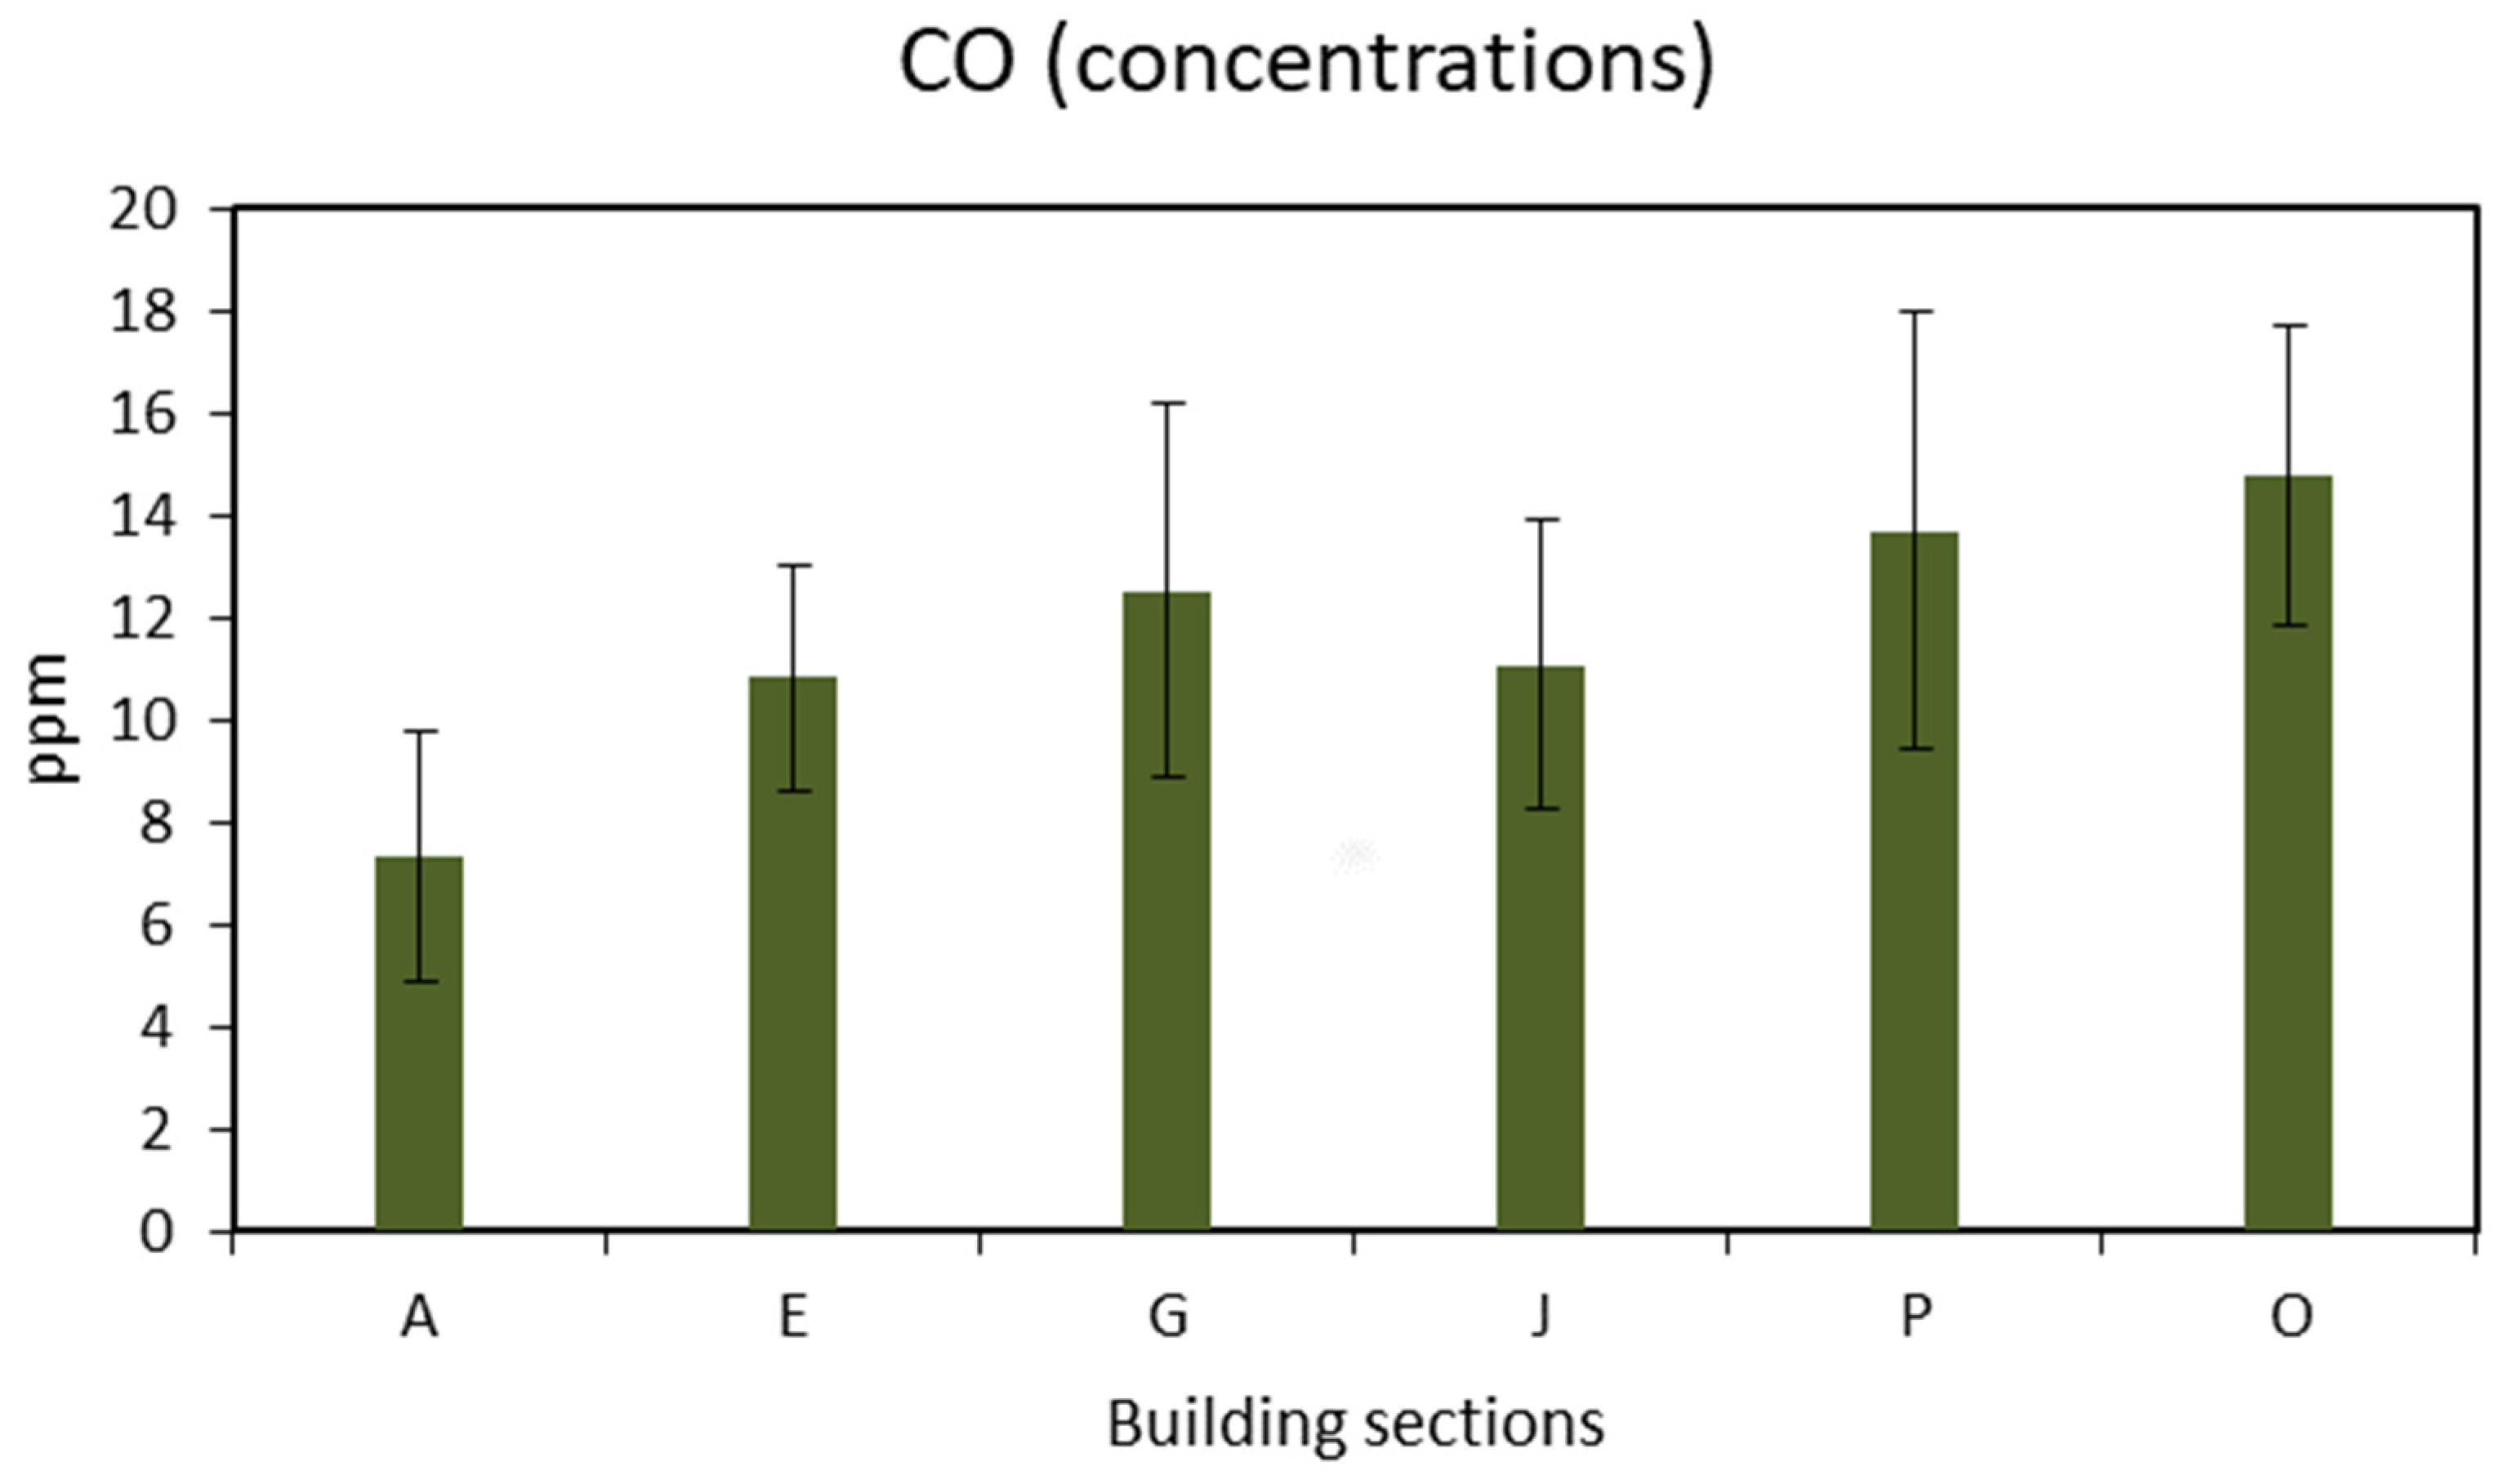
As shown in Figure 6, all the CO readings fall below the maximum standard concentration of 35 ppm. The highest value was observed at 14.77 ± 2.9 ppm at section O of the mall in the food court area, where fumes from the kitchens with poor ventilation can be more concentrated. On the other hand, the minimum concentration of CO was 7.35 ± 2.4 ppm in a naturally ventilated space in the parking lot with minimal activities. While CO is frequently measured in air quality studies, it is rarely the primary focus of indoor and outdoor pollution research. This limited attention may stem from the fact that CO is an odorless and colorless gas that remains undetectable by human sensory perception and that its inhalation at moderate concentrations does not produce immediate pulmonary symptoms. The absence of noticeable warning signs heightens the risk of gradual poisoning, which, at elevated exposure levels, can result in severe toxicity or even sudden fatality. Increasing evidence now associates CO exposure with a range of adverse health effects, and it is estimated that approximately 30,000 individuals worldwide succumb annually to unintentional CO poisoning [49].
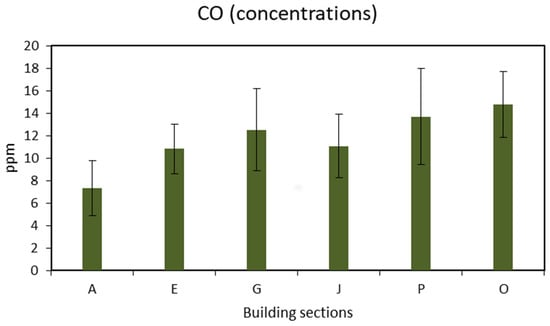
Figure 6.
Concentration of carbon monoxide.
4.2. Carbon Dioxide Measurements
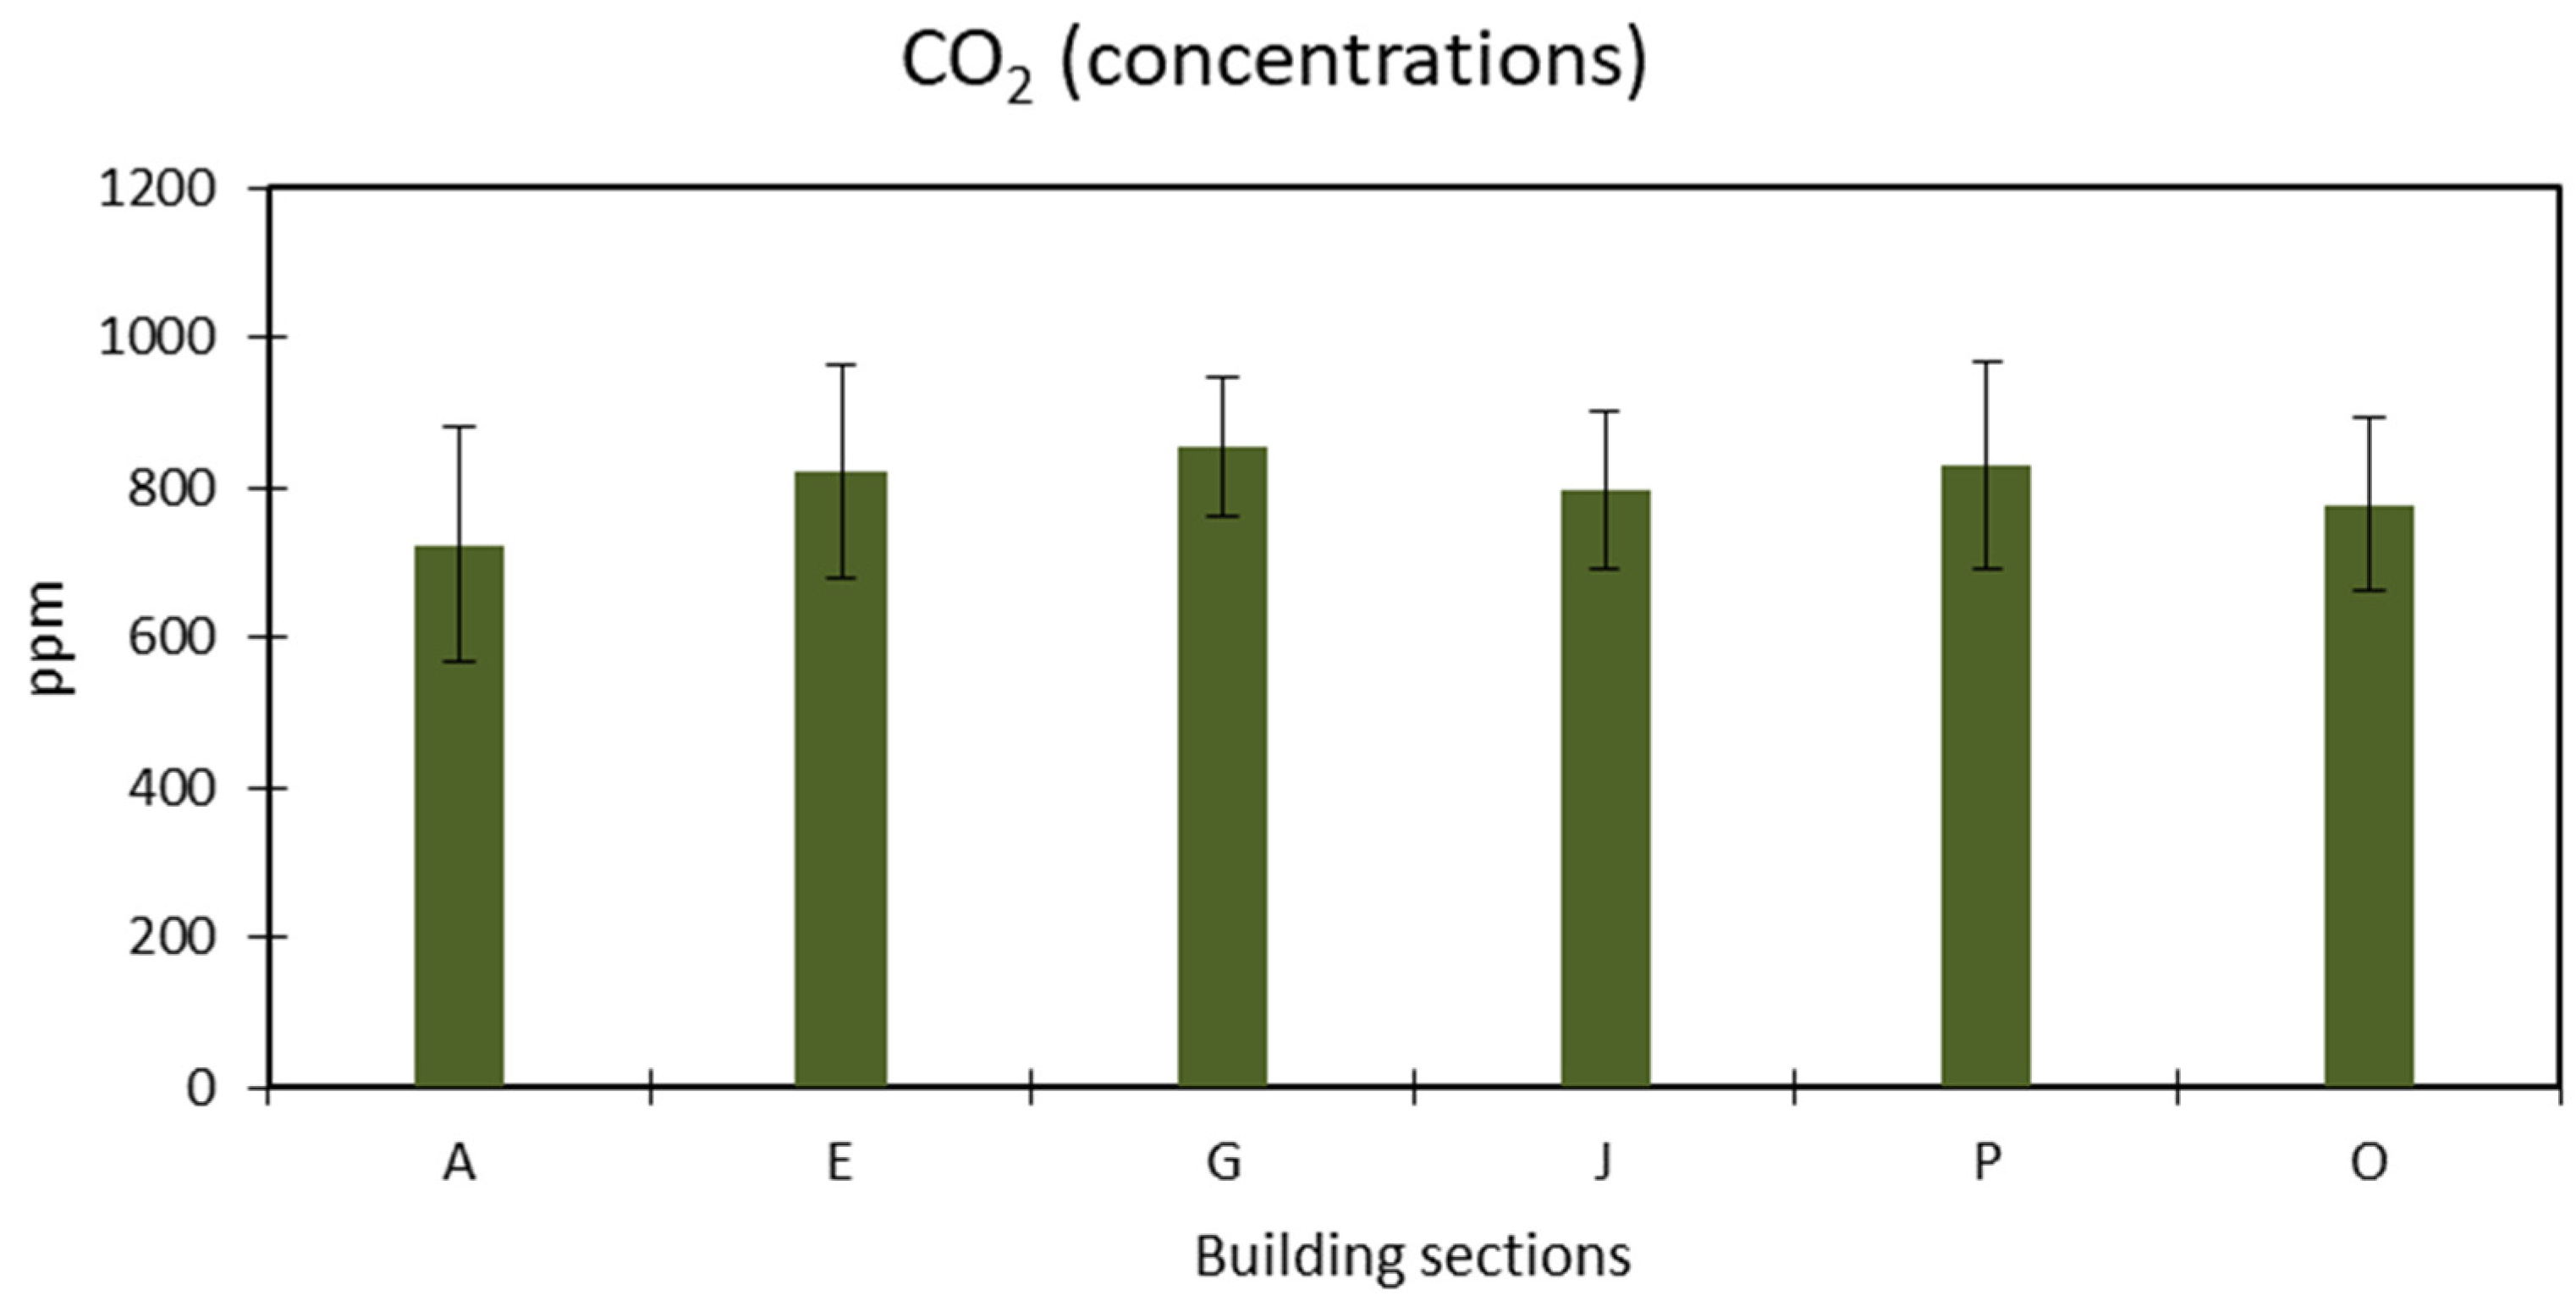
While indoor CO2 regulation constraints are prevalent, CO2 is unique among assessed indoor factors. In typical indoor circumstances, it is widely regarded as a non-hazardous contaminant, serving instead as a signal of the efficacy of building ventilation in mitigating other potentially harmful pollutants [50]. The measurements of CO2 were taken throughout the mall. All readings had a similar pattern, falling in the range of 722 and 777 ppm (as seen in Figure 7) and were below the maximum standard of 1000 ppm. Nevertheless, a minimum concentration of 523 ppm was recorded. A similar observation was recorded by Omeokachie, Ana [51], in which the CO2 levels exceeded the 1000 ppm threshold, driving the visitors to complain about sickness, fatigue, and lack of fresh air. Furthermore, a study conducted by Bogdanovica, Zemitis [52] found that an elevated range of CO2 gradually reduces the performance of children in an academic setup, and a long time of staying in that circumstance causes an uncomfortable environment for learning.
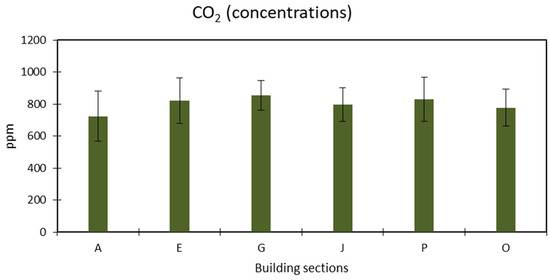
Figure 7.
Concentration of carbon dioxide.
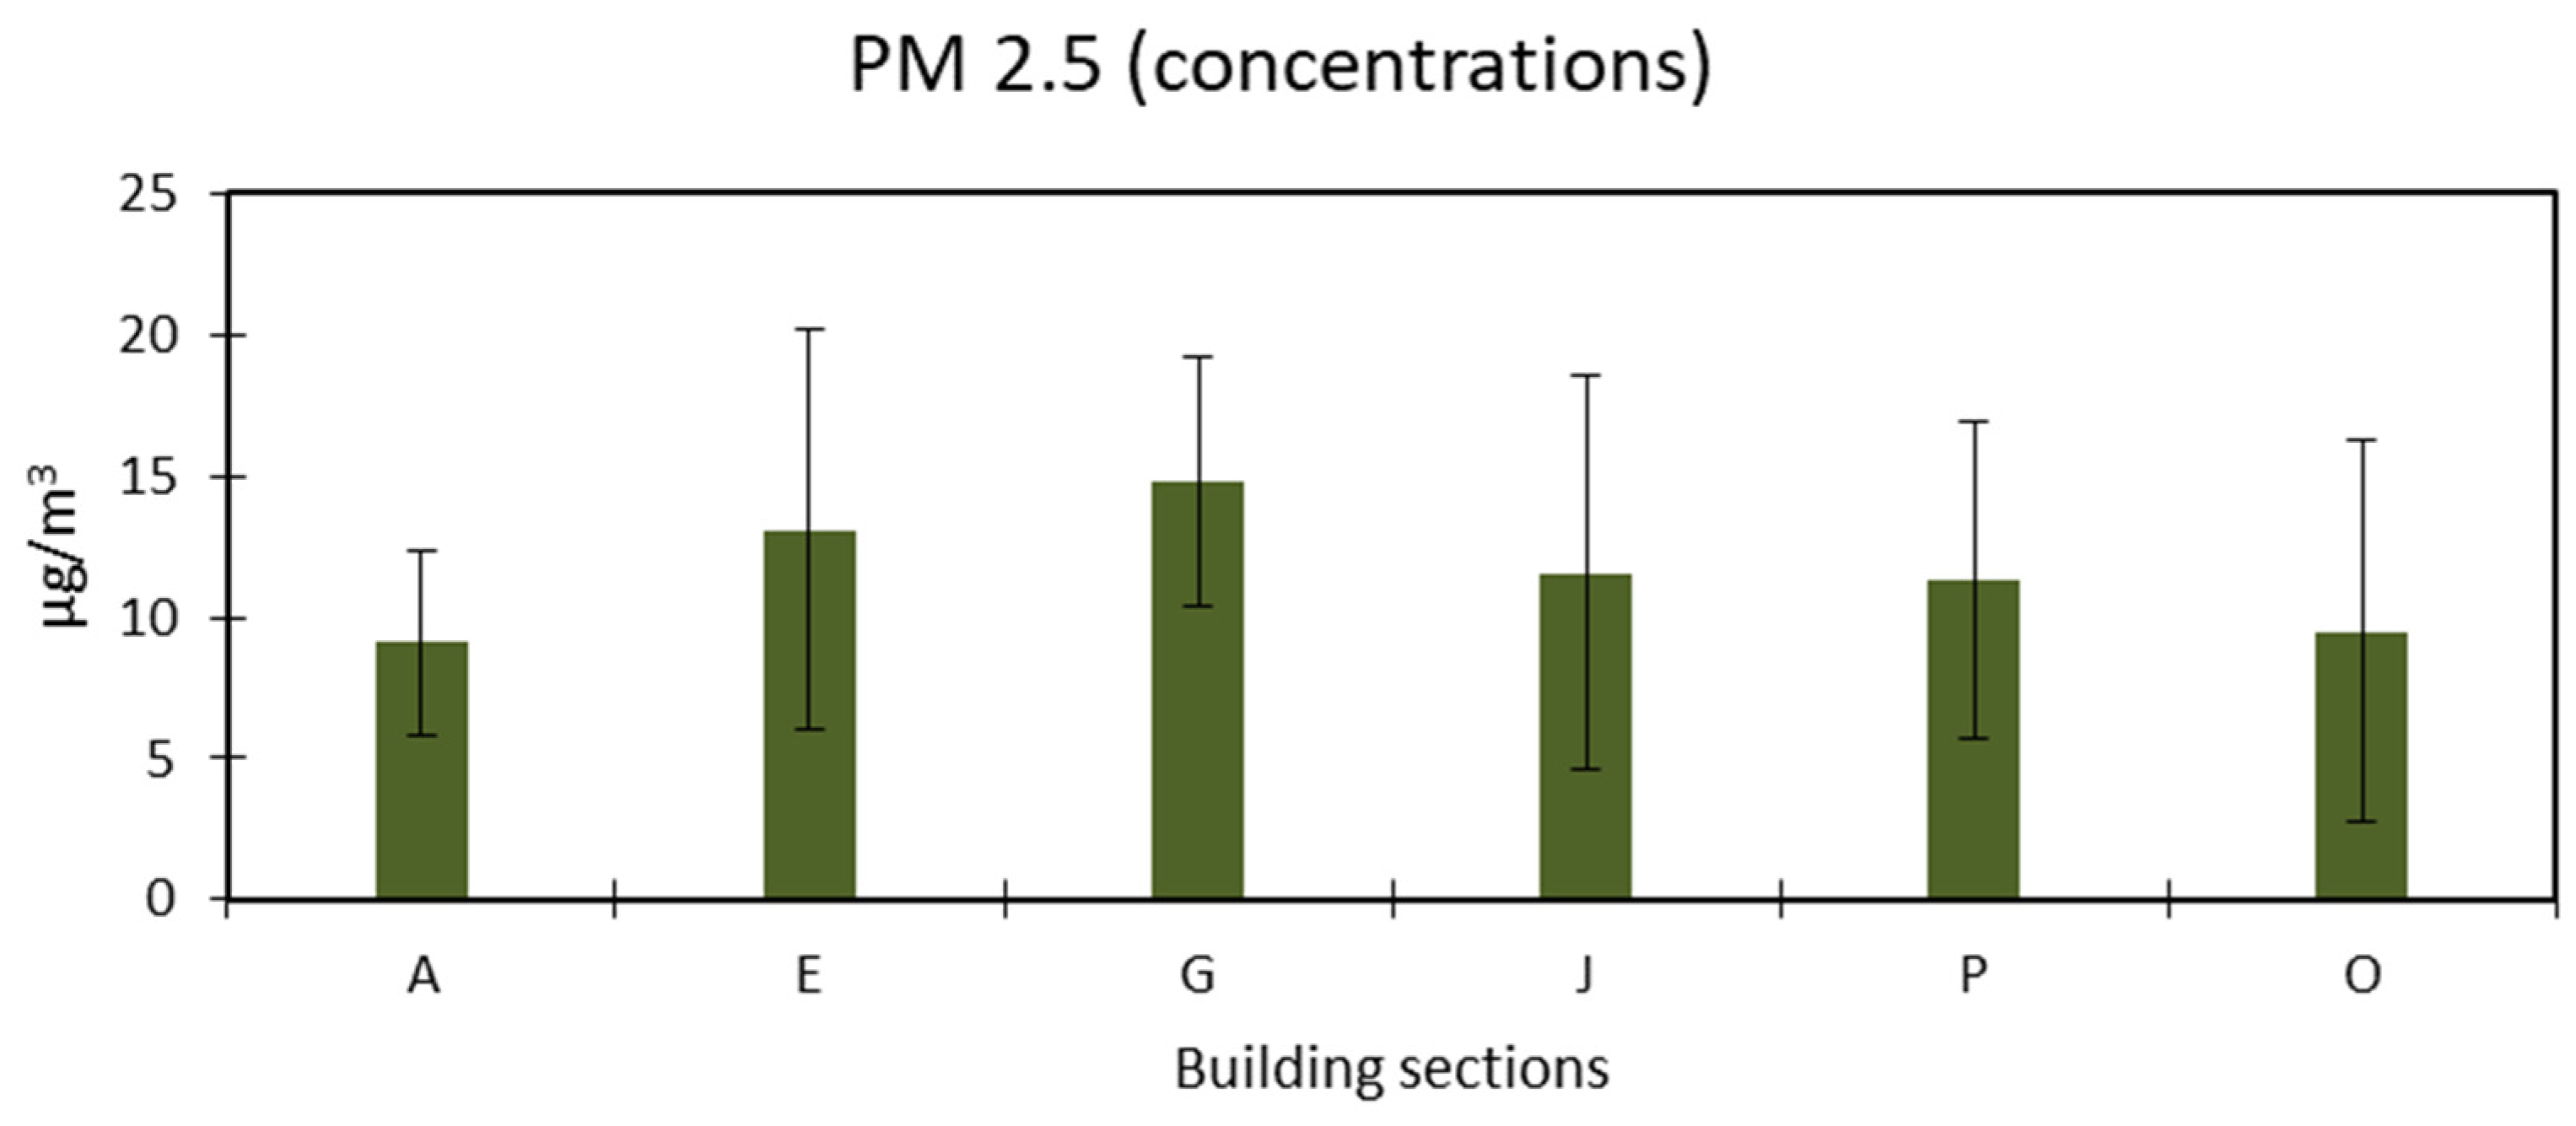
4.3. PM2.5 Measurements
For particulate matter 2.5, no alarming readings were noticed, indicating that the building is well isolated from the weather outside, which can have dust storms around the year because of the large arid areas in the city. The minimum concentration of PM2.5 was 9.1 µg/m3 in section A. In contrast, the highest was 14.8 µg/m3 in section G, as illustrated in Figure 8. According to previous research, exposure to fine particulate matter (PM2.5) and ozone (O3) has been associated with an increase in hospital admissions and mortality rates due to respiratory and cardiovascular diseases. Simultaneous exposure to PM, particularly PM2.5, is also believed to contribute to the prevalence of asthma among vulnerable populations. Additionally, inhalation of suspended particulate matter, particularly in indoor environments such as office spaces, has been linked to upper respiratory symptoms and other adverse health effects [53]. In a study performed at Macao, the researchers concluded that PM has a direct correlation between the type of maintenance and processes being performed in closed areas rather than the number of laborers working, in addition to the factor of poor ventilation [54,55].
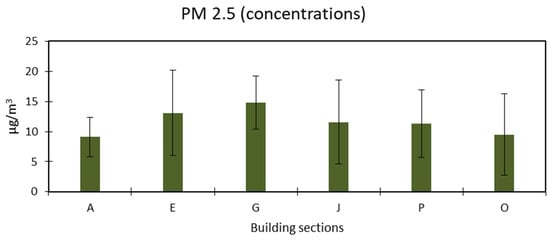
Figure 8.
Concentration of particulate matter (PM2.5).
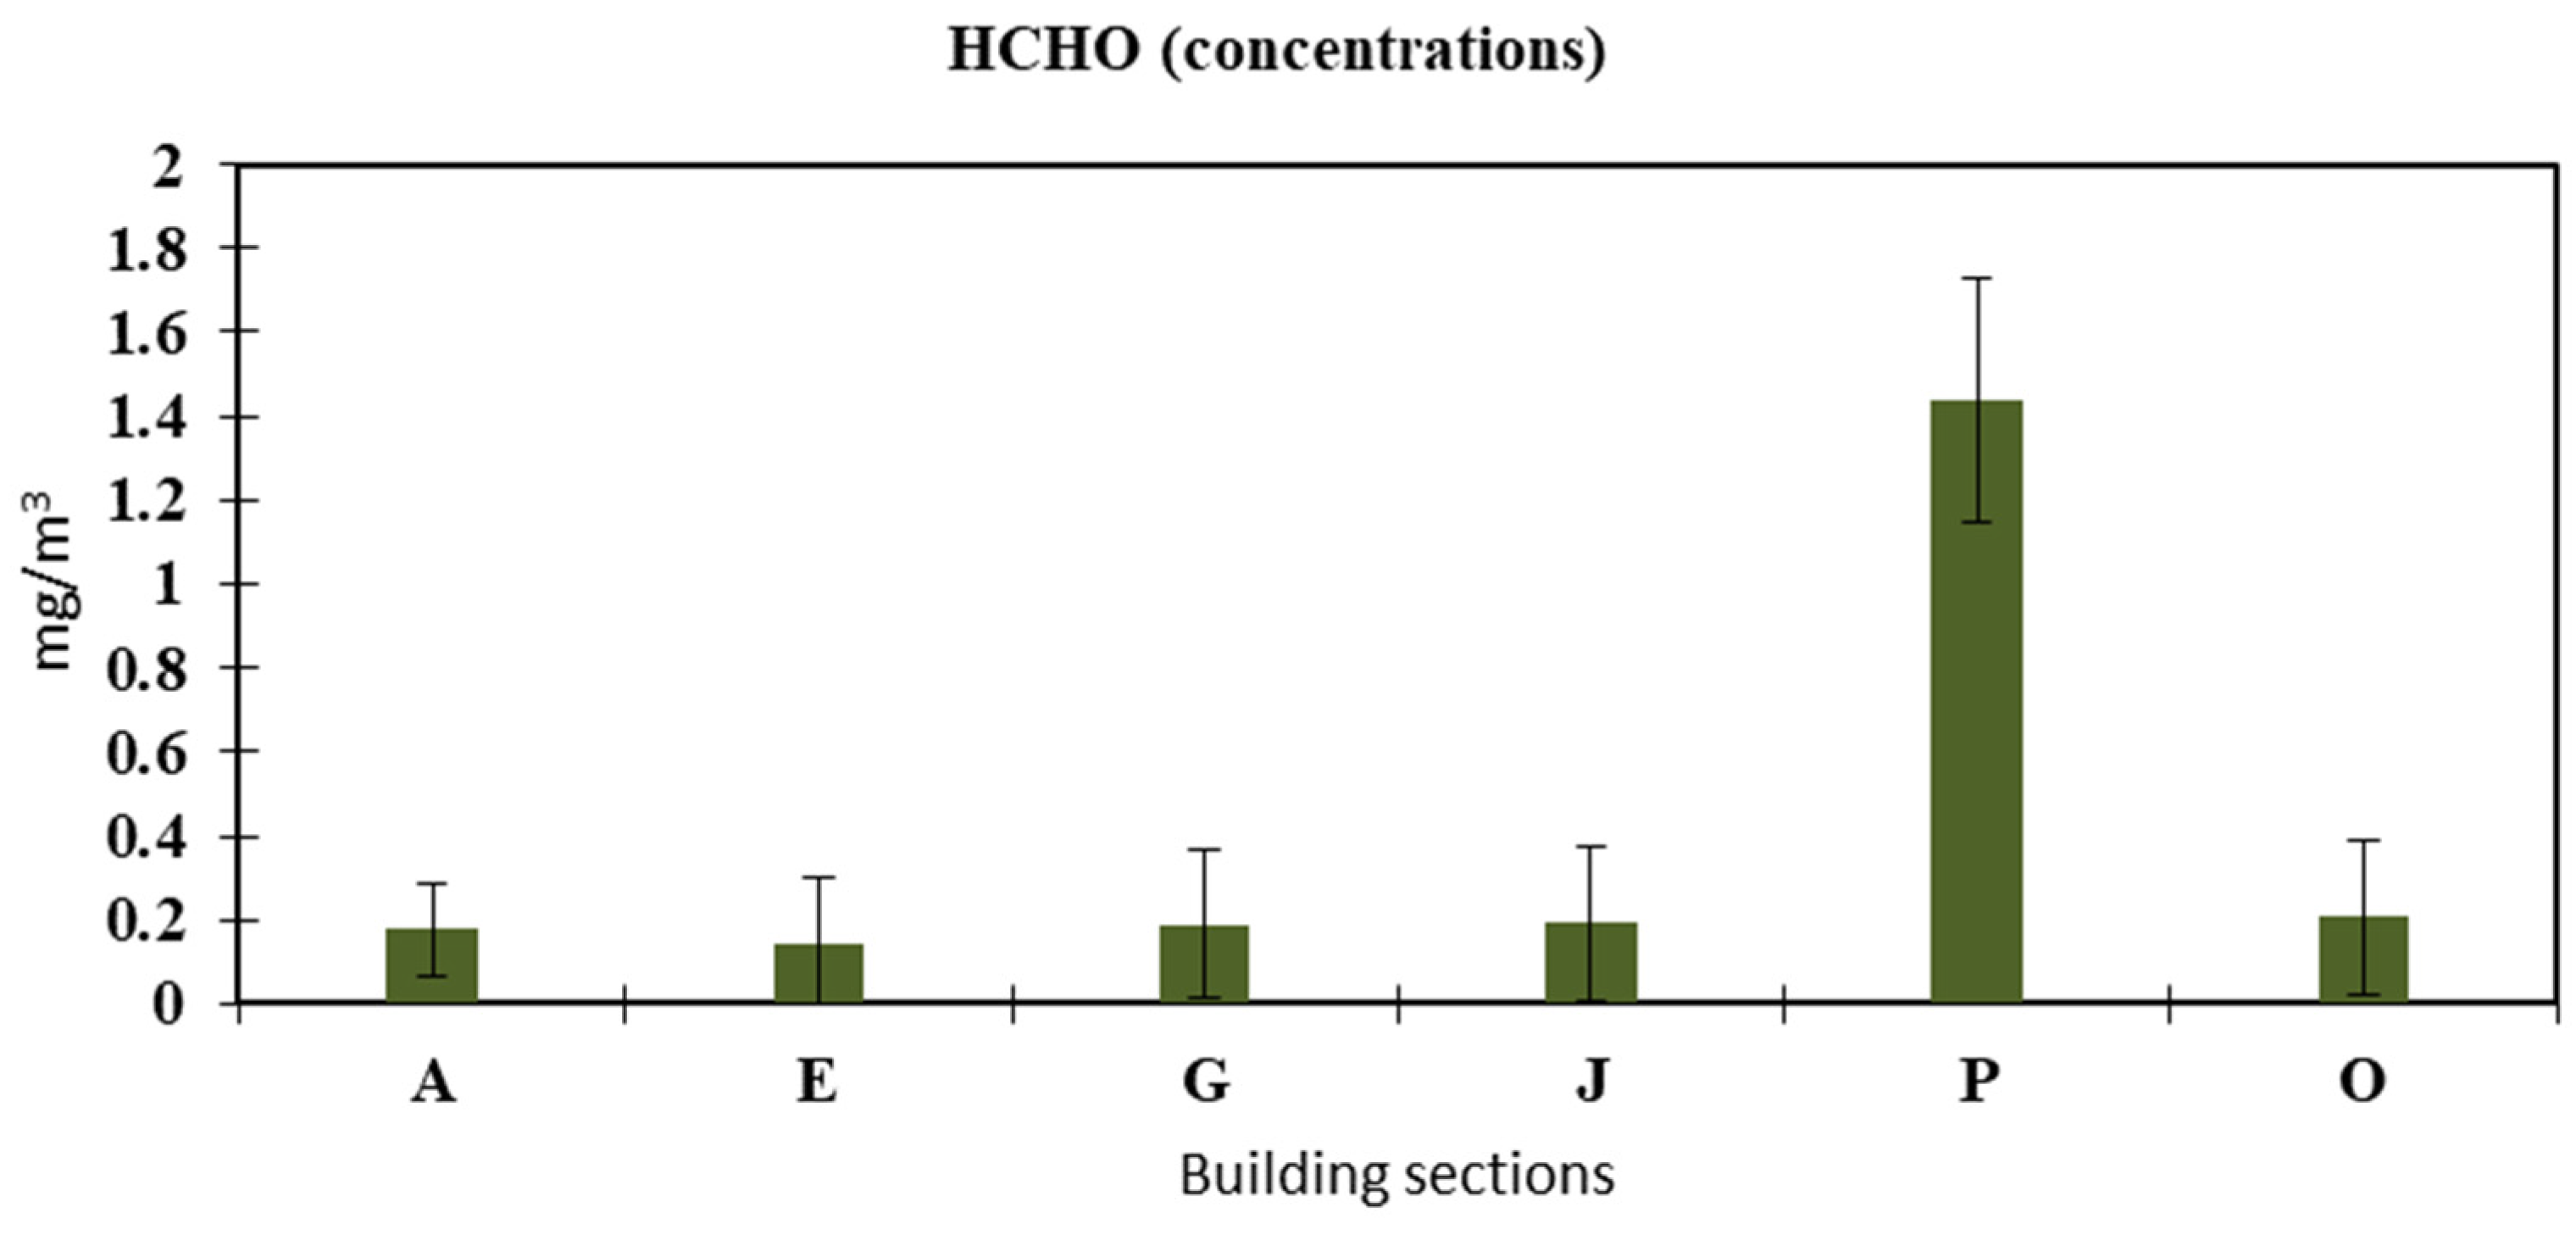
4.4. Formaldehyde Measurements
Indoor HCHO levels can be impacted by several factors, such as the age of the building, the ventilation rate, and the ambient temperature [56]. As illustrated in Figure 9, the minimum average value of HCHO recorded was 0.1781 ± 0.11 mg/m3 in section A, and the maximum was 1.4359 ± 0.29 mg/m3 in section P. The higher visitor traffic can explain these readings in section P, where the sampling was performed during rush hours, in addition to the maintenance conducted during sampling in that section. According to the WHO guideline on IAQ (IAQG), if 30 min of exposure time is set at 0.1 mg/m3 [57], the short-term impact on respiratory system exposure will be in the range of 0.08–11.2 mg/m3 [58,59]. Studies conducted by Rovira, Roig [60] stated that acute exposure to HCHO is known to irritate the eyes and respiratory tract, with symptom severity increasing in a dose-dependent manner. Common effects include excessive tearing, sneezing, coughing, nausea, and difficulty breathing, with extreme exposure potentially leading to fatal outcomes. Prolonged exposure to elevated HCHO concentrations has been linked to persistent irritation of the respiratory airways and ocular system, along with degenerative, inflammatory, and hyperplastic alterations in the nasal mucosa [60].

Figure 9.
Concentration of formaldehyde.
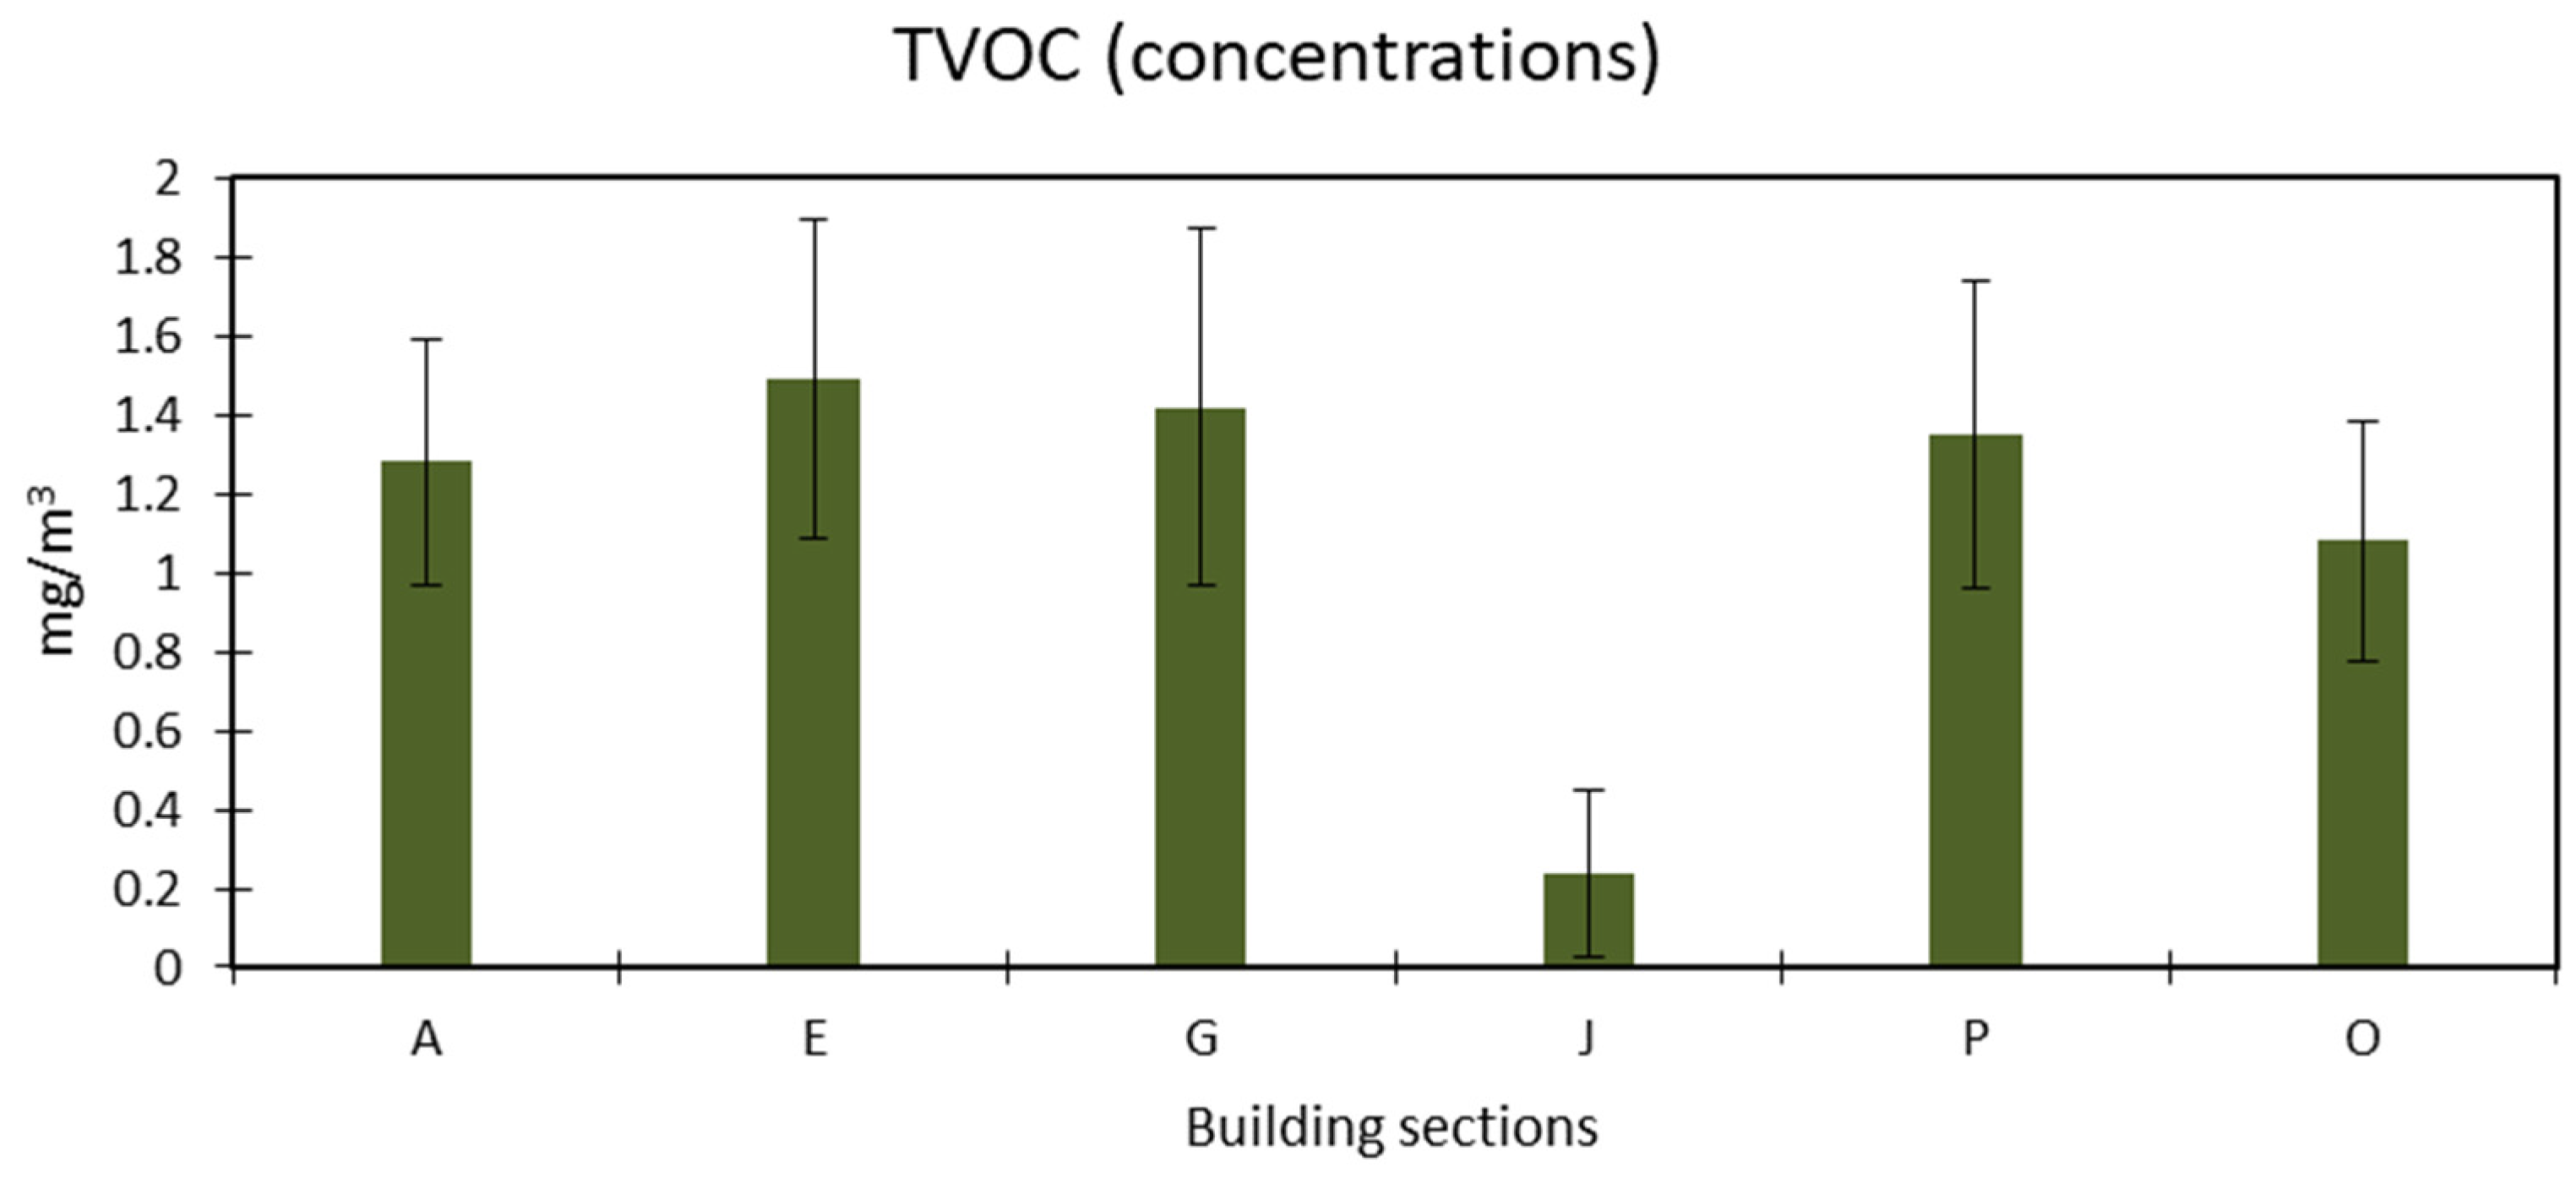
4.5. Total Volatile Organic Compounds Measurement
The measurement of TVOCs in the Tabuk shopping mall revealed a considerable variation in concentration levels across different sections, as illustrated in Figure 10. The lowest recorded concentration was 0.23 ± 0.21 mg/m3 in section J. In comparison, the highest value reached 1.48 ± 0.40 mg/m3 in section E. The fluctuations observed in TVOC levels are likely attributable to differences in sampling times throughout the day and across multiple days of the week, as variations in human activity, ventilation efficiency, and cleaning practices can significantly influence IAQ. According to the Leadership in Energy and Environmental Design (LEED) guidelines, the recommended limit for TVOCs in indoor environments is 0.25 ppm (equivalent to approximately 0.55 mg/m3). However, the average concentration in the mall was recorded at 1.21 mg/m3, substantially exceeding this threshold. Such elevated levels of TVOCs are concerning, as prolonged exposure to these compounds has been linked to various negative health effects, including headaches, respiratory irritation, and potential long-term neurological impacts [61]. Similar findings have been reported in other studies, where TVOC concentrations in commercial spaces were found to be significantly higher than recommended limits due to sources such as air fresheners, cleaning agents, and emissions from building materials [62,63]. A recent study of underground shopping malls in Korea revealed that TVOC concentrations tend to be elevated inside stores, particularly in clothing and fashion accessory outlets, compared to food service stores and outdoor environments. The study demonstrated a strong association between higher TVOC levels, increased CO2 concentrations, and the presence of storefront walls. These findings highlight the importance of monitoring CO2 as an indicator of air quality and suggest that improving ventilation systems and reconsidering storefront wall designs can effectively reduce TVOC levels and enhance IAQ within underground shopping malls [64]. Likewise, research on office buildings has demonstrated that inadequate ventilation and the presence of VOC-emitting materials, such as carpets and furniture, contribute to sustained high TVOC levels [65]. These findings highlight the importance of implementing effective ventilation strategies and source control measures to mitigate TVOC exposure in enclosed commercial spaces.

Figure 10.
Concentration of total volatile organic compounds.
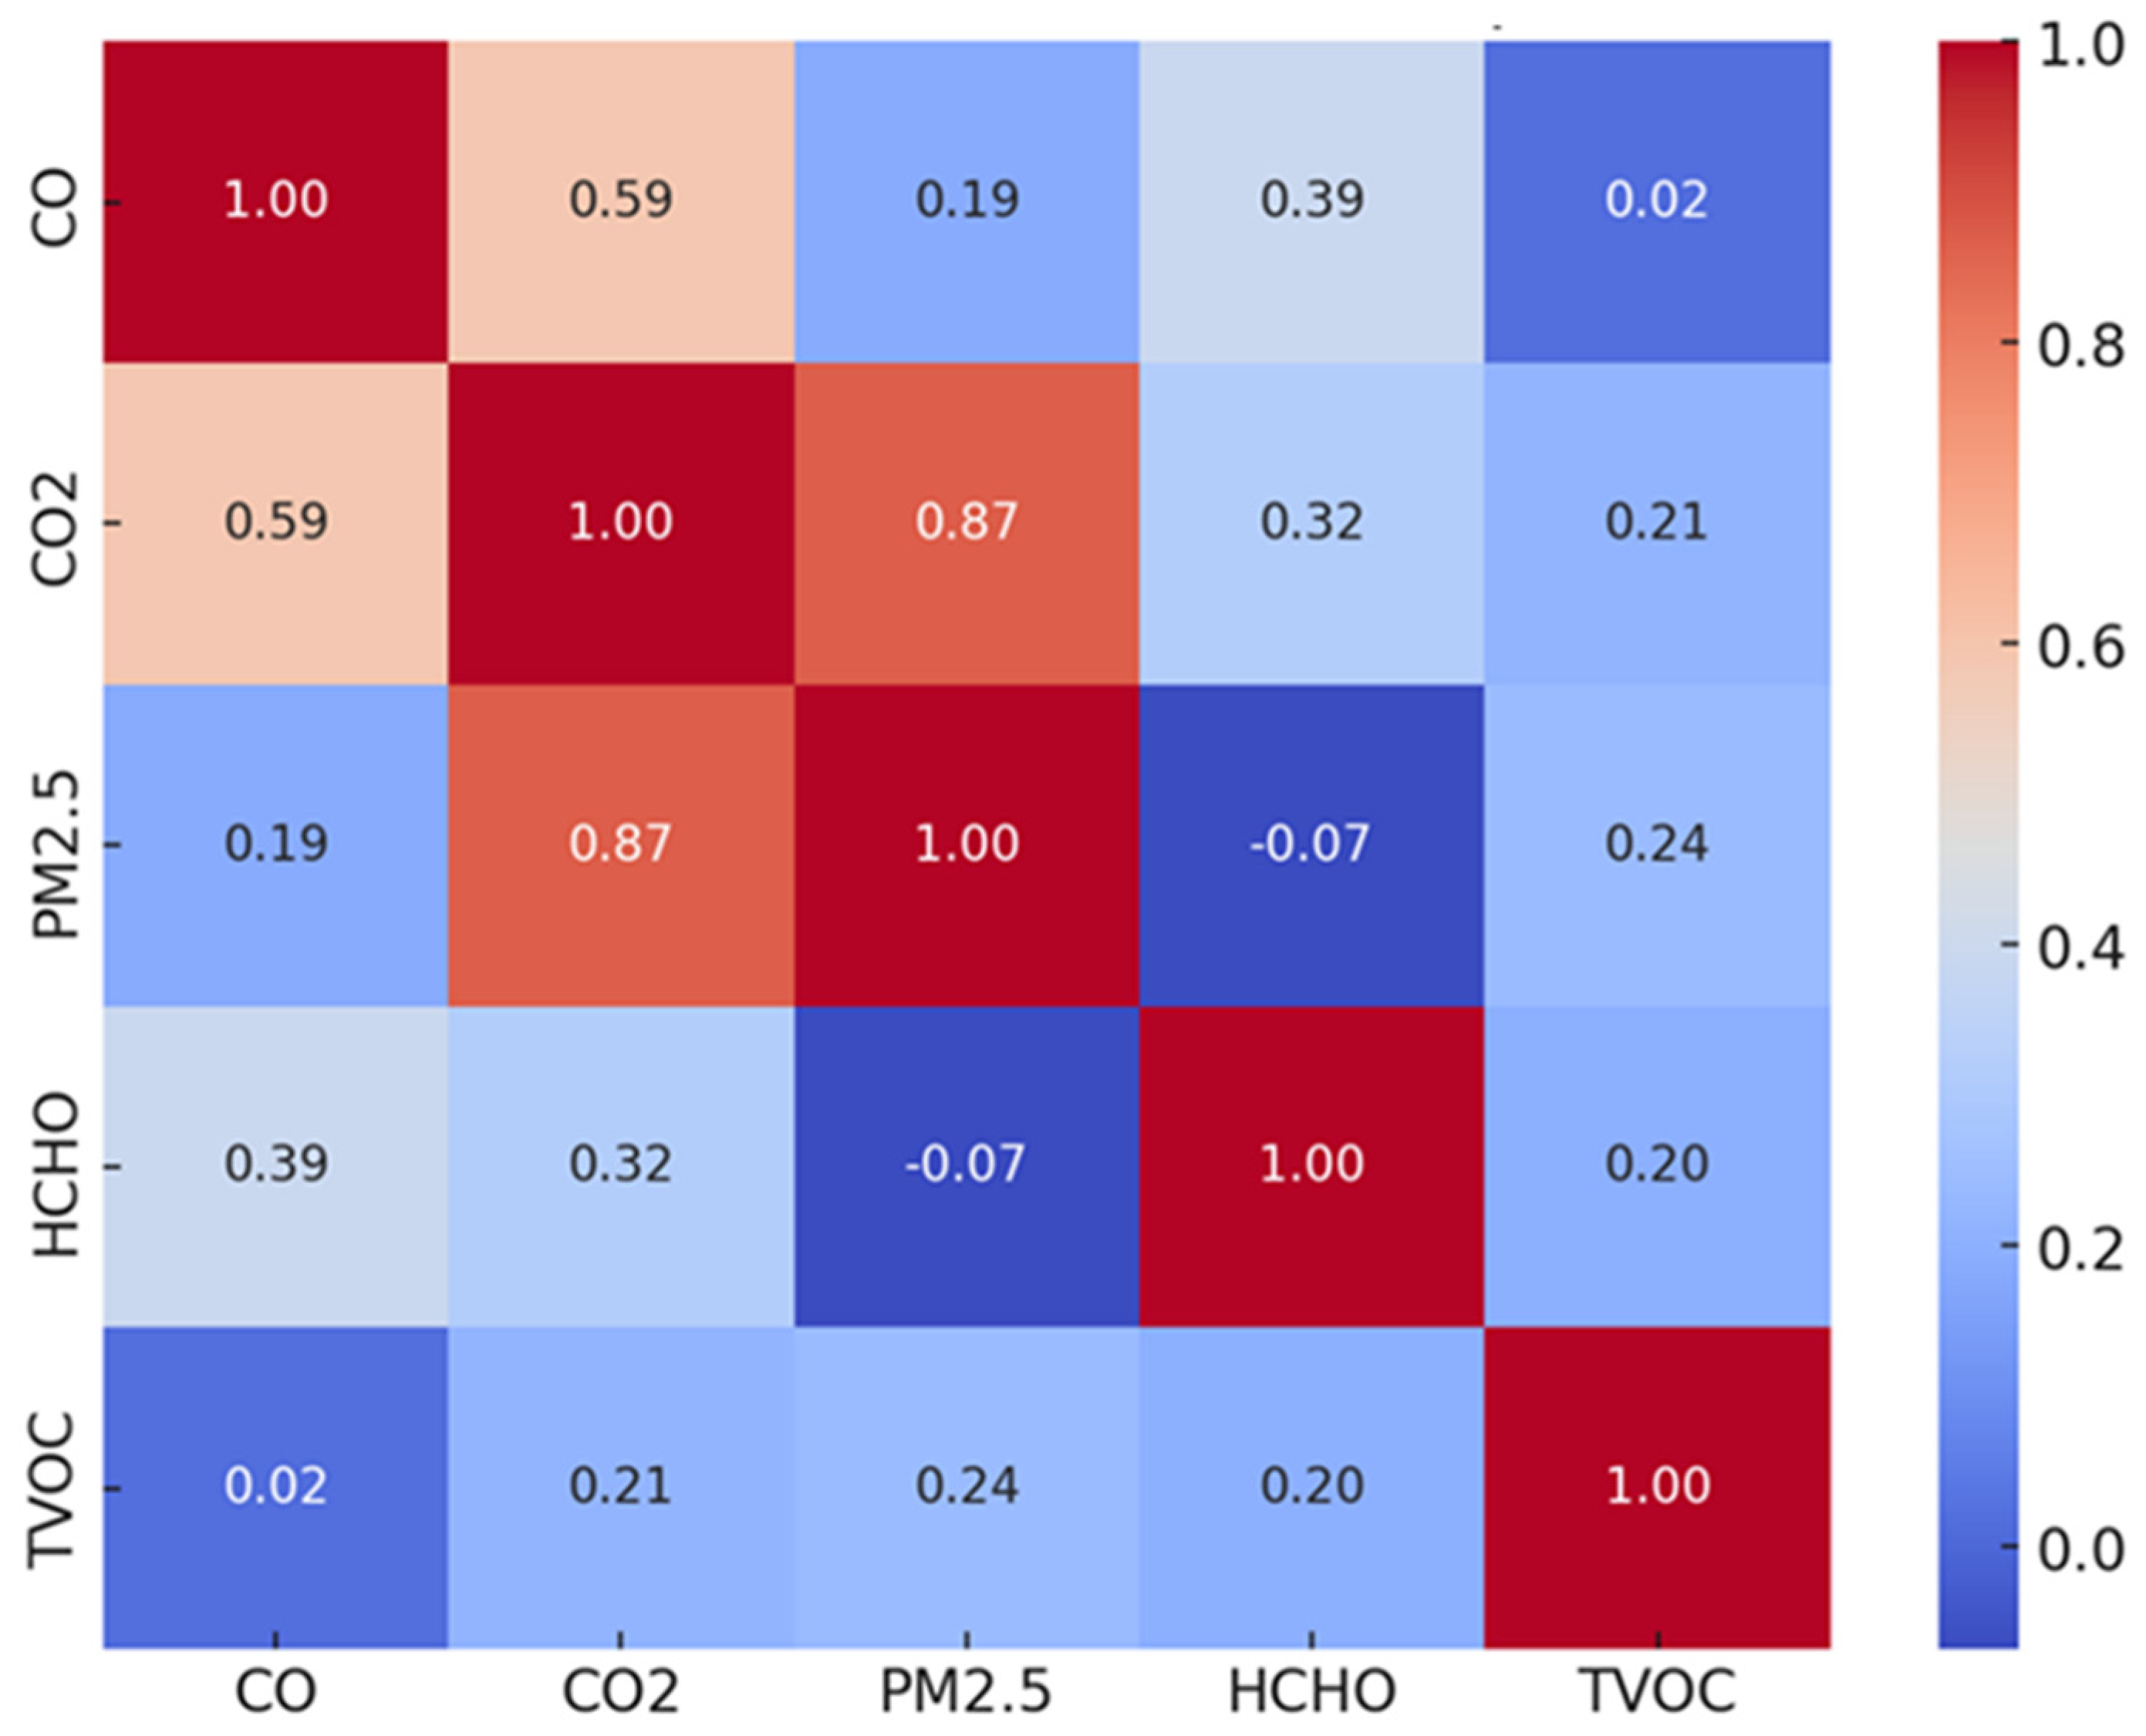
4.6. Dynamics of Air Pollutants
Indoor air quality has emerged as a critical concern in closed buildings, including supermarkets and malls, due to the increasing amount of time people spend within these environments. Adverse IAQ can have significant implications for human health and well-being. The measurements conducted in this study during the sampling period revealed that the concentration averages of CO, CO2, and PM were within the national standards, indicating an acceptable level of air quality in these categories. However, it is crucial to address the issue of elevated concentrations of TVOCs and HCHO. These two compounds exceeded the recommended limits, raising concerns about potential health risks for both visitors and employees in the indoor market. To gain more insight into the study outcomes, a Pearson correlation heatmap was performed. The results are shown in Figure 11. The analysis highlights that CO and PM2.5 exhibit a strong positive correlation (r = 0.81), suggesting they likely originate from common sources, most probably combustion-related activities such as vehicle exhaust and cooking or heating systems. Similarly, the moderate correlation between CO and CO2 (r = 0.57) reinforces this interpretation, as both gases are typically associated with incomplete and complete combustion processes, respectively. CO2 and PM2.5 also show a moderate correlation (r = 0.45), hinting at possible shared emission sources, though the relationship is weaker compared to that of CO and PM2.5, indicating that while there may be joint contributors, some independent sources may also influence PM2.5 levels. Conversely, the weak negative correlation between TVOCs and PM2.5 (r = −0.37) suggests that these pollutants may stem from distinct sources. For instance, while PM2.5 is often linked to combustion and mechanical processes, TVOCs are typically emitted from indoor sources like cleaning products, furnishings, adhesives, and building materials. Moreover, HCHO shows no strong correlation with any other parameter, underlining its likely independent emission behavior. This is particularly important in section P, where the data suggest that HCHO levels do not align with the patterns of other pollutants. This notable lack of correlation indicates a unique source of HCHO, independent from combustion or particulate-generating activities.

Figure 11.
Pearson correlation heatmap of the tested paraments.
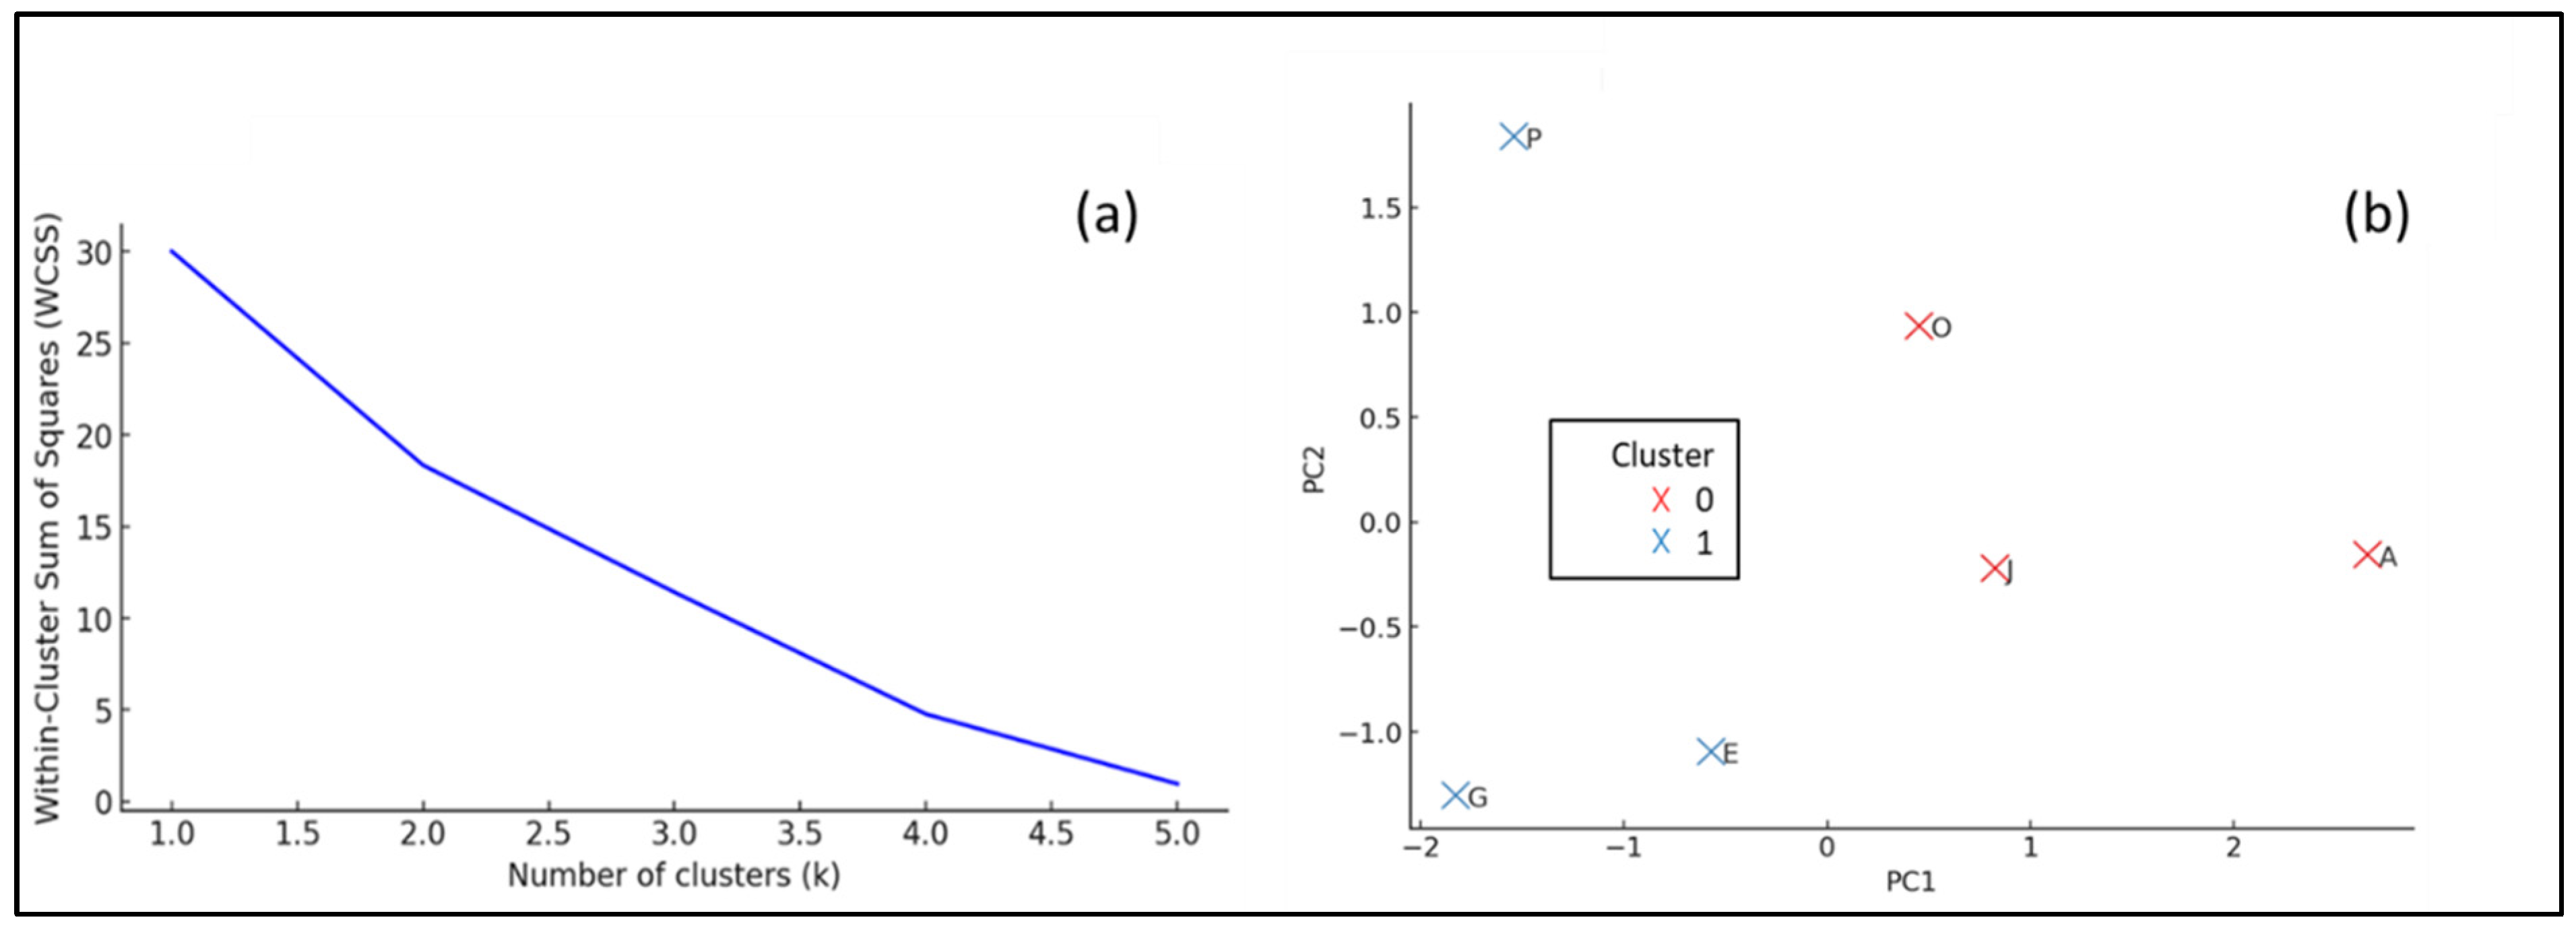
To distinguish the sections of the mall, the elbow method was implemented. An elbow plot helps to identify an optimal number of clusters based on the total Within-Cluster Sum of Squares (WCSSs). The optimal choice is typically where the slope changes significantly (“elbow”), as shown in Figure 12a. Here, the optimal number of clusters appears to be two, indicating two primary groups of sections based on air quality characteristics. In Figure 12b, the plot visualizes the K-Means clustering result on Principal Component Analysis (PCA) components, in which sections grouped in cluster 0 and cluster 1 differ distinctly in air pollutant profiles. This helps mall management rapidly identify areas with similar issues, making it easier to manage air quality interventions effectively. Furthermore, the PCA analysis clearly distinguishes cluster 1 (sections E, G, P), indicating a higher combined air pollution impact, while cluster 0 (sections A, J, O) is characterized by relatively cleaner air profiles. Section P stands out due to significant variance, mostly attributed to high HCHO levels. It is highly recommended to monitor combustion-related activities in sections E, G, and P, as indicated by the correlations, and to investigate sources of HCHO in section P, potentially from construction materials or furnishings. Targeted air purification or ventilation improvements should also be prioritized based on identified clusters and pollutant characteristics.
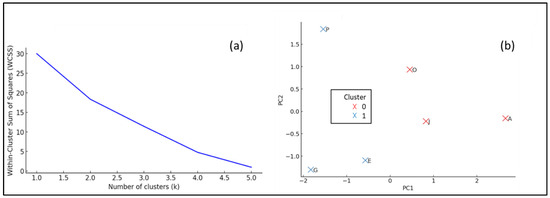
Figure 12.
Cluster analysis of the building’s sections. (a) Elbow method for optimal cluster number. (b) K-Means clustering on PCA components.
The findings highlight the need for effective ventilation systems and regular monitoring programs to ensure the health and well-being of the occupants. To improve IAQ, stakeholders, including building owners, designers, and facility managers, should implement strategies such as proper ventilation, source control, and regular maintenance of ventilation systems. Additionally, the use of low-emission materials, adequate air filtration, and effective cleaning practices can contribute to reducing the levels of harmful chemicals in the indoor environment. Numerous studies [66,67,68,69] have investigated the sources, impacts, and mitigation strategies associated with indoor air pollutants in both residential and commercial environments. These works provide valuable insights into pollutant behavior, the effectiveness of various control measures, and the evolving challenges related to building design, ventilation systems, and occupant health. As well, studies have highlighted the necessity for well-structured mitigation strategies to reduce health and environmental risks associated with poor IAQ [70,71], which has been linked to increased incidences of asthma, allergies, and other respiratory illnesses, particularly in vulnerable populations such as children and the elderly. Ensuring that ventilation systems operate efficiently and maintaining appropriate air exchange rates is a fundamental recommendation to mitigate these risks. A key takeaway from this body of work is the pressing need to establish comprehensive and enforceable IAQ regulations. Such policies should account for all contaminant types and sources, enabling a more unified and effective approach to IAQ management. Humidity is another critical factor influencing IAQ. Excessive indoor humidity creates a favorable environment for the proliferation of mold, bacteria, and dust mites, all of which can compromise respiratory health. Analytical investigations into the relationship between humidity and health outcomes consistently show a positive correlation between high relative humidity and the presence of microbial contaminants. Maintaining optimal humidity levels, typically between 40 and 60 percent, and ensuring regular maintenance of heating, ventilation, and air conditioning systems are strongly recommended practices to mitigate such microbial risks. Office environments have also been the focus of IAQ assessments, particularly in Europe, where researchers have conducted cross-sectional studies to evaluate the impact of air quality on worker productivity and well-being. These studies have consistently found that elevated levels of volatile organic compounds and carbon dioxide impair not only health but also job performance, including concentration and decision-making. Enhanced mechanical ventilation, emission source controls, and continuous indoor air monitoring were among the key solutions proposed to address these challenges in the workplace setting. In addition, experimental laboratory research has further advanced the understanding of how specific IAQ parameters affect human performance. For instance, exposure to high concentrations of CO2 in enclosed environments has been shown to significantly reduce cognitive function and induce symptoms such as fatigue, headaches, and shortness of breath. These findings underscore the importance of managing indoor CO2 levels through both increased ventilation and intelligent temperature control strategies. Moreover, considering ongoing climate change, emerging studies have explored the compounded effects of changing outdoor conditions on IAQ. As higher ambient temperatures and altered precipitation patterns impact building ventilation dynamics, indoor spaces may become increasingly susceptible to the build-up of pollutants. Modeling and scenario analyses suggest that climate change could worsen IAQ by reducing opportunities for natural ventilation, particularly in regions where energy conservation measures lead to tightly sealed buildings. Consequently, adaptive building design strategies that integrate flexible ventilation systems, pollutant source management, and real-time air quality monitoring are now being emphasized as crucial components of climate-resilient IAQ management. Innovative technologies such as ultraviolet C irradiation integrated into heating, ventilation, and air conditioning systems have emerged as promising tools for airborne pathogen mitigation. Experimental studies involving HVAC system modifications demonstrated that ultraviolet C modules effectively deactivate pathogens, enabling energy-efficient air recirculation. These findings support the use of ultraviolet C germicidal irradiation in heating, ventilation, and air conditioning systems along with optimized air distribution to balance energy efficiency and airborne disease mitigation. Integrated systems design approaches have also been advocated, based on comprehensive literature reviews from a systems design perspective, which classify engineering controls for IAQ into air treatment technologies, air dissemination strategies, and information technology systems. The adoption of these integrated approaches is recommended to enhance IAQ effectively and sustainably across diverse indoor environments such as those found in the Tabuk mall.
5. Conclusions
This study aimed to provide a comprehensive assessment of IAQ within a commercial indoor market environment in Tabuk, KSA, focusing on identifying the key pollutants and their spatial distribution within the facility. By evaluating pollutant levels such as CO, CO2, PM2.5, VOCs, and HCHO at key points in the facility, the research offered critical insights into the dynamics of indoor air pollutants and their potential sources. The overarching goal of this investigation is to support better air quality management practices in the Tabuk mall as well as in similar indoor commercial buildings. It is important to clarify that this investigation did not include direct measurement or collection of health-related data from occupants, such as clinical symptoms or physiological biomarkers. Therefore, while the study explores pollutant concentrations relative to established national IAQ standards, any discussion of health implications is based on pollutant thresholds known from the literature rather than from empirical health outcomes observed in the studied environment. Throughout the monitoring period, concentrations of CO, CO2, and PM2.5 generally remained within permissible limits defined by local and international guidelines. However, elevated concentrations of VOCs and HCHO were recorded, particularly in certain sections of the mall, which signals potential concerns that merit attention. These findings underscore that compliance with aggregate IAQ standards alone may not fully represent the indoor environment’s quality, since some specific contaminants can exceed safe thresholds and thus require targeted mitigation.
Consequently, this highlights the necessity for comprehensive pollutant profiling rather than relying solely on generalized standards. A detailed statistical examination revealed important relationships among the measured pollutants. The strong positive correlations between CO and PM2.5 and between CO and CO2 in this investigation suggest that combustion-related activities such as cooking, heating systems, or vehicular emissions near mall entrances are major contributors to indoor pollution in this setting. These correlations are consistent with findings reported in similar commercial indoor environments elsewhere. Specifically, VOCs and HCHO exhibited distinct behaviors: VOCs showed a negative correlation with PM2.5 and no significant correlation with HCHO. This pattern suggests that the sources of these two pollutants are largely independent. Notably, HCHO concentrations peaked in section P, indicating that this pollutant’s source is likely tied to off-gassing from building materials, furnishings, or other interior finishes rather than combustion activities. Meanwhile, spatial analysis using clustering methods such as the elbow method and K-Means clustering successfully classified the mall’s sections into two pollutant profile clusters. Cluster 1, which included sections E, G, and P, showed notably poorer air quality characterized by higher levels of combustion-related pollutants and HCHO. Conversely, Cluster 0, comprising sections A, J, and O, demonstrated relatively better air quality. This spatial differentiation is significant because it enables facility managers to implement strategies that rely on location-specific interventions to optimize resource allocation and improve the effectiveness of air quality management.
Given these findings, it is recommended that mall management and building stakeholders prioritize the development and implementation of comprehensive IAQ strategies tailored to the unique pollution profiles observed. Specific actions could include enhancing ventilation systems to increase air exchange rates, which can help reduce concentrations of combustion-related pollutants and improve overall air freshness. Furthermore, HCHO emissions call for focused mitigation efforts such as selecting low-emission building materials and furnishings and regular maintenance of HVAC systems to reduce the accumulation of such pollutants. The study also suggests the integration of frequent and continuous air quality monitoring employing real-time sensors to detect pollutant spikes and guide responsive interventions. This proactive approach would help maintain indoor environments within recommended safety thresholds and prevent prolonged occupant exposure to elevated pollutant levels. Additionally, employing air filtration technologies, particularly those targeting VOCs and HCHO, could further enhance air quality.
Finally, the limitations of this study should be acknowledged. Without direct health impact data, the conclusions regarding occupant health implications are necessarily cautious and based on pollutant concentrations relative to recognized health guidelines. Future research could incorporate epidemiological or clinical assessments to directly evaluate how indoor pollutant levels influence health outcomes among occupants in commercial buildings. Such studies would provide stronger evidence linking IAQ parameters with health and productivity metrics, thereby supporting more informed policymaking and facility management practices. Nonetheless, even without these data, this study’s approach provides a valuable baseline for future longitudinal studies examining seasonal variations, the impact of occupancy patterns, and the effectiveness of implemented air quality interventions. Expanding the scope to multiple commercial environments and different geographic regions could also enhance the generalizability of findings and contribute to the development of region-specific IAQ standards and guidelines. Overall, this study delivers essential insights into indoor pollutant profiles within a supermarket setting, identifies probable pollutant sources, and highlights the spatial variability of air quality within the facility. These results demonstrate the critical need for tailored, pollutant-specific IAQ management strategies beyond generalized standards to safeguard occupant well-being and comfort. By prioritizing continuous monitoring, improving ventilation, adopting low-emission materials, and targeting pollutant sources, facility managers can substantially improve IAQ, thereby fostering healthier and more sustainable commercial indoor environments.
Author Contributions
Conceptualization, W.S.A.-R. and A.L.; Methodology, A.L.; Software, W.S.A.-R. and A.L.; Validation, W.S.A.-R. and A.L.; Formal analysis, W.S.A.-R. and A.L.; Investigation, W.S.A.-R. and A.L.; Resources, A.L.; Data curation, W.S.A.-R. and A.L.; Writing—original draft, W.S.A.-R. and A.L.; Writing—review & editing, W.S.A.-R. and A.L.; Visualization, W.S.A.-R.; Supervision, W.S.A.-R.; Project administration, W.S.A.-R. All authors have read and agreed to the published version of the manuscript.
Funding
This research received no external funding.
Institutional Review Board Statement
Not applicable.
Informed Consent Statement
Not applicable.
Data Availability Statement
The original contributions presented in this study are included in the article. Further inquiries can be directed to the corresponding author.
Conflicts of Interest
The authors declare no conflict of interest.
References
- Kinney, P.L. Interactions of climate change, air pollution, and human health. Curr. Environ. Health Rep. 2018, 5, 179–186. [Google Scholar] [CrossRef] [PubMed]
- Reinmuth-Selzle, K.; Kampf, C.J.; Lucas, K.; Lang-Yona, N.; Fröhlich-Nowoisky, J.; Shiraiwa, M.; Lakey, P.S.; Lai, S.; Liu, F.; Kunert, A.T.; et al. Air pollution and climate change effects on allergies in the anthropocene: Abundance, interaction, and modification of allergens and adjuvants. Environ. Sci. Technol. 2017, 51, 4119–4141. [Google Scholar] [CrossRef] [PubMed]
- Höök, M.; Tang, X. Depletion of fossil fuels and anthropogenic climate change—A review. Energy Policy 2013, 52, 797–809. [Google Scholar] [CrossRef]
- Walters, R. Toxic atmospheres air pollution, trade and the politics of regulation. In Transnational Environmental Crime; Routledge: London, UK, 2017; pp. 321–338. [Google Scholar]
- Arbex, M.A.; Santos, U.D.P.; Martins, L.C.; Saldiva, P.H.N.; Pereira, L.A.A.; Braga, A.L.F. Air pollution and the respiratory system. J. Bras. Pneumol. 2012, 38, 643–655. [Google Scholar] [CrossRef]
- Saud, B.; Paudel, G. The threat of ambient air pollution in Kathmandu, Nepal. J. Environ. Public Health 2018, 2018, 04591. [Google Scholar] [CrossRef]
- World Health Organization. Air Quality Guidelines: Global Update 2005: Particulate Matter, Ozone, Nitrogen Dioxide, and Sulfur Dioxide; World Health Organization: Geneva, Switzerland, 2006. [Google Scholar]
- Zhang, K.; Batterman, S. Air pollution and health risks due to vehicle traffic. Sci. Total Environ. 2013, 450, 307–316. [Google Scholar] [CrossRef] [PubMed]
- Wang, J.; Wu, Q.; Liu, J.; Yang, H.; Yin, M.; Chen, S.; Guo, P.; Ren, J.; Luo, X.; Linghu, W.; et al. Vehicle emission and atmospheric pollution in China: Problems, progress, and prospects. PeerJ 2019, 7, e6932. [Google Scholar] [CrossRef]
- Badami, M.G. Transport and urban air pollution in India. Environ. Manag. 2005, 36, 195–204. [Google Scholar] [CrossRef]
- He, K.; Huo, H.; Zhang, Q. Urban air pollution in China: Current status, characteristics, and progress. Annu. Rev. Environ. Resour. 2002, 27, 397–431. [Google Scholar] [CrossRef]
- Brook, R.D.; Rajagopalan, S. Particulate matter air pollution and atherosclerosis. Curr. Atheroscler. Rep. 2010, 12, 291–300. [Google Scholar] [CrossRef]
- Peng, R.D.; Chang, H.H.; Bell, M.L.; McDermott, A.; Zeger, S.L.; Samet, J.M.; Dominici, F. Coarse particulate matter air pollution and hospital admissions for cardiovascular and respiratory diseases among Medicare patients. JAMA 2008, 299, 2172–2179. [Google Scholar] [CrossRef] [PubMed]
- Davidson, C.I.; Phalen, R.F.; Solomon, P.A. Airborne particulate matter and human health: A review. Aerosol Sci. Technol. 2005, 39, 737–749. [Google Scholar] [CrossRef]
- Kim, K.H.; Jahan, S.A.; Kabir, E.; Brown, R.J. A review of airborne polycyclic aromatic hydrocarbons (PAHs) and their human health effects. Environ. Int. 2013, 60, 71–80. [Google Scholar] [CrossRef]
- Abdel-Shafy, H.I.; Mansour, M.S. A review on polycyclic aromatic hydrocarbons: Source, environmental impact, effect on human health and remediation. Egypt. J. Pet. 2016, 25, 107–123. [Google Scholar] [CrossRef]
- Santijitpakdee, T.; Hongsibsong, S.; Boonyapranai, K.; Kulprachakarn, K.; Parklak, W.; Ounjaijean, S.; Kawichai, S. Polycyclic Aromatic Hydrocarbons (PAHs) in Household Dusts: Distribution, Sources, and Health Risk Assessment from Rural Areas in Chiang Mai Province, Thailand. Buildings 2025, 15, 1855. [Google Scholar] [CrossRef]
- Arif, I.; Adams, M.D.; Johnson, M.T. A meta-analysis of the carcinogenic effects of particulate matter and polycyclic aromatic hydrocarbons. Environ. Pollut. 2024, 351, 123941. [Google Scholar] [CrossRef]
- Lee, Y.K.; Lee, J.H.; Beak, N.G.; Kim, K.C.; Han, J.S. Seasonal and emission characteristics of PAHs in the ambient air of industrial complexes. Atmosphere 2023, 15, 30. [Google Scholar] [CrossRef]
- Zhang, X.; Li, Z. Investigating industrial PAH air pollution in relation to population exposure in major countries: A scoring approach. J. Environ. Manag. 2023, 338, 117801. [Google Scholar] [CrossRef]
- Tran, H.M.; Tsai, F.J.; Lee, Y.L.; Chang, J.H.; Chang, L.T.; Chang, T.Y.; Chung, K.F.; Kuo, H.P.; Lee, K.Y.; Chuang, K.J.; et al. The impact of air pollution on respiratory diseases in an era of climate change: A review of the current evidence. Sci. Total Environ. 2023, 898, 166340. [Google Scholar] [CrossRef]
- Lu, C.W.; Fu, J.; Liu, X.F.; Chen, W.W.; Hao, J.L.; Li, X.L.; Pant, O.P. Air pollution and meteorological conditions significantly contribute to the worsening of allergic conjunctivitis: A regional 20-city, 5-year study in Northeast China. Light Sci. Appl. 2021, 10, 190. [Google Scholar] [CrossRef]
- Henning, R.J. Particulate Matter Air Pollution is a Significant Risk Factor for Cardiovascular Disease. Curr. Probl. Cardiol. 2024, 49 Pt B, 102094. [Google Scholar] [CrossRef]
- Rosário Filho, N.A.; Urrutia-Pereira, M.; d’Amato, G.; Cecchi, L.; Ansotegui, I.J.; Galán, C.; Pomés, A.; Murrieta-Aguttes, M.; Caraballo, L.; Rouadi, P.; et al. Air pollution and indoor settings. World Allergy Organ. J. 2021, 14, 100499. [Google Scholar] [CrossRef] [PubMed]
- Schraufnagel, D.E.; Balmes, J.R.; Cowl, C.T.; De Matteis, S.; Jung, S.H.; Mortimer, K.; Perez-Padilla, R.; Rice, M.B.; Riojas-Rodriguez, H.; Sood, A.; et al. Air Pollution and Noncommunicable Diseases: A Review by the Forum of International Respiratory Societies’ Environmental Committee, Part 1: The Damaging Effects of Air Pollution. Chest 2019, 155, 409–416. [Google Scholar] [CrossRef]
- Ghaffarianhoseini, A.; AlWaer, H.; Omrany, H.; Ghaffarianhoseini, A.; Alalouch, C.; Clements-Croome, D.; Tookey, J. Sick building syndrome: Are we doing enough? Archit. Sci. Rev. 2018, 61, 99–121. [Google Scholar] [CrossRef]
- Mastrucci, A.; van Ruijven, B.; Byers, E.; Poblete-Cazenave, M.; Pachauri, S. Global scenarios of residential heating and cooling energy demand and CO2 emissions. Clim. Change 2021, 168, 1–26. [Google Scholar] [CrossRef]
- Liu, Z.; Jiang, G. Optimization of intelligent heating ventilation air conditioning system in urban building based on BIM and artificial intelligence technology. Comput. Sci. Inf. Syst. 2021, 18, 1379–1394. [Google Scholar] [CrossRef]
- Asim, N.; Badiei, M.; Mohammad, M.; Razali, H.; Rajabi, A.; Chin Haw, L.; Jameelah Ghazali, M. Sustainability of heating, ventilation and air-conditioning (HVAC) systems in buildings—An overview. Int. J. Environ. Res. Public Health 2022, 19, 1016. [Google Scholar] [CrossRef] [PubMed]
- Wargocki, P.; Wyon, D.P.; Baik, Y.K.; Clausen, G.; Fanger, P.O. Perceived air quality, sick building syndrome (SBS) symptoms and productivity in an office with two different pollution loads. Indoor Air 1999, 9, 165–179. [Google Scholar] [CrossRef] [PubMed]
- Nordström, K.; Norbäck, D.; Akselsson, R. Influence of indoor air quality and personal factors on the sick building syndrome (SBS) in Swedish geriatric hospitals. Occup. Environ. Med. 1995, 52, 170–176. [Google Scholar] [CrossRef]
- Sarkhosh, M.; Najafpoor, A.A.; Alidadi, H.; Shamsara, J.; Amiri, H.; Andrea, T.; Kariminejad, F. Indoor Air Quality associations with sick building syndrome: An application of decision tree technology. Build. Environ. 2021, 188, 107446. [Google Scholar] [CrossRef]
- Al-Thani, H.G.; Isaifan, R.J. Policies and Regulations for Sustainable Clean Air: A Comprehensive Overview. In Sustainable Strategies for Air Pollution Mitigation; Springer: Cham Switzerland, 2024; pp. 409–437. [Google Scholar]
- Liu, Y.; Wu, J.; Yi, H.; Wen, J. Under what conditions do governments collaborate? A qualitative comparative analysis of air pollution control in China. Public Manag. Rev. 2021, 23, 1664–1682. [Google Scholar] [CrossRef]
- Kwilinski, A.; Lyulyov, O.; Pimonenko, T. Reducing transport sector CO2 emissions patterns: Environmental technologies and renewable energy. J. Open Innov. Technol. Mark. Complex. 2024, 10, 100217. [Google Scholar] [CrossRef]
- Dai, J.; Alvarado, R.; Ali, S.; Ahmed, Z.; Meo, M.S. Transport infrastructure, economic growth, and transport CO2 emissions nexus: Does green energy consumption in the transport sector matter? Environ. Sci. Pollut. Res. 2023, 30, 40094–40106. [Google Scholar] [CrossRef] [PubMed]
- Lu, J.; Li, B.; Li, H.; Al-Barakani, A. Expansion of city scale, traffic modes, traffic congestion, and air pollution. Cities 2021, 108, 102974. [Google Scholar] [CrossRef]
- Nieuwenhuijsen, M.J. New urban models for more sustainable, liveable and healthier cities post COVID-19; Reducing air pollution, noise and heat island effects and increasing green space and physical activity. Environ. Int. 2021, 157, 106850. [Google Scholar] [CrossRef] [PubMed]
- Mouratidis, K. Urban planning and quality of life: A review of pathways linking the built environment to subjective well-being. Cities 2021, 115, 103229. [Google Scholar] [CrossRef]
- Teh, K.J.L.; Razali, H.; Lim, C.H. Field Investigation of Thermal Comfort and Indoor Air Quality Analysis Using a Multi-Zone Approach in a Tropical Hypermarket. Buildings 2025, 15, 1677. [Google Scholar] [CrossRef]
- Baptista, T.; Almeida-Silva, M.; Silva, D.; Diogo, C.; Canha, N. Indoor Air Quality Assessment in Grocery Stores. Appl. Sci. 2022, 12, 12940. [Google Scholar] [CrossRef]
- Naidoo, M.; Gasparatos, A. Consumer worldviews and perspectives on environmental sustainability initiatives in the South African supermarket sector. J. Clean. Prod. 2023, 413, 137496. [Google Scholar] [CrossRef]
- Seo, S.H.; Jung, K.S.; Park, M.K.; Kwon, H.O.; Choi, S.D. Indoor air pollution of polycyclic aromatic hydrocarbons emitted by computers. Build. Environ. 2022, 218, 109107. [Google Scholar] [CrossRef]
- Nga, L.P.; Tam, P.T. Managerial recommendations for enhancing green consumption behavior and sustainable consumption. Emerg. Sci. J. 2024, 8, 2245–2266. [Google Scholar] [CrossRef]
- Pongpunpurt, P.; Chawaloesphonsiya, N.; Poyai, T.; Guiraud, P.; Tiruta-Barna, L.; Rungsithong, R.; Leknoi, U.; Janjaroen, D.; Painmanakul, P. Exploring the circular business model for sustainable plastic waste management in shopping malls: Challenges, opportunities, and impacts in Thailand. Case Stud. Chem. Environ. Eng. 2024, 10, 100872. [Google Scholar] [CrossRef]
- Robert, L.; Guichard, R.; Klingler, J.; Cochet, V.; Mandin, C. Indoor air quality in shopping and storage areas. Indoor Air 2021, 31, 1238–1251. [Google Scholar] [CrossRef]
- Furst, L.; Cipoli, Y.; Galindo, N.; Yubero, E.; Viegas, C.; Pena, P.; Nunes, T.; Feliciano, M.; Alves, C. Comprehensive analysis of particulate matter, gaseous pollutants, and microbiological contamination in an international chain supermarket. Environ. Pollut. 2024, 363, 125236. [Google Scholar] [CrossRef] [PubMed]
- D’Agostino, D.; Minelli, F.; Minichiello, F.; Musella, M. Improving the indoor air quality of office buildings in the post-pandemic era—Impact on energy consumption and costs. Energies 2024, 17, 855. [Google Scholar] [CrossRef]
- Kumari, S.; Jain, M.K. A critical review on air quality index. In Environmental Pollution: Select Proceedings of ICWEES-2016; Springer: Singapore, 2018; pp. 87–102. [Google Scholar]
- Mendell, M.J.; Chen, W.; Ranasinghe, D.R.; Castorina, R.; Kumagai, K. Carbon dioxide guidelines for indoor air quality: A review. J. Expo. Sci. Environ. Epidemiol. 2024, 34, 555–569. [Google Scholar] [CrossRef]
- Omeokachie, D.N.; Ana, G.R.; Laniyan, T.A.; Olawade, D.B.; Abaire, O.J.; Esan, D.T. Sanitary conditions, waste management, safety measures and sources of air pollution associated with shopping malls in Nigeria’s largest city. Public Health Pract. 2023, 5, 100376. [Google Scholar] [CrossRef]
- Bogdanovica, S.; Zemitis, J.; Bogdanovics, R. The effect of CO2 concentration on children’s well-being during the process of learning. Energies 2020, 13, 6099. [Google Scholar] [CrossRef]
- Othman, M.; Latif, M.T.; Yee, C.Z.; Norshariffudin, L.K.; Azhari, A.; Halim, N.D.A.; Alias, A.; Sofwan, N.M.; Abd Hamid, H.H.; Matsumi, Y. PM2. 5 and ozone in office environments and their potential impact on human health. Ecotoxicol. Environ. Saf. 2020, 194, 110432. [Google Scholar] [CrossRef]
- Lei, T.M.; Chan, Y.W.; Nadzir, M.S.M. Monitoring PM2. 5 at a Large Shopping Mall: A Case Study in Macao. Processes 2023, 11, 914. [Google Scholar] [CrossRef]
- Liu, S.; Song, R.; Zhang, T.T. Residential building ventilation in situations with outdoor PM2.5 pollution. Build. Environ. 2021, 202, 108040. [Google Scholar] [CrossRef]
- Gilbert, N.L.; Gauvin, D.; Guay, M.; Héroux, M.È.; Dupuis, G.; Legris, M.; Chan, C.C.; Dietz, R.N.; Lévesque, B. Housing characteristics and indoor concentrations of nitrogen dioxide and formaldehyde in Quebec City, Canada. Environ. Res. 2006, 102, 1–8. [Google Scholar] [CrossRef] [PubMed]
- Nielsen, G.D.; Larsen, S.T.; Wolkoff, P. Re-evaluation of the WHO (2010) formaldehyde indoor air quality guideline for cancer risk assessment. Arch. Toxicol. 2017, 91, 35–61. [Google Scholar] [CrossRef] [PubMed]
- World Health Organization. WHO Global Air Quality Guidelines, Articulate Matter (PM2.5 and PM10), Ozone, Nitrogen Dioxide, Sulfur Dioxide and Carbon Monoxide; Executive Summary; World Health Organization: Geneva, Switzerland, 2021. [Google Scholar]
- Tong, X.; Wang, B.; Dai, W.T.; Cao, J.J.; Ho, S.S.H.; Kwok, T.C.; Lui, K.H.; Lo, C.M.; Ho, K.F. Indoor air pollutant exposure and determinant factors controlling household air quality for elderly people in Hong Kong. Air Qual. Atmos. Health 2018, 11, 695–704. [Google Scholar] [CrossRef]
- Rovira, J.; Roig, N.; Nadal, M.; Schuhmacher, M.; Domingo, J.L. Human health risks of formaldehyde indoor levels: An issue of concern. J. Environ. Sci. Health Part A 2016, 51, 357–363. [Google Scholar] [CrossRef]
- Kotzias, D. Built environment and indoor air quality: The case of volatile organic compounds. AIMS Environ. Sci. 2021, 8, 135–147. [Google Scholar] [CrossRef]
- Bayati, M.; Vu, D.C.; Vo, P.H.; Rogers, E.; Park, J.; Ho, T.L.; Davis, A.N.; Gulseven, Z.; Carlo, G.; Palermo, F.; et al. Health risk assessment of volatile organic compounds at daycare facilities. Indoor Air 2021, 31, 977–988. [Google Scholar] [CrossRef]
- Wickliffe, J.K.; Stock, T.H.; Howard, J.L.; Frahm, E.; Simon-Friedt, B.R.; Montgomery, K.; Wilson, M.J.; Lichtveld, M.Y.; Harville, E. Increased long-term health risks attributable to select volatile organic compounds in residential indoor air in southeast Louisiana. Sci. Rep. 2020, 10, 21649. [Google Scholar] [CrossRef]
- Kim, J.; Shim, I.K.; Won, S.R.; Hwang, E.S.; Lee, Y.; Park, S.; Ryu, J.; Lee, J. Indoor air quality and its determinants in underground shopping malls in Korea. Environ. Int. 2024, 183, 108395. [Google Scholar] [CrossRef]
- Piasecki, M.; Kostyrko, K.B.; Goljan, A. The ability to control VOC emissions from multilayer building materials. Appl. Sci. 2021, 11, 4806. [Google Scholar] [CrossRef]
- Mannan, M.; Al-Ghamdi, S.G. Indoor air quality in buildings: A comprehensive review on the factors influencing air pollution in residential and commercial structure. Int. J. Environ. Res. Public Health 2021, 18, 3276. [Google Scholar] [CrossRef] [PubMed]
- Vardoulakis, S.; Giagloglou, E.; Steinle, S.; Davis, A.; Sleeuwenhoek, A.; Galea, K.S.; Dixon, K.; Crawford, J.O. Indoor exposure to selected air pollutants in the home environment: A systematic review. Int. J. Environ. Res. Public Health 2020, 17, 8972. [Google Scholar] [CrossRef] [PubMed]
- Nandan, A.; Siddiqui, N.A.; Singh, C.; Aeri, A. Occupational and environmental impacts of indoor air pollutant for different occupancy: A review. Toxicol. Environ. Health Sci. 2021, 13, 303–322. [Google Scholar] [CrossRef]
- Widder, S.H.; Haselbach, L. Relationship among concentrations of indoor air contaminants, their sources, and different mitigation strategies on indoor air quality. Sustainability 2017, 9, 1149. [Google Scholar] [CrossRef]
- Essamlali, I.; Nhaila, H.; El Khaili, M. Supervised machine learning approaches for predicting key pollutants and for the sustainable enhancement of urban air quality: A systematic review. Sustainability 2024, 16, 976. [Google Scholar] [CrossRef]
- Rahaman, M.A.; Kalam, A.; Al-Mamun, M. Unplanned urbanization and health risks of Dhaka City in Bangladesh: Uncovering the associations between urban environment and public health. Front. Public Health 2023, 11, 1269362. [Google Scholar] [CrossRef]

Disclaimer/Publisher’s Note: The statements, opinions and data contained in all publications are solely those of the individual author(s) and contributor(s) and not of MDPI and/or the editor(s). MDPI and/or the editor(s) disclaim responsibility for any injury to people or property resulting from any ideas, methods, instructions or products referred to in the content. |
© 2025 by the authors. Licensee MDPI, Basel, Switzerland. This article is an open access article distributed under the terms and conditions of the Creative Commons Attribution (CC BY) license (https://creativecommons.org/licenses/by/4.0/).