Abstract
In 2020, the Chinese government announced the “Dual Carbon” goals, making carbon responsibility the most prominent focus within the Environmental, Social, and Governance (ESG) practices of Chinese firms. This shift creates a new type of ESG-washing, a practice involving the selective disclosure of information that portrays the firm in a favorable light, thereby leading stakeholders to overestimate its ESG performance. In this study, we define a novel type of ESG-washing behavior called “ESG carbonwashing”, in which firms disproportionately highlight their carbon responsibility initiatives while overlooking other dimensions of ESG. By adopting a strategy of excessively emphasizing their carbon-related efforts in ESG activities, these firms mislead stakeholders about their overall ESG performance. Using a sample of 59 high-carbon-emitting firms listed on the Shanghai and Shenzhen A-share markets from 2018 to 2022, we construct a systematic framework to measure the extent of ESG carbonwashing and further analyze its temporal and industry-level variations. Our key findings indicate that: (1) ESG carbonwashing has significantly increased alongside the rollout of the “Dual Carbon” policy; (2) there are significant inter-industry differences, with the steel and aviation sectors exhibiting the highest levels of ESG carbonwashing, while the building materials industry shows the lowest. This study offers valuable guidance for ESG information users in detecting and mitigating carbonwashing practices, while also providing robust empirical support for refining relevant regulatory frameworks.
1. Introduction
In recent years, the intensification of the global climate crisis has elevated carbon emission reduction to a central focus within the sustainable development agenda [1]. Corporate carbon responsibility has increasingly become a pivotal factor in investors’ evaluations of firms’ ESG performance [2,3]. Nevertheless, it is critical to highlight an emerging structural imbalance in market attention across ESG dimensions, which fosters a novel form of ESG-washing behavior. Specifically, some firms excessively emphasize their carbon-related efforts in ESG activities to obscure insufficient engagement with other ESG responsibilities. This strategy can mislead investors into overestimating the firm’s overall ESG performance, leading to a new type of ESG-washing—“ESG carbonwashing” [4]. Research on this emerging form of ESG-washing remains limited, particularly in quantitative terms and in the context of emerging markets.
This study selects the Chinese market as the analytical context. As the world’s second-largest economy and the largest developing country, China officially established its “Dual Carbon” strategy in 2020, with the goal of peaking carbon emissions by 2030 and achieving carbon neutrality by 2060. This initiative has elevated carbon governance to a national strategic priority. Under strong policy impetus, carbon-related issues have become the central focus of ESG practices among Chinese firms. For instance, according to Carbon Disclosure Project (CDP) records, the number of Chinese firms participating in the program has grown exponentially: from 1100 in 2019 to 3651 in 2024, representing a 231.9% increase and a compound annual growth rate of 27.4%. This rapid expansion raises the following research question: Are Chinese firms leveraging carbon disclosure to enhance their overall ESG image, potentially engaging in ESG carbonwashing?
This paper quantifies the extent of ESG carbonwashing by examining the discrepancy between corporate carbon disclosure levels and overall ESG performance. Specifically, we evaluate firms’ carbon information disclosure using content analysis (CD1) and text mining techniques (CD2). Comprehensive ESG performance (ESGP) is subsequently measured via the Huazheng ESG ratings. Specifically, CD1 employs content analysis, evaluating the completeness of corporate carbon disclosures through 4 key domains and 12 structured indicators. CD2 utilizes text mining techniques, measuring carbon topic salience based on the frequency of 47 keywords. Thereafter, by computing the difference between standardized ESG performance and carbon information disclosure metrics, we derive two ESG greenwashing indicators: Carbonwashing1 and Carbonwashing2. Following this, a comparative analysis is conducted from both a temporal and industry perspective. The results show that: (1) In the temporal perspective, after the implementation of the “Dual Carbon” policy (2020–2022), the level of corporate ESG carbonwashing has significantly increased, with the two Carbonwashing measurement indicators, Carbonwashing1 and Carbonwashing2, rising from 2018 to 2023 by 203.6% and 194.2%, respectively. (2) In the industry perspective, the steel industry shows the highest Carbonwashing1 level and the aviation industry the highest Carbonwashing2 level, with their averages 3.43 and 2.36 times higher than the normalized overall sample average, respectively.
The main contributions of this paper are as follows: Firstly, it reveals the evolution of corporate ESG-washing strategies under the pressure of the “Dual Carbon” policy. Existing literature mainly focuses on ESG-washing behaviors targeting overall ESG image, as well as the social, environmental, and other individual aspects [5,6,7]. In contrast, this paper examines a novel type of ESG-washing behavior, specifically through corporate carbon disclosures within the context of extensive discussions on carbon emissions. This analysis effectively extends the research boundaries of ESG-washing. Secondly, we quantify corporate ESG carbonwashing, providing a reference for practitioners. We construct a set of ESG carbonwashing indicators using content and text analysis methods, enriching the related quantitative research on ESG carbonwashing. Thirdly, the paper reveals the current state of ESG “carbon laundering” practices among Chinese firms under the “Dual Carbon” policy, thereby providing a foundation for the development of differentiated ESG regulations in the future. Through a dual analysis from both temporal and industry perspectives, this paper deepens the understanding of ESG carbonwashing practices within Chinese corporations.
The remainder of this paper is organized as follows: Section 2 provides a comprehensive review of the existing literature on the definition, types, and measurement of ESG-washing. In Section 3, we propose the design for measuring ESG carbonwashing. First, we measure the intensity of corporate carbon disclosures using two measurement methods: content analysis and text analysis. Then, we assess corporate ESG performance using third-party ESG ratings. Finally, we calculate two ESG carbonwashing indicators by computing the difference between carbon disclosure intensity and third-party ESG ratings. Section 4 begins with an analysis of the overall situation of ESG carbonwashing, followed by an analysis of the differences in ESG carbonwashing from both a temporal and industry perspective. The final section presents the conclusion and research significance.
2. Literature Review
2.1. Definition and Types of Corporate ESG-Washing
Corporate ESG-washing refers to the practice of selectively disclosing information that benefits the firm in order to influence stakeholders to overestimate the firm’s ESG image [8,9]. ESG-washing can be further subdivided into overall image washing and partial image washing based on the scope it targets.
The broadest scope of corporate ESG-washing is the overall image that includes all ESG issues [10,11,12,13,14] (Some studies use the concept of Corporate Social Responsibility (CSR); therefore, this paper also includes research on CSR-washing within the scope of ESG-washing). Since these washing behaviors lead to a mismatch between corporate ESG performance and disclosures, known as ESG decoupling [15,16], research involving these concepts also falls under the field of washing related to the overall ESG image.
Corporate ESG image can be divided into three parts: environmental image, social image, and governance image. Research on washing behaviors targeting these specific aspects includes: First, washing related to social image is referred to as “bluewashing” [15,16], with further subcategories such as pinkwashing, which involves using LGBTQ+ rights issues to wash the social image [17,18]. Second, deceptive practices concerning corporate environmental image are termed “greenwashing” [8], including symbolic environmental responsibility activities [19,20]. Since these types of washing cause a mismatch between corporate environmental performance and disclosures, known as “environmental decoupling” [4], relevant research can also be included in the field of corporate environmental image washing. Furthermore, the corporate environmental image includes subtopics such as carbon emissions and material recycling. With the increasing prominence of carbon emissions as an issue, some studies have started to focus on corporate washing activities related to carbon emissions, referred to as Carbonwashing, such as studies by In & Schumacher (2021) [4,21,22,23]. Greenhushing, as an emerging manifestation of ESG-washing, has garnered attention in international academia [24]. It addresses the theoretical gap in ESG-washing research regarding the coexistence of “selective silence” and “selective exaggeration” offering a methodological and conceptual complement to the carbonwashing phenomenon proposed in this study. However, these studies primarily focus on the phenomenon and theoretical construction of ESG carbonwashing, without providing quantitative evidence on corporate ESG carbonwashing. This paper aims to conduct a quantitative study on ESG carbonwashing in the Chinese context, attempting to fill this research gap.
2.2. Measurement of Corporate ESG-Washing
Compared to developed economies, firms in emerging markets are more inclined to achieve ESG decoupling through selective disclosure [14,25]. Early research on measurement relied on third-party institutions’ negative exposure lists. In the Chinese context, for example, Du (2015) [26] used the “greenwashing list” published by the media outlet Southern Weekly to capture instances of corporate greenwashing. However, these lists are constrained by limitations such as subjectivity and insufficient coverage. Subsequent studies attempted to measure ESG-washing by analyzing the content structure of corporate ESG disclosures, specifically by conducting content analysis of ESG reports to obtain substantive and symbolic disclosure scores, then measuring ESG-washing by the ratio of these two scores [27] and performance levels, and then using the gap between disclosure and performance to measure ESG-washing. For example, Gull, Hussain, Khan, Khan & Saeed (2023) [20] used Bloomberg ESG disclosure ratings and Refinitiv ESG ratings to assess ESG disclosure and performance levels; Hawn & Ioannou (2016) [28] and Bothello, Ioannou, Porumb & Zengin-Karaibrahimoglu (2023) [29] used the sum of external and internal indicators from ASSET4 ESG ratings. Since different ESG rating agencies differ in their rating methodologies, this leads to divergence in their results [30,31]. Other studies have attempted to measure corporate ESG disclosure and performance levels using non-rating data. For instance, Hu, Hua, Liu & Wang (2023) [30] measured ESG disclosure and performance levels using the frequency of green environmental terms and whether the firm was subject to environmental penalties. Finally, some studies use a mixed design of the above two methods, combining both rating and non-rating data to measure ESG disclosure and performance [29]. Compared to methods that rely exclusively on sustainable information disclosure, the proposed methods integrate corporate ESG performance into the measurement system, thereby enhancing scientific rigor and reliability. Notably, significant divergences exist among ESG rating systems [32], leading to substantial variations in how different agencies evaluate disclosure quality. These discrepancies may incentivize firms to engage in selective disclosures to achieve high scores within specific rating frameworks, potentially exacerbating carbonwashing behavior. This paper uses content and text analysis methods to measure the intensity of corporate carbon disclosures, while using third-party ESG ratings to assess corporate ESG performance. Specifically, we calculate the ESG carbonwashing indicator by the difference between the ratings and non-rating data.
3. Data and Methods
3.1. Sample Selection and Data Sources
Following the approach of Zhou, Zhang, Wen, Zeng & Chen (2018) [33], the specific sample selection process is as follows: First, high-carbon-emitting industries, such as power and steel, are major contributors to China’s greenhouse gas emissions, and their deep decarbonization is essential for achieving the “Dual Carbon” goals. Therefore, we obtained the list of A-share listed firms in 2022 from the Wind database and identified 156 firms in eight high carbon-emission industries based on national economic industry classifications. Second, we excluded three firms with abnormal listing statuses, such as ST/*ST/PT. Finally, we retained firms that had disclosed ESG reports for five consecutive years. The final sample includes firms from the following industries, with the number of firms in each industry shown in parentheses: petrochemical (6), chemicals (7), construction materials (12), steel (3), non-ferrous metals (11), paper manufacturing (9), power generation (6), and aviation (5). Details of the stock codes, stock names, and industry sectors are provided in Appendix A Table A1, Column (1).
3.2. Measurement of Corporate ESG Carbonwashing
3.2.1. Measurement Design
Based on In & Schumacher (2021) [4], this paper defines ESG carbonwashing as the corporate effort to excessively focus on carbon responsibility while neglecting other issues, attempting to use a “representative strategy” to mislead information users’ judgment of the firm’s overall ESG image (Unlike In & Schumacher (2021) [4], who focus on the misrepresentation of carbon-related data, this study defines ESG carbonwashing as firms’ strategic overemphasis on carbon responsibility while neglecting other ESG dimensions. We further develop quantitative metrics (Carbonwashing1/Carbonwashing2) to measure this behavior, which In & Schumacher (2021) [4] did not address). Building upon the quantitative approaches to measuring corporate ESG-washing outlined in prior literature [12,34], this paper proposes a method for measuring the degree of corporate ESG carbonwashing based on the deviation between carbon disclosure levels and corporate ESG performance, ensuring the scientific rigor and operability of the measurement.
Specifically, we first standardize the carbon disclosure levels and ESG performance score data using Z-scores to ensure comparability between the carbon disclosure levels and ESG performance scores, eliminating the influence of the original data dimensions (CD1 is based on a 17-point scale, CD2 is measured by keyword frequency, and ESGP is an industry-adjusted score ranging from 0 to 100. To ensure comparability, we adopted the Z-score standardization method to make indicators with different units of measurement comparable). Then, based on the two carbon disclosure level results obtained from content analysis and text analysis, we calculate the ESG carbonwashing indicators, Carbonwashing1 and Carbonwashing2, by comparing them with the ESG performance. The specific calculation formulas are as follows:
Here, Carbonwashing1i,t and Carbonwashing2i,t represent the ESG carbonwashing levels of firm i in year t calculated using the two methods. CD1i,t and CD2i,t, and , σCD1 and σCD2 represent the carbon disclosure levels of firm i in year t based on content analysis and text analysis, the mean of carbon disclosure levels, and the standard deviation of carbon disclosure levels, respectively. ESGPi,t, , and σESGP represent the ESG performance score of firm i in year t, the mean ESG performance score, and the standard deviation of ESG performance scores, respectively.
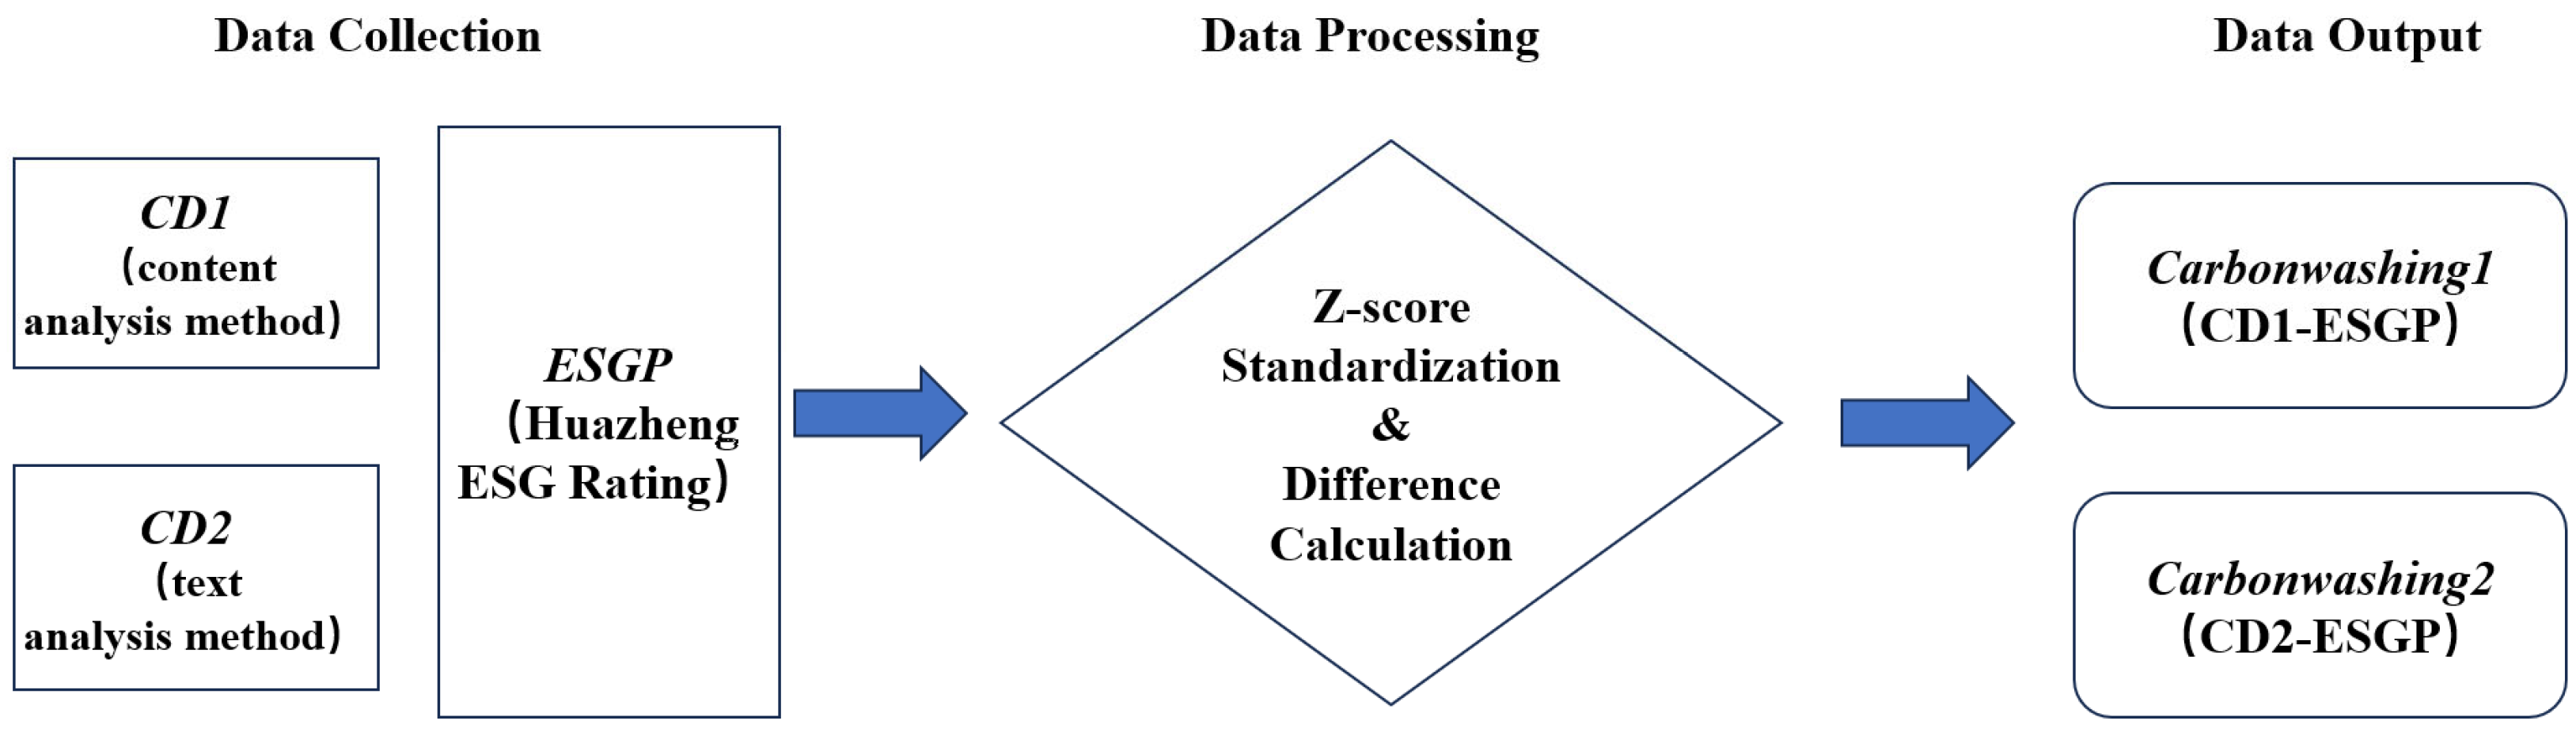
Figure 1 clearly illustrates the entire process from data collection to the final calculation of indicators. The figure details the data processing workflow, explaining how CD1 (content analysis) and CD2 (text analysis) are processed through Z-standardization and difference calculations to derive the Carbonwashing indices (Carbonwashing1 and Carbonwashing2). This visual approach helps readers better understand our measurement framework and enhances the paper’s readability and logical structure.
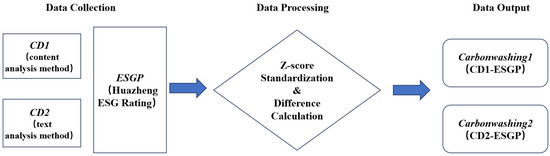
Figure 1.
Framework for measuring ESG carbonwashing.
3.2.2. The Measurement of Carbon Disclosure Levels Based on Content Analysis Method
Content analysis is a widely used method for constructing an evaluation of systems indicators [35,36]. Drawing on the content definition of carbon disclosure provided by the international organization CDP and relevant literature [12,34], this study reviews sustainability reports from multiple high-carbon-emission firms. Consequently, four critical domains of carbon activity information that firms should disclose were identified: carbon reduction strategies and targets, carbon reduction management and incentive mechanisms, carbon reduction actions and performance outcomes, and carbon emission verification and trading activities. These domains were subsequently refined into 12 secondary indicators.
Table 1 shows the number and proportion of firms disclosing the 12 secondary carbon information indicators. The results indicate that 59 sample firms disclosed more information on carbon reduction concepts and strategies, carbon risks and opportunities, carbon reduction actions or measures, actual carbon emissions, and carbon reduction achievements. In 2022, over three-quarters of the firms disclosed this information, reflecting the high level of attention paid by high-carbon-emission firms to these aspects. However, there was less disclosure on low-carbon reward and penalty mechanisms, carbon emission accounting methods, and carbon information audit assurance. Particularly in the area of carbon information audit assurance, only 20% of firms disclosed relevant information in 2022. This may indicate the relatively underdeveloped state of carbon information assurance services in Chinese firms.
In determining the indicator weights, we follow the approach of Liu & Cheng (2023) [37] and Luo & Tang (2014) [38], assigning scores to each specific disclosure item and weighting the indicators. According to the scoring criteria, quantitative disclosures are given 2 points, qualitative disclosures are given 1 point, and undisclosed items are given 0 points. The actual scores for each disclosure project made by the firm in a given year are then summed, with a total score of 17 points.
Appendix A Table A1, column (2), reports the annual mean of corporate carbon disclosure levels measured using content analysis from 2018 to 2022. Additionally, we perform descriptive statistical analysis of the carbon disclosure levels calculated by content analysis, categorized by year and industry. The related results and analysis are presented in Appendix B.

Table 1.
Carbon information disclosure indicator system based on content analysis method.
Table 1.
Carbon information disclosure indicator system based on content analysis method.
| Primary Indicator | Secondary Indicator | Specific Description | Reference Source | 2018 | 2019 | 2020 | 2021 | 2022 | |||||
|---|---|---|---|---|---|---|---|---|---|---|---|---|---|
| N | % | N | % | N | % | N | % | N | % | ||||
| Carbon Emission Reduction Awareness and Strategy | Carbon Reduction Philosophy and Strategy | Incorporating carbon reduction concepts into the firm’s development strategy and establishing a low-carbon management charter to guide carbon reduction efforts. | CDP (2023, C3.2) | 33 | 56 | 33 | 56 | 48 | 81 | 57 | 97 | 57 | 97 |
| Carbon Risks and Opportunities | Identifying, assessing, and responding to carbon-related risks and opportunities. | CDP (2023, C2.1) | 45 | 76 | 49 | 83 | 37 | 63 | 47 | 80 | 48 | 81 | |
| Carbon Reduction Plans and Targets | Develop annual and quarterly carbon emission reduction plans and targets for low-carbon development. | CDP (2023, C4.1) | 33 | 56 | 33 | 56 | 48 | 81 | 57 | 97 | 57 | 97 | |
| Carbon Emission Reduction Management and Incentives | Low Carbon Management System | Establish committees, departments, and positions related to carbon emission reduction management. | CDP (2023, C1.2) | 34 | 58 | 36 | 61 | 35 | 59 | 40 | 68 | 43 | 73 |
| Low-carbon Incentive and Penalty Mechanism | Develop reward, punishment, incentive, and evaluation mechanisms for carbon emissions. | CDP (2023, C1.3) | 2 | 3 | 1 | 2 | 3 | 5 | 6 | 10 | 7 | 12 | |
| Low Carbon Education and Training | Low-carbon education and training conducted for management and employees. | Bui & de Villiers (2017) [39], Pitrakkos & Maroun (2020) [40] | 33 | 56 | 39 | 66 | 27 | 46 | 38 | 64 | 41 | 69 | |
| Carbon Emission Reduction Actions and Performance | Carbon Reduction Actions or Measures | Emission reduction equipment upgrades and purchases, technological research and development, project construction, etc. | CDP (2023, C4.3) | 59 | 100 | 59 | 100 | 59 | 100 | 59 | 100 | 59 | 100 |
| Actual Carbon Emissions | Actual carbon emissions (Scope 1 and Scope 2). | CDP (2023, C6.2) | 38 | 64 | 38 | 64 | 45 | 76 | 51 | 86 | 58 | 98 | |
| Carbon Emission Reduction Status | Explanations regarding the standards and methods for calculating carbon emissions, and other related details. | CDP (2023, 4.1) | 45 | 76 | 46 | 78 | 54 | 92 | 59 | 100 | 59 | 100 | |
| Carbon Emission Verification and Trading | Carbon Emission Accounting Method | Explanations regarding the standards and methods for calculating carbon emissions. | CDP (2023, C5.1) | 7 | 12 | 5 | 8 | 7 | 12 | 14 | 24 | 17 | 29 |
| Carbon Information Audit and Verification | Whether the carbon information has been verified by an independent third-party organization. | CDP (2023, C10.1) | 2 | 3 | 3 | 5 | 6 | 10 | 8 | 14 | 12 | 20 | |
| Carbon emissions trading situation | Carbon emissions trading volume, trading income, expenses, and other related information. | CDP (2023, C11.1) | 12 | 20 | 12 | 20 | 16 | 27 | 19 | 32 | 22 | 37 | |
3.2.3. The Measurement of Carbon Disclosure Levels Based on Text Analysis Method
Text analysis methods have been widely used to quantify the level of corporate carbon information disclosure [41,42]. Specifically, based on the dictionary developed by Sun Xiaohua, Che Tianqi & Ma Xuejiao (2023) [43], we first construct a carbon information keyword dictionary at two levels: low-carbon strategy and low-carbon governance. This dictionary comprises 47 keywords, as presented in Table 2. Subsequently, we gather sustainability reports from 59 high-carbon-emission listed companies during the period of 2018 to 2022 through the Giant Tide Network (Juchao). Using Python 3.12, each report is converted into text format. The “jieba” segmentation function is then employed to identify and match the keywords, followed by calculating the total frequency of these keywords within the sustainability reports.
Table 2.
Dictionary of text search terms for corporate carbon information disclosure.
The average corporate carbon information disclosure levels, measured using text analysis methods for the years 2018–2022, are presented in column (3) of Appendix A Table A1. Furthermore, Appendix C provides a descriptive statistical analysis of carbon information disclosure levels calculated via text analysis methods, categorized by both year and industry, along with the corresponding results and interpretations.
3.2.4. The Measurement of ESG Performance
Existing studies frequently rely on third-party ESG ratings to assess corporate ESG performance [11,44,45]. This paper selects six representative institutions, both domestic and international, namely MSCI, Thomson Reuters (ASSET4), Bloomberg, SynTao, Huazheng, and Wind. The selection is based on their extensive ESG rating coverage and the robust methodologies employed to construct their indicator systems. Reasons for choosing the Huazheng ESG rating are as follows: First, Huazheng’s coverage of all A-share firms versus international agencies’ limited coverage (e.g., MSCI covers only 11.86% of A-shares). Second, Huazheng’s comprehensive methodology (3 pillar indicators, 16 themes, 44 topics) versus Bloomberg’s focus on disclosure rather than performance. Third, these adjustments ensure readers better understand our rationale for selecting Huazheng’s ratings. The specific criteria for this selection are presented in Table 3.
Table 3.
Introduction to major domestic and international ESG ratings.
After a thorough evaluation of the coverage, indicator system, and effectiveness of various ESG ratings, this paper selects the ESG ratings provided by Huazheng to measure the overall ESG performance of firms. Notably, in Huazheng’s latest rating system released in 2024, besides providing standard ESG scores, an industry-adjustment mechanism has been incorporated. This mechanism generates a weighted adjusted ESG score ranging from 0 to 100, where a higher score signifies superior ESG performance relative to peers within the same industry. To improve data comparability across industries, this study utilizes Huazheng’s industry-adjusted ESG scores.
The ESG composite scores of the sample firms are shown in column (4) of Appendix A Table A1. Additionally, this paper performs a descriptive statistical analysis of the ESG composite scores by year and industry for the sample firms, with detailed results provided in Appendix D.
4. Results
Based on the calculation formulas in Section 3.2.1, we calculate the ESG carbonwashing levels of sample firms for 2018–2022 as measured by Carbonwashing1 and Carbonwashing2. The detailed results can be found in Appendix E. We then progressively analyze the ESG carbonwashing situation of the firms from a general perspective to the time and industry dimensions.
4.1. Comprehensive Analysis
Table 4 reports the basic statistical results of the ESG carbonwashing-related variables. Z_CD1 and Z_CD2 represent the results of corporate carbon information disclosure levels, calculated using content analysis and text analysis methods, standardized using Z-scores. Z_ESGP is the Z-standardized composite ESG score of the firm. The maximum values of the variables Carbonwashing1 and Carbonwashing2 are 7.759 and 4.029, respectively, with minimum values of −3.516 and −4.631, and standard deviations of 1.226 and 1.203. These variations indicate substantial differences in firms’ selective disclosure strategies regarding carbon issues, thereby underscoring the practical importance of investigating corporate ESG carbonwashing practices.
Table 4.
Descriptive statistics of carbonwashing-related variables.
4.2. Analysis of Temporal Differences
This paper performs a descriptive statistical analysis of corporate ESG carbonwashing scores across different years, with the results shown in Table 5, which includes trends in standardized carbon disclosure (Z_CD1, Z_CD2) and ESG performance (Z_ESGP). Panel A presents the descriptive statistics of ESG carbonwashing scores measured by Carbonwashing1 across the years. It can be seen that the mean of Carbonwashing1 increased from −1.019 in 2018 to 0.573 in 2022, indicating a significant intensification of corporate ESG carbonwashing in recent years. In Panel B, the variable Carbonwashing2 also shows a similar growth trend, with the mean increasing from −1.117 in 2018 to 0.662 in 2022.
Table 5.
Descriptive statistics of corporate carbonwashing scores by year.
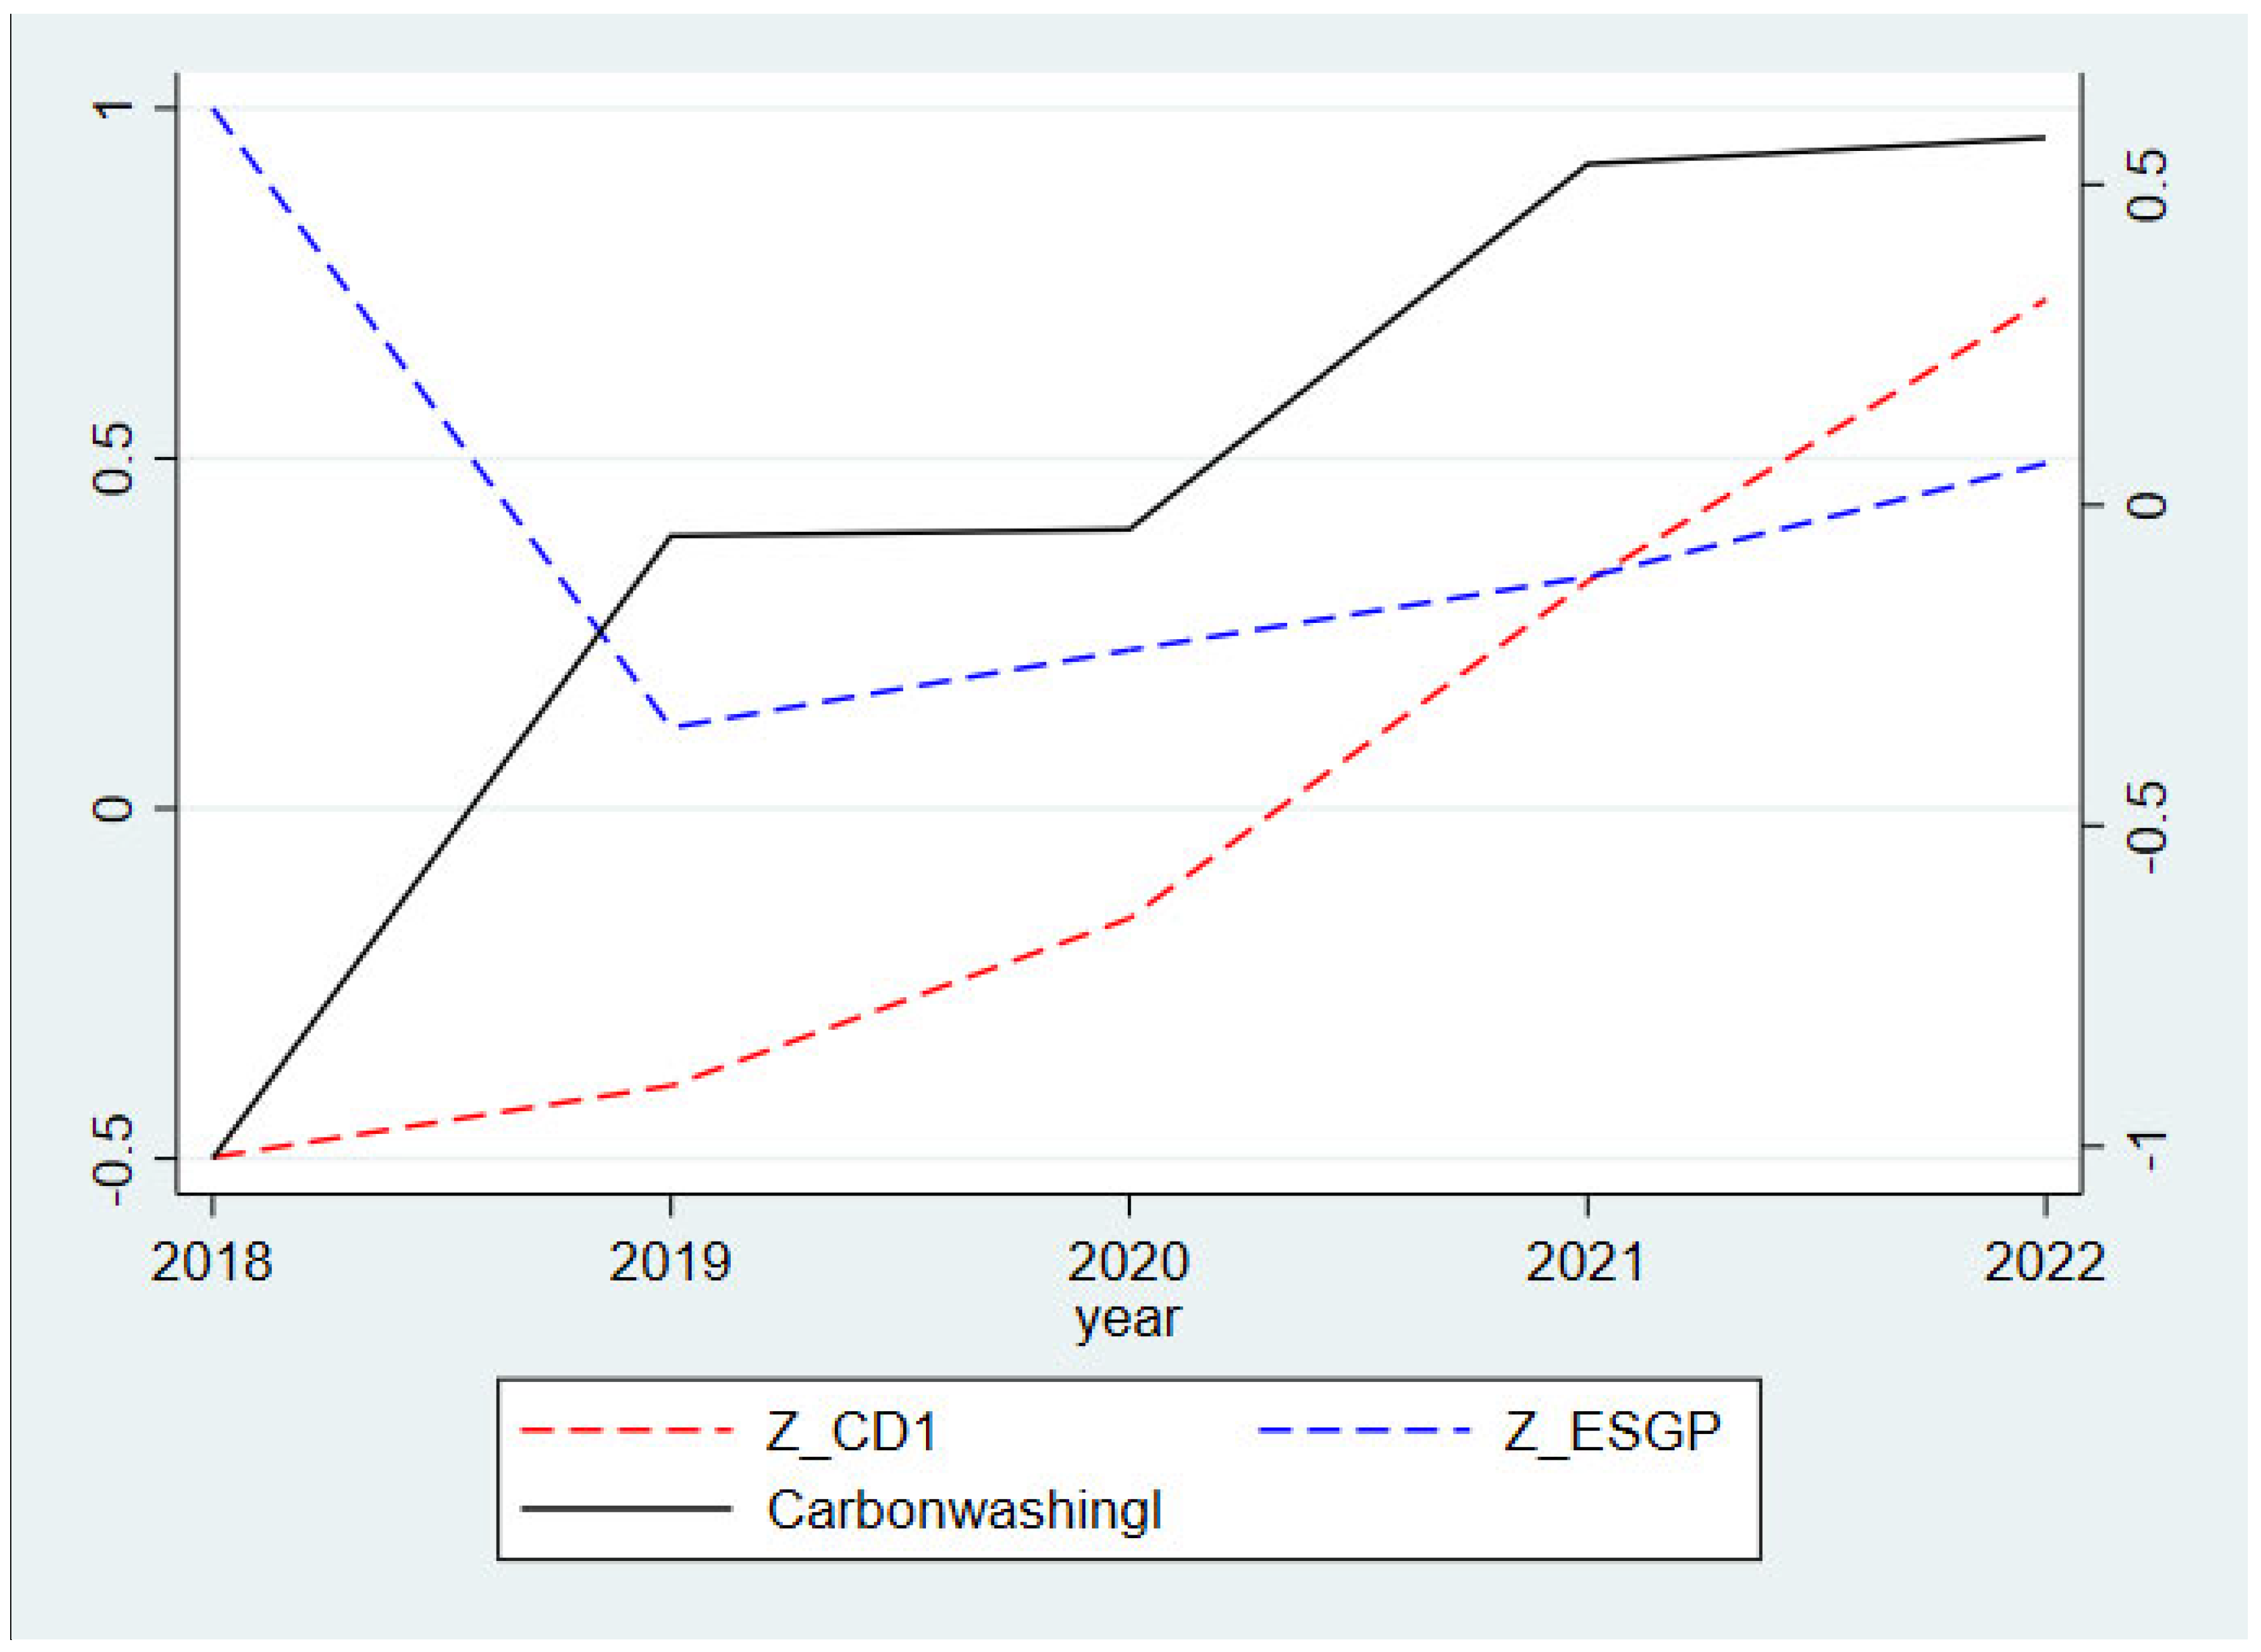
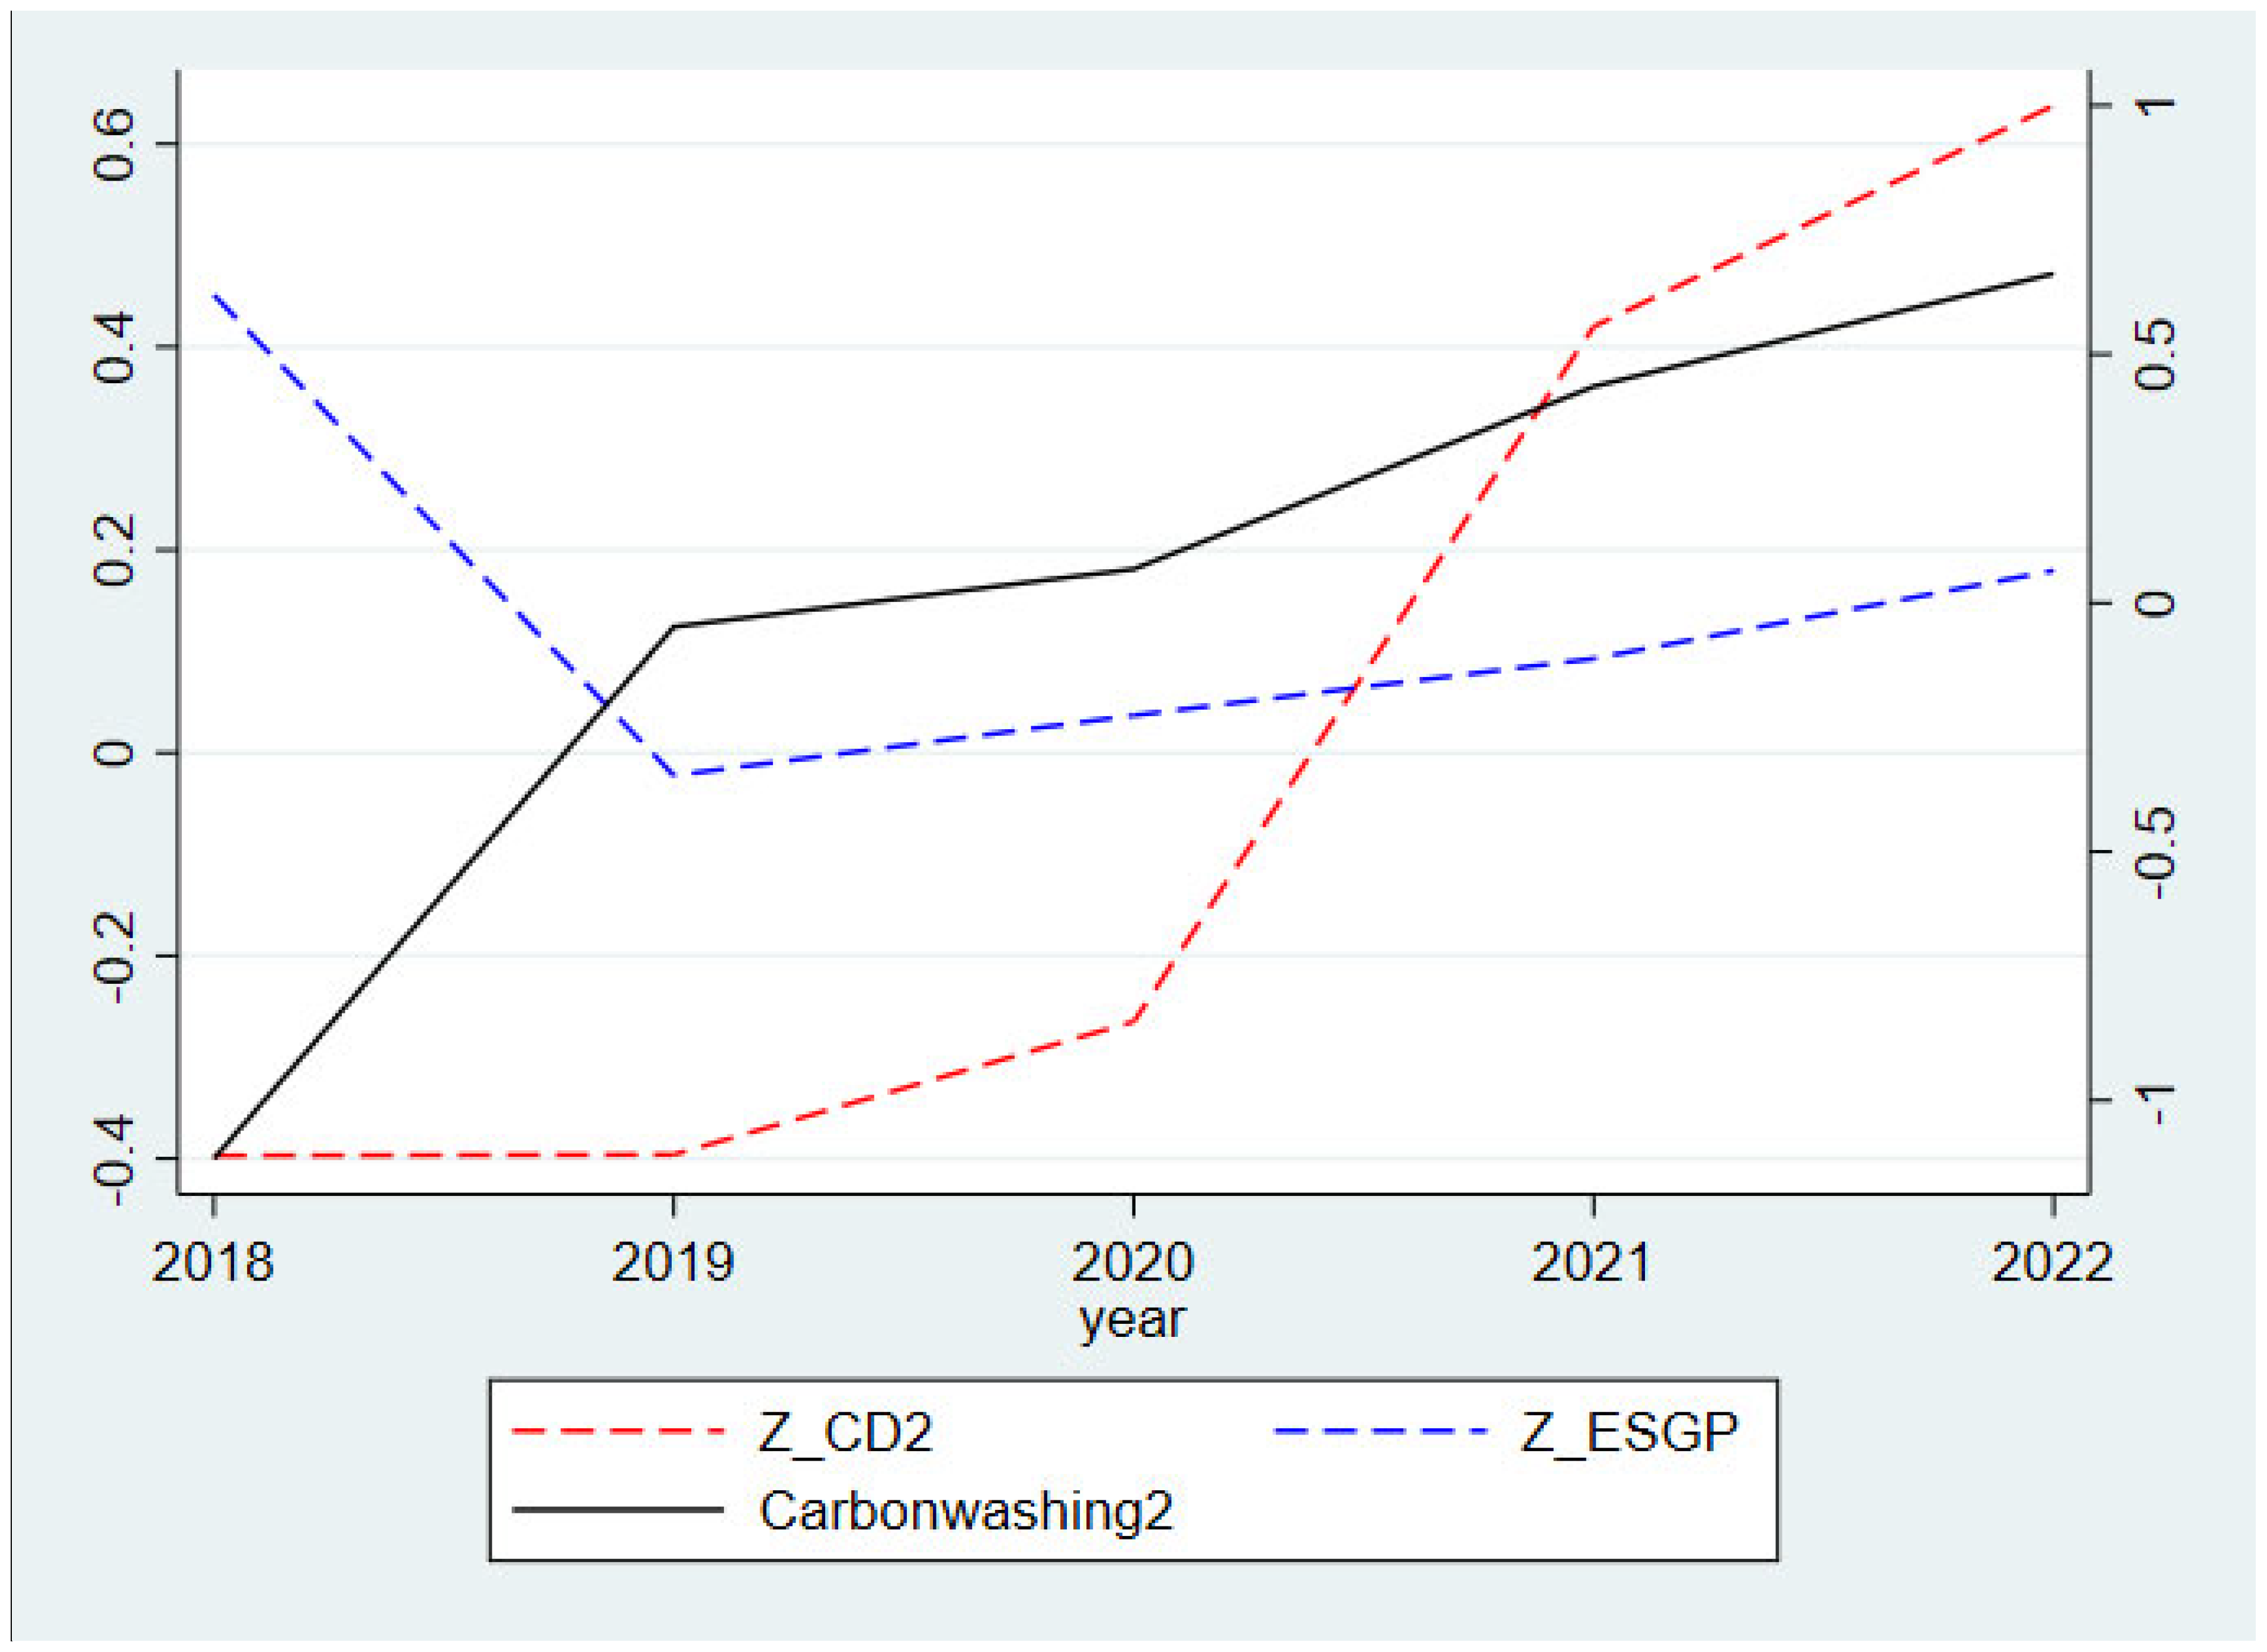
We visualized the data from Table 5 in Figure 2 and Figure 3. If carbonwashing reflects strategic behavior, the growth of Z_CD1 should significantly exceed that of Z_ESGP. Conversely, if carbonwashing is driven by institutional changes (e.g., mandatory disclosure), Z_CD1 and Z_ESGP would be expected to increase in tandem. However, since Z_ESGP showed no significant improvement, these findings support the hypothesis that carbonwashing is primarily a strategic behavior.
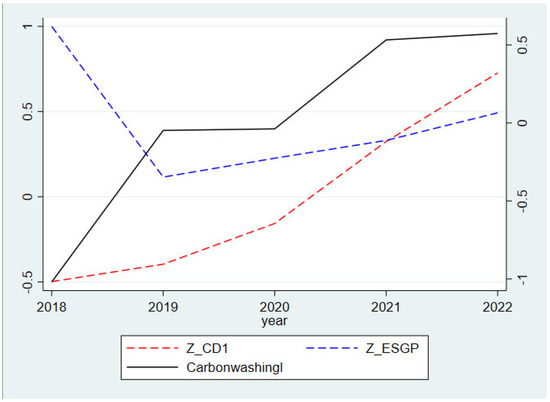
Figure 2.
Trend chart of indicators related to Carbonwashing1.
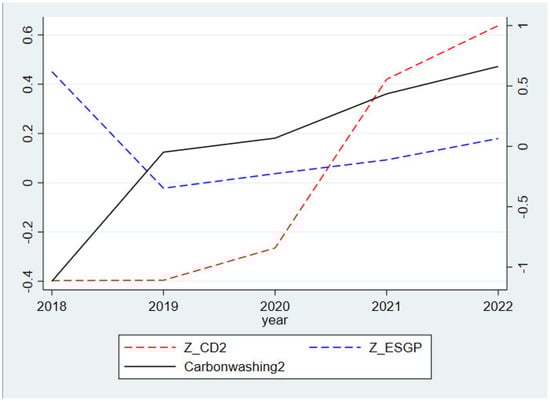
Figure 3.
Trend chart of indicators related to Carbonwashing2.
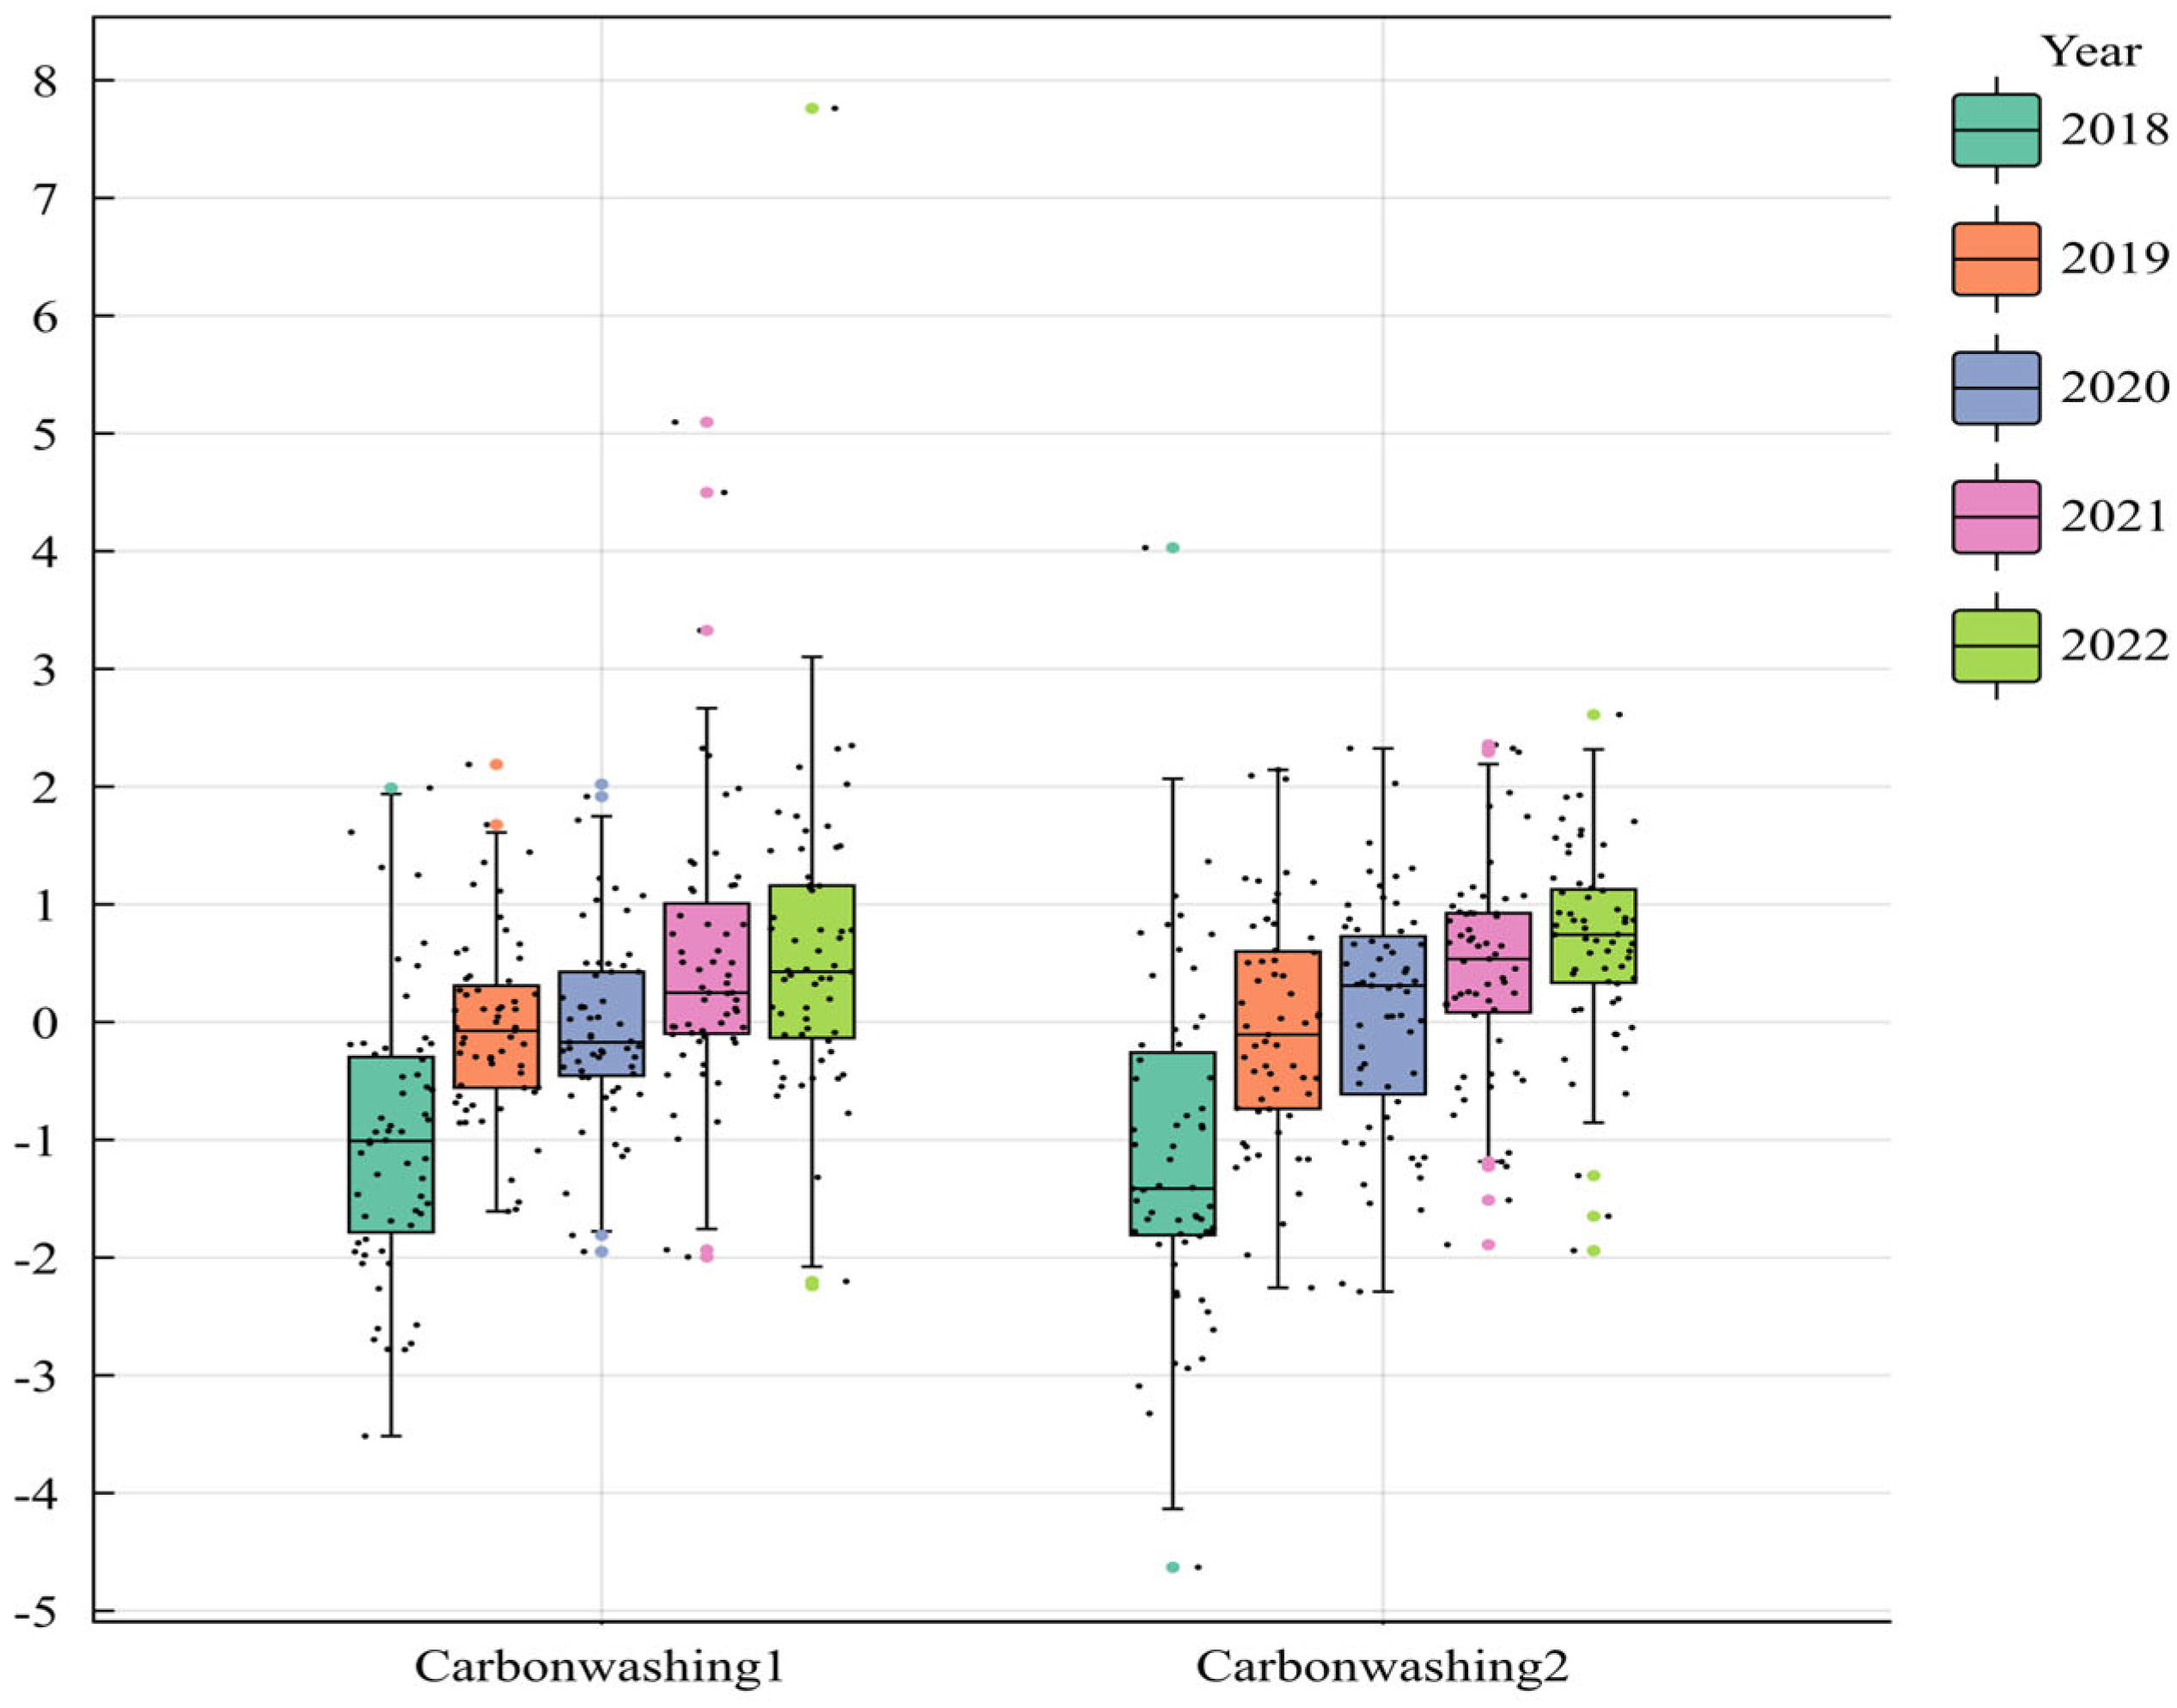
Figure 4 presents the box plot of ESG carbonwashing scores by year. The results reveal a substantial phase transition in the level of ESG carbonwashing for sample firms between 2018 and 2022, closely aligned with the implementation of the “Dual Carbon” policy. Specifically, 2020 marks a critical turning point for ESG carbonwashing behavior. The interquartile range (IQR) of Carbonwashing1 expanded significantly from 0.92 in 2019 to 1.56 in 2020, while the median increased sharply from −0.05 to 0.12. This suggests that firms rapidly adjusted their disclosure strategies in response to the policy signal. A similar growth trend is also observed for the variable Carbonwashing2.

Figure 4.
Box plot of corporate ESG carbonwashing scores from 2018 to 2022.
4.3. Analysis of Industry Differences
Table 6 presents the differences in ESG carbonwashing behavior across industries. Panel A shows the descriptive statistics of industry-level ESG carbonwashing measured by Carbonwashing1. It can be seen that the steel industry has the highest mean ESG carbonwashing score at 1.311, followed by the aviation (0.488) and non-ferrous (0.23) industries, while the building materials industry has the lowest mean ESG carbonwashing score (−0.355). Panel B presents the descriptive statistics of corporate ESG carbonwashing levels measured by Carbonwashing2, where the aviation industry has the highest mean score (0.794), followed by the power (0.363) and steel (0.359) industries, and the lowest mean score is found in the building materials industry (−0.4).
Table 6.
Descriptive statistics of corporate carbonwashing scores by industry.
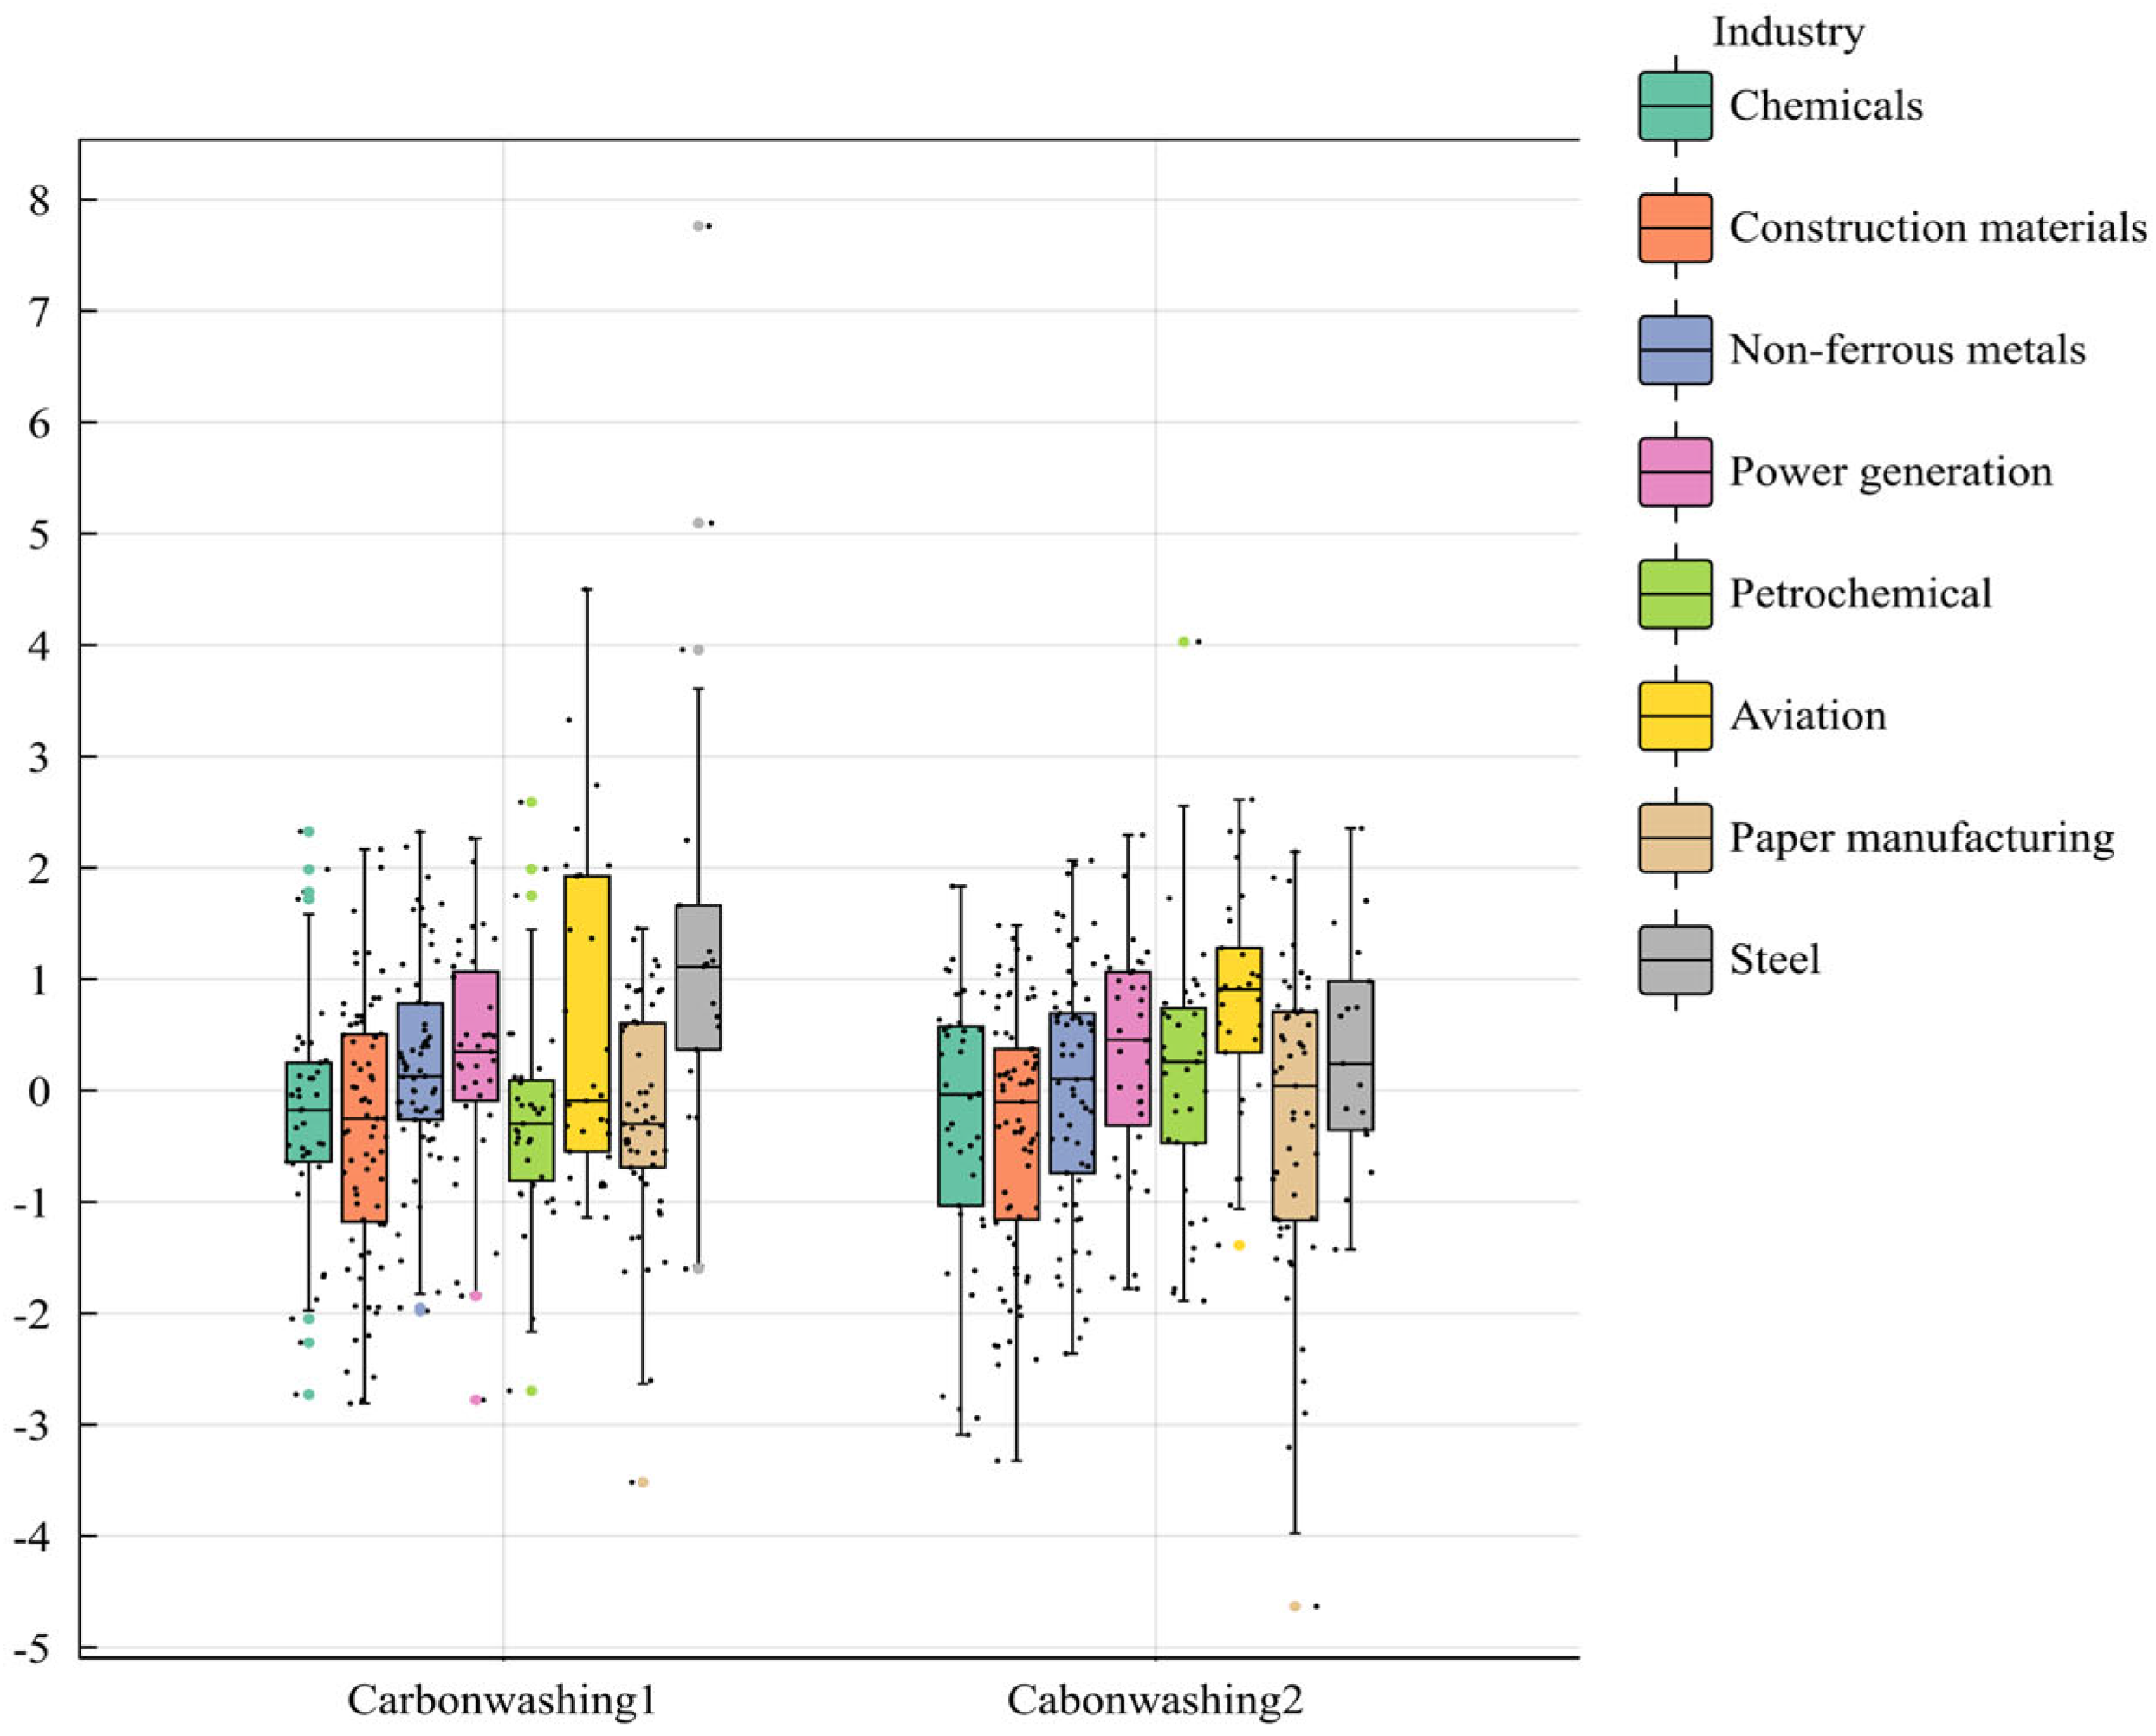
Figure 5 displays the box plots of ESG carbonwashing scores by industry. The results reveal substantial variations across industries regarding the ESG carbonwashing metric. The box plots for the steel and aviation industries are predominantly skewed to the right, with extended upper tails. Specifically, the mean Carbonwashing1 score for the steel industry is 1.311, which is significantly higher than that of other industries. This suggests that firms in this sector frequently employ excessive carbon information disclosure as a strategic tool for managing their public image. Conversely, the box plot for the building materials industry lies entirely below zero, indicating that companies in this sector tend to minimize their carbon-related disclosures. Likewise, the mean Carbonwashing2 score for the aviation industry is 0.794, markedly exceeding those of other industries.
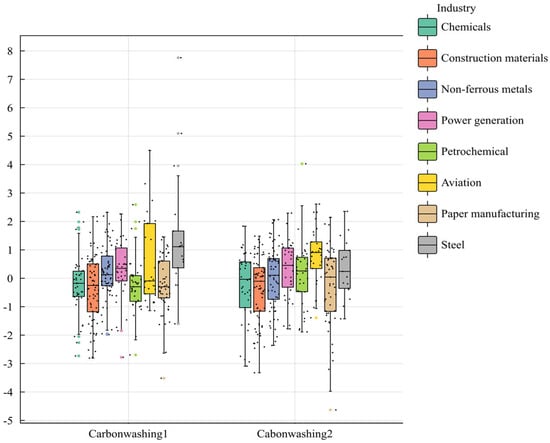
Figure 5.
Box plot of ESG carbonwashing scores for eight high carbon emission industries.
5. Discussion and Conclusions
This study investigates the ESG-washing behavior of 59 high-carbon emission industry listed firms in the Shanghai and Shenzhen A-shares from 2018 to 2022. The research reveals significant temporal and industry-specific variations in corporate ESG carbonwashing under the “Dual Carbon” policy background: (1) Temporal Dimension: during the policy window period (2020–2022), the ESG carbonwashing levels of sample firms surged dramatically. Specifically, the ESG carbonwashing indicators measured by content analysis (Carbonwashing1) and text analysis (Carbonwashing2) increased by 203.56% and 194.16%, respectively. (2) Industry Dimension: the steel industry exhibits the highest level of ESG carbonwashing in terms of Carbonwashing1, with an average value 3.43 times higher than the normalized average for the entire sample. Meanwhile, the aviation industry demonstrates the highest degree of Carbonwashing in terms of Carbonwashing2, with an average value 2.36 times higher than the normalized average for the entire sample.
From a theoretical perspective, this study extends the boundaries of traditional ESG-washing research by introducing the novel concept of ESG carbonwashing for the first time, thereby enriching the understanding of corporate ESG-washing activities. Prior literature has mainly focused on concepts like green-washing, brown-washing, and pink-washing [5,7]. In the context of the “Dual Carbon” policies, firms’ ESG efforts are excessively concentrated on carbon responsibility, often neglecting other important ESG issues. This results in a strategy of “representing the whole by a part”, which misguides information users in their overall judgment of a firm’s ESG image. This behavior is what we term ESG carbonwashing. Moreover, this study utilizes content and text analysis methodologies to develop quantitative metrics for systematically evaluating corporate ESG carbonwashing behavior. This establishes a practical analytical framework for empirical research in the ESG domain and serves as a valuable reference for practitioners engaged in ESG assessment, green investment decision-making, and policy formulation.
From a practical perspective, this study reveals the issue of ESG carbonwashing in the context of industry ESG under China’s “Dual Carbon” policies. The research demonstrates that, driven by the pressure of the “Dual Carbon” policies, the incidence of ESG carbonwashing in high-emission industries has markedly risen. This finding provides empirical evidence for government departments and regulatory bodies to develop differentiated ESG regulatory policies. For ESG rating agencies, it is recommended to introduce a dimension-balanced evaluation mechanism to adjust the scores of companies with abnormally high carbon disclosure ratios [46,47]. For regulatory authorities, a scientifically grounded carbon verification system should be established, with the active involvement of third-party professional institutions to audit corporate carbon information, thereby enhancing the authenticity and credibility of carbon data [48,49]. Institutional investors are advised to incorporate “carbonwashing” risk indicators into their investment decisions, with particular attention to the consistency between carbon disclosure and other ESG information. It also contributes to optimizing ESG rating systems and supports efforts to guide firms toward genuine sustainable development.
This study also has certain limitations. The focus on high-carbon emission industries may weaken the generalizability of the conclusions, and the data from emerging disclosure channels such as social media has not been included. Future research could expand to include a broader industry sample and integrate multi-source information such as public opinion texts and supply chain data. By utilizing large language models (LLMs) and other advanced models, future studies could provide a dynamic analysis of multi-modal strategies for ESG-washing, offering more comprehensive theoretical support and practical guidance for corporate sustainable development in the context of global climate governance.
Author Contributions
Y.W. and Z.N.: data preparation and design, formal analysis, original draft preparation, and manuscript preparation sections. M.Z. and W.Z.: conceptualization, design, manuscript preparation, and supervised this project. Each author contributed to the conceptualization and writing of this paper. All authors have read and agreed to the published version of the manuscript.
Funding
This research is funded by the Postgraduate Research and Practice Innovation Program of Jiangsu Province (Grant number KYCX24_1321).
Institutional Review Board Statement
Not applicable.
Informed Consent Statement
Not applicable.
Data Availability Statement
The original contributions presented in this study are included in the article. Further inquiries can be directed to the corresponding author(s).
Conflicts of Interest
The authors declare no conflicts of interest.
Appendix A
Table A1.
List of high carbon emission firms disclosing sustainability reports for five consecutive years from 2018 to 2022.
Table A1.
List of high carbon emission firms disclosing sustainability reports for five consecutive years from 2018 to 2022.
| Stock Code | Stock Name | (1) | (2) | (3) | (4) |
|---|---|---|---|---|---|
| Industry Sector | CD1 | CD2 | ESGP | ||
| 12 | CSG Holding Co., Ltd. | Building Materials | 8.4 | 10 | 64.604 |
| 401 | Tangshan Jidong Cement Co., Ltd. | Building Materials | 7.4 | 6.6 | 71.578 |
| 539 | Guangdong Electric Power Development Co., Ltd. | Electric Power | 10 | 10 | 66.362 |
| 630 | Tongling Nonferrous Metals Group Co., Ltd. | Nonferrous Metals | 8 | 5.8 | 67.77 |
| 672 | Shangfeng Cement Co., Ltd. | Building Materials | 10 | 14.6 | 63.966 |
| 690 | Baotou New Energy Co., Ltd. | Electric Power | 10.8 | 3.6 | 67.476 |
| 807 | Yunnan Aluminium Co., Ltd. | Nonferrous Metals | 11.6 | 21 | 71.058 |
| 815 | Qilianshan Cement Group Co., Ltd. | Paper Manufacturing | 3.6 | 0 | 59.262 |
| 819 | Yueyang Xingchang Petrochemical Co., Ltd. | Petrochemical | 5.2 | 1.6 | 66.326 |
| 881 | CGN Nuclear Technology Development Co., Ltd. | Chemical | 6.6 | 4.4 | 68.968 |
| 933 | Henan Shenhuo Coal & Power Co., Ltd. | Nonferrous Metals | 5.6 | 1.8 | 50.532 |
| 960 | Yunnan Tin Firm Limited | Nonferrous Metals | 10.4 | 17.4 | 68.914 |
| 2067 | Zhejiang Jingxing Paper Joint Stock Co., Ltd. | Paper Manufacturing | 9.6 | 4.2 | 71.11 |
| 2078 | Shandong Sun Paper Industry Joint Stock Co., Ltd. | Paper Manufacturing | 6.8 | 11 | 75.95 |
| 2165 | Hongbaoli Group Co., Ltd. | Chemical | 8.6 | 3.8 | 69.62 |
| 2203 | Hailiang Group Co., Ltd. | Nonferrous Metals | 11.6 | 20 | 71.948 |
| 2233 | Guangdong Tapai Group Co., Ltd. | Building Materials | 9.6 | 11 | 75.054 |
| 2511 | C&S Paper Co., Ltd. | Paper Manufacturing | 6.8 | 0.2 | 62.252 |
| 2601 | Lomon Billions Group Co., Ltd. | Chemical | 9.8 | 19 | 64.106 |
| 600004 | Guangzhou Baiyun International Airport Co., Ltd. | Nonferrous Metals | 5.8 | 1.4 | 64.894 |
| 600010 | Baoshan Iron & Steel Co., Ltd. | Steel | 7.2 | 11 | 60.572 |
| 600019 | Baoshan Iron & Steel Co., Ltd. | Steel | 13.2 | 82.8 | 73.464 |
| 600029 | China Southern Airlines Firm Limited | Nonferrous Metals | 14 | 19.8 | 71.79 |
| 600063 | Anhui Wanwei Updated High-Tech Material Industry Co., Ltd. | Chemical | 8 | 4.8 | 71.018 |
| 600098 | Guangzhou Development Group Incorporated | Electric Power | 11.6 | 26 | 78.832 |
| 600103 | Qingshan Paper Industry Co., Ltd. | Paper Manufacturing | 11.6 | 9.8 | 67.418 |
| 600110 | Nord Investment Co., Ltd. | Nonferrous Metals | 5.6 | 4 | 65.546 |
| 600115 | China Eastern Airlines Corporation Limited | Nonferrous Metals | 13.6 | 27.2 | 73.906 |
| 600160 | Zhejiang Juhua Co., Ltd. | Petrochemical | 12 | 4.2 | 75.472 |
| 600219 | Nanshan Aluminum Co., Ltd. | Nonferrous Metals | 9 | 21.6 | 67.598 |
| 600221 | Hainan Airlines Holding Co., Ltd. | Nonferrous Metals | 9.8 | 6 | 54.99 |
| 600255 | Mengzhou Co., Ltd. | Nonferrous Metals | 4.6 | 1.6 | 55.594 |
| 600273 | Zhejiang Jiahua Energy Chemical Industry Co., Ltd. | Chemical | 10.4 | 4.2 | 67.648 |
| 600307 | Jiuquan Iron & Steel Co., Ltd. | Steel | 7.6 | 10.2 | 63.792 |
| 600308 | Huatai Co., Ltd. | Paper Manufacturing | 7.6 | 0.6 | 62.222 |
| 600309 | Wanhua Chemical Group Co., Ltd. | Petrochemical | 10.6 | 19.2 | 70.66 |
| 600356 | Hengfeng Paper Co., Ltd. | Paper Manufacturing | 7.6 | 7.2 | 70.784 |
| 600362 | Jiangxi Copper Firm Limited | Nonferrous Metals | 10.6 | 19.6 | 81.226 |
| 600409 | Tangshan Sanyou Chemical Industries Co., Ltd. | Chemical | 10.4 | 3.2 | 73.218 |
| 600433 | Guangxi Guiguan Electric Power Co., Ltd. | Paper Manufacturing | 9.6 | 12.6 | 76.644 |
| 600452 | Fuling Electric Power Industrial Co., Ltd. | Electric Power | 5.8 | 8.4 | 57.022 |
| 600490 | Pengxin Resources Co., Ltd. | Nonferrous Metals | 6 | 2.4 | 65.738 |
| 600500 | Sinochem International Corporation | Chemical | 11.6 | 50.2 | 82.086 |
| 600531 | Henan Yuguang Gold & Lead Co., Ltd. | Nonferrous Metals | 10.2 | 3.8 | 64.58 |
| 600585 | Anhui Conch Cement Firm Limited | Building Materials | 9.2 | 6.2 | 81.734 |
| 600618 | Shanghai Chlor-Alkali Chemical Co., Ltd. | Chemical | 10.4 | 2.6 | 70.274 |
| 600623 | Shanghai Huayi Group Corporation Limited | Petrochemical | 8.6 | 2.8 | 69.496 |
| 600660 | Fuyao Glass Industry Group Co., Ltd. | Building Materials | 7.6 | 6.8 | 81.394 |
| 600688 | Sinopec Shanghai Petrochemical Firm Limited | Petrochemical | 13.4 | 5.2 | 66.73 |
| 600801 | Huaxin Cement Co., Ltd. | Building Materials | 11.8 | 36.8 | 76.222 |
| 600802 | Fujian Cement Inc. | Building Materials | 6.2 | 1.4 | 71.876 |
| 600876 | Luoyang Glass Firm Limited | Building Materials | 8.6 | 3.2 | 59.472 |
| 600881 | Yatai Group Co., Ltd. | Building Materials | 8.8 | 0.2 | 66.764 |
| 600886 | SDIC Power Holdings Co., Ltd. | Electric Power | 11.2 | 16.6 | 73.024 |
| 601111 | Air China Limited | Nonferrous Metals | 14.4 | 45.8 | 72.758 |
| 601636 | Kibing Group Co., Ltd. | Building Materials | 6.4 | 3 | 64.436 |
| 601991 | Datang International Power Generation Co., Ltd. | Electric Power | 12 | 15.4 | 66.64 |
| 601992 | BBMG Corporation | Building Materials | 12.4 | 26.8 | 81.558 |
| 603165 | Rongsheng Environmental Protection Paper Co., Ltd. | Paper Manufacturing | 10 | 8.2 | 71.2 |
Note: The first column represents the industry classification of firms based on the 2012 version of the CSRC industry classification and the national economic industry classification. Column (2) shows the carbon disclosure level measured using content analysis. Column (3) shows the carbon disclosure level measured using text analysis. Column (4) presents the Huazheng ESG rating.
Appendix B
This study conducts descriptive statistical analysis of the carbon disclosure levels calculated using content analysis, categorized by year and industry. Panel A shows a significant upward trend in the carbon disclosure levels of the sample firms from 2018 to 2022, with the mean increasing from 7.5 in 2018 to 11.8 in 2022. This suggests that the introduction of the “Dual Carbon” targets has had a significant positive impact on the carbon disclosure practices of high carbon-emitting firms. Panel B reports the results categorized by high carbon-emitting industries, where the aviation industry exhibits the highest carbon disclosure level, with a mean score of 11.52, followed by the power and petrochemical industries, with mean scores of 10.233 and 10.033, respectively.
Table A2.
Descriptive statistics of carbon information disclosure levels calculated using content analysis method.
Table A2.
Descriptive statistics of carbon information disclosure levels calculated using content analysis method.
| Panel A: Descriptive Statistics by Year Distribution | ||||||
|---|---|---|---|---|---|---|
| Year | Sample Size | Mean | Standard Deviation | Minimum Value | Median | Maximum Value |
| 2018 | 59 | 7.508 | 3.245 | 1 | 8 | 15 |
| 2019 | 59 | 7.864 | 3.401 | 1 | 8 | 14 |
| 2020 | 59 | 8.695 | 3.349 | 2 | 9 | 15 |
| 2021 | 59 | 10.373 | 3.216 | 4 | 11 | 17 |
| 2022 | 59 | 11.78 | 2.198 | 6 | 12 | 17 |
| Total | 295 | 9.244 | 3.487 | 1 | 10 | 17 |
| Panel B: Descriptive Statistics by Industry Distribution | ||||||
| Industry | Sample Size | Mean | Standard Deviation | Minimum Value | Median | Maximum Value |
| Chemicals | 35 | 9.343 | 2.999 | 4 | 10 | 14 |
| Building Materials | 60 | 8.867 | 2.873 | 1 | 9 | 14 |
| Non-ferrous Metals | 55 | 8.473 | 3.868 | 3 | 9 | 15 |
| Power | 30 | 10.233 | 3.245 | 1 | 11 | 16 |
| Petrochemical | 30 | 10.033 | 3.146 | 3 | 10.5 | 15 |
| Aviation | 25 | 11.52 | 3.607 | 4 | 13 | 16 |
| Paper Manufacturing | 45 | 8.133 | 3.527 | 2 | 8 | 14 |
| Steel | 15 | 9.333 | 4.203 | 3 | 10 | 17 |
| Total | 295 | 9.244 | 3.487 | 1 | 10 | 17 |
Appendix C
This paper conducts descriptive statistics on the level of carbon information disclosure, measured through textual analysis, by year and industry. Panel A shows that the average keyword frequency increased significantly from 2.763 in 2018 to 26.8 in 2022, indicating a clear upward trend—particularly after the “Dual Carbon” goals were proposed in 2020, which triggered a surge in carbon-related disclosures in corporate sustainability reports. Panel B reports the results by industry, revealing that the steel industry had the highest level of carbon disclosure, with an average score of 34.667, followed by the aviation and power industries, with average scores of 20.04 and 13.333, respectively.
Table A3.
Descriptive statistics of carbon information disclosure levels calculated using text analysis method.
Table A3.
Descriptive statistics of carbon information disclosure levels calculated using text analysis method.
| Panel A: Descriptive Statistics by Year Distribution | ||||||
|---|---|---|---|---|---|---|
| Year | Sample Size | Mean | Standard Deviation | Minimum Value | Median | Maximum Value |
| 2018 | 59 | 2.763 | 3.282 | 0 | 2 | 13 |
| 2019 | 59 | 2.847 | 3.934 | 0 | 2 | 20 |
| 2020 | 59 | 5.898 | 7.768 | 0 | 3 | 37 |
| 2021 | 59 | 21.76 | 28.45 | 0 | 13 | 127 |
| 2022 | 59 | 26.8 | 35.97 | 0 | 14 | 226 |
| Total | 295 | 12.01 | 23.16 | 0 | 4 | 226 |
| Panel B: Descriptive Statistics by Industry Distribution | ||||||
| Industry | Sample Size | Mean | Standard Deviation | Minimum Value | Median | Maximum Value |
| Chemicals | 35 | 12.571 | 24.874 | 0 | 3 | 102 |
| Building Materials | 60 | 10.55 | 17.296 | 0 | 4 | 106 |
| Non-ferrous Metals | 55 | 10.818 | 16.324 | 0 | 3 | 71 |
| Power | 30 | 13.333 | 14.826 | 0 | 4.5 | 51 |
| Petrochemical | 30 | 6.2 | 11.1 | 0 | 3 | 57 |
| Aviation | 25 | 20.04 | 32.639 | 0 | 6 | 114 |
| paper manufacturing | 45 | 5.978 | 9.602 | 0 | 2 | 49 |
| Steel | 15 | 34.667 | 61.451 | 0 | 13 | 226 |
| Total | 295 | 12.014 | 23.164 | 0 | 4 | 226 |
Appendix D
Panel A shows that the average ESG composite score of the sample firms was highest in 2018 at 74.5, and lowest in 2019 at 65.82, before rising again to 69.52. This fluctuation is primarily due to the shift in the rating methodology by Huazheng ESG, which used the 1.0 rating system from Q1 2009 to Q1 2019, and adopted the 2.0 system thereafter. The update in the evaluation framework led to a notable decrease in ESG scores for A-share listed firms. Panel B further reveals that the chemical industry had the highest average ESG score at 71.33, while the non-ferrous metals industry recorded the lowest at 65.94. These findings are generally consistent with existing literature.
Table A4.
Descriptive statistics of corporate ESG score.
Table A4.
Descriptive statistics of corporate ESG score.
| Panel A: Descriptive Statistics by Year Distribution | ||||||
|---|---|---|---|---|---|---|
| Year | Sample Size | Mean | Standard Deviation | Minimum Value | Median | Maximum Value |
| 2018 | 59 | 74.5 | 10.61 | 47.57 | 74.5 | 97.02 |
| 2019 | 59 | 65.82 | 7.206 | 44.61 | 65.85 | 81.04 |
| 2020 | 59 | 66.91 | 7.646 | 47.06 | 67.29 | 84.37 |
| 2021 | 59 | 67.93 | 7.501 | 50 | 67.52 | 86.69 |
| 2022 | 59 | 69.52 | 9.106 | 50 | 69.11 | 88.32 |
| Total | 295 | 68.94 | 8.983 | 44.61 | 68 | 97.02 |
| Panel B: Descriptive Statistics by Industry Distribution | ||||||
| Industry | Sample Size | Mean | Standard Deviation | Minimum Value | Median | Maximum Value |
| Chemicals | 35 | 71.33 | 8.082 | 60.82 | 70.34 | 89.57 |
| Building Materials | 60 | 71.56 | 9.433 | 50.56 | 70.36 | 90.42 |
| Non-ferrous Metals | 55 | 66.41 | 9.117 | 44.61 | 67.06 | 85.93 |
| Power | 30 | 68.23 | 9.431 | 52.86 | 65.54 | 93.5 |
| Petrochemical | 30 | 69.39 | 6.993 | 47.57 | 68.91 | 92.37 |
| Aviation | 25 | 67.67 | 8.711 | 50 | 69.69 | 78.11 |
| Paper Manufacturing | 45 | 68.54 | 9.438 | 52.09 | 69.1 | 97.02 |
| Steel | 15 | 65.94 | 7.841 | 54.6 | 64.28 | 83.7 |
| Total | 295 | 68.94 | 8.983 | 44.61 | 68 | 97.02 |
Appendix E
Table A5.
Extent of ESG carbonwashing of sample firms as measured by variable Carbonwashing1 and Carbonwashing2.
Table A5.
Extent of ESG carbonwashing of sample firms as measured by variable Carbonwashing1 and Carbonwashing2.
| Stock Code | Stock Name | (1) | (2) | (3) | (4) | (5) | (6) | (7) | (8) | (9) | (10) |
|---|---|---|---|---|---|---|---|---|---|---|---|
| 2018 | 2019 | 2020 | 2021 | 2022 | 2018 | 2019 | 2020 | 2021 | 2022 | ||
| 000012 | CSG Holding Co., Ltd. | −1.94 | 0.78 | 1.07 | 0.83 | 1.23 | −1.78 | 1.19 | 0.88 | 0.06 | 0.86 |
| 000401 | Tangshan Jidong Cement Co., Ltd. | −2.57 | 0.10 | −0.22 | −0.07 | 0.13 | −2.30 | −1.06 | −1.38 | 0.25 | 0.37 |
| 000539 | Guangdong Electric Power Development Co., Ltd. | −1.46 | −0.04 | 0.50 | 0.50 | 1.50 | −0.90 | 0.03 | 0.54 | 0.92 | 1.93 |
| 000630 | Tongling Nonferrous Metals Group Co., Ltd. | −0.18 | −0.19 | −0.41 | 0.25 | −0.16 | −1.17 | −1.46 | 0.32 | 1.07 | 0.10 |
| 000672 | Shangfeng Cement Co., Ltd. | 0.67 | 0.24 | 0.03 | 1.23 | 1.14 | 1.36 | 0.51 | 0.31 | 0.92 | 0.74 |
| 000690 | Baotou New Energy Co., Ltd. | −1.73 | 0.35 | 0.21 | 0.09 | 0.07 | −0.88 | 1.20 | 1.06 | 0.99 | 0.68 |
| 000807 | Yunnan Aluminium Co., Ltd. | −1.98 | 0.54 | 0.12 | 0.45 | 1.62 | −1.68 | 0.87 | 0.79 | 0.65 | 1.56 |
| 000815 | Qilianshan Cement Group Co., Ltd. | −1.63 | 1.36 | 1.04 | 0.90 | 1.12 | −2.90 | −0.20 | −0.52 | 0.21 | 0.71 |
| 000819 | Yueyang Xingchang Petrochemical Co., Ltd. | −0.46 | −0.13 | −0.44 | 0.12 | 0.12 | −1.78 | −1.16 | −0.89 | −0.47 | −0.05 |
| 000881 | CGN Nuclear Technology Development Co., Ltd. | −1.88 | −0.29 | −0.17 | 0.25 | 0.43 | −2.86 | −0.42 | −1.16 | −0.55 | 1.18 |
| 000933 | Henan Shenhuo Coal & Power Co., Ltd. | 1.31 | 2.19 | 1.92 | 1.13 | 1.48 | 0.62 | 2.06 | 0.64 | 0.11 | 1.59 |
| 000960 | Yunnan Tin Firm Limited | −1.29 | 0.39 | 0.95 | 0.33 | 0.79 | −1.75 | −0.11 | 2.03 | 0.67 | 0.82 |
| 002067 | Zhejiang Jingxing Paper Joint Stock Co., Ltd. | −1.33 | −0.31 | −0.47 | −0.45 | −0.34 | −1.87 | −0.57 | 0.42 | 0.65 | 0.67 |
| 002078 | Shandong Sun Paper Industry Joint Stock Co., Ltd. | −3.52 | −0.54 | −1.08 | −0.44 | 1.46 | −4.63 | −1.24 | −1.54 | −1.23 | 1.22 |
| 002165 | Hongbaoli Group Co., Ltd. | −2.73 | 0.11 | 0.13 | −0.04 | 0.37 | −2.94 | 1.09 | 0.49 | −0.49 | 0.55 |
| 002203 | Hailiang Group Co., Ltd. | −0.60 | −0.43 | 0.43 | 0.29 | 0.36 | −0.04 | 0.59 | 0.01 | 0.54 | 0.60 |
| 002233 | Guangdong Tapai Group Co., Ltd. | −2.78 | −0.74 | −0.38 | 0.24 | 0.03 | −2.46 | −0.37 | −0.68 | 0.14 | 0.47 |
| 002511 | C&S Paper Co., Ltd. | −0.13 | 0.05 | −0.38 | 0.75 | 0.89 | −1.41 | −0.94 | 0.31 | 0.34 | 1.91 |
| 002601 | Lomon Billions Group Co., Ltd. | 0.48 | 0.27 | 0.43 | 2.32 | 0.69 | −0.06 | 0.88 | −0.03 | 1.83 | 0.86 |
| 600004 | Guangzhou Baiyun International Airport Co., Ltd. | −0.32 | −0.04 | 0.04 | −0.09 | 0.37 | −1.39 | −1.03 | −0.08 | −0.79 | 0.60 |
| 600010 | Baoshan Iron & Steel Co., Ltd. | 1.25 | 0.66 | 0.57 | 1.17 | 0.78 | −0.19 | −0.16 | −0.36 | 0.73 | 1.70 |
| 600019 | Baoshan Iron & Steel Co., Ltd. | −1.60 | 0.37 | 1.14 | 5.09 | 7.76 | −1.43 | 0.24 | 1.24 | 2.36 | 0.75 |
| 600029 | China Southern Airlines Firm Limited | −1.01 | −0.85 | −0.13 | 1.37 | 0.71 | 0.46 | 0.81 | 1.28 | 1.05 | 1.63 |
| 600063 | Anhui Wanwei Updated High-Tech Material Industry Co., Ltd. | −2.26 | 0.11 | −0.33 | −0.18 | −0.05 | −3.09 | −0.76 | −1.03 | 1.07 | 0.87 |
| 600098 | Guangzhou Development Group Incorporated | −2.78 | −0.84 | −0.61 | 1.35 | 0.40 | −1.66 | −0.61 | −0.21 | 0.45 | −0.11 |
| 600103 | Qingshan Paper Industry Co., Ltd. | 0.54 | 0.89 | −0.24 | −0.28 | −0.54 | 0.40 | 2.14 | 0.59 | 0.93 | 0.17 |
| 600110 | Nord Investment Co., Ltd. | −1.03 | 0.13 | 0.18 | 0.40 | 0.48 | −2.06 | −0.66 | −1.02 | −0.56 | 0.96 |
| 600115 | China Eastern Airlines Corporation Limited | −0.27 | −0.86 | −1.14 | 3.33 | −0.55 | 0.91 | 0.52 | 0.77 | 0.93 | 0.34 |
| 600160 | Zhejiang Juhua Co., Ltd. | −2.70 | −0.07 | −0.94 | −0.85 | −0.77 | −1.82 | 1.22 | 0.66 | −0.44 | 0.69 |
| 600219 | Nanshan Aluminum Co., Ltd. | −0.45 | 0.00 | −0.22 | 1.16 | 2.32 | −1.52 | −0.74 | −0.43 | 1.95 | 1.14 |
| 600221 | Hainan Airlines Holding Co., Ltd. | −0.96 | 1.44 | 2.02 | 1.93 | 2.02 | −0.79 | 2.09 | 2.32 | 2.32 | 2.61 |
| 600255 | Mengzhou Co., Ltd. | −0.81 | 1.68 | 1.72 | 1.44 | 1.16 | −1.80 | 0.41 | 0.40 | 0.32 | 1.44 |
| 600273 | Zhejiang Jiahua Energy Chemical Industry Co., Ltd. | −0.92 | −0.13 | −0.21 | −0.16 | 0.45 | −0.19 | −0.01 | 0.69 | 0.16 | 1.73 |
| 600307 | Jiuquan Iron & Steel Co., Ltd. | −0.24 | 0.17 | −0.24 | 1.11 | 1.66 | −0.74 | 0.05 | −0.98 | 0.67 | 1.51 |
| 600308 | Huatai Co., Ltd. | −1.11 | 1.17 | 0.91 | −0.02 | 0.32 | −1.57 | 0.72 | 0.45 | 0.72 | 1.06 |
| 600309 | Wanhua Chemical Group Co., Ltd. | −1.00 | −0.37 | −0.30 | 0.51 | 1.75 | −1.41 | 0.39 | 0.34 | 0.78 | 0.88 |
| 600356 | Hengfeng Paper Co., Ltd. | −0.55 | −0.18 | −0.74 | −0.12 | −0.48 | 0.76 | −1.17 | −1.15 | −1.51 | −0.32 |
| 600362 | Jiangxi Copper Firm Limited | −1.95 | −1.53 | −1.81 | 0.19 | −0.10 | −2.36 | 0.07 | −2.22 | −0.16 | −0.22 |
| 600409 | Tangshan Sanyou Chemical Industries Co., Ltd. | −2.05 | −0.68 | −0.56 | −0.52 | −0.48 | −1.64 | −0.04 | 0.05 | 0.58 | 0.33 |
| 600433 | Guangxi Guiguan Electric Power Co., Ltd. | −1.54 | −0.30 | −0.02 | −0.99 | −1.32 | −2.33 | −0.80 | 1.31 | −0.66 | −1.30 |
| 600452 | Fuling Electric Power Industrial Co., Ltd. | −0.22 | 1.11 | 1.22 | 2.26 | 1.47 | −1.78 | −0.73 | 0.81 | 2.29 | 1.10 |
| 600490 | Pengxin Resources Co., Ltd. | −0.18 | 0.11 | −0.11 | −0.01 | −0.11 | −0.88 | −1.16 | −0.81 | −0.43 | 0.41 |
| 600500 | Sinochem International Corporation | −1.65 | −0.56 | −0.64 | 1.98 | 1.78 | −1.62 | 0.61 | −1.21 | −1.11 | −0.61 |
| 600531 | Henan Yuguang Gold & Lead Co., Ltd. | −0.19 | −0.26 | −0.27 | 0.59 | 0.78 | 0.75 | −0.47 | 0.66 | 1.36 | 1.50 |
| 600585 | Anhui Conch Cement Firm Limited | −1.16 | −1.59 | −1.46 | −1.93 | −2.24 | −1.04 | −1.72 | −1.60 | −1.19 | −1.65 |
| 600618 | Shanghai Chlor-Alkali Chemical Co., Ltd. | −0.93 | −0.75 | −0.59 | −0.04 | −0.47 | −0.48 | −0.30 | 0.35 | 0.90 | 0.45 |
| 600623 | Shanghai Huayi Group Corporation Limited | −2.05 | −0.35 | −0.16 | 0.07 | 0.20 | −1.89 | −0.48 | 0.29 | 0.26 | 0.59 |
| 600660 | Fuyao Glass Industry Group Co., Ltd. | −0.57 | −1.34 | −1.95 | −1.99 | −2.20 | −0.91 | −2.26 | −2.29 | −1.89 | −1.94 |
| 600688 | Sinopec Shanghai Petrochemical Firm Limited | 1.99 | −1.09 | −0.47 | −0.04 | −0.63 | 4.03 | 0.50 | 1.00 | 0.86 | 0.80 |
| 600801 | Huaxin Cement Co., Ltd. | −1.20 | −0.63 | 0.13 | 0.83 | 2.17 | −0.32 | 0.16 | 0.06 | 0.24 | −0.53 |
| 600802 | Fujian Cement Inc. | −1.48 | −0.71 | −0.62 | −0.79 | −0.33 | −3.32 | −1.98 | −1.32 | 0.52 | 0.11 |
| 600876 | Luoyang Glass Firm Limited | 1.61 | 0.62 | 0.50 | 0.19 | 0.44 | 0.83 | 1.27 | 0.05 | 1.08 | 1.12 |
| 600881 | Yatai Group Co., Ltd. | −0.88 | −0.25 | 0.40 | −0.36 | −0.25 | −0.47 | −0.37 | 0.85 | 0.37 | 0.20 |
| 600886 | SDIC Power Holdings Co., Ltd. | −1.84 | 0.23 | 0.03 | 0.75 | −0.45 | −1.68 | 0.35 | 0.26 | 1.15 | 0.46 |
| 601111 | Air China Limited | −0.83 | −0.59 | −0.26 | 4.50 | 2.35 | 0.05 | 1.03 | 1.52 | 1.75 | 0.92 |
| 601636 | Kibing Group Co., Ltd. | −0.93 | 0.59 | 0.48 | 0.51 | −0.09 | −1.67 | −0.44 | −0.55 | 0.24 | 0.85 |
| 601991 | Datang International Power Generation Co., Ltd. | 0.22 | 0.27 | 0.50 | −0.14 | 1.16 | 1.07 | 0.83 | 1.16 | 0.92 | 1.24 |
| 601992 | BBMG Corporation | −1.69 | −1.61 | −1.04 | −0.10 | 0.60 | −1.05 | −1.13 | −0.39 | 0.18 | −0.10 |
| 603165 | Rongsheng Environmental Protection Paper Co., Ltd. | −2.60 | −0.56 | −0.30 | 0.61 | 0.77 | −2.61 | −0.20 | 1.01 | 0.69 | 0.93 |
| Annual Average | −1.02 | −0.05 | −0.04 | 0.53 | 0.57 | −1.12 | −0.05 | 0.07 | 0.44 | 0.66 | |
References
- Stern, N. The Logic, Urgency, and Promise of Tackling Climate Change; The MIT Press: Cambridge, MA, USA, 2015. [Google Scholar]
- Chen, L.; Msigwa, G.; Yang, M.; Osman, A.I.; Fawzy, S.; Rooney, D.W.; Yap, P. Strategies to achieve a carbon neutral society: A review. Environ. Chem. Lett. 2022, 20, 2277–2310. [Google Scholar] [CrossRef] [PubMed]
- Matos, P. ESG and Responsible Institutional Investing Around the World: A Critical Review; CFA Institute Research Foundation: Charlottesville, VA, USA, 2020. [Google Scholar]
- In, S.Y.; Schumacher, K. Carbonwashing: A New Type of Carbon Data-Related ESG Greenwashing. 2021. Available online: https://ssrn.com/abstract=3901278 (accessed on 21 September 2021).
- Kim, E.; Lyon, T.P. Greenwash vs. brownwash: Exaggeration and undue modesty in corporate sustainability disclosure. Organ. Sci. 2015, 26, 705–723. [Google Scholar] [CrossRef]
- Rice, J.T. Rainbow-washing. NEULR 2023, 15, 285. [Google Scholar]
- Ben-Lulu, E. “Casting Our Sins Away”: A Comparative Analysis of Queer Jewish Communities in Israel and in the US. Religions 2022, 13, 845. [Google Scholar] [CrossRef]
- Delmas, M.A.; Burbano, V.C. The drivers of greenwashing. Calif. Manag. Rev. 2011, 54, 64–87. [Google Scholar] [CrossRef]
- Zhang, Z.; Chen, H. Media coverage and impression management in corporate social responsibility reports: Evidence from China. Sustain. Account. Manag. Policy J. 2020, 11, 863–886. [Google Scholar] [CrossRef]
- Marquis, C.; Toffel, M.W.; Zhou, Y. Scrutiny, norms, and selective disclosure: A global study of greenwashing. Organ. Sci. 2016, 27, 483–504. [Google Scholar] [CrossRef]
- Passas, I. The Evolution of ESG: From CSR to ESG 2.0. Encyclopedia 2024, 4, 1711–1720. [Google Scholar] [CrossRef]
- Yu, E.P.; Van Luu, B.; Chen, C.H. Greenwashing in environmental, social and governance disclosures. Res. Int. Bus. Financ. 2020, 52, 101192. [Google Scholar] [CrossRef]
- Eliwa, Y.; Aboud, A.; Saleh, A. Board gender diversity and ESG decoupling: Does religiosity matter? Bus. Strategy Environ. 2023, 32, 4046–4067. [Google Scholar] [CrossRef]
- Tashman, P.; Marano, V.; Kostova, T. Walking the walk or talking the talk? Corporate social responsibility decoupling in emerging market multinationals. J. Int. Bus. Stud. 2019, 50, 153–171. [Google Scholar] [CrossRef]
- Pope, S.; Wæraas, A. CSR-washing is rare: A conceptual framework, literature review, and critique. J. Bus. Ethics 2016, 137, 173–193. [Google Scholar] [CrossRef]
- Schons, L.; Steinmeier, M. Walk the talk? How symbolic and substantive CSR actions affect firm performance depending on stakeholder proximity. Corp. Soc. Responsib. Environ. Manag. 2016, 23, 358–372. [Google Scholar] [CrossRef]
- Ruiz-Blanco, S.; Romero, S.; Fernandez-Feijoo, B. Green, blue or black, but washing–What company characteristics determine greenwashing? Environ. Dev. Sustain. 2022, 24, 4024–4045. [Google Scholar] [CrossRef]
- Walker, K.; Wan, F. The harm of symbolic actions and green-washing: Corporate actions and communications on environmental performance and their financial implications. J. Bus. Ethics 2012, 109, 227–242. [Google Scholar] [CrossRef]
- Hyatt, D.G.; Berente, N. Substantive or symbolic environmental strategies? Effects of external and internal normative stakeholder pressures. Bus. Strategy Environ. 2017, 26, 1212–1234. [Google Scholar] [CrossRef]
- Gull, A.A.; Hussain, N.; Khan, S.A.; Mushtaq, R.; Orij, R. The power of the CEO and environmental decoupling. Bus. Strategy Environ. 2023, 32, 3951–3964. [Google Scholar] [CrossRef]
- Venturelli, V.; Pedrazzoli, A.; Pennetta, D.; Gualandri, E. Pinkwashing in the banking industry: The relevance of board characteristics. Res. Int. Bus. Financ. 2024, 67, 102111. [Google Scholar] [CrossRef]
- Bernini, F.; La Rosa, F. Research in the greenwashing field: Concepts, theories, and potential impacts on economic and social value. J. Manag. Gov. 2024, 28, 405–444. [Google Scholar] [CrossRef]
- Forliano, C.; Battisti, E.; de Bernardi, P.; Kliestik, T. Mapping the greenwashing research landscape: A theoretical and field analysis. Rev. Manag. Sci. 2025. [Google Scholar] [CrossRef]
- Galli, D.; Torelli, R.; Caccialanza, A. Sustainability performance and sustainability reporting in SMEs: A love affair or a fight? J. Manag. Organ. 2024, 30, 574–599. [Google Scholar] [CrossRef]
- Talpur, S.; Nadeem, M.; Roberts, H. Corporate social responsibility decoupling: A systematic literature review and future research agenda. J. Appl. Account. Res. 2024, 25, 878–909. [Google Scholar] [CrossRef]
- Du, X. How the market values greenwashing? Evidence from China. J. Bus. Ethics 2015, 128, 547–574. [Google Scholar] [CrossRef]
- Clarkson, P.M.; Li, Y.; Richardson, G.D.; Vasvari, F.P. Revisiting the relation between environmental performance and environmental disclosure: An empirical analysis. Account. Organ. Soc. 2008, 33, 303–327. [Google Scholar] [CrossRef]
- Hawn, O.; Ioannou, I. Mind the gap: The interplay between external and internal actions in the case of corporate social responsibility. Strateg. Manag. J. 2016, 37, 2569–2588. [Google Scholar] [CrossRef]
- Bothello, J.; Ioannou, I.; Porumb, V.A.; Zengin Karaibrahimoglu, Y. CSR decoupling within business groups and the risk of perceived greenwashing. Strateg. Manag. J. 2023, 44, 3217–3251. [Google Scholar] [CrossRef]
- Hu, X.; Hua, R.; Liu, Q.; Wang, C. The green fog: Environmental rating disagreement and corporate greenwashing. Pac.-Basin Financ. J. 2023, 78, 101952. [Google Scholar] [CrossRef]
- Chatterji, A.K.; Durand, R.; Levine, D.I.; Touboul, S. Do ratings of firms converge? Implications for managers, investors and strategy researchers. Strateg. Manag. J. 2016, 37, 1597–1614. [Google Scholar] [CrossRef]
- Chen, J.Z.; Li, Z.; Mao, T.; Yoon, A. Global versus Local ESG Ratings: Evidence from China. Account. Rev. 2025, 1–32. [Google Scholar] [CrossRef]
- Zhou, Z.; Zhang, T.; Wen, K.; Zeng, H.; Chen, X. Carbon risk, cost of debt financing and the moderation effect of media attention: Evidence from Chinese companies operating in high-carbon industries. Bus. Strategy Environ. 2018, 27, 1131–1144. [Google Scholar] [CrossRef]
- Liao, F.; Sun, Y.; Xu, S. Financial report comment letters and greenwashing in environmental, social and governance disclosures: Evidence from China. Energ. Econ. 2023, 127, 107122. [Google Scholar] [CrossRef]
- Bauer, M.W. Content Analysis. An Introduction to its Methodology—By Klaus Krippendorff From Words to Numbers. Narrative, Data and Social Science—By Roberto Franzosi. Br. J. Sociol. 2007, 58, 329–331. [Google Scholar] [CrossRef]
- Jain, K.; Tripathi, P.S. Mapping the environmental, social and governance literature: A bibliometric and content analysis. J. Strategy Manag. 2023, 16, 397–428. [Google Scholar] [CrossRef]
- Liu, Z.; Cheng, Q. Research on influencing factors of carbon information disclosure quality in China’s power industry. Environ. Sci. Pollut. R. 2023, 30, 20185–20202. [Google Scholar] [CrossRef] [PubMed]
- Luo, L.; Tang, Q. Does voluntary carbon disclosure reflect underlying carbon performance? J. Contemp. Account. Econ. 2014, 10, 191–205. [Google Scholar] [CrossRef]
- Bui, B.; de Villiers, C. Carbon emissions management control systems: Field study evidence. J. Clean. Prod. 2017, 166, 1283–1294. [Google Scholar] [CrossRef]
- Pitrakkos, P.; Maroun, W. Evaluating the quality of carbon disclosures. Sustain. Account. Manag. Policy J. 2020, 11, 553–589. [Google Scholar] [CrossRef]
- Karim, A.E.; Albitar, K.; Elmarzouky, M. A novel measure of corporate carbon emission disclosure, the effect of capital expenditures and corporate governance. J. Environ. Manag. 2021, 290, 112581. [Google Scholar] [CrossRef]
- Baier, P.; Berninger, M.; Kiesel, F. Environmental, social and governance reporting in annual reports: A textual analysis. Financ. Mark. Inst. Instrum. 2020, 29, 93–118. [Google Scholar] [CrossRef]
- Sun, X.; Che, T.; Ma, X. Conforming Behavior in Corporate Carbon Disclosure: Identification, Valuation Loss, and Mechanism. China Ind. Econ. 2023, 132–150. Available online: https://ciejournal.ajcass.com/UploadFile/Issue/201606280001/2023/2//20230213102744WU_FILE_0.pdf (accessed on 17 February 2023).
- Zumente, I.; Lāce, N. ESG Rating—Necessity for the Investor or the Company? Sustainability 2021, 13, 8940. [Google Scholar] [CrossRef]
- Del Giudice, A.; Rigamonti, S. Does audit improve the quality of ESG scores? Evidence from corporate misconduct. Sustainability 2020, 12, 5670. [Google Scholar] [CrossRef]
- Berg, F.; Kölbel, J.F.; Rigobon, R. Aggregate confusion: The divergence of ESG ratings. Rev. Financ. 2022, 26, 1315–1344. [Google Scholar] [CrossRef]
- Escrig-Olmedo, E.; Fernández-Izquierdo, M.Á.; Ferrero-Ferrero, I.; Rivera-Lirio, J.M.; Muñoz-Torres, M.J. Rating the raters: Evaluating how ESG rating agencies integrate sustainability principles. Sustainability 2019, 11, 915. [Google Scholar] [CrossRef]
- He, Y.; Xu, Y.; Pang, Y.; Tian, H.; Wu, R. A regulatory policy to promote renewable energy consumption in China: Review and future evolutionary path. Renew. Energ. 2016, 89, 695–705. [Google Scholar] [CrossRef]
- Luo, L.; Lan, Y.C.; Tang, Q. Corporate incentives to disclose carbon information: Evidence from the CDP Global 500 report. J. Int. Financ. Manag. Account. 2012, 23, 93–120. [Google Scholar] [CrossRef]
Disclaimer/Publisher’s Note: The statements, opinions and data contained in all publications are solely those of the individual author(s) and contributor(s) and not of MDPI and/or the editor(s). MDPI and/or the editor(s) disclaim responsibility for any injury to people or property resulting from any ideas, methods, instructions or products referred to in the content. |
© 2025 by the authors. Licensee MDPI, Basel, Switzerland. This article is an open access article distributed under the terms and conditions of the Creative Commons Attribution (CC BY) license (https://creativecommons.org/licenses/by/4.0/).