1. Introduction
Transportation accounts for a significant share of global energy consumption and remains one of the primary sources of greenhouse gas (GHG) emissions, exacerbating the challenges associated with climate change [
1]. The International Energy Agency (IEA) reports that fossil fuel combustion for transportation—particularly gasoline and diesel—constitutes a major contributor to global carbon dioxide (CO
2) emissions, representing approximately 23% of energy-related emissions, with road transport responsible for nearly three-quarters of this figure [
2]. Intensified by rapid urbanization, the escalating demand for personal mobility, and the growth of international trade, the environmental footprint of transportation continues to expand [
3,
4]. In response, there is a mounting imperative to pursue sustainable, low-emission transportation solutions through innovations in vehicle technologies, the adoption of alternative fuels, and the development of transformative policy interventions.
Amidst these developments, autonomous vehicle (AV) technologies are poised to profoundly reshape the transportation sector. Fully and partially automated vehicles offer the promise of enhanced safety, operational efficiency, and expanded mobility access. However, they also introduce complex and uncertain energy implications. On the one hand, automation has the potential to improve fuel efficiency through smoother driving profiles, reduced congestion, and optimized routing [
5,
6]. On the other hand, the additional energy demands associated with sensing, computing, and communication systems, as well as possible induced travel demand, may offset some of these gains [
7]. Furthermore, fleet-level dynamics, including vehicle-to-vehicle interactions and traffic flow modifications, are expected to play a critical role in shaping the net energy outcomes of AV deployment [
8].
Recent studies emphasize the importance of evaluating not only individual vehicle-level energy changes but also the broader system-level effects that arise from varying degrees of vehicle automation penetration [
9]. The nuanced relationship between vehicle automation, traffic conditions, and powertrain efficiency necessitates integrated modeling approaches that capture these multifaceted interactions. Therefore, this study constructs a comprehensive simulation framework that integrates microscopic traffic simulation with detailed powertrain modeling to assess the fuel efficiency impacts across different automation levels, road types, and vehicle categories.
This paper seeks to fill critical gaps in the literature by providing a holistic analysis of the energy impacts associated with full and partial vehicle automation. The simulation framework developed herein captures both the macroscopic effects on traffic flow and the microscopic variations in vehicle energy performance, offering new insights into how automation technologies might influence transportation energy consumption at scale. Ultimately, this research contributes to a more informed understanding of the environmental trade-offs of AV deployment and offers implications for policy development, vehicle design, and infrastructure planning.
The remainder of this paper is organized as follows:
Section 2 presents a comprehensive literature review on the energy impacts of vehicle automation.
Section 3 details the simulation platform and methodology used to evaluate the effects of automation on vehicle energy consumption.
Section 4 discusses the simulation results and key findings. Finally,
Section 5 concludes the paper and offers policy recommendations based on the study’s insights.
2. Literature Review
In this section, a literature review on the implications of vehicle automation is conducted. It starts with the implications of vehicle automation technologies on mobility and then extends to vehicle energy.
Existing studies have investigated mobility implications of vehicle automation, such as changes in vehicle miles traveled, switch of mobility service mode, etc. Wadud et al. [
6] estimated that a vehicle’s miles traveled will be increased due to the reduced travel cost on drivers’ time, which ranged from a 4% increase in low-automation to 60% in full automation. They predicted that an increase in vehicle miles traveled due to new user groups, e.g., those with a disability, could be 2%~10% depending on current demographics and other factors of population. Wadud also summarized existing studies on estimates of increased VMT due to new service models, such as car sharing, which was about 10% in the existing literature [
10,
11,
12]. Another trend of research on the mobility implications of vehicle automation is automated mobility districts. Fagnant and Kockelman [
5] evaluated the mobility and environmental advantages of shared autonomous vehicles (SAVs) by employing an agent-based simulation to model traveler movements in a grid-based urban environment. Similarly, the International Transport Forum [
13] analyzed the potential effects of a fully autonomous shared fleet by simulating interactions among travelers, vehicles, and dispatchers in Lisbon, Portugal. Zhang et al. [
8] extended this research by incorporating ridesharing into an agent-based framework to assess the efficiency and benefits of SAV systems. Meanwhile, Boesch et al. [
14] investigated the correlation between autonomous fleet size and travel demand in Zurich, Switzerland. Further contributions include Dia et al. [
15], who applied an agent-based model to a small-scale road network in Melbourne, Australia, to assess travel demand under various shared autonomous mobility scenarios. Chen et al. [
16] developed a simulation environment to study the operational dynamics of shared autonomous electric vehicles (SAEVs), considering factors such as vehicle range and charging infrastructure. While existing SAV literature predominantly focuses on quantifying mobility-related outcomes, there remains a notable gap in research assessing the energy impacts of SAVs—particularly at the district scale, where such systems could influence broader regional travel patterns.
There are limited existing studies looking at the fuel efficiency of vehicle automation, particularly on an individual vehicle and vehicle fleet level. A report from the Department of Energy is by far the most comprehensive study focusing on the energy and fuel efficiency implications of vehicle automation [
17]. Stephens et al. conducted an extensive literature review on the fuel efficiency of vehicles due to automation and summarized a range/upper and lower bound of fuel efficiency benefit for each type of automation technology. Specifically, they summarized that driving profile smoothing will improve fuel efficiency by 5–23% depending on highway or city driving at peak/off peak hours, have a 2–6% fuel efficiency improvement for intersection communication, 12.5–25% fuel savings for platooning, etc. Although the review is comprehensive, the estimates and results are only applicable to analysis at an aggregated level. For consumer-level fuel savings of vehicle automation, there are limited studies.
While early research on CAVs emphasized travel demand impacts (e.g., Fagnant & Kockelman, [
5]), recent studies (2020–2024) have increasingly quantified energy efficiency effects. For instance, Ma et al. [
18] demonstrated CAV platooning reduces energy use by 12–18% on highways via aerodynamic drafting, while Li et al. [
19] noted marginal gains (<5%) in urban settings due to frequent stops. Our framework advances these works by integrating powertrain-specific interactions—a gap in prior fleet-level analyses [
7]. Unlike trajectory-only approaches [
20], we couple traffic microsimulation with powertrain modeling to capture energy trade-offs across automation levels.
Accurately assessing the fuel savings enabled by vehicle automation requires two critical steps. First, it is necessary to analyze changes in driving trajectories resulting from automation. Simulation is the most widely adopted method for evaluating such trajectory modifications. Second, a robust model must be employed to quantify how these altered trajectories affect fuel efficiency. Energy analysis of vehicle systems typically employs two methodological approaches: statistical modeling and powertrain modeling. While statistical methods aim to establish quantitative relationships between parameters, they are unsuitable for this study due to their limited ability to capture dynamic driving behaviors. In contrast, powertrain modeling utilizes high-resolution vehicular movement data (at one-second granularity) to estimate energy consumption based on physical principles and transmission efficiency assumptions. This study addresses a key gap in the literature by developing an integrated traffic-powertrain simulation framework. This framework evaluates the energy impacts of vehicle automation across a fleet, considering varying automation levels, road types, and vehicle compositions.
3. Methodology
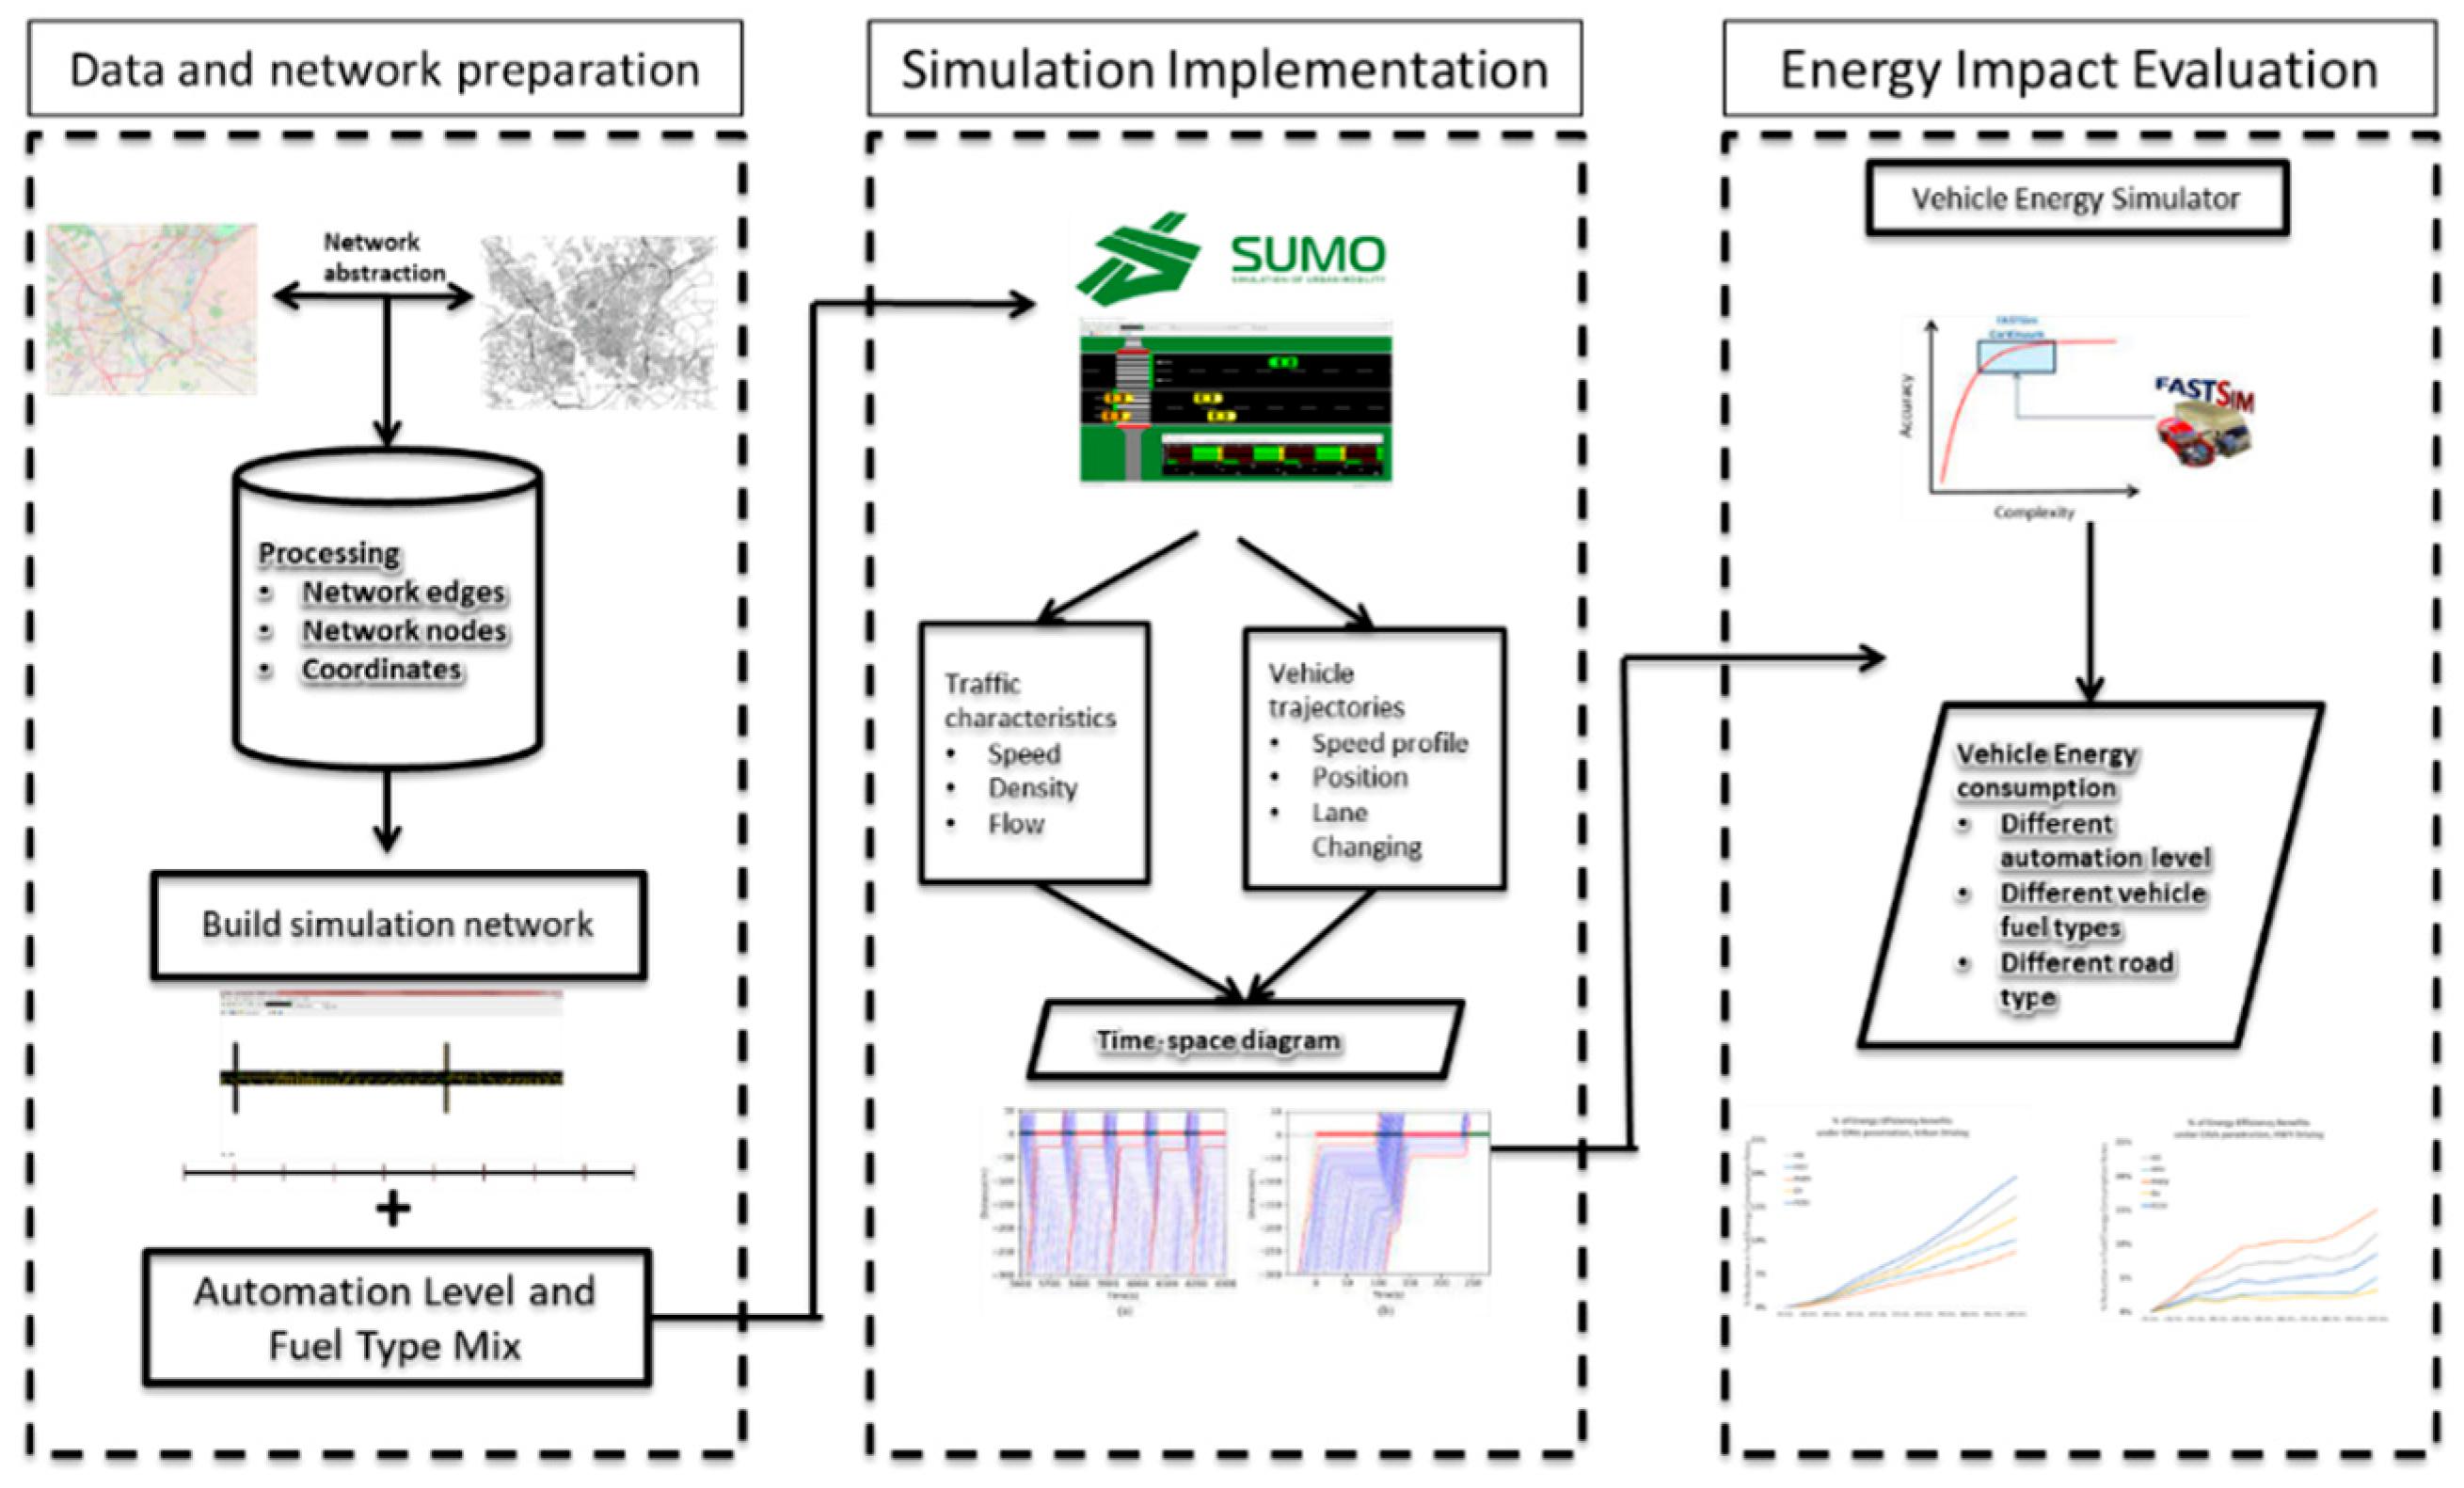
Figure 1 illustrates the integrated workflow of this study, encompassing the full process from data preparation to the final assessment of energy impacts under different levels of vehicle automation. The methodological framework is designed to systematically capture both traffic flow dynamics and vehicle-level energy consumption by combining traffic simulation with powertrain modeling. This section outlines the steps in detail.
The study begins with the preparation of input data, including detailed specifications of the road network and the vehicle fleet composition, stratified by automation levels. The road networks are designed to represent typical urban and highway driving conditions. For urban scenarios, as depicted in
Figure 2, a network segment includes a major arterial road intersected by a smaller branch road, controlled by traffic signals at key intersections. To ensure robustness and generalizability, four analogous network segments are developed for both urban and highway conditions, capturing diverse geometric and operational characteristics such as intersection densities, speed limits, and traffic control types.
Parallel to the road network preparation, vehicle fleet scenarios are generated, with varying automation penetration rates from 0% (fully human-driven) to 100% (fully autonomous vehicles). Passenger vehicles are further differentiated by fuel type, including internal combustion engine vehicles (ICEVs), Hybrid Electric Vehicles (HEVs), and battery electric vehicles (BEVs). Although the fuel type does not directly affect the vehicle interactions in the traffic simulation, it plays a critical role in the subsequent energy consumption evaluation. Given that a vehicle’s energy usage depends not only on its trajectory but also on its powertrain characteristics, a single driving trajectory can result in substantially different energy consumption profiles across different fuel types.
The developed road network models and vehicle fleet configurations are imported into the Simulation of Urban Mobility (SUMO) platform, an open-source microscopic traffic simulation environment widely adopted for transportation research. SUMO enables fine-grained modeling of vehicle movements, including car-following, lane-changing, and traffic signal interactions. In this study, vehicle automation is modeled primarily through modifications to car-following parameters, such as reduced time headways and smoother acceleration/deceleration profiles, reflecting the improved driving behaviors anticipated with higher automation levels. Even when using a consistent underlying car-following model (e.g., Krauss or IDM models), distinct vehicle trajectories emerge as a function of automation level, resulting from changes in vehicle spacing, speed harmonization, and traffic flow stability.
The output from the traffic simulations—detailed vehicle trajectories including time, speed, and position data—is then imported into the Future Automotive Systems Technology Simulator (FASTSim). FASTSim is a lightweight, physics-based model developed by the National Renewable Energy Laboratory (NREL) for estimating vehicle energy consumption and performance. Each trajectory is paired with a corresponding vehicle powertrain model (ICEV, HEV, or BEV) to assess the energy consumption accurately. By maintaining consistent trajectories across different fuel types, the analysis isolates the effects of vehicle automation from those of powertrain characteristics.
This integrated framework allows for a systematic comparison of vehicle energy consumption across different combinations of driving environments (urban versus highway), automation penetration levels, and vehicle technologies. The approach enables the identification of patterns and trade-offs that are critical for understanding the broader energy impacts of emerging automated vehicle fleets.
Traffic simulation platforms play a crucial role in modeling advanced mobility systems. Among available tools, the Simulation of Urban Mobility (SUMO) platform has emerged as a prominent open-source solution for microscopic traffic analysis [
21]. This versatile simulation environment supports multi-modal transportation modeling, including private vehicles, public transit, and pedestrian movements, with extensible architecture for custom vehicle control strategies. The platform’s capabilities have been demonstrated in various transportation research applications. For instance, researchers have employed SUMO to analyze adaptive traffic signal systems [
22] and assess connected vehicle technologies [
23]. Its microscopic simulation engine generates detailed vehicle trajectory data at one-second intervals, enabling precise analysis of traffic dynamics and energy consumption patterns [
24].
Developed by the National Renewable Energy Laboratory (NREL), the Future Automotive Systems Technology Simulator (FASTSim) represents an open-access modeling tool designed for comparative analysis of vehicle powertrain systems [
25]. This versatile platform employs a spreadsheet-based architecture to facilitate efficient evaluation of alternative powertrain configurations across both light- and heavy-duty vehicle applications. FASTSim’s streamlined approach enables researchers to rapidly assess the potential benefits of emerging technologies while estimating their cost implications. The FASTSim model will utilize a physical-based model to evaluate second-level vehicle energy consumption. FASTSim accommodates a comprehensive range of powertrain configurations, including internal combustion engine vehicles (ICEVs), Hybrid Electric Vehicles (HEVs), plug-in hybrids (PHEVs), battery electric vehicles (BEVs), natural gas vehicles (NGVs), and hydrogen fuel cell vehicles (FCEVs). The platform provides default vehicle templates for each category while allowing full customization of parameters—enabling users to modify vehicle specifications, component characteristics, and performance attributes. This flexibility makes FASTSim particularly valuable for comparative analysis of alternative powertrain technologies under varying operational conditions.
3.1. Model Setup of SUMO
Due to distinct driving characteristics of autonomous vehicles on urban and highway roads, traffic and energy simulations are conducted for urban and highway roads separately. For urban roads, a 1-mile hypothetical arterial with 10 signalized intersection is set up in SUMO (as shown in
Figure 1). The arterial has six lanes in two ways. Similarly, a 1-mile one-way 3-lane hypothetical highway with one on-ramp and one off-ramp is set up in SUMO. Hypothetical original and destination vehicle travel demands were generated. Level of service (LOS), ranging from A to F, is a quantitative measure used to relate the quality of motor vehicle traffic services based on performance measures like vehicle speed, density, congestion, etc. As indicated in the Highway Capacity Manual, level C is the target LOS for most urban and highway areas. Therefore, original and destination travel demands are generated to reflect the vehicle to capacity (
v/
c) ratio with level C as LOS. The output of the SUMO simulation is the second-by-second vehicle trajectories for each simulated vehicle on the arterial roads. These trajectories serve as an input to the FASTSim powertrain simulation.
Autonomous driving is realized by implementing various vehicle movement rules, which is a common approach adopted in other autonomous driving simulation studies. Thus, to a certain extent, autonomous driving simulation is constrained by vehicle movement rules and parameters defined in each simulation model. In this project, we represent vehicle automation based on key vehicle car-following parameters as defined in the SUMO model. Specifically, for human-driven vehicles, these parameters include minimum time headway (1.5 s), max/min allowed acceleration (±3.5 m/s
2), driver imperfection/randomness in acceleration (0.5), reaction time (1 s), and speed factor (±15% speed variation). For autonomous vehicles, the parameters are minimum time headway (0.5 s), max/min allowed acceleration (±2.5 m/s
2), driver imperfection/randomness in acceleration (0.05), reaction time (0.1 s), and speed deviation (±0.5 km/h). In
Appendix A of the paper, we provide a mapping relationship between the level of automation and car-following parameter adjustment based on the literature.
We acknowledge that autonomous driving could have other representations that are not considered in this simulation work. However, this limitation has to be addressed by developing more realistic autonomous driving simulation tools, which are not available yet.
3.2. Model Setup of FASTSim
FASTSim requires a range of input parameters encompassing both drivetrain-component specifications and broader vehicle design characteristics. Key inputs include aerodynamic drag coefficient, frontal area, vehicle mass, rolling resistance coefficient, and drivetrain efficiencies. Additionally, operational characteristics such as engine maps and accessory loads are incorporated to enable the accurate estimation of fuel consumption and vehicle performance metrics. FASTSim outputs include vehicle efficiency (e.g., miles per gallon or equivalent), acceleration performance (e.g., 0–60 mph time), component-level energy flows, cost estimates, and, for electrified vehicles, battery degradation over time.
For the baseline scenario in this study, a Toyota Camry powered by an internal combustion engine (ICE) was selected as the representative vehicle model, reflecting its prominence as one of the best-selling passenger cars in the U.S. market. The vehicle parameters were derived from publicly available datasets and calibrated against manufacturer specifications and EPA test cycles in FASTSim (see
Appendix A) to ensure the fidelity of simulation results. While this study focused on a single powertrain for conceptual clarity, future work will expand to heterogeneous fleets with detailed cross-powertrain sensitivity analysis.
The modeling process involves importing 1 Hz driving trajectories generated by the traffic microsimulation software Simulation of Urban Mobility 24.0.1 (SUMO 24.0.1). FASTSim utilizes these trajectories to compute instantaneous and cumulative fuel consumption, vehicle speed profiles, and total driving distance for each simulated vehicle. Subsequently, individual vehicle outputs are aggregated to estimate fleet-level average fuel efficiency and to analyze shifts in energy consumption trends under different automation scenarios.
To comprehensively evaluate the energy impacts of automation across a range of propulsion technologies, the framework was extended to simulate traffic compositions featuring multiple vehicle types, including internal combustion engine vehicles (ICEs), Hybrid Electric Vehicles (HEVs), Plug-in Hybrid Electric Vehicles (PHEVs), battery electric vehicles (EVs), and Fuel Cell Electric Vehicles (FCEVs). This multi-vehicle approach enables a more robust assessment of how automation may differentially influence fleet-wide energy consumption depending on underlying drivetrain technologies.
4. Results
Figure 3 (left) presents the analysis of energy efficiency outcomes for five distinct powertrain technologies—internal combustion engine (ICE), Hybrid Electric Vehicle (HEV), Plug-in Hybrid Electric Vehicle (PHEV), Battery Electric Vehicle (EV), and Fuel Cell Electric Vehicle (FCEV)—operating under urban driving conditions. The vertical axis quantifies the “% Reduction in Fuel/Energy Consumption Rates,” ranging from 0% to 25%, while the horizontal axis represents the fleet penetration rate of Connected and Autonomous Vehicles (CAVs), increasing from 0% (baseline, no automation) to 100% (full automation). Each line plotted corresponds to a specific vehicle technology, enabling a comparative analysis across drivetrain types.
A consistent pattern emerges wherein the reduction in energy consumption rates generally increases with higher levels of CAV penetration. However, the magnitude and shape of the improvement trajectories vary notably by powertrain type. ICE vehicles demonstrate the smallest gains in energy efficiency as automation levels rise, suggesting limited synergistic benefits between traditional engine operation and automation-enhanced driving behaviors. In contrast, FCEVs exhibit the most substantial improvements, with energy savings approaching the upper bound of the observed range. This pronounced response may be attributed to the enhanced potential for optimizing fuel cell operation during smoother and more predictable driving patterns enabled by CAV technologies.
EVs and PHEVs reveal nearly parallel improvement trends, reflecting the electric powertrain’s inherent efficiency advantages under automation-facilitated conditions such as reduced stop-and-go traffic and smoother acceleration profiles. HEVs also experience notable energy efficiency improvements, although their gains are somewhat more modest than those observed for EVs and PHEVs, yet still exceed those of ICE vehicles.
These results are consistent with findings reported in the existing literature. For example, Gonder et al. [
26] demonstrated that eco-driving strategies—analogous to the smoother driving enabled by CAVs—can yield fuel consumption reductions of 5–20%, depending on vehicle type and driving conditions. Similarly, Wu et al. [
24] found that CAV-enabled smoothing of traffic flows could lead to energy savings of approximately 15–25% for electric and hybrid vehicles in urban environments. Moreover, Brown et al. [
7] emphasized that the benefits of automation are particularly pronounced for vehicles with electrified powertrains, due to their higher sensitivity to variations in acceleration and deceleration patterns.
By aligning with these prior studies, the present results further substantiate the argument that automation can significantly enhance energy efficiency across a range of vehicle technologies, particularly for advanced powertrains. Additionally, our inclusion of a broader array of vehicle types—including FCEVs—provides a more comprehensive assessment, supplementing earlier works that have predominantly focused on ICEs, HEVs, and EVs. These insights reinforce the importance of jointly considering vehicle electrification and automation as complementary pathways to achieving substantial energy savings in future transportation systems.
Figure 3 (middle) illustrates the energy efficiency implications of varying levels of automation across different vehicle types under highway driving conditions. The analysis reveals consistent patterns: energy savings increase with higher automation levels across all vehicle types. Notably, Plug-in Hybrid Electric Vehicles (PHEVs) exhibit the most substantial improvement in energy efficiency, while Electric Vehicles (EVs) demonstrate the least enhancement. Fuel Cell Electric Vehicles (FCEVs) show significant energy efficiency improvements, surpassing PHEVs, despite the latter’s reliance on both internal combustion and electric power.
Interestingly, the maximal energy efficiency gains for internal combustion engine vehicles (ICEVs), Hybrid Electric Vehicles (HEVs), EVs, and FCEVs are halved when transitioning from urban to highway driving conditions. For instance, EVs show potential energy savings of up to 4% under highway driving conditions at 100% automation penetration, compared to 13% for urban driving. This result aligns with prior studies, where highway driving conditions—typically marked by higher speeds and smoother traffic flows—present fewer opportunities for substantial energy savings. In these conditions, the more consistent speed profiles typical of highway driving lead to less pronounced benefits from automation compared to urban driving, where frequent stop-and-go conditions provide greater potential for fuel efficiency improvements due to smoother decelerations and accelerations enabled by CAV technologies.
An exception to this general trend is observed with PHEVs, which exhibit energy savings of up to 15% under highway driving conditions at full automation, compared to 8% in urban conditions. This distinctiveness arises from the unique nature of PHEVs, which can draw energy from both an internal combustion engine and a battery. On highways, PHEVs are able to optimize their energy use by preferentially relying on their electric motor during low-speed phases and their internal combustion engine during high-speed phases, thereby maximizing energy savings in both scenarios. This behavior has been corroborated by multiple studies, which demonstrated that the ability to dynamically switch between power sources provides PHEVs with an inherent advantage in fuel savings on highways, particularly when coupled with the smoother, more predictable traffic conditions.
These findings are consistent with previous studies on vehicle automation. For instance, a review by Taiebat et al. [
27] indicated that highway driving conditions typically result in smaller energy savings compared to urban settings, as automated systems have less potential to optimize fuel consumption at constant speeds. Additionally, a study by He et al. [
28] found that the potential fuel savings from automation were more pronounced in urban environments, where the constant fluctuation in speed allowed for greater energy-saving opportunities. On the other hand, studies focusing on hybrid and electric vehicles highlighted that vehicles capable of blending electric and combustion power, such as PHEVs, experienced more significant improvements in fuel efficiency under automated highway driving conditions, a trend that is well supported by our results.
The observed disparities in energy efficiency benefits across powertrains—particularly the lower gains for HEVs compared to BEVs and FCEVs—can be attributed to fundamental differences in their propulsion architectures. HEVs, while improving upon conventional ICE vehicles, face inherent limitations due to their small battery capacity and reliance on internal combustion engines. Their restricted regenerative braking capability (a consequence of smaller batteries) reduces potential energy recovery during frequent automation-induced deceleration, while their ICE components exhibit diminishing returns under smoothed speed profiles. In contrast, BEVs and FCEVs capitalize more effectively on automation’s predictability: BEVs optimize regenerative braking and minimize battery drain through consistent acceleration/deceleration, while FCEVs leverage route-preview capabilities to avoid low-efficiency operational modes. These systemic advantages highlight how automation’s energy benefits are amplified in fully electrified powertrains, though detailed quantification of these mechanisms warrants future powertrain-specific studies.
To assess the overall energy benefits of autonomous driving in average daily conditions, we amalgamate the results from both driving conditions using a weighted-average approach in
Figure 3 (right), specifically employing a combination of 45% highway values and 55% urban values. This methodology aligns with the approach employed by Stephens et al. [
17] in estimating fuel use bounds for connected and automated vehicles. The results underscore that while PHEV and EV exhibit the least energy savings in urban and highway driving, respectively, Hybrid Electric Vehicles (HEVs) consistently manifest the lowest energy savings across various automation levels when considering both urban and highway driving scenarios. For highway driving, the diminished potential of electric motors in achieving energy efficiency gains with automation is noted [
17]. Furthermore, the significantly smaller battery size of HEVs compared to EVs contributes to HEVs extracting more energy savings from internal combustion engine utilization relative to EVs. A parallel rationale can be applied to urban driving conditions. One thing we need to point out is that, given the energy analysis above, there is uncertainty on the impact of automation on transportation patterns. While smoother traffic flow may shorten trips via optimized routing [
27], induced demand from empty repositioning or increased accessibility could offset these gains [
8]. Our results suggest net energy savings persist despite potential distance increases, as efficiency improvements per vehicle-km outweigh VMT growth (<10% in our scenarios).
5. Conclusions
The emergence of autonomous vehicle technologies signifies a pivotal epoch in the automotive industry, heralding unparalleled progress in safety, efficiency, and mobility. Nevertheless, with the onset of this transformative era, meticulous scrutiny of the energy implications linked to autonomous vehicles becomes imperative. In this study, we develop a traffic and vehicle energy simulation platform that can be used to evaluate energy efficiency impacts of vehicle automation at different automation levels on various fleet- and road-type mixes. The energy efficiency impacts of vehicle automation on vehicle fleets are particularly important to understand
The comprehensive analysis sheds light on the intricate interplay between powertrain types, automation levels, and energy efficiency in both urban and highway driving conditions. The discernible trend indicates that an increased presence of Connected and Autonomous Vehicles (CAVs) is associated with heightened energy efficiency across diverse vehicle technologies. Notably, Fuel Cell Electric Vehicles (FCEVs) exhibit the most substantial improvement, while internal combustion engine (ICE) vehicles show the least pronounced enhancement. The transition from urban to highway driving conditions results in halved maximal energy efficiency enhancements for various vehicle types. Particularly intriguing is the observation that Plug-in Hybrid Electric Vehicles (PHEVs) demonstrate the most significant improvement in energy efficiency under highway driving, leveraging their capacity to draw energy from both internal combustion and battery sources. The weighted-average approach, combining results from both driving conditions, highlights the consistent manifestation of Hybrid Electric Vehicles (HEVs) exhibiting the lowest energy savings across various automation levels. These findings contribute valuable insights into the potential impact of Connected and Autonomous Vehicle technology adoption on energy consumption, emphasizing the nuanced dynamics among different vehicle types in urban and highway settings.
To harness the energy efficiency benefits of vehicle automation while mitigating potential socioeconomic disruptions, policymakers should adopt a three-tiered approach: (1) technology incentivization through targeted subsidies for CAVs with demonstrated eco-driving capabilities (e.g., platooning-enabled BEVs) and congestion-based pricing to curb induced demand; (2) equity safeguards such as mandates for shared CAV services in transit deserts and low-income zones to prevent mobility disparities; and (3) system integration via coordination with urban planning to prioritize CAV corridors where energy savings are maximized (e.g., high-congestion arterials) while discouraging sprawl. These measures would ensure that automation’s energy gains—which our study shows are most pronounced for electrified powertrains—translate into net societal benefits without exacerbating existing inequalities.
We acknowledge that the current research’s limitations could motivate future research directions: (1) our study considers the limited number of road types in the real-world road geometry; (2) complex vehicle-following models can be considered particularly between human-driven and automated vehicles at various level of automation; (3) integrate heavy-duty vehicles to quantify how heterogeneous traffic compositions influence automation’s energy efficiency gains, especially in congested urban corridors or highway merge scenarios. Additionally, this study primarily evaluated fully autonomous vehicles (SAE Levels 4–5), while current deployments focus on partial automation (Levels 2–3). Transitional control behaviors in Level 3 systems—such as disengagement events or driver takeovers—may introduce variability in driving patterns and energy efficiency, a factor not captured here [
9,
29]. Future work should incorporate mixed-fleet scenarios with partial automation to assess how control transitions impact energy outcomes, particularly in real-world edge cases. Additionally, while this study’s simplified road network enabled controlled analysis of automation’s energy impacts, future work should validate these findings using real-world networks (e.g., NGSIM or OpenStreetMap data) to account for complexities like adaptive signals, pedestrian interactions, and irregular topologies.


