Article

Sustainable Fisheries and Non-Target Species Management: A Seasonal and Depth-Based Study in the Deep-Sea Fisheries of Antalya Bay

1
Department of Fisheries Technology and Management, Faculty of Aquatic Science, Istanbul University, 34134 İstanbul, Türkiye
2
Institute of Graduate Studies in Sciences, Istanbul University, 34116 İstanbul, Türkiye
*
Author to whom correspondence should be addressed.
Sustainability 2025, 17(11), 5040; https://doi.org/10.3390/su17115040
Submission received: 20 March 2025 / Revised: 22 May 2025 / Accepted: 24 May 2025 / Published: 30 May 2025
(This article belongs to the Topic Conservation and Management of Marine Ecosystems)

Abstract

Deep-sea trawling in the Mediterranean Sea, while economically significant, has profound ecological implications due to high discard rates and the practice’s impact on deep-sea biodiversity. This study examines the composition of discards and bycatch in Antalya Bay, a key deep-sea fishing area in the Eastern Mediterranean, during a commercial fishing season, focusing on seasonal and depth-related variations. Data were collected from deep-sea bottom trawl operations conducted between September 2016 and April 2017, analyzing species diversity and catch composition in terms of discarded and bycatch species. The results revealed an average discard rate of 70.7% of the total catch, with significant seasonal fluctuations. In total, 75 species were identified, comprising 48 Osteichthyes, 11 Elasmobranchii, 10 Crustacea, 4 Mollusca, 1 Brachiopoda, and 1 Echinodermata. Discarded species primarily consisted of juveniles of commercially valuable species (Merluccius merluccius and Lepidorhombus whiffiagonis), endangered elasmobranchs, and non-target benthic invertebrates. Depth-stratified analysis indicated that higher discard ratios and greater biodiversity loss occur at depths between 200 and 700 m, where slow-growing species and vulnerable deep-sea assemblages dominate. CPUE estimates for target, bycatch, and discarded species were calculated as 72.26, 145.12, and 385.52 kg/h, and CPUA values were calculated as 0.79, 1.59, and 2.92, respectively. These findings underscore the disproportionate impact of bottom trawling on deep-sea ecosystems and highlight the need for sustainable fisheries management strategies.

1. Introduction

Deep-sea fishing, particularly in the Mediterranean and Atlantic Oceans, represents a critical intersection of economic activity and ecological vulnerability. The annual production from deep-sea fishing areas exceeds one million tons, underscoring the significant contribution of these regions to global fisheries. However, the communities inhabiting deep-sea ecosystems are characterized by their extreme sensitivity, long life spans, and slow recovery rates, making them particularly susceptible to overexploitation and habitat degradation [1]. Deep-sea fishing generally refers to fishing operations carried out at depths greater than 200 m [2,3]. Unlike coastal fisheries, deep-sea trawling requires specialized gear and occurs in less regulated and more sensitive environments, making it a major concern for biodiversity conservation and sustainable management [1]. These ecosystems are primarily exploited through trawl fishing, a method that has become synonymous with high discard rates, especially in the Mediterranean. Bottom trawling is linked to the disposal of a significant portion of the catch, including non-target species, juveniles, and benthic organisms, which are frequently discarded back into the sea when critically injured or dead. The species composition of trawl catches is highly diverse, encompassing teleosts, elasmobranchs, cephalopods, crustaceans (Decapoda and Stomatopoda), and various epifaunal macrobenthic species [4]. The factors influencing discarding practices are multifaceted, including species size, fishing methods, gear selectivity, regulatory frameworks, and market demand. Given the variable nature of bottom trawling, the accurate estimation of discard rates requires extensive spatial and temporal data [5,6,7].
The Mediterranean Sea, one of the world’s most biodiverse marine regions, has been profoundly impacted by intensive trawling activities. Marine communities in this region exhibit high species diversity, but they are increasingly threatened by the ecological consequences of fishing practices [8]. Discarding, which is defined as the practice of returning unwanted catch to the sea, has been identified as a major concern for conservation bodies and the public. The practice contributes to the mortality of juvenile fish and benthic species, as well as the potential loss of biodiversity, thereby undermining the sustainability of marine ecosystems [9]. European Union (EU) fisheries are particularly notorious for their high discard rates, which can be attributed to low-selectivity fishing techniques, excessive fishing effort, and the inadequate enforcement of regulations [10,11]. The European Commission has linked the “discard problem” to poor economic performance and significant disruptions to marine ecosystem functioning, prompting regulatory measures such as the Common Fisheries Policy (CFP) and the Landing Obligation [12].
In the Mediterranean, the main fisheries include bottom trawlers, pelagic trawlers, purse seines, longlines, and small-scale fisheries. Among these, trawl fisheries are the second largest in terms of landings, after small pelagic fisheries [13]. The multispecies and multi-gear nature of Mediterranean fisheries results in highly diverse catches, target species, sorting practices, and discard compositions. This complexity, combined with the high number and dispersion of landing points, makes accurate monitoring, control, and regulation enforcement particularly challenging [11]. The IUCN has highlighted the mixed progress of regional fisheries management organizations (RFMOs) in governing bycatch and discards, with the General Fisheries Commission for the Mediterranean (GFCM) achieving some of the lowest scores in several criteria [14]. Estimates suggest that Mediterranean-wide discards amount to approximately 230,000 tons annually, representing 18.6% of the total catch, with bottom trawling being the primary contributor [7]. Notably, discard ratios for trawls are generally lower in the eastern and southern basins of the Mediterranean, reflecting regional variations in fishing practices and ecosystem dynamics [7]. Deep-sea fishing has gained increasing attention in recent years due to declining stocks in traditional fishing grounds and the economic pressures faced by fishermen. As small pelagic and demersal stocks have become overexploited, fishermen have turned to deeper waters, targeting species such as red shrimp (Aristeus antennatus) and European hake (Merluccius merluccius) at depths of 800–1000 m, particularly in Spanish and Italian waters [1,13]. The growing interest in deep-sea fisheries and research on species composition, diversity, and abundance have increased in the last few decades, especially in the Eastern Mediterranean [15,16,17,18,19,20,21,22,23], including Turkey. There are different studies on the distribution of various species and trawl selectivities in the deep-sea region in Antalya Bay [17,18,19,20,21]. However, none of these studies directly targeted the seasonal and depth-dependent changes of discarded and bycatch species caught in commercial deep-sea trawling. Due to this situation, the volume of data needed for the sustainability and management evaluation of bycatch and discarded species caught in deep-sea commercial fishing in Antalya Bay cannot be met. Therefore, the findings of this study are of vital importance within the scope of the sustainable management of deep-sea trawling in the region and the protection of species in the future.
In the deep-sea offshore regions of Antalya Bay, which are threatened by overfishing and ecosystem degradation, constituting serious threats to marine biodiversity, the current study aims to provide more information about the discard and bycatch of target species, particularly shrimps. The Mediterranean Sea’s fisheries resources are under a lot of fishing pressure, which has led to habitat loss, stock overexploitation, and changes in trophic interactions. These issues require immediate scientific attention. This work adds to our knowledge of the ecological effects of deep-sea trawl fisheries and the sustainability of target species by examining seasonal and depth-related variations in fishing activity.

2. Materials and Methods
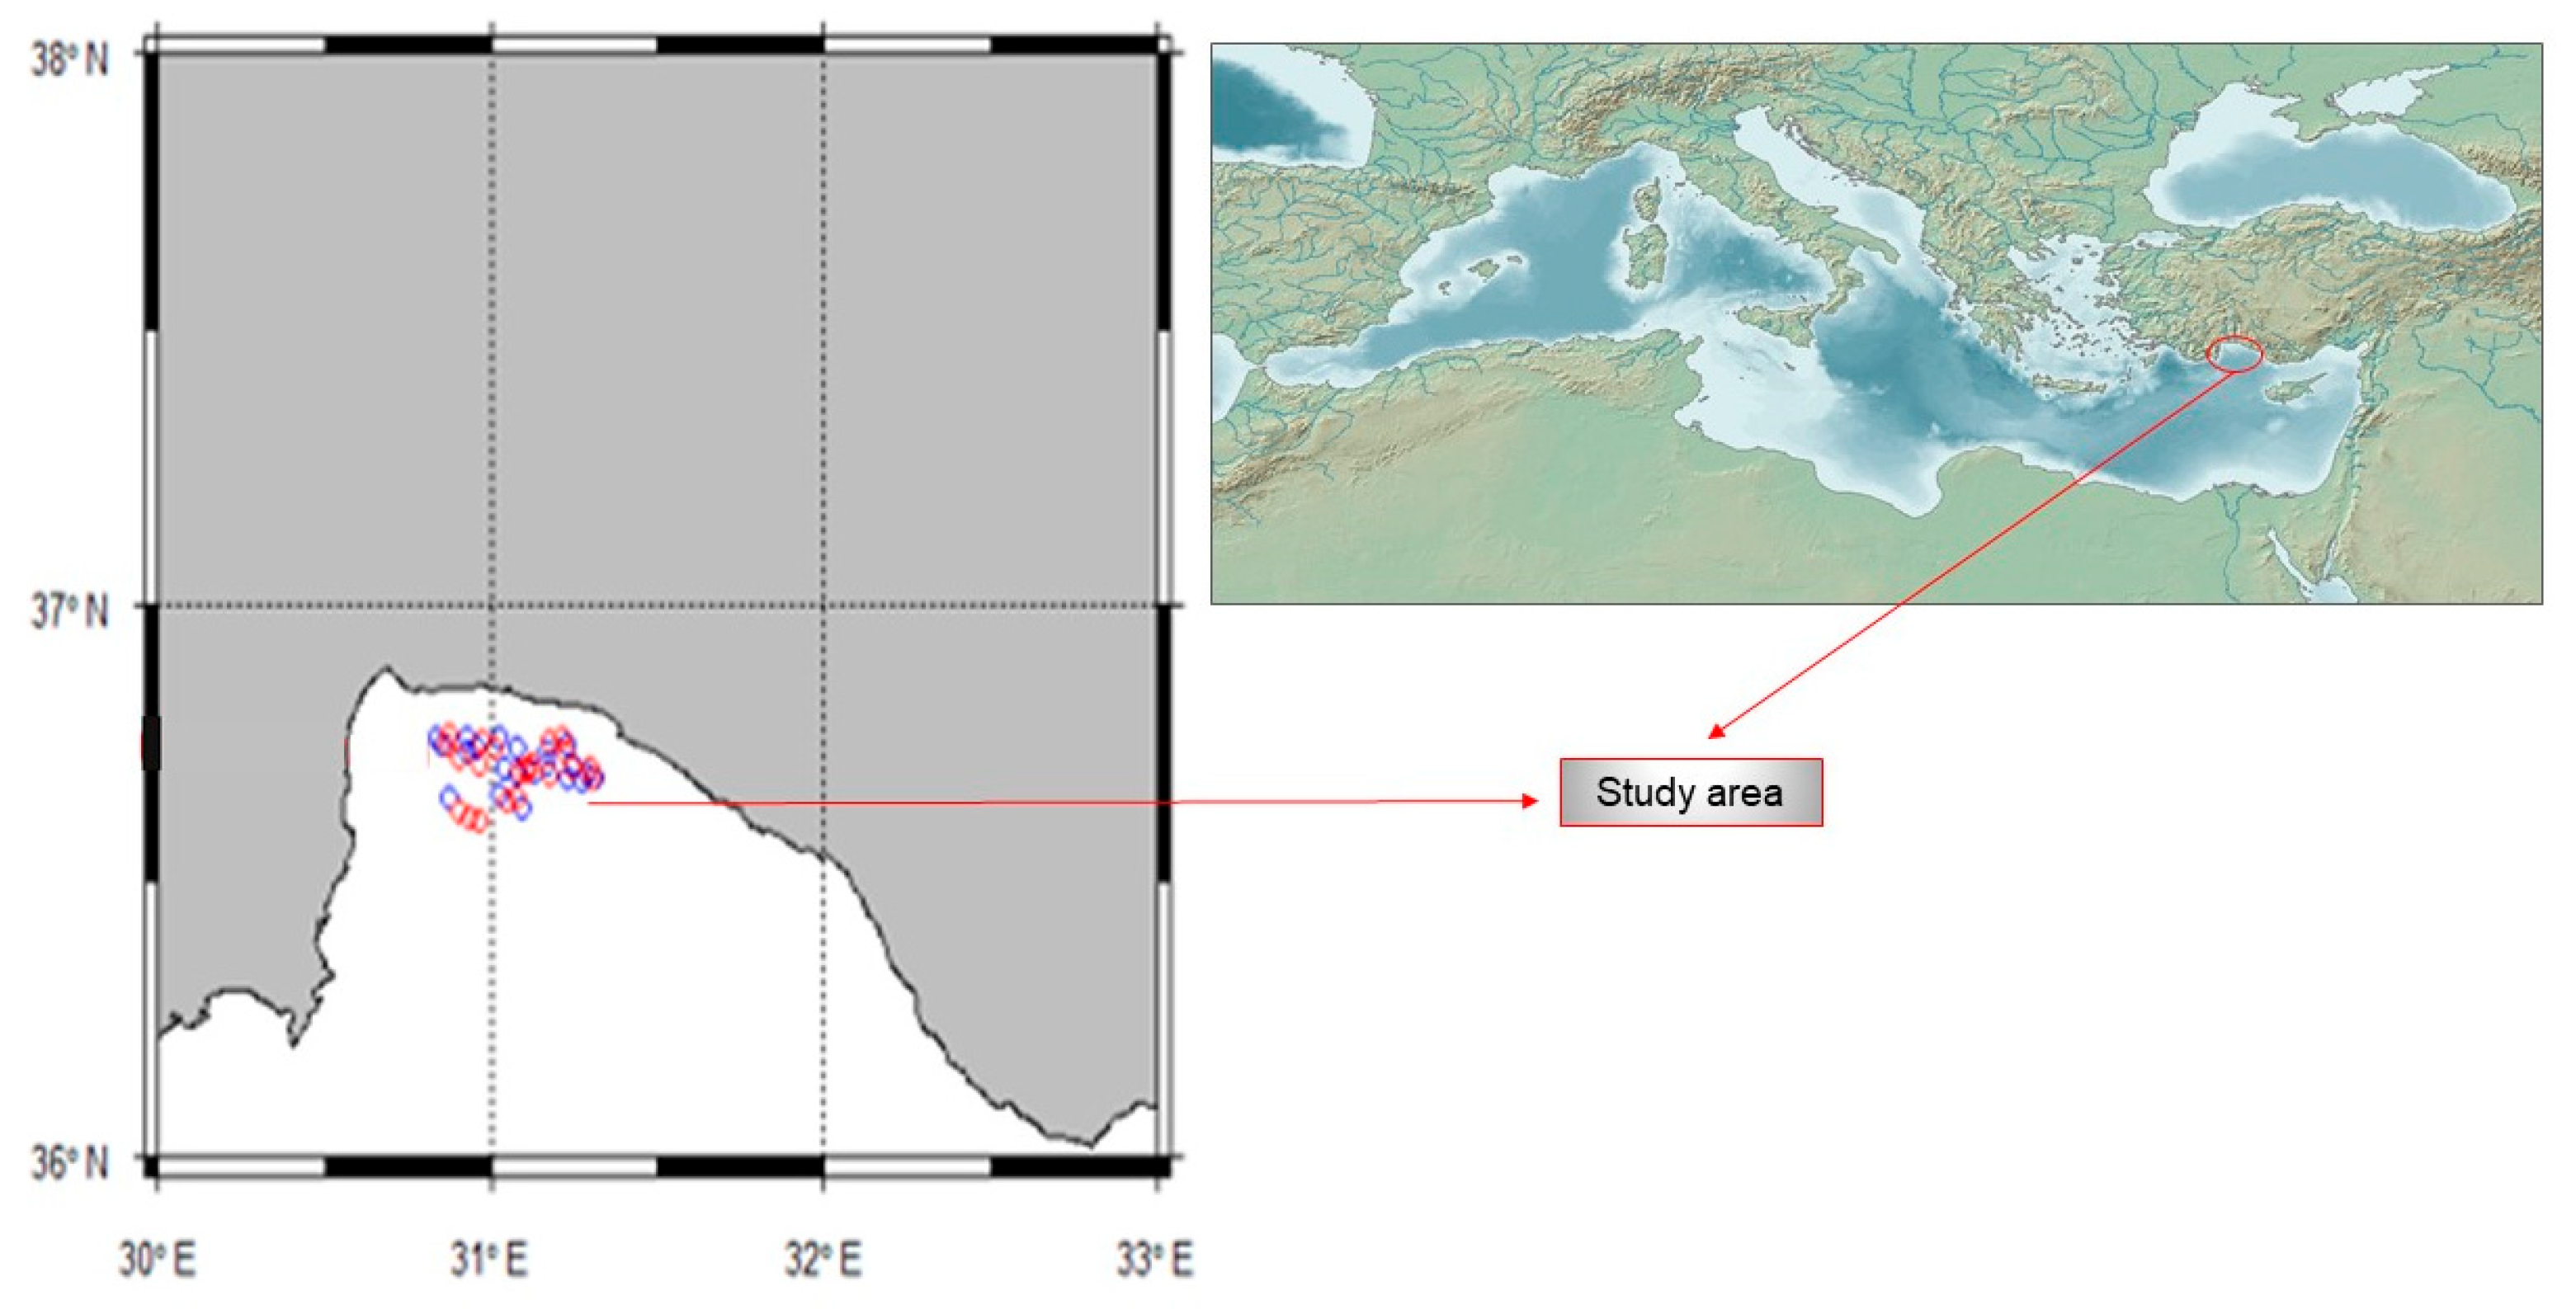
2.1. Study Area

Sampling studies were carried out in Antalya Bay, in the Eastern Mediterranean Sea (Figure 1). The fishing surveys were carried out in fishing grounds used by commercial bottom trawlers for shrimp fishing. At first glance, Antalya Bay looks like a large fishing ground, but this is a region where trawling is prohibited at many points, as stated in the fisheries bans prepared by the Republic of Türkiye Ministry of Agriculture and Forestry. Issues such as the depth differences of the fishing grounds in the west of the bay and the sudden deepening of the area represent other factors affecting the area width. For these reasons, the commercial trawl fishing grounds are very limited and commercial trawler fishing in the bay is generally carried out at three different depths of 20–50 m, 100–399 m, and 400–650 m, respectively.

2.2. Sampling and Laboratory Analysis

The fishing surveys were carried out with the 26.5 m long R/V “Akdeniz Su” research vessel, which is equipped with a commercial bottom trawl net. The samples were collected from 22 valid trawling operations carried out monthly between October 2016 and April 2017 at depths between 200 and 700 m. The total bottom trawl-sampling time took 27.45 h, and each operation took approximately 1.25 h. Trawling operations were carried out at a speed of 2.2–2.7 knots. Samples caught from trawling operations were separately sorted by species and as target, bycatch, and discard. The specimens were weighed to the nearest 0.001 kg, and their numbers were recorded. Subsampling was conducted, according to the research of Holden and Raitt (1974) and Avşar (2005) [24,25], and recorded. The methods employed by Whitehead et al. (1986) [26] and Froese and Pauly (2025) [27] were used for the systematic classification of fish species, and the research of Fischer et al. (1987) [28] was used for the identification of invertebrate species.

2.3. Data Analysis

Species Diversity and Community Structure

To assess species diversity and community structure, several ecological indices were employed. The Shannon–Wiener diversity index (H′) [29] was used to measure species diversity, while Pielou’s evenness index (J′) [30] was applied to evaluate species distribution uniformity. The Simpson dominance index (1 − λ) [31,32] was used to quantify species dominance within the assemblages. Additionally, Margalef’s species richness index (D′) [31] was used to estimate the overall species richness.
  • Shannon–Wiener diversity index (H′):
H = i = 1 S p i l n p i
Here, pi is the proportion of individuals belonging to species i, and S is the total number of species.
  • Pielou’s evenness index (J′):
J = H l n S
Here, H′ is the Shannon–Wiener diversity index, and S is the total number of species.
  • Simpson dominance index (1 − λ):
1 λ = 1 i = 1 S p 2 i
Here, pi is the proportion of individuals belonging to species i.
  • Margalef’s species richness index (D′):
D = S 1 l n N
Here, S is the number of species, and N is the total number of individuals. Species dominance and composition were further examined using frequency analysis (F) [33] to determine species availability among the different sampling periods.
  • Catch Composition and Effort Standardization
Total catches were categorized into target species, bycatch, and discards, and their abundance and biomass were recorded. The catch per unit of effort (CPUE) and catch per unit area (CPUA) were calculated to assess fishery efficiency [34]:
C P U E = C a t c h k g   o r   N F i s h i n g   e f f o r t h
C P U A = C a t c h k g   o r   N S w e p t   a r e a   ( k m 2 )
The swept area was estimated using the following formula:
A = D × W
where D is the distance trawled (speed × duration) and W is the effective width of the trawl net.
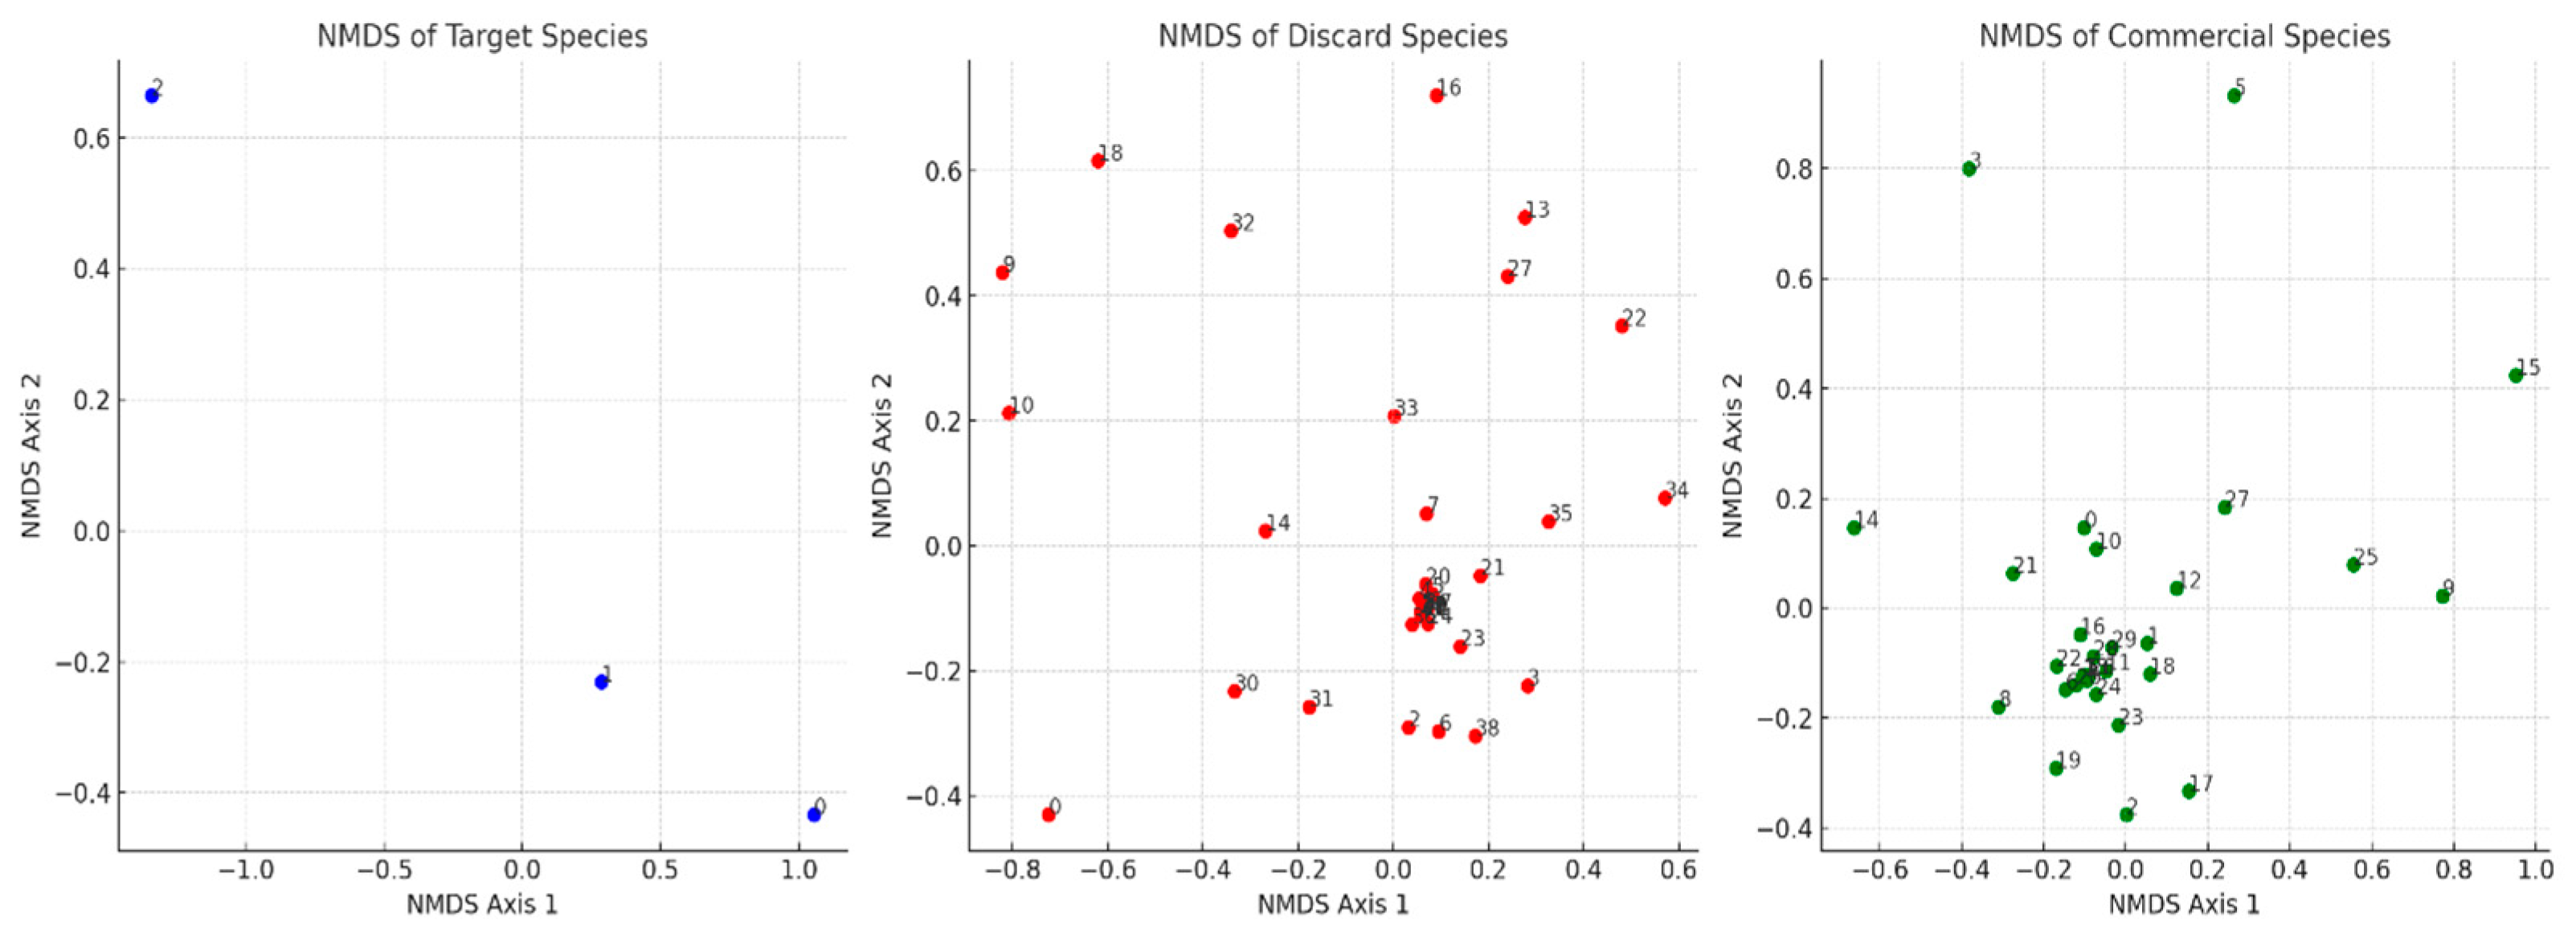
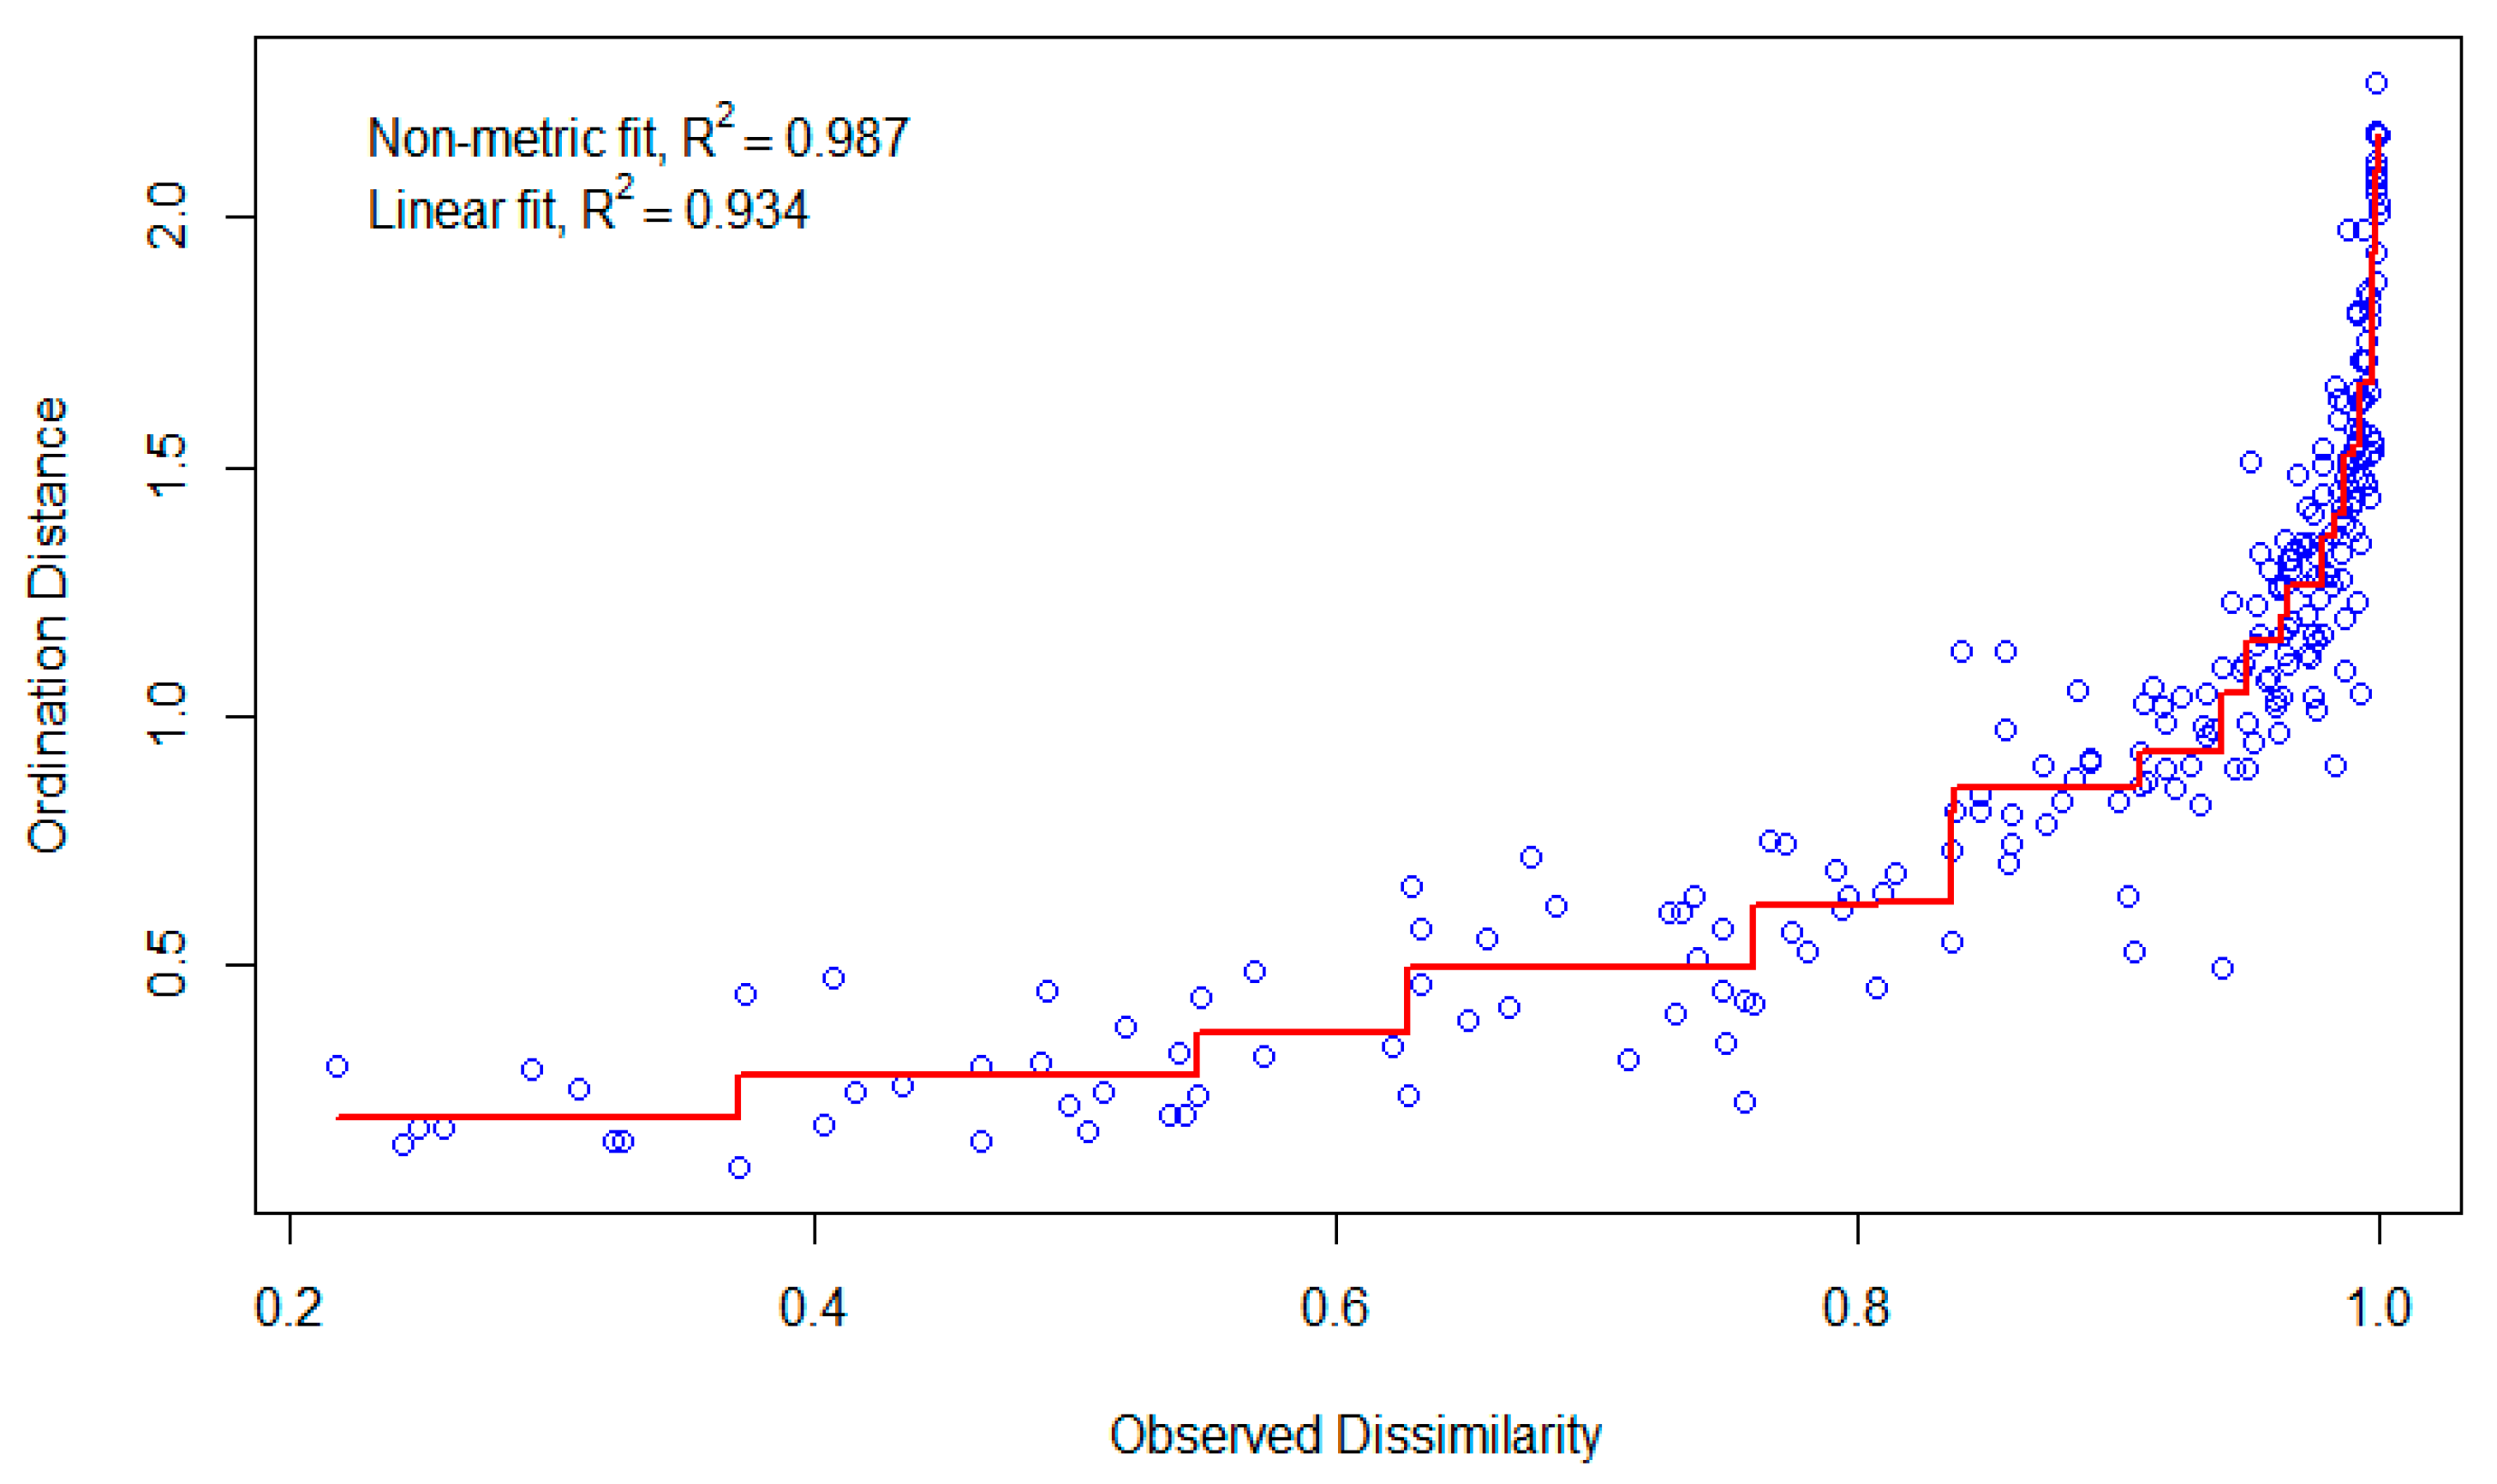
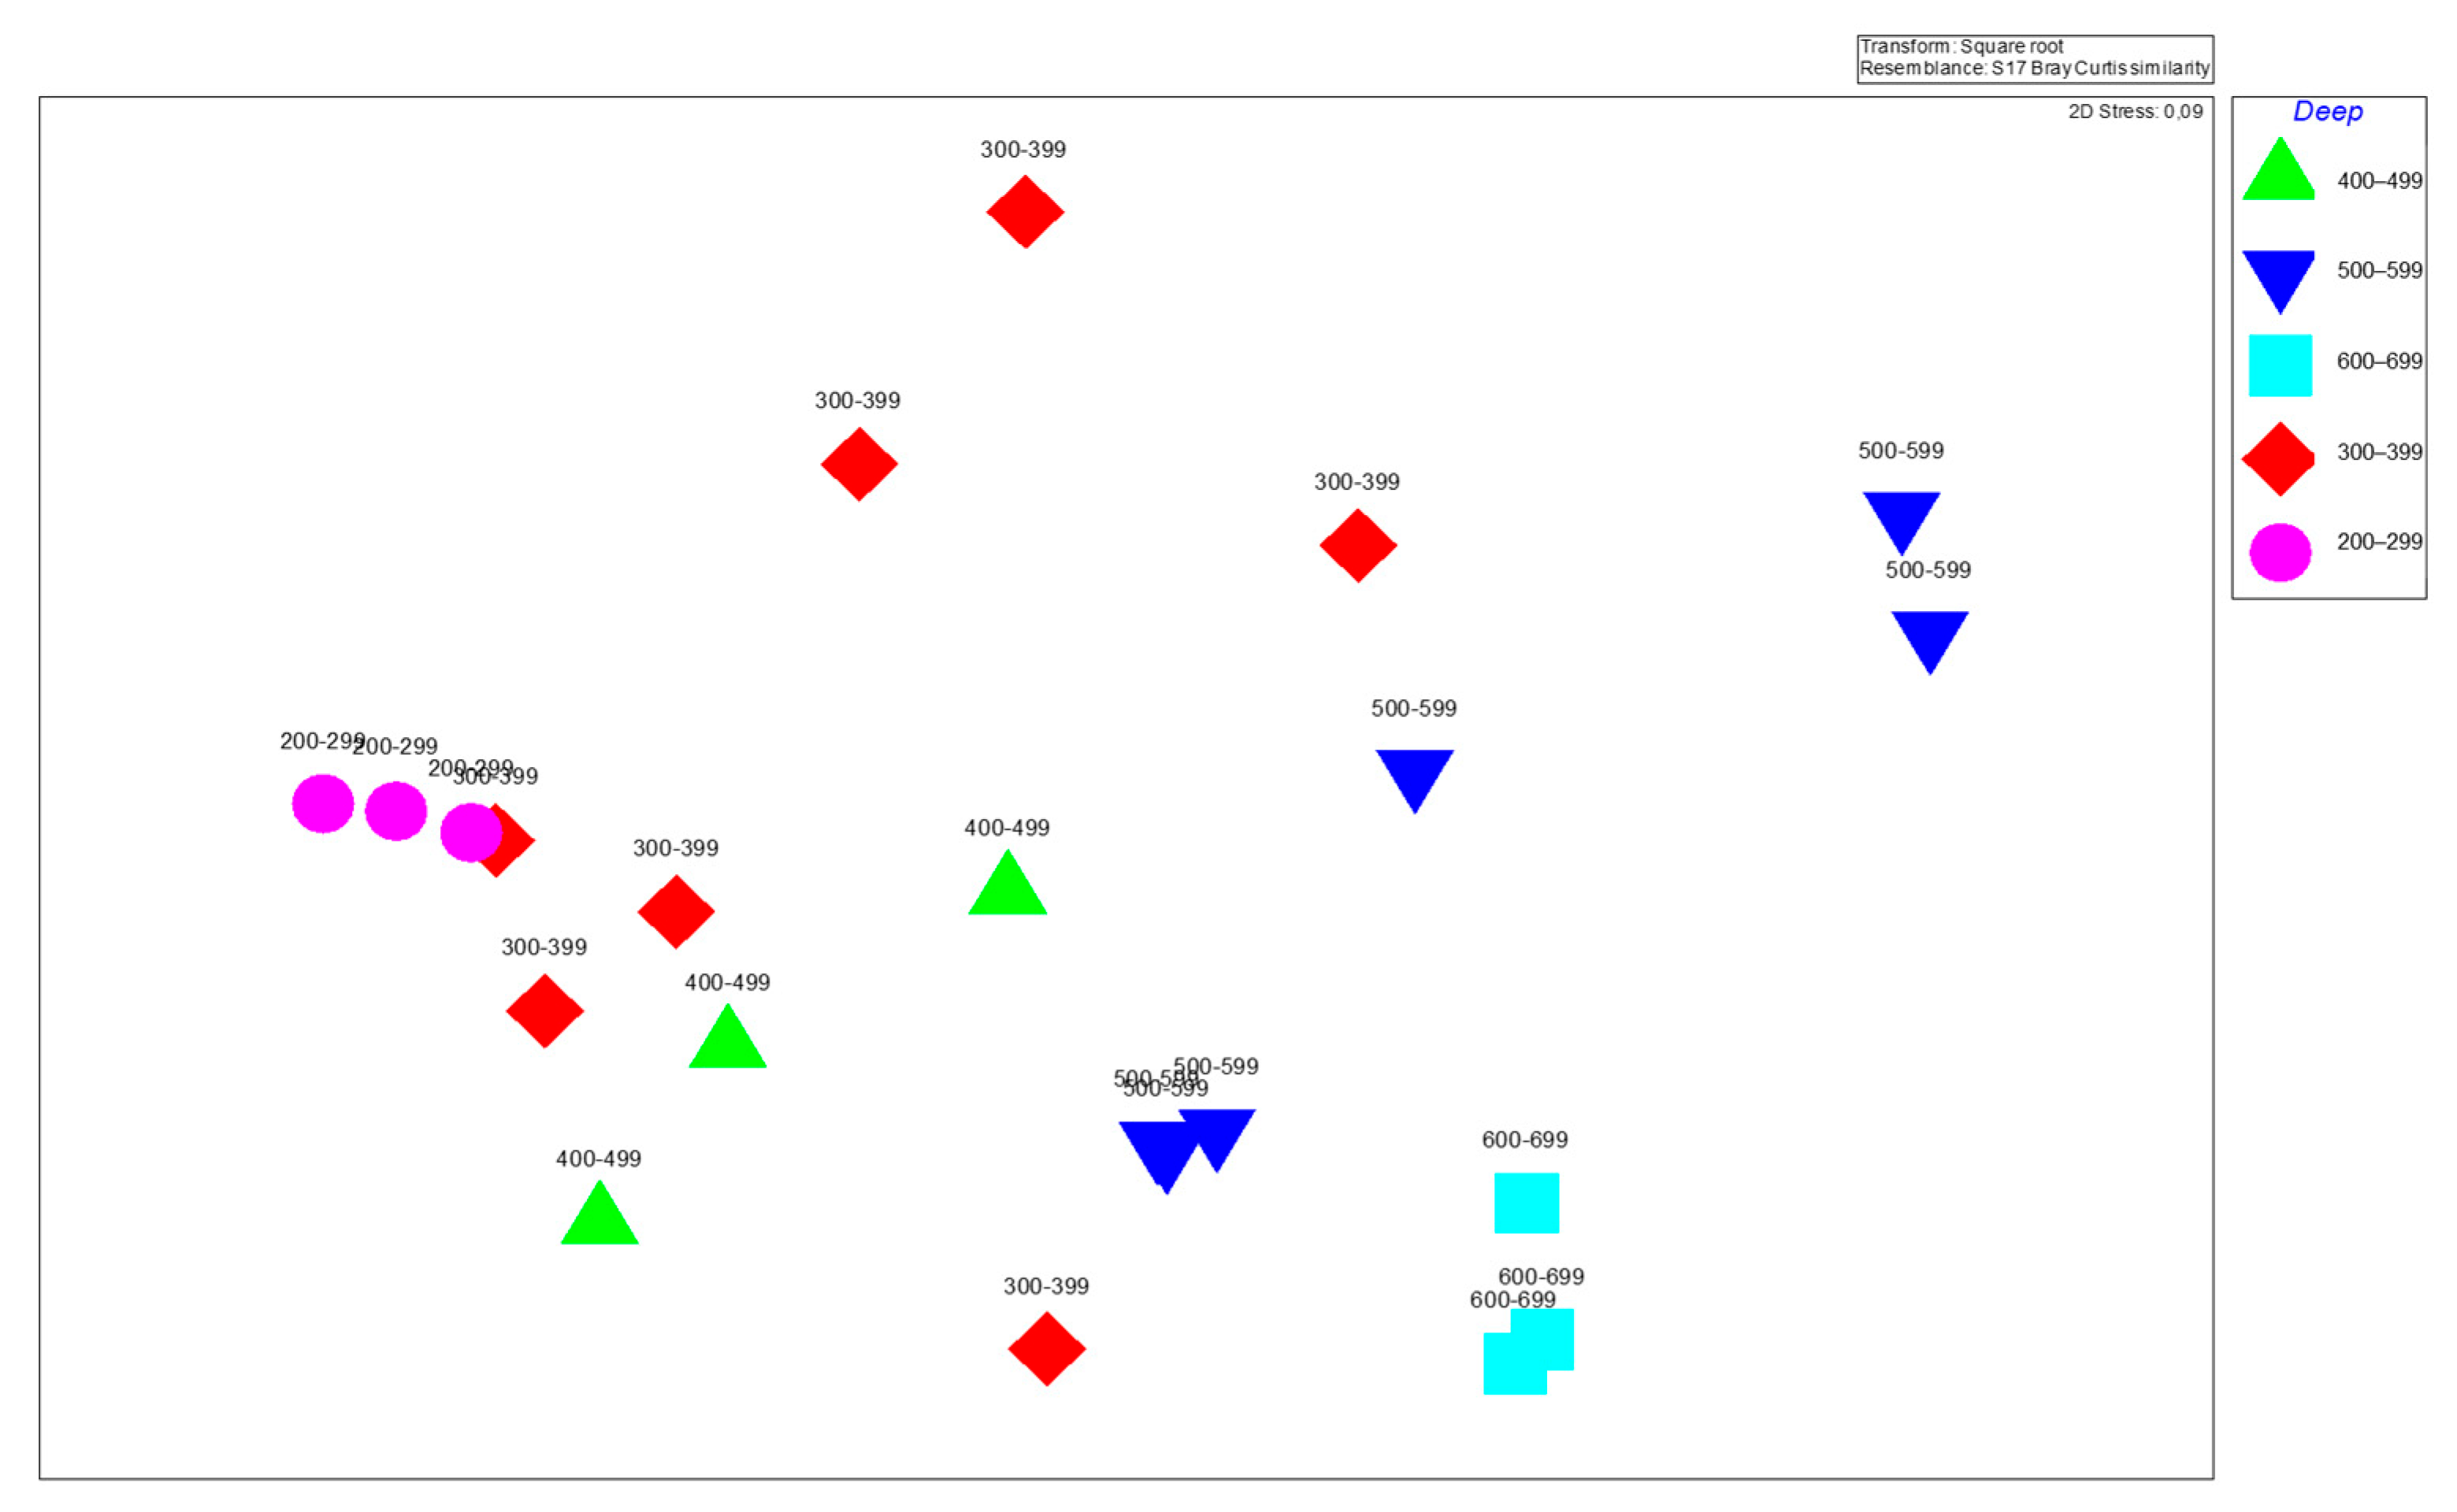
  • Multivariate Analysis of Community Structure
Non-metric multidimensional scaling (nMDS) and cluster analysis were used to evaluate the differences in species composition among depth strata and seasons. These analyses were based on the Bray–Curtis similarity index [35]:
B C i j = 1 2 C i j S i + S j
where Cij is the sum of the minimum values for each species in samples i and j, while Si and Sj are the total species abundances in the respective samples. nMDS was employed using the meta MDS function in the “Vegan” R package [36]. Unlike classical metric scaling, nMDS preserves the order of spacing between samples, making it more suitable for ecological data. Cluster analysis was applied using the Bray–Curtis similarity matrix to identify patterns in community composition among depth zones and seasons. The similarity matrix was standardized using log-transformed CPUE values (log10(X + 1)).
  • Statistical Hypothesis Testing
A one-way analysis of variance (ANOVA) was conducted to determine whether there were significant differences in species abundance and weight among the different depth strata. A two-way ANOVA was applied to compare differences in CPUE among the various depths and months:
F = B e t w e e n g r o u p   v a r i a n c e W i t h i n g r o u p   v a r i a n c e
where a significant p-value (< 0.05) indicated a statistically significant difference. Correlation vectors were applied to nMDS ordinations to explore the environmental factors influencing community structure.
The Kruskal–Wallis test, a non-parametric alternative to the ANOVA, is used when a dataset does not meet normality assumptions:
H = 12 N N + 1 i = 1 k R i 2 3 N + 1
where Ri is the sum of ranks for group i, and N is the total sample size. Linear regression analysis examined the relationship between CPUE and depth strata. The model fit was evaluated using R2 and adjusted R2 values.
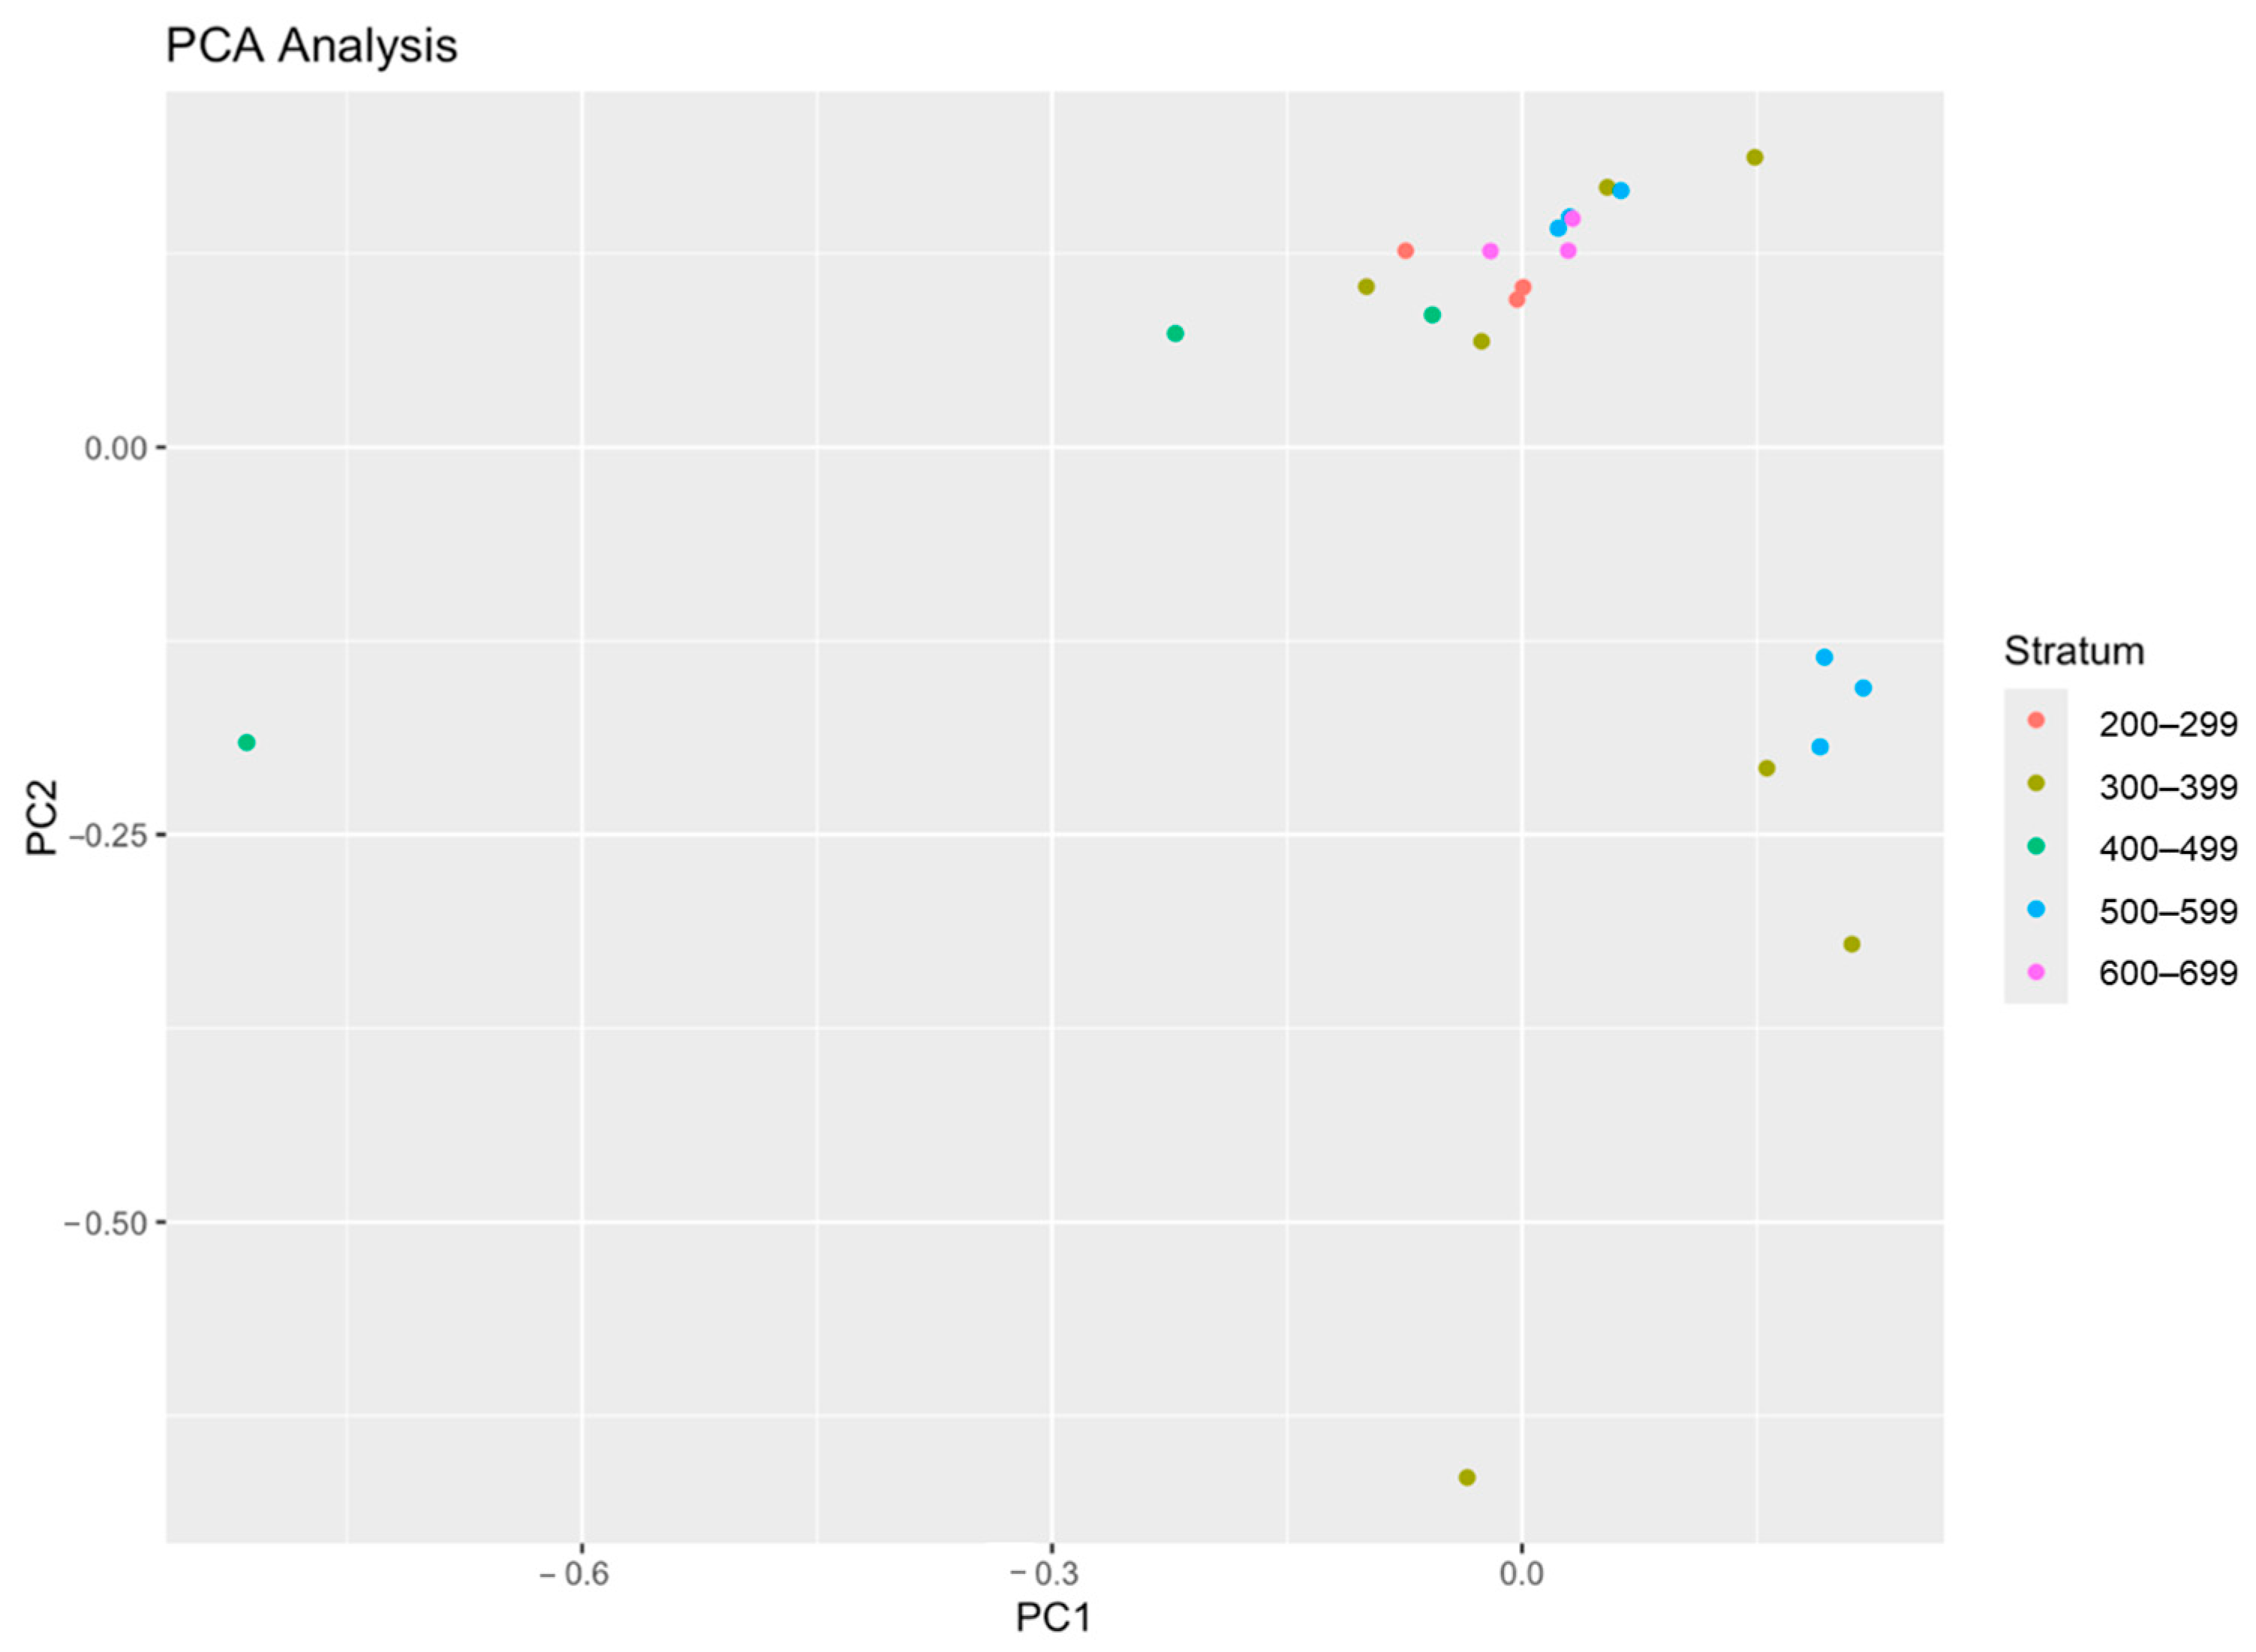
  • Principal Component Analysis (PCA)
To reduce dimensionality and identify the key variables affecting fisheries productivity, principal component analysis (PCA) was conducted using the following variables: CPUE, CPUA, swept area, and biomass per unit area. The first two principal components (PC1 and PC2) explained the majority of the variance. Variance was explained by each component:
T o t a l   v a r i a n c e = λ i
where λi represents the eigenvalues of each principal component. PCA was performed using RStudio’s 4.3.3 Vegan package 2.6–10 to identify patterns in fishery performance among the depth strata.
  • Software and Statistical Tools
All statistical calculations, diversity indices, and visualizations were performed using RStudio [37], with extensive use of the Vegan package [36] and PRIMER v6.1.13 (Plymouth Routines in Multivariate Ecological Research) [38] multivariate analyses. Data visualization and additional calculations were supported using MS Office Excel.

3. Results

3.1. Catch Composition

During the study, a total of 75 species belonging to 48 Osteichthyes, 11 Elasmobranchii, 10 Crustacea (Malacostraca), 4 Mollusca (Cephalopoda), 1 Brachiopoda (Rhynchonellata), and 1 Echinodermata (Holothuroidea) class were obtained. Two Lessepsien species were among the 48 bonefish species that were caught (Table 1). During the study, the total biomass obtained was 2063.88 kg, and 188.67 kg of this biomass was identified as target species, 484.30 kg as bycatch species, and 1393.91 kg as discarded species. From this total biomass, 3 species (18,407 individuals) were identified as target species, and 30 species (4048 individuals) were identified as bycatch, and all could be classified as a commercial catch for trawl operations. The rest of the species contributed to the 45 species (151,983 individuals) identified as discard species. Discarded species accounted for the largest proportions of the total catch, constituting 70.7%. Commercial species that are marketable but are not the primary targets contributed 19.2% of the total catch. This indicates the high prevalence of bycatch and discarded species in deep-sea trawling operations in the region. Target species, which are the primary focus of commercial fisheries, made up only 10.1% of the total catch, demonstrating the limited efficiency of trawling in terms of capturing the intended species. Despite all this, there is no difference between the catch rates of the target, bycatch, and discarded species in the total catch composition (p > 0.05 F(0.01;2;73):0.591). The commercial catch ratio, discard catch ratio, and commercial/total catch ratio are shown in Table 2 according to number and weight.
The highest number of discarded species was recorded at depths of 300–399 m (30 species), whereas the lowest was at 200–299 m (14 species). The numbers of discarded species obtained from trawl hauls at 400–499 m, 500–599 m, and 600–699 m were 20, 23, and 19 species, respectively. Statistical analysis indicated no significant difference in the number of discarded species among depth strata (p > 0.05, F(0.01;2;105) = 1.601). Target species were caught in all depth ranges, and the number of species varied with depth. The distribution of target species among the depth strata was not statistically significant (p > 0.05, F(0.01;2;9) = 4.344). Although Parapenaeus longirostris was intensively caught at up to 499 m in depth, Aristaeomorpha foliacea and Aristeus antennatus were caught more intensively below 499 m in depth. A total of 21 species were identified as bycatch at 200–299 m, and this number increased to 25 at 300–399 m. In addition, 11 species were recorded at 400–499 m and 500–599 m, and 9 at 600–699 m, which shows a decrease in the number of species. However, there was no statistically significant difference in the distribution of bycatch species along the depth strata (p > 0.05, F(0.01;2;71) = 1.777). The greatest number of species was seen in the autumn (34 species), which coincided with the start of the commercial trawl fishing season. This was followed by winter figures (28 species) and spring figures (27 species), when commercial fishing was forbidden; the figures were calculated according to the seasonal variation in bycatch species abundance. Statistical analysis showed no significant seasonal differences in discarded species abundance (p > 0.05, F(0.01;2;88) = 2.076). A similar pattern was observed for bycatch species, with 19 species caught in the autumn, 27 in winter, and 18 in spring, yet no statistically significant seasonal differences were detected (p > 0.05, F(0.01;2;64) = 1.527). Regarding target species, Aristeus antennatus was rarely caught in autumn and winter, with only a few individuals being recorded, but its abundance increased substantially in spring. Conversely, Parapenaeus longirostris was caught in low numbers in autumn, reached its highest abundance in winter, and exhibited a declining trend in spring. Meanwhile, Aristaeomorpha foliacea was caught extensively during all seasons. Despite the target species’ seasonal trends, the differences in total target species catch rates were not statistically significant (p > 0.05, F(0.01;2;7) = 1.356).

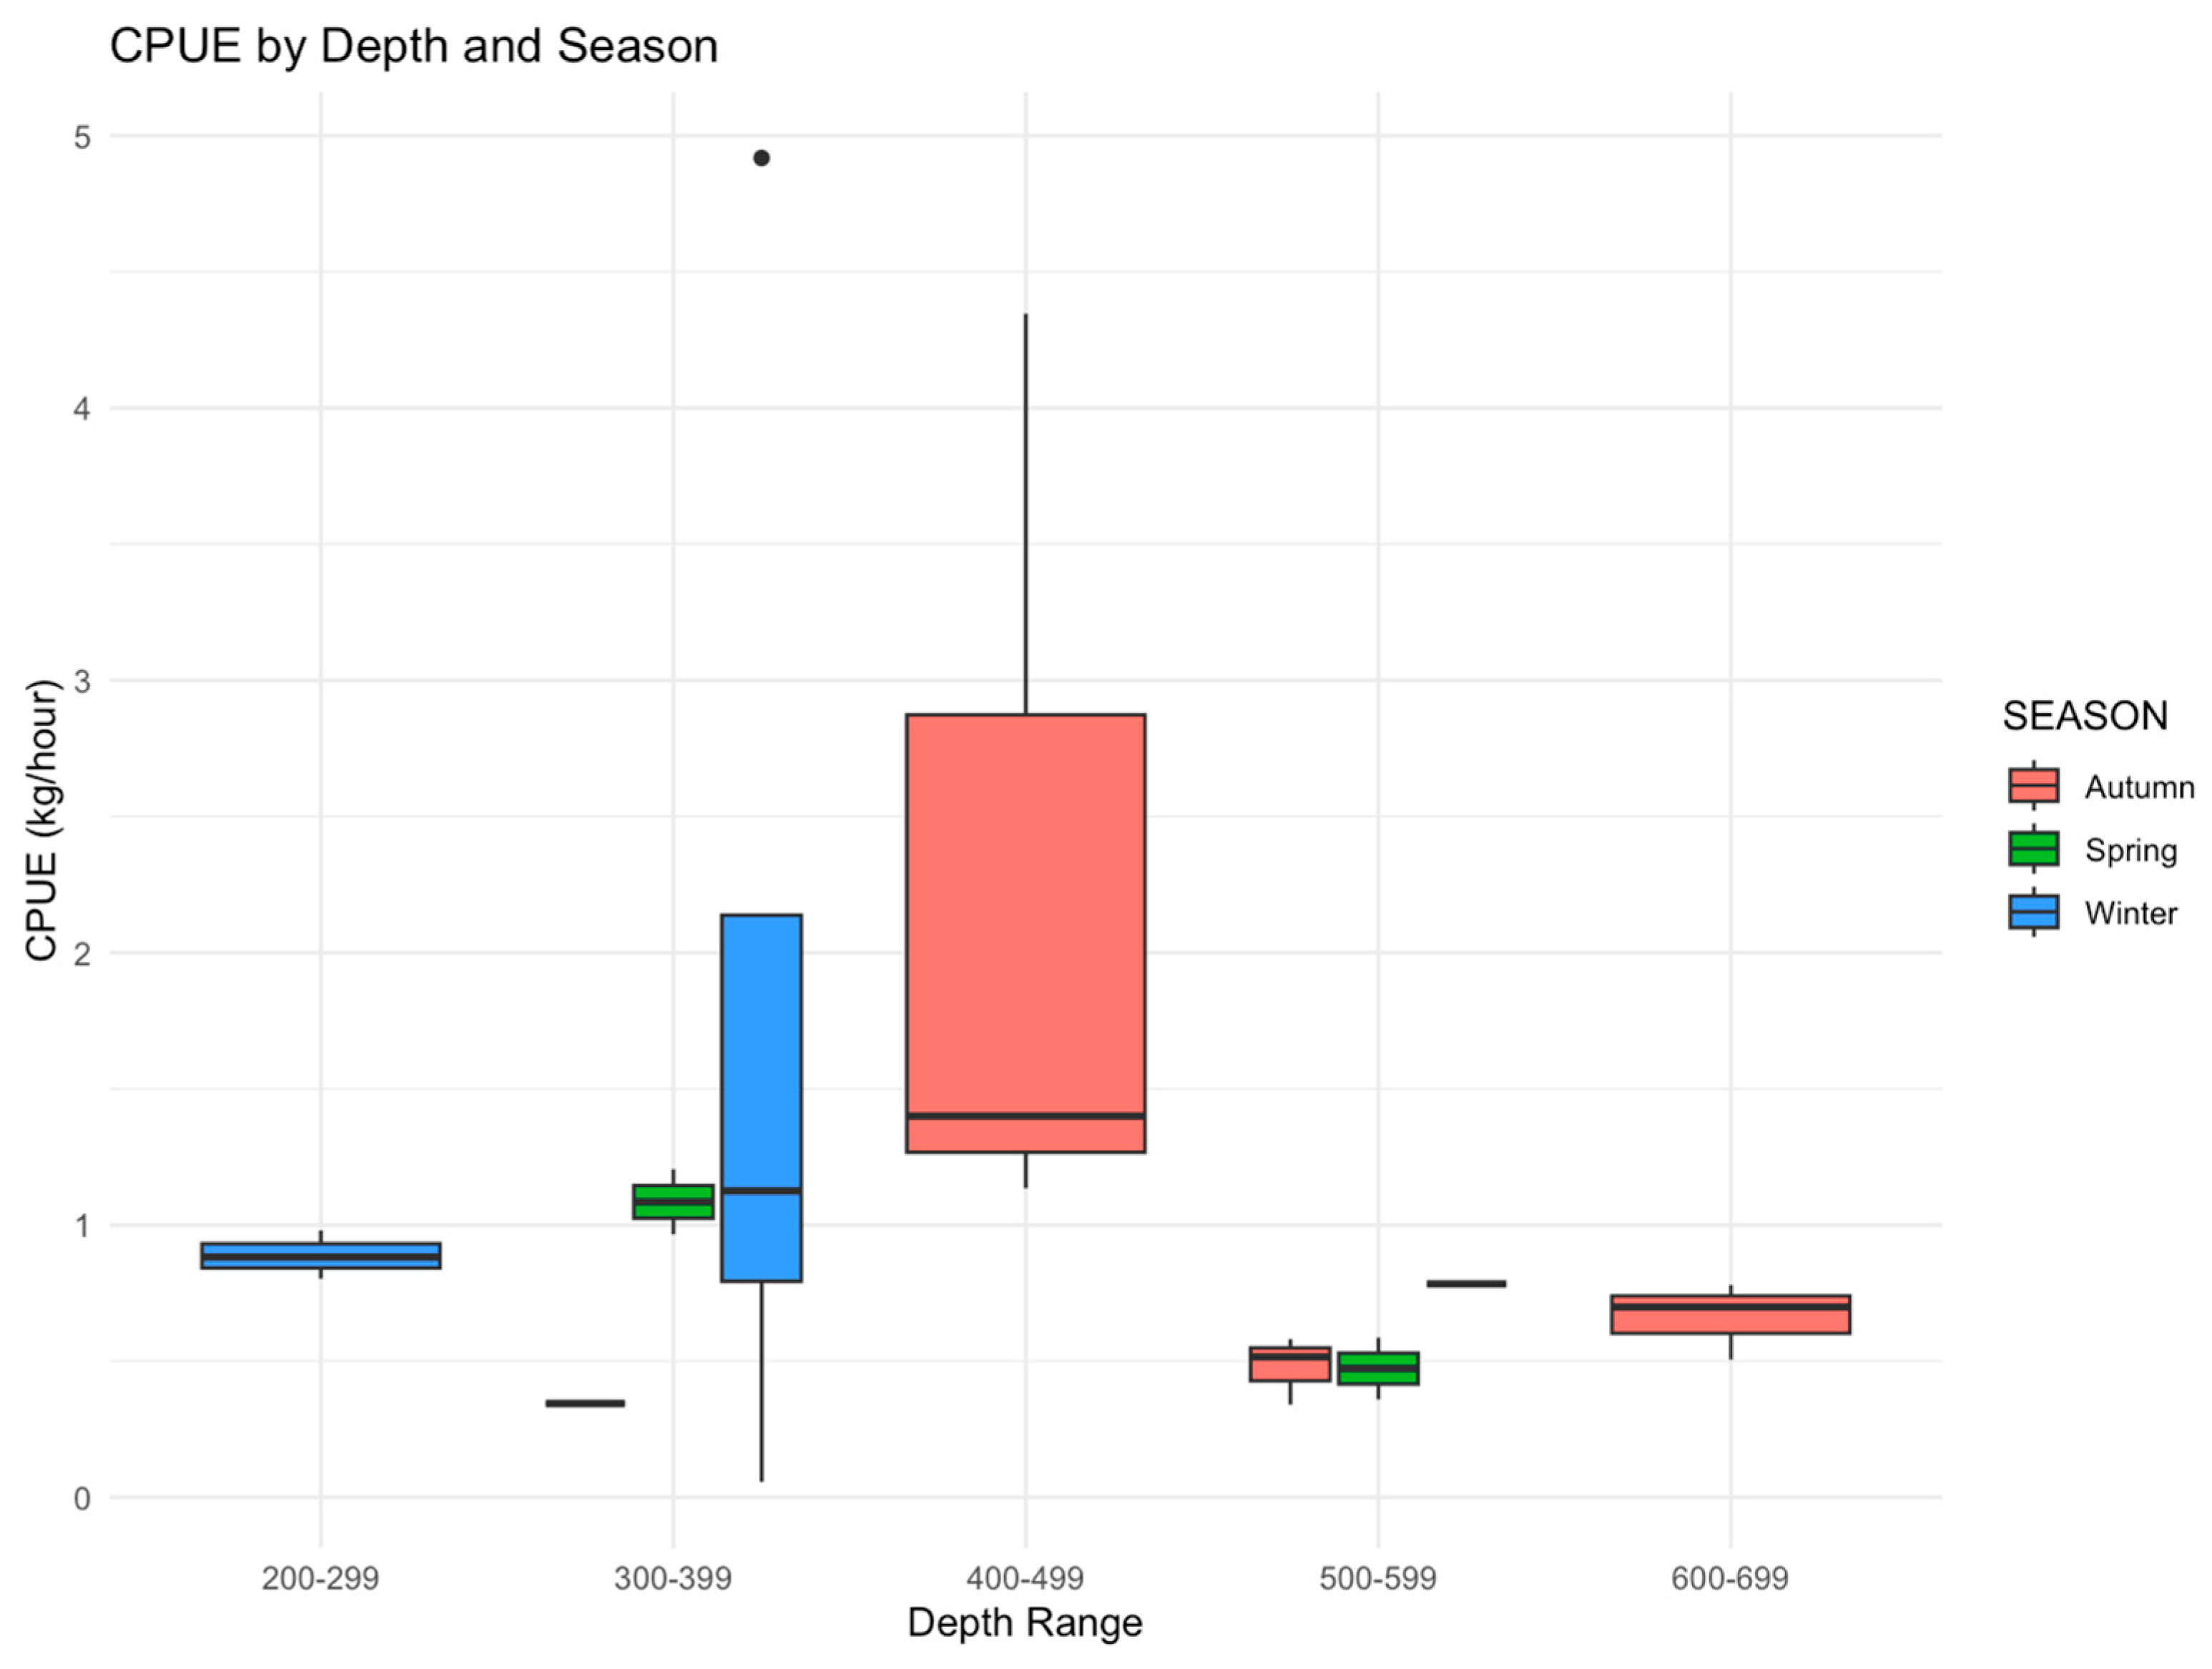
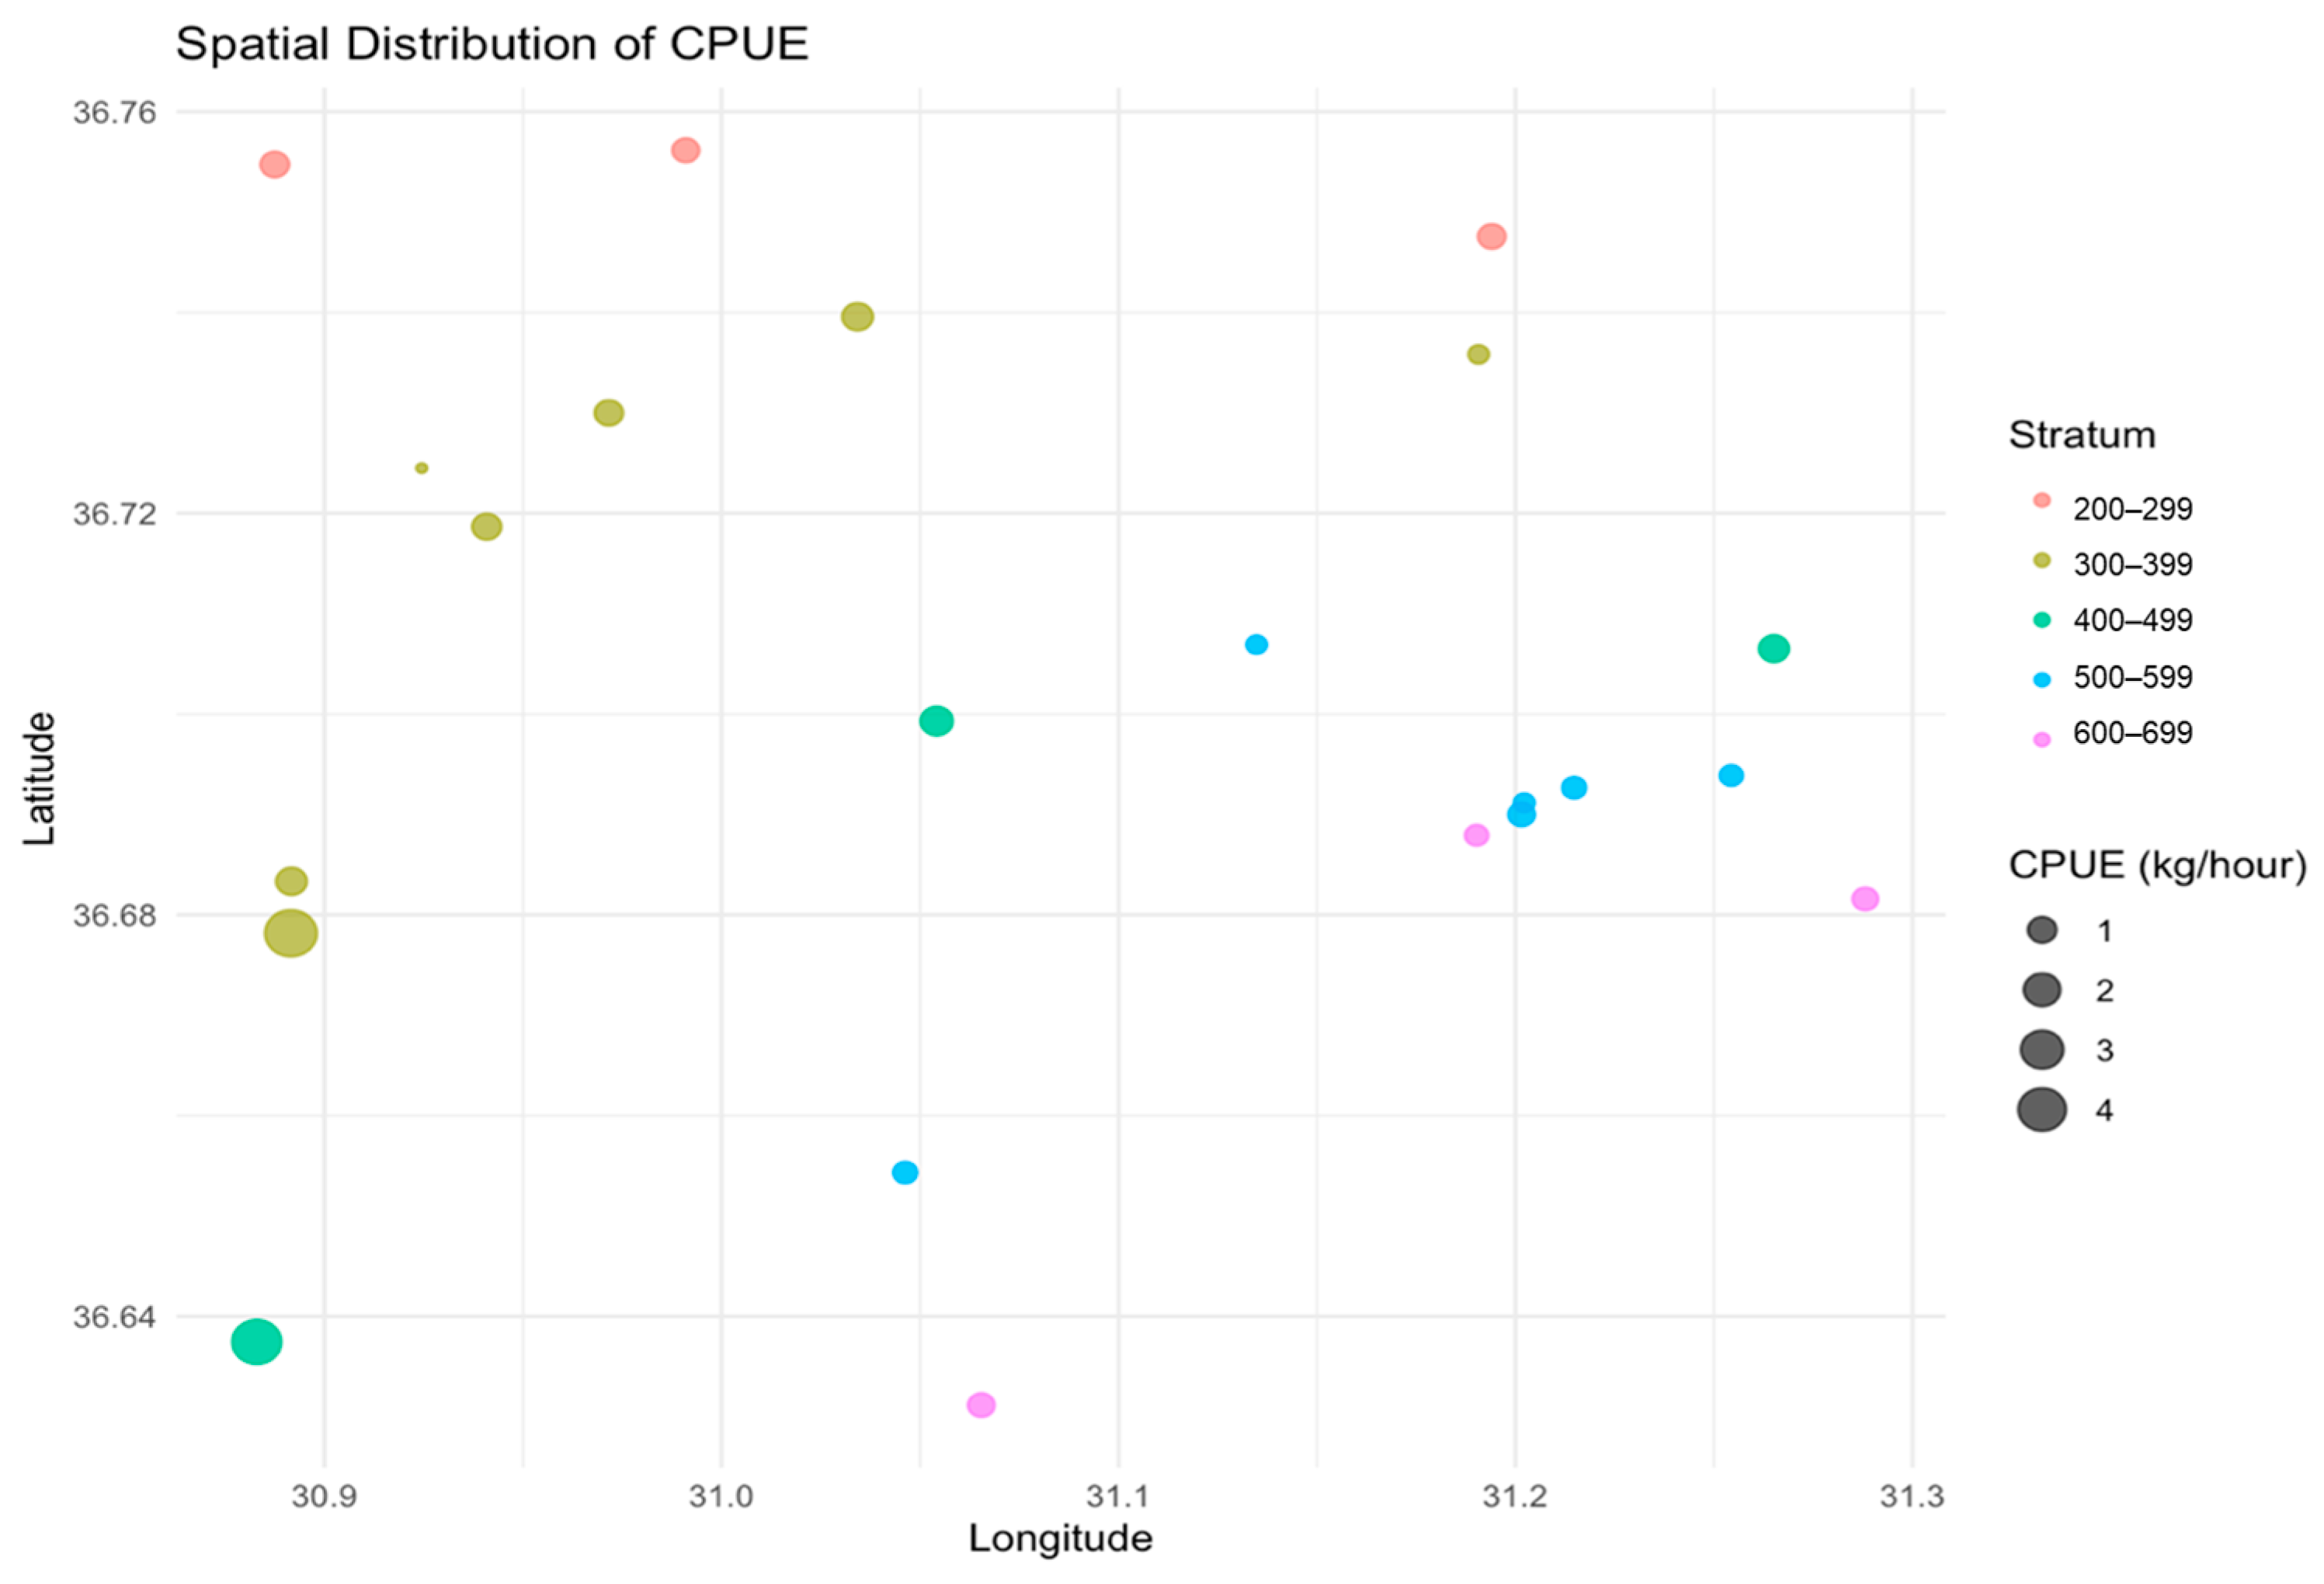
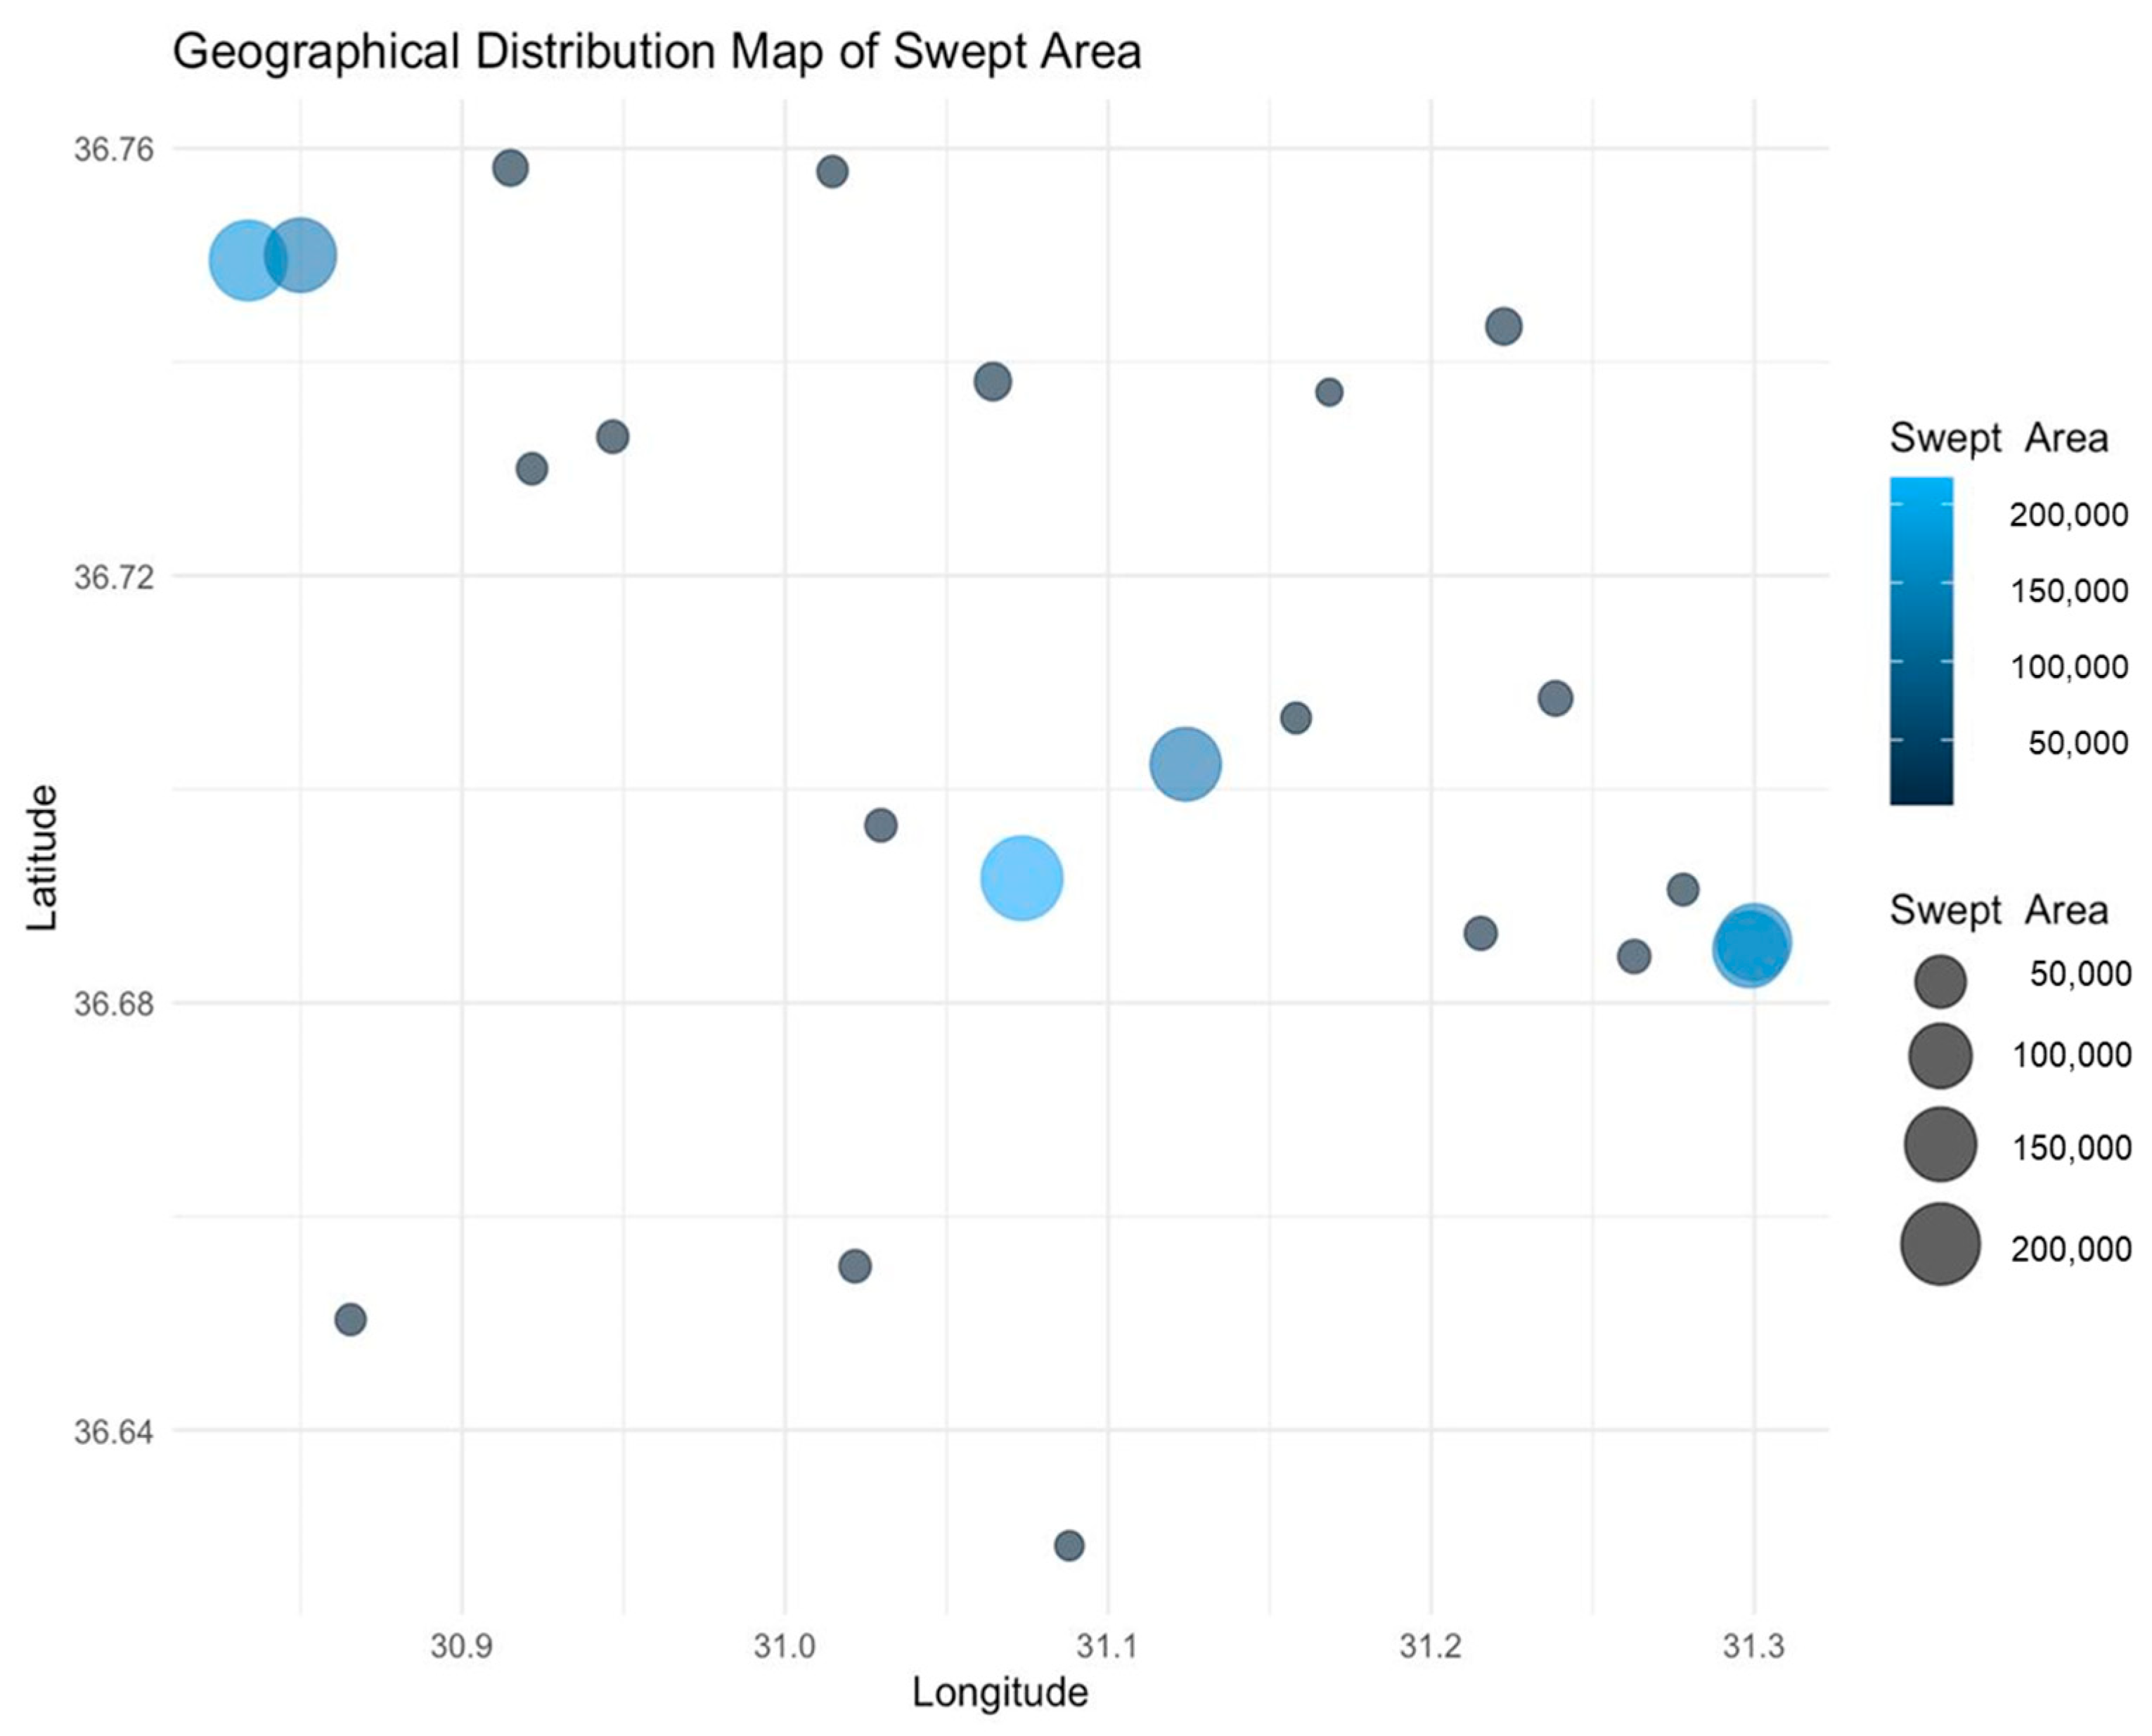
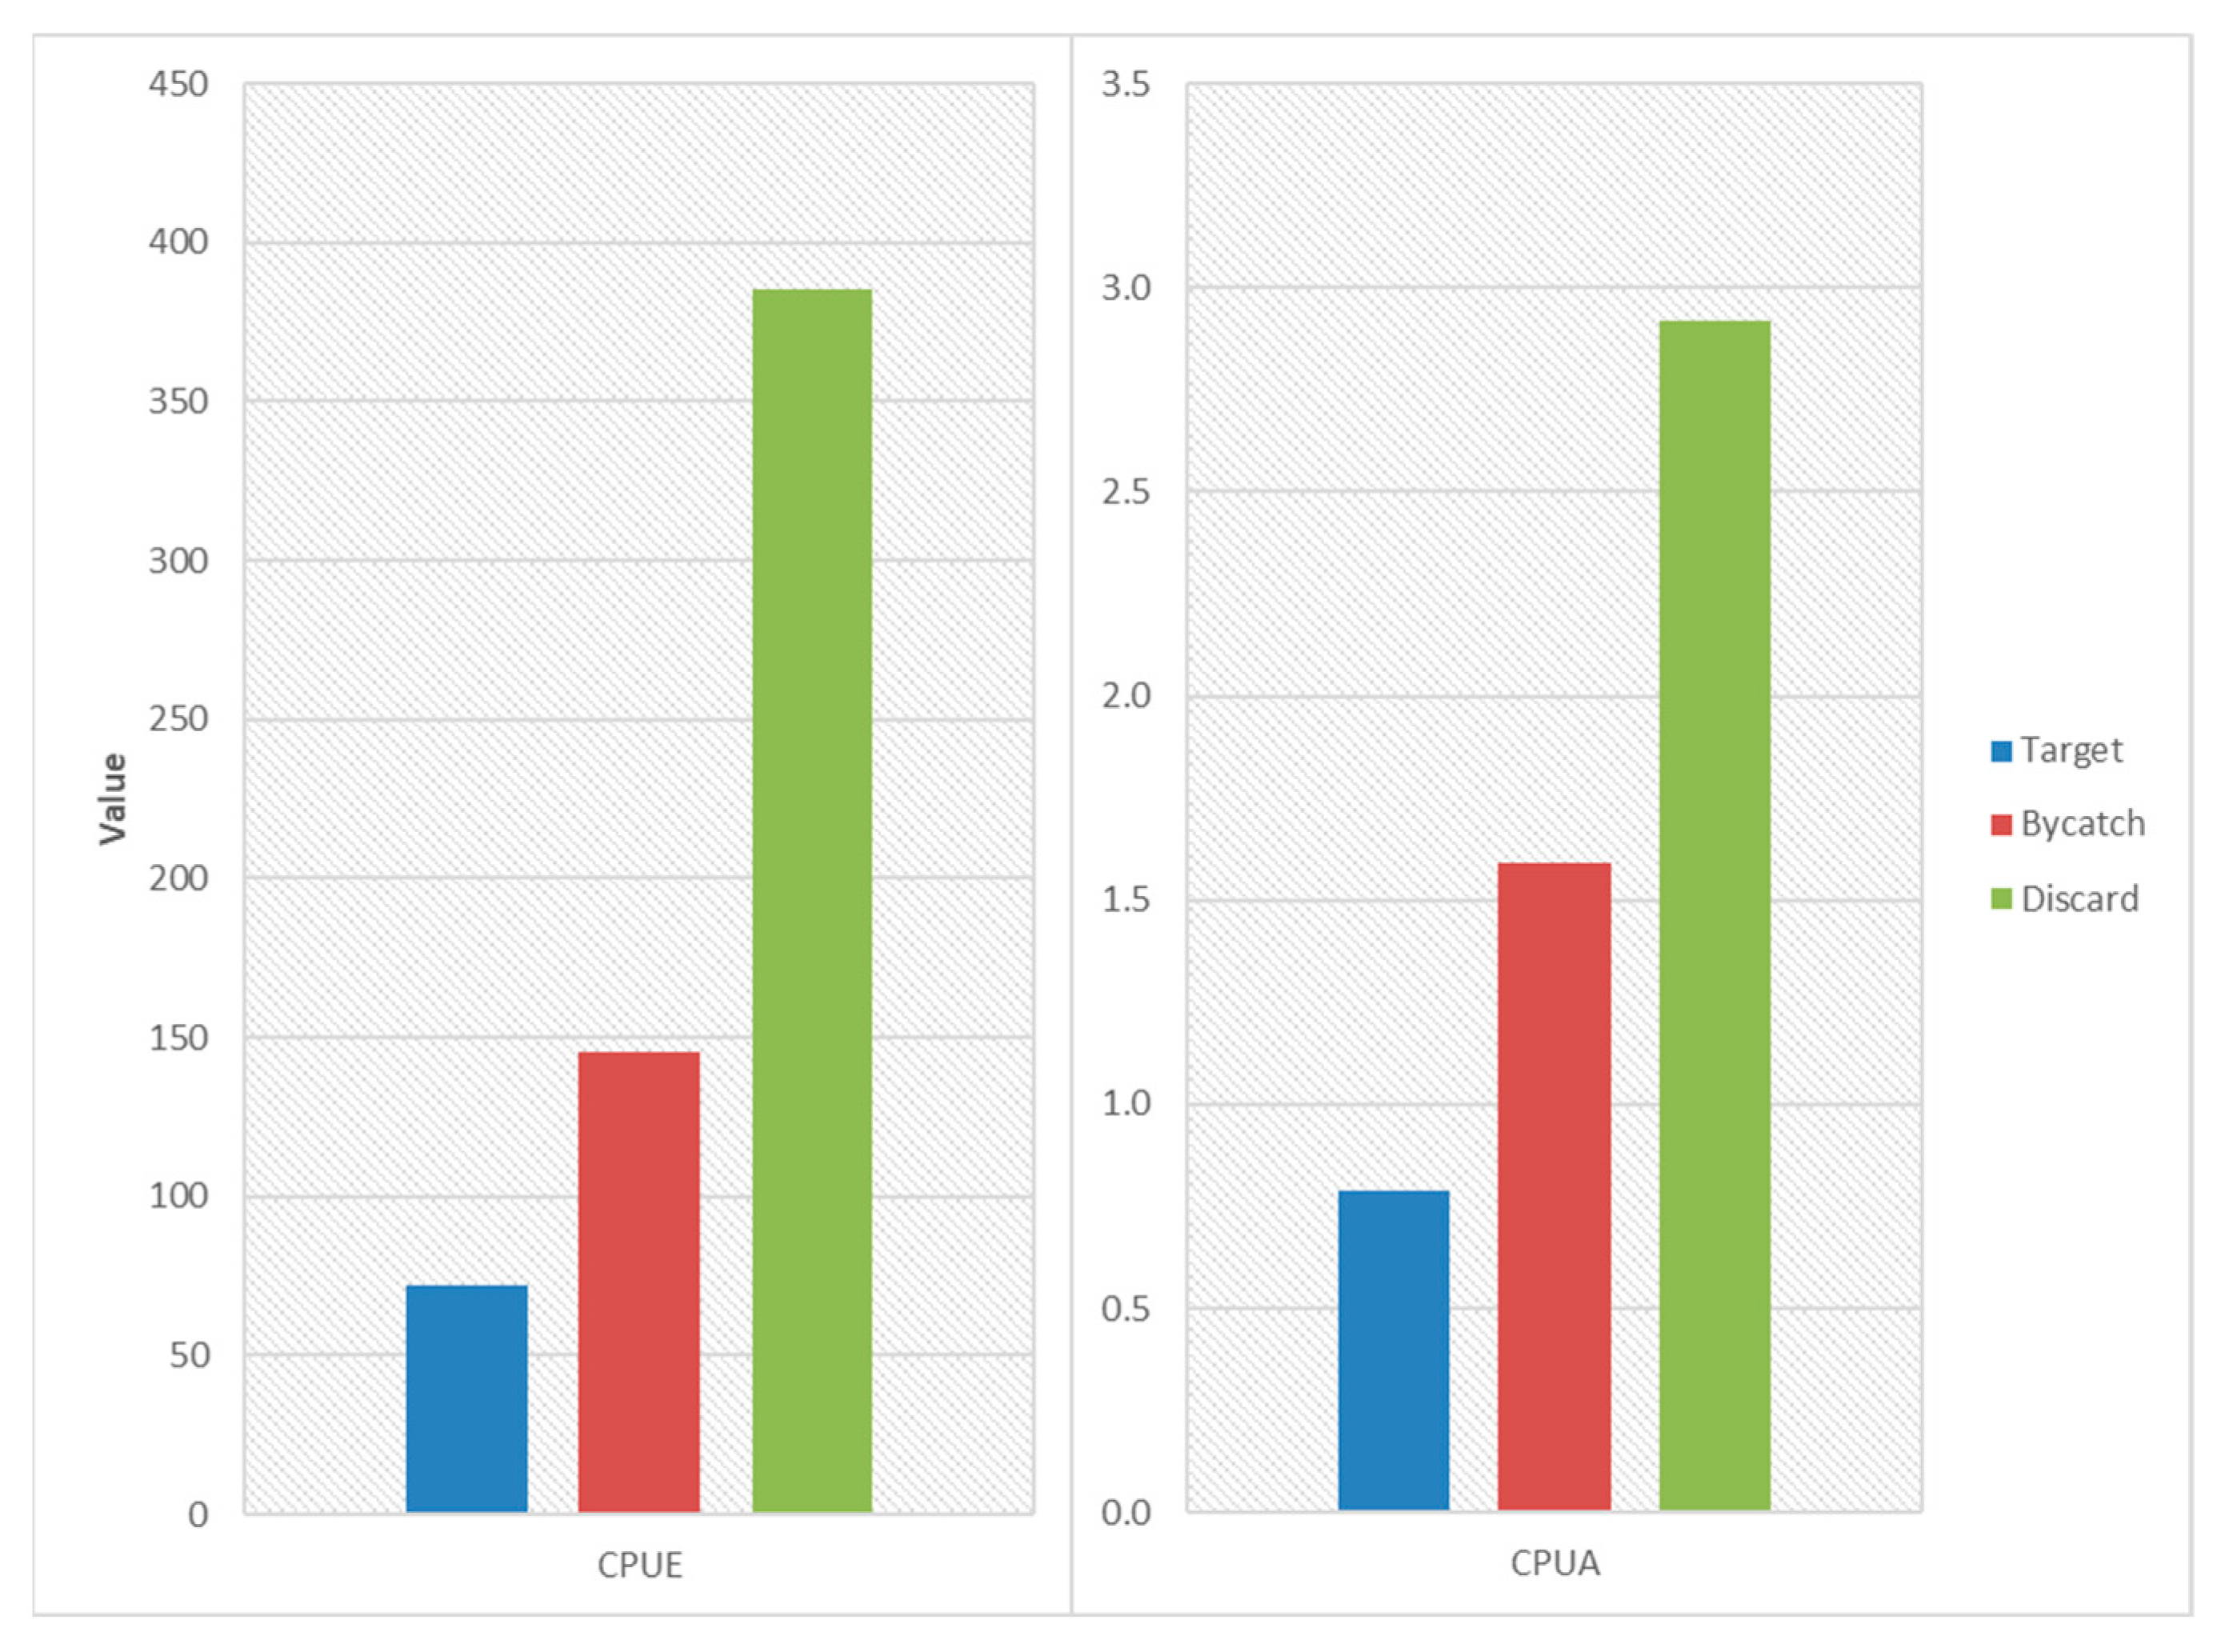
3.2. CPUE and CPUA Analyses

For all 22 trawl operations, 2063.88 kg of catch was harvested and the total CPUE values were calculated as 602.90 kg/h in the study. Table 3 lists the number and biomass of the calculated total CPUE and CPUA values for target, bycatch, and discard species.
The calculated CPUE values of total, target, bycatch, and discard species according to depth and season are shown in Table 4. The highest total CPUE was calculated at 400–499 m to be 132.83 kg/h in autumn, followed by 300–399 m at 127.84 kg/h and 300–399 m at 99.61 kg/h in winter and spring, respectively. The higher discard CPUE values were calculated as 114.35 and 93.92 kg/h at depths of 400–499 and 300–399 m in autumn and winter, respectively. The total CPUE values varied between 21.15 and 132.83 kg/h (Table 4) by season and depth, and the calculated CPUE values were significantly different (p > 0.005). The 400–499 m depth range in autumn showed the highest CPUE variability, suggesting seasonal fluctuations in fish aggregation and catch success (Figure 2). Due to seasonal differences in fish density and catchability, our results imply that trawling activity is most productive at mid-depths (300–499 m) in the winter and autumn.
In order to determine whether the CPUE values varied significantly between the depth strata, the Kruskal–Wallis and ANOVA tests were performed. The one-way ANOVA test yielded a non-significant result (F = 1.441, p = 0.263), indicating that there is no statistically significant difference in CPUE among the five depth strata. The relatively high residual variance suggests that additional factors, such as habitat complexity or seasonal influences, may play a role in CPUE variability. Since the ANOVA assumes normality and homogeneity of variances, the Kruskal–Wallis test, a non-parametric alternative, was also performed to validate the findings. The test returned a statistically significant result (χ2 = 9.804, df = 4, p = 0.04386), suggesting that at least one depth stratum exhibited a significantly different CPUE distribution compared to the others.
Figure 3 displays the estimated CPUE values’ spatial distribution in terms of latitude and longitude. The highest CPUE values were observed at 300–399 m and 400–499 m, mainly concentrated around the mid-latitudes (36.64° to 36.72°). The 200–299 m depth stratum exhibited a broad spatial distribution, with moderate CPUE values at multiple locations, particularly near 36.76° in latitude. Conversely, the deeper strata (500–699 m) displayed a more fragmented pattern, with lower CPUE values. This suggests a more fragmented distribution of catch in these areas. Areas with high CPUE tended to cluster around 31.0° to 31.2° longitude, reinforcing the importance of this region for targeted fishing activities. The clustering of high CPUE values at specific depths and geographic locations indicates potential hotspots for fishing efforts. The fragmented patterns in the deeper strata may reflect limited resource availability or less accessible fishing grounds. By focusing on locations that are more productive and reducing fishing pressure on less productive zones, these spatial patterns can help in the optimization of future trawl operations.
Figure 4 shows the geographical distribution of the swept area among the different latitudes and longitudes. The mid-latitude zones, which corresponded to the 300–399 m and 400–499 m strata, had the biggest swept areas. In contrast, shallower waters (200–299 m) exhibited smaller bubbles, indicating less intensive fishing efforts. These findings show that CPUE values depend on both depth and location, highlighting the necessity of adaptive fisheries management techniques for achieving a balance between the conservation of ecosystems and economic efficiency. The largest bubbles, representing the most extensive swept areas, are concentrated in the mid-latitude zones, aligning with the 300–399 m and 400–499 m strata observed in the scatter plot. Smaller bubbles at higher latitudes indicate localized, less intensive fishing efforts in shallower waters. Moderate CPUE values in larger swept areas suggest that trawl efforts are focused on the target species in specific strata, avoiding unnecessary effort. High CPUE values and small swept areas may indicate the presence of dense fish aggregations or more accessible resources in specific zones. The spatial patterns show that mid-depth strata are critical fishing grounds, particularly around 31.0–31.2° longitude, where intensive trawling occurs.
The discard group exhibited the highest total CPUE value, indicating that the bycatch rate significantly surpassed that of commercial and target species (Figure 5). This suggests that a substantial portion of the total catch consisted of non-target species, which are often discarded due to their low economic value or regulatory restrictions. Bycatch species demonstrated a moderate total CPUE value, implying that valuable species are captured at a relatively stable rate, balancing economic efficiency with bycatch. Target species had the lowest total CPUE value, suggesting that these species are naturally less abundant in the area or that this may indicate their overexploitation. The high CPUE values for discard species highlight inefficiencies in gear selectivity, leading to a significant amount of bycatch. The low CPUE values for target species raise concerns about potential overfishing, seasonal variability, or habitat depletion. The moderate CPUE values for commercial species suggest that trawling successfully captures valuable species but still results in a notable level of bycatch.
Discard species again dominate in terms of CPUA values, suggesting that a large proportion of the catch consisted of unwanted or non-commercial species. Commercial species (target and bycatch) have a lower CPUA value, reinforcing the theory that while these species are economically valuable, their density per unit area is significantly lower compared to discard species. Target species recorded the lowest CPUA values, indicating either overexploitation, spatially limited distribution, or naturally low population densities. The high CPUA value for discards implies a widespread distribution of bycatch species, indicating the need for improved fishing strategies such as modified net designs or selective fishing efforts. The low CPUA value for target species suggests the necessity for stricter management, including quota regulations, seasonal closures, or habitat protection measures. The moderate CPUA value for commercial species reflects an economically viable but environmentally impactful fishing practice. Discard species recorded the largest swept area, suggesting a broad and indiscriminate impact on the seabed and ecosystem. The large swept area for discard species raises ecological concerns about habitat destruction, benthic ecosystem disruption, and long-term biodiversity loss. The lower swept area for target species indicates either stock depletion or a naturally restricted distribution, requiring further investigation.
To further explore species composition and community structure among the different catch categories, non-metric multidimensional scaling (NMDS) was performed on the target, commercial, and discard species groups using the Bray–Curtis similarity. Figure 6 illustrates the spatial distribution of species within each category. The NMDS plot for target species revealed a highly distinct clustering pattern with low dispersion, indicating that these species share similar ecological niches and are selectively captured. In contrast, discard species exhibited a dispersed distribution, suggesting a more heterogeneous composition with greater variation among species. The commercial species also formed a more concentrated cluster but showed some variability, reflecting differences in species availability and market-driven fishing practices. The NMDS analyses’ stress values were less than 0.15, indicating that the species distributions in two dimensions were adequately represented. The NMDS analysis provided a strong fit to the dataset, as demonstrated by the high non-metric fit (R2 = 0.987) and linear fit (R2 = 0.934) (Figure 7). These values indicate that the NMDS ordination accurately represents the dissimilarity of relationships among samples in a low-dimensional space. The close alignment of ordination distances with the observed dissimilarities further confirms the robustness of the model. The model maintains high accuracy across the majority of the dissimilarity range, according to the stress plot (Figure 7). At lower observed dissimilarities (0.2–0.6), the ordination distances align closely with the expected values, suggesting that species compositions in these samples are well-clustered, with minimal variation. However, at greater observed dissimilarities (> 0.8), the variability in ordination distance increases, implying that certain samples exhibit greater ecological divergence. This pattern suggests a strong separation between species assemblages at different depths and seasons. The NMDS analysis complements the findings from the PCA (Figure 8) and cluster analysis (Figure 9), reinforcing the roles of depth, seasonality, and fishing effort in structuring species composition. The ordination results highlight clear ecological gradients, with deeper habitats and certain seasonal conditions exhibiting distinct species communities. Additionally, there might exist unique species compositions in particular depth strata or fishing zones that are very different from others, as seen by the growing ordination distance at greater dissimilarity levels.
Significant spatial clustering patterns were found by using station similarity analysis based on the species composition within different depth strata (Figure 8). The most similar stations were found at mid-depth ranges (400–499 m and 500–599 m), suggesting stable species assemblages at these depths. Greater dissimilarity was seen between shallower (200–299 m) and deeper (600–699 m) stations, indicating changes in species composition that were probably caused by ecological gradients associated with depth.
These findings complement the PCA results (Figure 8), where the first two principal components explained 94.65% of the total variance in the dataset. The NMDS, cluster, and PCA analyses collectively highlight the strong influence of depth, seasonality, and fishing effort on species distribution and catch efficiency. The results emphasize the need for adaptive fisheries management approaches, particularly for discard mitigation and targeted fishing strategies in deeper waters. To identify the primary sources of variation in the dataset and reduce dimensionality, principal component analysis (PCA) was performed using four key fisheries variables: CPUE, CPUA, Swept Area, and Biomass Per Unit Area. The first principal component (PC1) accounts for 64.06% of the total variance, indicating that it captures the majority of the variability in the dataset. The second principal component (PC2) explains 30.59% of the variance, while the third principal component (PC3) contributes only 5.35%. The fourth principal component (PC4) has a near-zero variance contribution and can be disregarded. Together, PC1 and PC2 explain 94.65% of the total variance, demonstrating that the first two components effectively summarize the key patterns in the dataset.
PC1 (64.06%) likely represents an overall fisheries productivity gradient, as it captures the dominant variance among CPUE, CPUA, and Biomass Per Unit Area. A high loading in this component suggests that locations with larger swept areas and higher biomass tend to have greater CPUE and CPUA values. PC2 (30.59%) appears to differentiate spatial variations in catch efficiency, possibly influenced by differences in CPUE effort and CPUA. PC3 (5.35%) explains only a minor proportion of the variability, indicating that the remaining variation is due to less influential or secondary factors. PC4 (~0%) contributes negligible variance, confirming that most of the meaningful data patterns are captured by the first two principal components. The strong contribution of PC1 (64.06%) and PC2 (30.59%) suggests that catch efficiency and fishing effort are the primary drivers of variation in this dataset. This implies that fishing strategies and habitat characteristics strongly influence CPUE and CPUA. The high cumulative variance explained by PC1 and PC2 (94.65%) indicates that a two-dimensional PCA plot can effectively summarize the relationships between these variables.

3.3. Biodiversity and Species Composition in Trawl Operations

Diversity Indices and Depth-Based Variations

The diversity indices calculated for trawl operations among the different depth ranges provide insights into species richness, evenness, and dominance patterns (Table 5). The Margalef richness index (d), which quantifies species richness, exhibited its highest value at 300–399 m (15.6), indicating a peak in species diversity at this depth. In contrast, the lowest species richness was recorded at 600–699 m (6.69), suggesting a decline in diversity with increasing depth. The Shannon–Wiener diversity index (H’), which accounts for both species richness and evenness, was highest at 500–599 m (3.10), indicating a more balanced community structure at this depth. The lowest value was observed at 200–299 m (2.21), reflecting relatively lower diversity in shallower waters. Statistical analysis revealed no significant differences in species richness or diversity among the different depth strata (Kruskal–Wallis χ2 = 9.804, p = 0.04386).
The values of Pielou’s evenness index (J′) varied from 0.438 (300–399 m) to 0.668 (600–699 m), suggesting that the species incorporated are more uniformly distributed in deeper waters. The relatively low evenness at 300–399 m (0.438) suggests that a few dominant species contribute disproportionately to species richness at this depth. The Simpson’s dominance index (1 − λ′), which measures species dominance by evaluating the probability that two randomly selected individuals belong to the same species, was highest at 400–499 m (0.212) and lowest at 500–599 m (0.0685). This indicates greater species dominance at intermediate depths, whereas species were more evenly distributed at deeper ranges, aligning with the Shannon–Wiener and Pielou’s indices. Overall, the results indicate that species richness peaks at mid-depth (300–399 m), whereas species evenness and overall diversity increase at greater depths (500–599 m). The relatively high Shannon–Wiener values at 500–599 m and 600–699 m suggest a diverse and evenly distributed community structure at these depths. Conversely, the greater dominance observed at shallower depths suggests that certain species are numerically dominant in these ecosystems. These findings highlight the influence of depth on biodiversity and community structure, emphasizing the need for depth-specific conservation and fisheries management strategies. The patterns specifically highlight how crucial it is to establish sustainable fishing standards in place in order to maintain ecological balance, prevent overexploitation, and protect species variety in demersal fisheries.

4. Discussion

4.1. Discard and Bycatch Patterns in Deep-Sea Trawling

Studies on bottom trawling in the Turkish territorial waters of the Mediterranean are generally based on catch composition and selectivity. These studies were carried out for ranges between 20 and 200 m in depth [39,40,41,42,43,44,45,46]. Depth and its associated factors (e.g., sediment type, water dynamics, light availability, and slope inclination) were the primary influences on species distribution, as well as on demersal community structures and catch composition [47,48,49,50,51,52,53]. In this study, the most important targets and bycatch species were obtained from 22 trials: Merluccius merluccius, Aristaeomorpha foliacea, Parapenaus longisostris, Conger conger, Helicolenus dactylopterus, Trigla lyra, and Citharus linguatula. The number of species of economic importance is 33. The total number of species in the discard species was found to be 41, and the most significantly captured discard species were Argentina sphyraena, Chlorophthalmus agassizii, Coelorhynchus coelorhynchus, Hymenocephalus italicus, and Scyliorhinus canicula. Deval et al. (2009) [41] conducted a study in the same fishing area at depths of 441–630 m during the summer of 2007 and identified 12 species as marketable species. Our study of Plesionika martia, Plesionika edwarsii, and Chlorophthalmus agassizii among these species was also included in the discard fishing group since the same species were not of marketable size and quality. The L. piscarorius and P. bogaraveo species captured in the same study were not obtained in the current research, and this may be thought to be due to seasonal differences in sampling studies.
In the study, which was the first report of the JICA (1993) [54] on the resources of demersal fishing in Turkey, the number of species in the western part of the Mediterranean region was 64–66, recorded seasonally. In the same study, the most common economic species in the unit area were Merluccius merluccius, Mullus barbatus, Pagellus erythrinus, and Pagellus acarne, respectively. In our study, it was determined that all these species are still caught, given the current year difference, and since there is not enough data on the stock status of the species mentioned, it is not possible to provide sufficient information about their current situation and stocks. Merluccius merluccius, which we classified in the random species group, was the most widely caught species among bony economic fish [55,56,57]. In their study, which reached a maximum depth of 600 m, Monteiro et al. (2001) [58] reported that two important species of shrimp were the target species and that other species of shrimp and bony fish, even if they were of commercial importance, were included in the off-target fishing group, while very few species reached 90%. When considering the Mediterranean ecosystem in terms of off-target catch composition, the common issue for all studies in regions deeper than 200 m in depth is the subject of off-target fishing. In the same year, the team conducted a similar study in the Sicilian region (Castriota et al., 2004) [59], and reported that there were 170 species in total in the catch composition. It was found that approximately 9 kg of byproducts were obtained in the area where shrimp trawler fishing was carried out, compared to 1 kg with commercial shrimp fishing. They reported that the portion returned to the sea from the side product was revealed to be more than 5 kg. The study, which found the ratio of target fishing to off-target fishing to be 1:1, reveals how high the fishing pressure is when considered on a regional basis. Fishing operation time, depth, and the characteristics of the network used also play a role in increasing the rate of off-target fishing.

4.2. Ecological Impacts and Stock Status Concerns

Since the 200–700 m depth credit where the study was carried out is a widely used area for shrimp fishing in Antalya Bay, the commercial shrimp group has been caught a lot. Since Antalya Bay trawler fishing areas are fished according to the communiqué of the Ministry of Agriculture and in trawler pastures, which are limited due to the suddenly deepening bottom structure of the bay, operations are carried out over the same fishing areas. Approximately 10 years ago, Deval et al. (2009) [41] reported 400.8 kg of shrimp biomass, while the total shrimp biomass was found to be 188.6 kg. This difference is open to debate, as data showed that the stocks of shrimps in the region had decreased over 10 years. Danovaro et al. (2010) [60] also reported that Mediterranean fisheries have shifted to deep-sea areas, due to the depletion of resources in shallower waters. As a known example, the stockpile of Aristeus antennatus, the target species for shrimp fishing in the Catalan Sea, is reportedly close to collapsing after years of exploitation, and therefore fleets are now fishing in waters deeper than 900 m. Furthermore, Clavel-Henry et al. (2020) [61] revealed a 15% decrease in the size of target species (e.g., Aristeus antennatus) in Spanish waters below 900 m over the past decade, attributing this to overfishing and juvenile exploitation. A 2023 meta-analysis emphasized that 70% of Mediterranean deep-sea fisheries lack ecosystem-based management plans [62]. As the target species stocks have decreased, these species have started to be caught in deeper waters, which is a known situation wherein trawling catches a high rate of bycatch and discard species. It is a necessity to know and monitor the bycatch and discard rates of trawling in deep waters. In the present study, the discard and bycatch fishing groups constitute the off-target fishing group, with a total rate of 90%. The total rate of discard fishing in the two groups was found to be 70.7%. Demirci (2003) [63] evaluated the non-target fishing species obtained during the fishing of demersal fish at depths of 750–800 m in the Eastern Mediterranean. It calculated the total amount of discard fisheries in the catch as 68%. Tursi et al. (2018) [64], in their study conducted in the Ionian Sea, examined discard rates in deep waters and found that discard rates ranged between 56.2% and 76.9% at depths of 300–750 m. Similarly, Moranta et al. (2000) [65] reported a discard rate of 70% in a study conducted at three different depths (average depths of 300 m, 489 m, and 616 m) in the Western Mediterranean. The discard rates of trawl fisheries in the different regions of the Mediterranean Basin mentioned above are parallel in terms of the same depth ranges. Technological innovations to reduce bycatch [66] have now gained traction. Bevilacqua et al. (2020) [67] achieved a 35% reduction in bycatch using “smart gear” (light-enhanced nets and optimized mesh sizes).
There are very few studies on species diversity in the context of Mediterranean deep-sea fishing, including those that are ongoing today. In their study, Quignard and Tomasini (2000) [68] reported that the Mediterranean has a very rich diversity, with 650 species of fish. The number of species reported so far in all marine areas owned by Turkey is 517. Of all these fish species, all 447 species are distributed along the Mediterranean coast [69]. Many biodiversity studies are carried out in the pelagic and epi-pelagic zones of the Mediterranean [56,57,65,70,71,72,73,74]. However, these studies are not sufficient for studying Mediterranean deep-sea fauna, except regarding the identification of a particular population and an estimate of its structure. Research on the abundance, depth distribution, and diversity of species is quite limited [75]. However, as with all marine ecosystems in the world in recent years, the exploitation of stocks through overfishing has led those people who make a living from fishing and who benefit economically from it to fish in previously unpopular and deeper regions. Although deep waters are not as heavily exploited as coastal zones in terms of fish population, deep-sea fishing areas are in places that are difficult to fish. In addition to the legal obligations that prevent deep-sea fishing in the Mediterranean, there is also the difficulty of fulfilling these legal obligations [76], as well as the very high cost of the fishing itself.
It is very important to be able to estimate the proportion of discard that is taken onto the deck during fishing and is then returned to the sea, to be able to make instant status assessments of existing stocks and to estimate the results of fishing pressure on the marine area where the research was carried out [5]. In the last 11 years, the importance of ecosystem-based management models has been noted [73,77,78,79,80,81,82]. Off-target fishing can indirectly or directly affect the ecosystem structure. This effect can change the structure of ecosystem functioning or may create a difficult economic situation [83]. According to many of the researchers in this field, off-target fishing is the most important research topic for the evaluation of fishing resources and the estimation of stocks [84]. Reducing off-target fishing rates and the elimination of species by off-target fishing form the basis of the APA criteria mentioned in the study [85]. Discard ratios for trawls are generally lower in the eastern and southern basins of the Mediterranean [7]. Following the findings of Bellido et al. (2014) [13], of the 300 species currently caught in the Mediterranean, only approximately 10% are consistently marketed and 30% are occasionally retained (depending on the sizes and market demand), whereas up to 60% of species are always discarded.
Recent studies (post-2020) confirm that bycatch rates in Mediterranean deep-sea trawling remain alarmingly high, ranging between 50 and 85%. Geraci et al. (2021) [86], in a study of the Western Mediterranean at depth (300–800 m), found that 78% of catches comprised non-commercial species or undersized individuals. Similarly, Tsagarakis et al. (2022) [87] reported a 65% bycatch rate in Eastern Mediterranean deep-water trawls, dominated by species such as Argentina sphyraena and Hymenocephalus italicus. These findings underscore the unsustainable fishing pressure on deep-sea ecosystems in the Mediterranean.

4.3. Management Challenges and Policy Implications

Recent research highlights a continued decline in deep-sea stocks. Mytilineou et al. (2023) [88] documented a 40% reduction in Aristaeomorpha foliacea populations in Greek waters (200–700 m) between 2010 and 2023 and also reported a decrease in the shrimp population, mirroring a reported decline in Antalya Bay by Deval et al. (2009) [41]. The Council Regulations (CE No. 1967/2006) (European Commission, 2009) [12] have established a combination of technical regulations, including gear modifications and gear restrictions, fishing effort limitations, spatial area closures, and management regulations such as a minimum conservation reference size (MCRS) for several species in the Mediterranean Sea.
Addressing the issue of bycatch in fisheries is a highly intricate challenge. The regulation of minimum catch sizes for non-target species, which may hold economic value despite being incidentally caught, is influenced by multiple factors. These include the technological specifications of fishing gear, the ecological consequences of fishing activities, prevailing environmental conditions, and a complex framework of legal regulations established by national and international governing bodies. Collectively, these elements contribute to the difficulty of implementing effective management strategies to mitigate bycatch while ensuring the sustainability of marine resources. It should be noted that if the issue of reducing ecosystem pressure from off-target fishing is not sufficiently emphasized, it has been stated that the functioning of stocks and regional species riches will decrease considerably [89]. Many of the policies implemented so far to reduce off-target fishing have not been successful. However, approaches to minimizing non-targeted fishing from a legal standpoint can be adopted by taking into account successful mitigation practices and integrating them with new methods [90]. When we look at the off-target fishing data, it is evident that the monthly catch ranges from 2% to 31%. CPUE quantities decreased rapidly in the last two months of the sampling period. From September, when the Antalya Bay deep -sea fishing bans end, until the middle of April, stocks under heavy fishing pressure are not able to recover in number as intended, when the fishing bans resume. The reason that CPUE values differ significantly in terms of abundance and biomass in December and January is that the caught shrimp are outnumbered but are not overweight. A similar difference can be seen in the last two months of the study. Although having a large number of individuals is important for species in the deep-sea region in which we conducted our study, the existing stocks are of individuals that have not reached a reproductive length, have not demonstrated sufficient development, or have not completed their growth in terms of weight and morphological structure. The unintended problems of trawling affect the lives of many species, especially shrimps, which fall into the substantial out-of-target fishing group, and this has a significantly negative effect [7,91,92,93].
For eight months, 75 bycatch species were evaluated for diversity using key ecological indices, including Pielou’s evenness index (J′), the Shannon–Wiener diversity index (H′), Simpson’s dominance index (1 − ƛ), and Margalef’s species richness index (d) to record those species caught in deep-sea trawls, revealing significant depth-dependent variations. The highest species richness (d = 15.6) was recorded at depths of 300–399 m, indicating a peak in biodiversity at this range, whereas the lowest richness was observed at 600–699 m (d = 6.69), suggesting a decline in species diversity with increasing depth. The Shannon–Wiener diversity index (H’) was highest at 500–599 m (H′ = 3.10), reflecting a more balanced community structure, while the lowest value was recorded at 200–299 m (H′ = 2.21), suggesting lower species diversity in shallower waters. Pielou’s evenness index (J′) varied among the depth ranges, with the lowest value at 300–399 m (J′ = 0.438), likely due to the dominance of a few species, whereas the highest level of evenness was observed at 600–699 m (J′ = 0.668), indicating more uniform species distribution at greater depths. Simpson’s dominance index (1 − ƛ) was highest at 400–499 m (1 − ƛ = 0.212), signifying increased species dominance at intermediate depths, while the lowest dominance was at 500–599 m (1 − ƛ = 0.0685), suggesting a more evenly distributed species assemblage. Overall, species richness peaked at mid-depths (300–399 m), whereas species evenness and diversity were higher at greater depths (500–599 m), emphasizing the impact of depth on biodiversity and the necessity of depth-specific fisheries management strategies in demersal ecosystems. This can be interpreted as an increase in the homogeneity of the bycatch structure during the fishing season. In a study conducted at depths of 30–110 m in İskenderun Bay, Yemişken (2014) [23] estimated the Shannon–Wiener diversity index as H′ = 1.826 and the evenness index (homogeneity index) as J′ = 0.382. Gökçe et al. (2016) [94] reported an evenness index of J′ = 0.62, species richness (S) = 135, and a Shannon–Wiener diversity index of H′ = 3.02.
Another challenge for researchers is that some of the bony fish, which were not initially evaluated commercially due to the significant reduction in the number of species obtained from the region economically, have fallen out of the off-target fishing group and fall into the economically assessable species class. Another complex situation related to fishing is that for some marine regions, a species registered as a commercial species does not have the same economic importance in another geographic region. While this is one of the methods used to determine non-target fishing groups, it should be noted that individuals that are economically valuable but are under legal market restrictions also fall into the non-target fishing group. There are a large number of factors used to determine the non-target fishing group, namely, bycatch and discard individuals. The concept of off-target fishing is linked to marketing and economic conditions, as we have mentioned many times above. The proportional disparity between target and non-target fishing can be effectively assessed by considering regional variations, which provide precise insights into fisheries dynamics. However, commercial trawling operations are typically conducted at specific depths and within defined fishing periods, minimizing external interference from other fishing activities. This structured approach ensures that variations in catch composition are primarily influenced by depth-specific and seasonal factors, rather than by inconsistencies in fishing effort or external disturbances [44,95,96,97,98,99]. Considering these findings, it is evident that more extensive and systematic research is required to address the challenges associated with deep-sea fisheries management. Our study is consistent with previous research conducted in the Mediterranean region, reinforcing the critical need for effective discard reduction strategies. The adoption of ecosystem-based fisheries management is essential for safeguarding the sustainability of deep-sea fish stocks while mitigating the long-term ecological impacts of high discard rates.

5. Conclusions

Discards are primarily a consequence of the multi-species exploitation practices seen in bottom trawl fisheries. This work shows the potent effects of this kind of fishing by identifying changeableCPUE and CPUA values concerningtarget, bycatch, and discard species due to thedepth and seasonality in the region. This may indicate that the region is being overexploited, raising questions about the sustainability of fish stocks in the long term. The variations recorded in catch composition, biodiversity index, and discard rate at each depth represent one of the main findings of this study. Along with decreasing stock numbers, this decline in biomass reinforces the need for ongoing monitoring and stringent regulatory measures to prevent stocks from becoming depleted. Nevertheless, in the Mediterranean area, several legal provisions are already exist, including seasonal and spatial bans on fishing activity, minimum landing size, and mesh size. In contrast, although the European Union is banning fishing in certain regions at depths greater than 800 m, non-EU nations have no equivalent protective measures. Extending such depth limits, which would be yet another evidence-based measure to improve sustainability, would be key to achieving better conservation of deep-sea systems and the long-term viability of fisheries. To address these challenges and promote sustainability on a larger scale, fisheries management must emphasize effective gear selectivity adjustments, enhanced sorting to retain more catches of economically critical species and minimize discards, and thoughtful adaptive conservation efforts. Stock assessments and tighter fishing quotas are key to avoiding further overexploitation, while seasonal closures during spawning periods could help populations recover. There also needs to be better monitoring programs in place to prevent overexploitation.
The over-representation of discard species in the community-averaged catch compositions recorded illustrates the problem of nonselective trawling. The results showed that low CPUE and CPUA values for target species reflect either stock depletion or naturally low abundance, requiring urgent management intervention. Although certain commercial species show moderate levels of fishing efficiency, bycatch risk is still an issue. Ecosystem-based fisheries management must become the gold standard, whether by making the process economically viable or mitigating the destruction of that ecosystem. We hope to inform future experts in optimizing fishing approaches based on these models, with AI-driven predictive models of future fish occurrences and advanced stock assessment techniques being used to promote sustainability. The integrity of this region’s deep-sea fisheries, both ecological and economic, will continue to be compromised without immediate and conscientious regulatory action. Collaborative efforts among policymakers, researchers, and industry stakeholders will be key to addressing the multifaceted challenges of deep-sea fisheries and securing a sustainable future for Mediterranean fisheries.

Author Contributions

Conceptualization, N.C., T.D. and D.G.; methodology, T.D., D.G. and N.C.; formal analysis, N.C. and T.D.; investigation, T.D. and N.C; writing—original draft preparation, T.D., D.G. and N.C.; writing—review and editing, N.C., T.D. and D.G.; visualization, T.D., N.C. and D.G. All authors have read and agreed to the published version of the manuscript.

Funding

This research received no external funding.

Institutional Review Board Statement

Not applicable.

Informed Consent Statement

Not applicable.

Data Availability Statement

The raw data supporting the conclusions of this article will be made available by the authors upon request.

Acknowledgments

We would like to express our gratitude to M. Cengiz Deval for all his contributions and support in developing this study. Also, we thank M. Tunca Olguner for his support during the field study. We would also like to extend our thanks to the captain and crew of the research vessel “R/Akdeniz Su” for their help on the sea trip. We are grateful to anonymous reviewers for their constructive and helpful comments.

Conflicts of Interest

The authors declare no conflicts of interest.

Abbreviations

The following abbreviations are used in this manuscript:
EUEuropean Union
CFPCommon Fisheries Policy
IUCNInternational Union for the Conservation of Nature
RFMOsRegional Fisheries Management Organizations
GFCMGeneral Fisheries Commission for the Mediterranean
CPUECatch Per Unit Effort
CPUACatch Per Unit Area
JICAJapan International Cooperation Agency
MCRSMinimum Conservation Reference Size

References

  1. Koslow, J.; Boehlert, G.W.; Gordon, J.D.; Haedrich, R.L.; Lorance, P.; Parin, N. Continental slope and deep-sea fisheries: Implications for a fragile ecosystem. ICES J. Mar. Sci. 2000, 57, 548–557. [Google Scholar] [CrossRef]
  2. FAO. Deep-Ocean Climate Change Impacts on Habitat, Fish and Fisheries; Levin, L., Baker, M., Thompson, A., Eds.; FAO: Rome, Italy, 2019; FAO Fisheries and Aquaculture Technical Paper No. 638; 186p. [Google Scholar]
  3. Morato, T.; Cheung, W.; Pitcher, T. Vulnerability of seamount fish to fishing: Fuzzy analysis of life-history attributes. J. Fish Biol. 2006, 68, 209–221. [Google Scholar] [CrossRef]
  4. Colloca, F.; Cardinale, M.; Belluscio, A.; Ardizzone, G. Pattern of distribution and diversity of demersal assemblages in the central Mediterranean Sea. Estuar. Coast. Shelf Sci. 2003, 56, 469–480. [Google Scholar] [CrossRef]
  5. Rochet, M.J.; Trenkel, V.M. Factors for the variability of discards: Assumptions and field evidence. Can. J. Fish. Aquat. Sci. 2005, 62, 224–235. [Google Scholar] [CrossRef]
  6. Tiralongo, F.; Messina, G.; Lombardo, B.M. Discards of elasmobranchs in a trammel net fishery targeting cuttlefish, Sepia officinalis Linnaeus, 1758, along the coast of Sicily (central Mediterranean Sea). Reg. Stud. Mar. Sci. 2018, 20, 60–63. [Google Scholar] [CrossRef]
  7. Tsagarakis, K.; Palialexis, A.; Vassilopoulou, V. Mediterranean fishery discards: Review of the existing knowledge. ICES J. Mar. Sci. 2014, 71, 1219–1234. [Google Scholar] [CrossRef]
  8. Bianchi, C.N.; Morri, C. Marine biodiversity of the Mediterranean Sea: Situation, problems and prospects for future research. Mar. Pollut. Bull. 2000, 40, 367–376. [Google Scholar] [CrossRef]
  9. Catchpole, T.L.; Frid, C.L.; Gray, T.S. Discards in North Sea fisheries: Causes, consequences and solutions. Mar. Policy 2005, 29, 421–430. [Google Scholar] [CrossRef]
  10. Johnsen, J.P.; Eliasen, S. Solving complex fisheries management problems What the EU can learn from the Nordic ex-periences of reduction of discards. Mar. Policy 2011, 35, 130–139. [Google Scholar] [CrossRef]
  11. Kelleher, K. Discards in the World’s Marine Fisheries. An Update; FAO: Rome, Italy, 2005; FAO Fisheries Technical Paper. No. 470; 131p, ISBN 92-5-105289-1. [Google Scholar]
  12. EU. Green Paper–Reform of the Common Fisheries Policy; CPMR: Brussels, Belgium, 2009.
  13. Bellido, J.M.; Carbonell, A.; Garcia, M.; Garcia, T.; González, M. The Obligation to Land All Catches–Consequences for the Mediterranean. In-Depth Analysis; European Parliament: Brussels, Belgium, 2014; Policy department B: Structural and cohesion policies.
  14. Gilman, E.; Passfield, K.; Nakamura, K. Performance of regional fisheries management organizations: Ecosystem-based governance of bycatch and discards. Fish Fish. 2014, 15, 327–351. [Google Scholar] [CrossRef]
  15. Maravelias, C.D.; Tserpes, G.; Pantazi, M.; Peristeraki, P. Habitat selection and temporal abundance fluctuations of demer-sal cartilaginous species in the Aegean Sea (eastern Mediterranean). PLoS ONE 2012, 7, e35474. [Google Scholar] [CrossRef] [PubMed]
  16. Tserpes, G.; Maravelias, C.D.; Pantazi, M.; Peristeraki, P. Distribution of relatively rare demersal elasmobranchs in the eastern Mediterranean. Estuar. Coast. Shelf Sci. 2013, 117, 48–53. [Google Scholar] [CrossRef]
  17. Deval, M.C.; Özgen, G.; Özbilgin, H. Selectivity of 50 mm T0 and T90 codends for commercial shrimp species in the Turkish deepwater trawl fishery, Eastern Mediterranean. J. Appl. Ichthyol. 2016, 32, 1041–1057. [Google Scholar] [CrossRef]
  18. Deval, M.C.; Kapiris, K. A review of biological patterns of the blue-red shrimp Aristeus antennatus in the Mediterra-nean Sea: A case study of the population of Antalya Bay, eastern Mediterranean Sea. Sci. Mar. 2016, 80, 339–348. [Google Scholar] [CrossRef]
  19. Deval, M.C.; Yılmaz, S.; Kapiris, K. Spatio temporal variations in decapod crustacean assemblages of bathyal ground in the Antalya Bay (Eastern Mediterranean). Turk. J. Fish. Aquat. Sci. 2017, 17, 967–979. [Google Scholar] [CrossRef]
  20. Deval, M.C. Population dynamics and biological patterns of commercial crustacean species in the Antalya Bay, Eastern Mediterranean Sea: III. The giant red shrimp Aristaeomorpha foliacea Risso, 1827. Turk. J. Fish. Aquat. Sci-Ences 2019, 20, 311–323. [Google Scholar] [CrossRef]
  21. Deval, M.C.; Mutlu, E. Spatio-temporal density of the demersal Chondrichthyes assemblage in an upper bathyal of the eastern Mediterranean Sea. Mar. Biodivers. 2024, 54, 31. [Google Scholar] [CrossRef]
  22. Bayhan, Y.K.; Ergüden, D.; Cartes, J.E. Deep Sea Fisheries in Mersin Bay, Turkey, Eastern Mediterranean: Diversity and Abundance of Shrimps and Benthic Fish Fauna. Acta Zool. Bulg. 2018, 70, 259–268. [Google Scholar]
  23. Yemisken, E.; Dalyan, C.; Eryilmaz, L. Catch and discard fish species of trawl fisheries in the Iskenderun Bay (North-eastern Mediterranean) with emphasis on lessepsian and chondricthyan species. Mediterr. Mar. Sci. 2014, 15, 380–389. [Google Scholar] [CrossRef]
  24. Holden, M.J.; Raitt, D.F.S. Manual of Fisheries Science Part 2-Methods of Resource Investigation and Their Application; FAO Fisheries Technical Paper No. 115; FAO: Rome, Italy, 1974; 255p. [Google Scholar]
  25. Avşar, D. Fisheries Biology and Population Dynamics; Adana Nobel Kitabevi: Adana, Türkiye, 2005; p. 332. ISBN 978-975-856-144-5. [Google Scholar]
  26. Whitehead, P.J.P.; Bauchot, M.L.; Hureau, J.C.; Nielsen, J.; Tortonese, E. Fishes of the North-Eastern Atlantic and the Medi-Terranean; United Nations Educational, Scientific and Cultural Organization: Paris, France, 1986; Volume 2. [Google Scholar]
  27. Froese, R.; Pauly, D. FishBase. World Wide Web Electronic Publication. Available online: https://fishbase.org/search.php (accessed on 13 February 2025).
  28. Fischer, W.; Schneider, M.; Bauchot, M.-L. Fiches FAO D’identification des Especes Pour les Besoins de la Pêche. Mé-Diterranée et Mer Noire (Zone De Pêche 37), Révision 1, Volume 2; FAO: Rome, Italy, 1987. [Google Scholar]
  29. Shannon, C.; Weiner, W. A Mathematical Theory of Communication; University of Illinois Press: Champaign, IL, USA, 1948. [Google Scholar]
  30. Pielou, E.C. The measurement of diversity in different types of biological collections. J. Theor. Biol. 1966, 13, 131–144. [Google Scholar] [CrossRef]
  31. Margalef, R. La teoria de la informacion en ecologia. Mem. Real Acad. De Cienc. Artes Barc. 1957, 32, 373–436. [Google Scholar]
  32. Simpson, E.H. Measurement of diversity. Nature 1949, 163, 688. [Google Scholar] [CrossRef]
  33. Beisel, J.N.; Moreteau, J.C. A simple formula for calculating the lower limit of Shannon’s diversity index. Ecol. Model. 1997, 99, 289–292. [Google Scholar] [CrossRef]
  34. Sparre, P. Introduction to tropical fish stock assessment. Part 1: Manual. FAO Fish. Tech. Paper 1993, 306, 192–218. [Google Scholar]
  35. Bray, J.R.; Curtis, J.T. An ordination of the upland forest communities of southern Wisconsin. Ecol. Monogr. 1957, 27, 326–349. [Google Scholar] [CrossRef]
  36. Oksanen, J.; Blanchet, F.G.; Kindt, R.; Legendre, P.; Minchin, P.R.; O’Hara, R.B.; Simpson, G.L.; Solymos, P.; Stevens, M.H.H.; Wagner, H.; et al. Package ‘vegan’. Community Ecology Package, Version 2013; Volume 2, pp. 1–295. Available online: https://cran.r-project.org/web/packages/vegan/vegan.pdf (accessed on 23 January 2024).
  37. RStudio Team. RStudio: Integrated Development for R; PBC: Boston, MA, USA, 2024. [Google Scholar]
  38. Clarke, K.; Gorley, R. Primer. PRIMER-e, Plymouth; Saint Mary’s University: Halifax, NS, Canada, 2006; p. 866. [Google Scholar]
  39. Cicek, E.; Avsar, D.; Yeldan, H.; Ozutok, M. Length–weight relationships for 31 teleost fishes caught by bottom trawl net in the Babadillimani Bight (northeastern Mediterranean). J. Appl. Ichthyol. 2006, 22, 290–292. [Google Scholar] [CrossRef]
  40. Çiçek, E.; Avşar, D.; Yeldan, H.; Meltem Özütok, M. General characteristics of teleost fish fauna trawled from Babadılli-manı Bight (Mersin, Türkiye). Ege J. Fish. Aquat. Sci. 2004, 21, 223–227. [Google Scholar]
  41. Deval, M.C.; Bök, T.; Ateş, C.; Ulutürk, T.; Tosunoğlu, T. Comparison of the size selectivity of diamond (PA) and square (PE) mesh codends for deepwater crustacean species in the Antalya Bay, eastern Mediterranean. J. Appl. Ichthyol. 2009, 25, 372–380. [Google Scholar] [CrossRef]
  42. Eryaşar, A.R.; Özbilgin, H.; Gökçe, G.; Özbilgin, Y.D.; Saygu, İ.; Bozaoğlu, A.S.; Kalecik, E. The effect of codend circumfer-ence on selectivity of hand-woven slack knotted codend in the North Eastern Mediterranean demersal trawl fishery. Turk. J. Fish. Aquat. Sci. 2014, 14, 463–470. [Google Scholar] [CrossRef]
  43. Kebapçıoğlu, T. Interaction Between the Coastal Bottom Trawl Fishery and the Small-Scale Fisheries in the Northeast Mediterranean (Antalya). Ph.D. Thesis, Akdeniz University, Antalya, Turkey, 2014. [Google Scholar]
  44. Soykan, O. Seasonal Distribution of By-Catch Species in Sığacık Bay by Demersal Trawl. Ph.D. Thesis, Ege University, Bornova, Turkey, 2011. [Google Scholar]
  45. Yemişken, E. Comparison of Trawl Fisheries Effects Onchondrichthyan Species in Fishing Areas of Eastern Mediterranean Sea. Ph.D. Thesis, İstanbul Üniversitesi, Fatih, Turkey, 2017. [Google Scholar]
  46. Yeşilçimen, H.Ö.; Kuşat, M. Monthly change of economic fish species caught by bottom trawl fishing from Antalya bay. J. FisheriesSciences.com 2011, 5, 115–121. [Google Scholar] [CrossRef]
  47. Biagi, F.; Sartor, P.; Ardizzone, G.D.; Belcari, P.; Belluscio, A.; Serena, F. Analysis of demersal fish assemblages of the Tus-cany and Latium coasts (north-western Mediterranean). Sci. Mar. 2002, 66, 233–242. [Google Scholar] [CrossRef]
  48. Busalacchi, B.; Rinelli, P.; De Domenico, F.; Profeta, A.; Perdichizzi, F.; Bottari, T. Analysis of demersal fish assemblages off the Southern Tyrrhenian Sea (central Mediterranean). Hydrobiologia 2010, 654, 111–124. [Google Scholar] [CrossRef]
  49. Cartes, J.E.; Maynou, F.; Fanelli, E.; Romano, C.; Mamouridis, V.; Papiol, V. The distribution of megabenthic, invertebrate epifauna in the Balearic Basin (western Mediterranean) between 400 and 2300 m: Environmental gradients influencing assem-blages composition and biomass trends. J. Sea Res. 2009, 61, 244–257. [Google Scholar] [CrossRef]
  50. Colloca, F.; Crespi, V.; Cerasi, S.; Coppola, S.R. Evolution of the Artisanal Fishery in Cilento, Italy: Case Study; FAO: Rome, Italy, 2003. [Google Scholar]
  51. Demestre, M.; Sanchez, P.; Abello, P. Demersal fish assemblages and habitat characteristics on the continental shelf and upper slope of the north-western Mediterranean. J. Mar. Biol. Assoc. U. K. 2000, 80, 981–988. [Google Scholar] [CrossRef]
  52. Gaertner, D.; Menard, F.; Develter, C.; Javier, A. Bycatch of billfishes by the European tuna purse-seine fishery in the Atlantic Ocean. Fish. Bull. 2002, 100, 683–690. [Google Scholar]
  53. Soykan, O.; Bakır, K.; Kınacıgil, H.T. Demersal trawl discards with spatial and bathymetric emphasis in the Turkish coast of the Aegean Sea. Mar. Biol. Res. 2019, 15, 113–123. [Google Scholar] [CrossRef]
  54. Japonya Uluslararası İşbirliği Ajansı (Jıca). Marmara, Ege ve Akdeniz’de Demersal Balıkçılık Kaynakları Sörvey Raporu (Survey Report on Demersal Fisheries Resources in Sea of Marmara, Aegean Sea and Mediterranean Sea). Tarım ve Köyişleri Bakanlığı, Tarımsal Üretim ve Geliştirme Genel Müdürlüğü, Japonya Uluslararası İşbirliği Ajansı: Ankara, Türkiye, 1993; 579p. Available online: https://kutuphane.tarimorman.gov.tr/vufind/Record/11040 (accessed on 26 May 2024).
  55. Damalas, D.; Ligas, A.; Tsagarakis, K.; Vassilopoulou, V.; Stergiou, K.I.; Kallianotis, A.; Sbrana, M.; Maynou, F. The” dis-card problem” in Mediterranean fisheries, in the face of the European Union landing obligation: The case of bottom trawl fishery and implications for management. Mediterr. Mar. Sci. 2018, 19, 459–476. [Google Scholar] [CrossRef]
  56. Sánchez, F.; Olaso, I. Effects of fisheries on the Cantabrian Sea shelf ecosystem. Ecol. Model. 2004, 172, 151–174. [Google Scholar] [CrossRef]
  57. Sartor, P.; Sbrana, M.; Reale, B.; Belcari, P. Impact of the deep sea trawl fishery on demersal communities of the northern Tyrrhenian Sea (Western Mediterranean). J. Northwest Atl. Fish. Sci. 2003, 31, 275–284. [Google Scholar] [CrossRef]
  58. Monteiro, P.; Araújo, A.; Erzini, K.; Castro, M. Discards of the Algarve (southern Portugal) crustacean trawl fishery. Hydrobiologia 2001, 449, 267–277. [Google Scholar] [CrossRef]
  59. Castriota, L.; Falautano, M.; Romeo, T.; Florio, J.; Pelusi, P.; Finoia, M.G.; Andaloro, F. Crustacean fishery with bottom traps in an area of the southern Tyrrhenian Sea: Species composition, abundance and biomass. Mediterr. Mar. Sci. 2004, 5, 15–22. [Google Scholar] [CrossRef]
  60. Danovaro, R.; Company, J.B.; Corinaldesi, C.; D’Onghia, G.; Galil, B.; Gambi, C.; Gooday, A.J.; Lampadarious, N.; Luna, G.M.; Morigi, C.; et al. Deep-sea biodiversity in the Mediterranean Sea: The known, the unknown, and the unknowable. PLoS ONE 2010, 5, e11832. [Google Scholar] [CrossRef] [PubMed]
  61. Clavel-Henry, M.; Bahamon, N.; Solé, J.; Gorelli, G.; Garcia del Arco, J.A.; Carretón, M.; Rotllant, G.; Company, J.B. Mod-eling the spatiotemporal distribution of the deep-sea shrimp Aristeus antennatus (Crustacea: Decapoda) on the northwestern Mediterranean continental margin crossed by submarine canyons. J. Mar. Syst. 2020, 209, 103372. [Google Scholar] [CrossRef]
  62. Pipitone, C.; Agnetta, D.; Zenone, A.; Giacalone, V.M.; Badalamenti, F.; Fiorentino, F.; D’Anna, G. When the trawl ban is a good option: Opportunities to restore fish biomass and size structure in a Mediterranean fisheries restricted area. Sustainbility 2023, 15, 2425. [Google Scholar] [CrossRef]
  63. Demirci, A. Non-Target Demersal Species Inhabiting İskenderun Bay and Them Biomass Estimation. Master’s Thesis, Mustafa Kemal University, Antakya, Turkey, 2003. [Google Scholar]
  64. Tursi, A.; Corbelli, V.; Cipriano, G.; Capasso, G.; Velardo, R.; Chimienti, G. Mega-litter and remediation: The case of Mar Piccolo of Taranto (Ionian Sea). Rend. Lincei. Sci. Fis. Nat. 2018, 29, 817–824. [Google Scholar] [CrossRef]
  65. Moranta, J.; Massutí, E.; Morales-Nin, B. Fish catch composition of the deep-sea decapod crustacean fisheries in the Balearic Islands (western Mediterranean). Fish. Res. 2000, 45, 253–264. [Google Scholar] [CrossRef]
  66. Lucchetti, A.; Melli, V.; Brcic’, J. Editorial: Innovations in fishing technology aimed at achieving sustainable fishing. Front. Mar. Sci. 2023, 10, 6. [Google Scholar] [CrossRef]
  67. Bevilacqua, S.; Katsanevakis, S.; Micheli, F.; Sala, E.; Rilov, G.; Sarà, G.; Malak, D.A.; Abdulla, A.; Grerovasileiou, V.; Gissi, E.; et al. The status of coastal benthic ecosystems in the Mediterranean Sea: Evidence from ecological indicators. Front. Mar. Sci. 2020, 7, 475. [Google Scholar] [CrossRef]
  68. Quignard, J.P.; Tomasini, J. Mediterranean fish biodiversity. Biol. Mar. Mediterr. 2000, 7, 1–66. [Google Scholar]
  69. Bilecenoğlu, M.; Kaya, M.; Cihangir, B.; Çiçek, E. An updated checklist of the marine fishes of Turkey. Turk. J. Zool. 2014, 38, 901–929. [Google Scholar] [CrossRef]
  70. Carbonell, A.; Alemany, F.; Merella, P.; Quetglas, A.; Román, E. The by-catch of sharks in the western Mediterranean (Bal-earic Islands) trawl fishery. Fish. Res. 2003, 61, 7–18. [Google Scholar] [CrossRef]
  71. Gorelli, G.; Blanco, M.; Sardà, F.; Carretón, M.; Company, J.B. Spatio-temporal variability of discards in the fishery of the deep-sea red shrimp Aristeus antennatus in the northwestern Mediterranean Sea: Implications for management. Sci. Mar. 2016, 80, 79–88. [Google Scholar] [CrossRef]
  72. Martínez-Abraín, A.; Maestre, R.; Oro, D. Demersal trawling waste as a food source for Western Mediterranean sea-birds during the summer. ICES J. Mar. Sci. 2002, 59, 529–537. [Google Scholar] [CrossRef]
  73. Sánchez, P.; Sartor, P.; Recasens, L.; Ligas, A.; Martin, J.; De Ranieri, S.; Demestre, M. Trawl catch composition during dif-ferent fishing intensity periods in two Mediterranean demersal fishing grounds. Sci. Mar. 2007, 71, 765–773. [Google Scholar] [CrossRef]
  74. Blanco, M.; Nos, D.; Lombarte, A.; Recasens, L.; Company, J.B.; Galimany, E. Characterization of discards along a wide bathymetric range from a trawl fishery in the NW Mediterranean. Fish. Res. 2023, 258, 106552. [Google Scholar] [CrossRef]
  75. Gönülal, O.; Özcan, T.; Katagan, T. A contrubition on the distribution of the giant red shrimp Aristaeomorpha foliacea (Risso, 1827) alond the Aegen Sea and Mediterranean part of Turkey. Rapp. Comm. Int. Mer. Médit. 2010, 39, 534. [Google Scholar]
  76. Republic of Türkiye Ministry of Agriculture and Forestry. Available online: https://www.tarimorman.gov.tr/Konular/Su-Urunleri/Su-Urunleri-Avciligi (accessed on 25 December 2024).
  77. Edelist, D.; Sonin, O.; Golani, D.; Rilov, G.; Spanier, E. Spatiotemporal patterns of catch and discards of the Israeli Mediter-ranean trawl fishery in the early 1990 s: Ecological and conservation perspectives. Sci. Mar. 2011, 75, 641–652. [Google Scholar] [CrossRef]
  78. Garcia, S.M.; Zerbi, A.; Aliaume, C.; Do Chi, T.; Lasserre, G. The Ecosystem Approach to Fisheries. Issues, Terminology, Prin-Ciples, Institutional Foundations, Implementation and Outlook; FAO: Rome, Italy, 2003; FAO Fisheries Technical Paper. No. 443; p. 71. ISBN 92-5-104960-2. [Google Scholar]
  79. Gücü, A.C. Impact of depth and season on the demersal trawl discard. Turk. J. Fish. Aquat. Sci. 2012, 12, 817–830. [Google Scholar] [CrossRef]
  80. Massutí, E.; Reñones, O. Demersal resource assemblages in the trawl fishing grounds off the Balearic Islands (western Mediterranean). Sci. Mar. 2005, 69, 167–181. [Google Scholar] [CrossRef]
  81. Milisenda, G.; Vitale, S.; Massi, D.; Enea, M.; Gancitano, V.; Giusto, G.B.; Badalucco, C.; Gristina, M.; Garofalo, G.; Fiorentino, F. Discard composition associated with the deep water rose shrimp fisheries (Parapenaeus longirostris, Lucas 1846) in the south-central Mediterranean Sea. Mediterr. Mar. Sci. 2017, 18, 53–63. [Google Scholar] [CrossRef]
  82. Pillai, S.L.; Kizhakudan, S.J.; Radhakrishnan, E.V.; Thirumilu, P. Crustacean bycatch from trawl fishery along north Tamil Nadu coast. Indian J. Fish. 2014, 61, 7–13. [Google Scholar]
  83. Jennings, S.; Kaiser, M.J. The effects of fishing on marine ecosystems. Adv. Mar. Biol. 1998, 34, 201–352. [Google Scholar] [CrossRef]
  84. Bellido, J.M.; Santos, M.B.; Pennino, M.G.; Valeiras, X.; Pierce, G.J. Fishery discards and bycatch: Solutions for an ecosys-tem approach to fisheries management? Hydrobiologia 2011, 670, 317–333. [Google Scholar] [CrossRef]
  85. Hilborn, R. Future directions in ecosystem based fisheries management: A personal perspective. Fish. Res. 2011, 108, 235–239. [Google Scholar] [CrossRef]
  86. Geraci, M.L.; Colloca, F.; Di Maio, F.; Falsone, F.; Fiorentino, F.; Sardo, G.; Scannella, D.; Gancitano; Vitale, S. How is artificial lighting affecting the catches in deep water rose shrimp trawl fishery of the Central Mediterranean Sea? Ocean Coast. Manag. 2021, 215, 105970. [Google Scholar] [CrossRef]
  87. Tsagarakis, T.K.; Libralato, S.; Giannoulaki, M.; Touloumis, K.; Somarakis, S.; Machias, A.; Frangoulis, C.; Papantoniou; Kavadas, S.; Stoumboudi, M.T. Drivers of the north Aegean Sea ecosystem (Eastern Mediterranean) through time: Insights from multidecadal retrospective analysis and future simulations. Front. Mar. Sci. 2022, 9, 919793. [Google Scholar] [CrossRef]
  88. Mytilineou, C.; Herrmann, B.; Mantopoulou-Palouka, D.; Sala, A.; Megalofonou, P. Escape, discard, and landing probabil-ity in multispecies Mediterranean bottom-trawl fishery. ICES J. Mar. Sci. 2023, 80, 542–555. [Google Scholar] [CrossRef]
  89. Rochet, M.J.; Collie, J.S.; Jennings, S.; Hall, S.J. Does selective fishing conserve community biodiversity? Predictions from a length-based multispecies model. Can. J. Fish. Aquat. Sci. 2011, 68, 469–486. [Google Scholar] [CrossRef]
  90. Gezelius, S.S. The Problem of Implementing Policies for Sustainable Fishing. In Making Fisheries Management Work: Implementation of Policies for Sustainable Fishing; Gezelius, S.S., Raakjaer, J., Eds.; Springer: Dordrecht, The Netherlands, 2008; pp. 1–25. ISBN 978-1-4020-8627-4. [Google Scholar]
  91. Fiorentino, F.; Badalamenti, F.; D’anna, G.; Garofalo, G.; Gianguzza, P.; Gristina, M.; Pipitone, C.; Rizzo, P.; Fortibuoni, T. Changes in spawning-stock structure and recruitment pattern of red mullet, Mullus barbatus, after a trawl ban in the Gulf of Castellammare (central Mediterranean Sea). ICES J. Mar. Sci. 2008, 65, 1175–1183. [Google Scholar] [CrossRef]
  92. Uhlmann, S.S.; Van Helmond, A.T.; Kemp Stefánsdóttir, E.; Sigurðardóttir, S.; Haralabous, J.; Bellido, J.M.; Catbonell, A.; Catchpole, T.; Damas, D.; Faucannet, L.; et al. Discarded fish in European waters: General patterns and contrasts. ICES J. Mar. Sci. 2014, 71, 1235–1245. [Google Scholar] [CrossRef]
  93. Voliani, A.; Abella, A.; Auteri, R. Some considerations on the growth performance of Mullus barbatus. Cah. Options Mediterr. 1998, 35, 93–106. [Google Scholar]
  94. Gökçe, G.; Saygu, I.; Eryaşar, A.R. Catch composition of trawl fisheries in Mersin Bay with emphasis on catch biodiver-sity. Turk. J. Zool. 2016, 40, 522–533. [Google Scholar] [CrossRef]
  95. Kaiser, M.J.; Ramsay, K.; Richardson, C.A.; Spence, F.E.; Brand, A.R. Chronic fishing disturbance has changed shelf sea benthic community structure. J. Anim. Ecol. 2000, 69, 494–503. [Google Scholar] [CrossRef]
  96. Lauria, V.; Garofalo, G.; Fiorentino, F.; Massi, D.; Milisenda, G.; Piraino, S.; Russo, T.; Gristina, M. Species distribution models of two critically endangered deep-sea octocorals reveal fishing impacts on vulnerable marine ecosystems in central Mediterranean Sea. Sci. Rep. 2017, 7, 8049. [Google Scholar] [CrossRef] [PubMed]
  97. Pinello, D.; Gee, J.; Accadia, P.; Sabatella, E.C.; Vitale, S.; Polymeros, K.; Fiorentino, F. Efficiency of shallow-and deep-water trawling in the Mediterranean and its implications for discard reduction. Sci. Mar. 2018, 82, 97–106. [Google Scholar] [CrossRef]
  98. Pitcher, C.R.; Ellis, N.; Althaus, F.; Williams, A.; McLeod, I.M.; Bustamante, R.H.; Kenyon, R.; Fuller, M. Implications of Currentspatial Management Measures for AFMA ERAs for Habitats—FRDC Project No 2014/204; CSIRO Oceans & Atmosphere: Brisbane, Australia, 2015; 50p, ISBN 978-1-4863-0685-5. [Google Scholar]
  99. Valentine, P.C.; Almeida, F.P. Effects of fishing on gravel habitats: Assessment and recovery of benthic megafauna on Georges Bank. Am. Fish. Soc. Symp. 2005, 41, 325–343. [Google Scholar]
Figure 1. Maps of the study area, showing the Mediterranean and the Antalya Bay sampling stations.
Sustainability 17 05040 g001
Figure 2. The distribution of calculated CPUE values by depth and season.
Sustainability 17 05040 g002
Figure 3. The spatial distribution of CPUE values among different depth strata and geographic locations.
Sustainability 17 05040 g003
Figure 4. Geographical distribution map of the swept area, showing the spatial distribution of the swept area among the different latitudes and longitudes. Larger bubbles indicate more extensive trawling activities.
Sustainability 17 05040 g004
Figure 5. Comparison of total CPUE and CPUA values according to target, bycatch, and discard groups in biomass.
Sustainability 17 05040 g005
Figure 6. NMDS analysis of the target, discard, and commercial species.
Sustainability 17 05040 g006
Figure 7. Stress plot for NMDS ordination, showing the relationship between observed dissimilarity and ordination distance.
Sustainability 17 05040 g007
Figure 8. Principal component analysis (PCA) of the fisheries variables: CPUE, CPUA, and biomass per unit area.
Sustainability 17 05040 g008
Figure 9. Depth strata analysis, showing the similarity of species.
Sustainability 17 05040 g009
Table 1. List of species and the percentage of species occurrence (N: number; W: weight) according to the level of taxonomic classification (t: target, c: commercial/bycatch, and d: discard species).
ClassFamilySpeciesAuthorN%W%t/c/d
Elasmobranchii Centrophoridae Centrophorus granulosusBloch and Schneider, 18010.014.90d
Etmopteridae Etmopterus spinaxLinnaeus, 17580.301.67d
Rajidae Raja clavataLinnaeus, 17580.092.63c
Rajidae Raja oxyrhynchusLinnaeus, 17580.010.69c
SqualidaeSqualus blainvilleiRisso, 18270.052.45d
DalatiidaeDalatias lichaBonnaterre, 17880.000.28d
DasyatidaeDasyatis pastinacaLinnaeus, 17580.000.29d
PentanchidaeGaleus melastomusRafinesque, 18100.362.36d
HexanchidaeHeptranchias perloBonnaterre, 17880.000.02d
OxynotidaeOxynotus centrinaLinnaeus, 17580.000.06d
Scyliorhinidae Scyliorhinus caniculaLinnaeus, 17580.342.34d
ActinopterygiiSparidae Boops boopsLinnaeus, 17580.050.24c
CitharidaeCitharus linguatulaLinnaeus, 17580.010.02c
CongridaeConger congerLinnaeus, 17580.020.47c
Dussumieriidae Etrumeus teresDeKay, 18420.000.06c
SebastidaeHelicolenus dactylopterusDelaroche, 18091.110.10c
LophiidaeLophius budegassaSpinola, 18070.010.71c
MerlucciidaeMerluccius merlucciusLinnaeus, 17580.132.44c
MullidaeMullus barbatusLinnaeus, 17580.040.25c
MullidaeMullus surmuletusLinnaeus, 17580.000.05c
Sparidae Pagellus acarneRisso, 18270.020.07c
Sparidae Pagellus erythrinusLinnaeus, 17580.000.00c
PhycidaePhycis blennoidesBrünnich, 17680.030.54c
Scombridae Scomber japonicusHouttuyn, 17820.101.21c
Scorpaenidae Scorpaena elongataCadenat, 19430.020.37c
Serranidae Serranus hepatusLinnaeus, 17580.020.00c
CarangidaeTrachurus mediterraneusSteindachner, 18680.020.14c
CarangidaeTrachurus picturatusBowdich, 18250.010.10c
CarangidaeTrachurus trachurusLinnaeus, 17580.090.39c
Triglidae Trigla lucernaLinnaeus, 17580.010.07c
Triglidae Trigla lyraLinnaeus, 17580.090.32c
MullidaeUpeneus moluccensisBleeker, 18550.010.03c
Zeidae Zeus faberLinnaeus, 17580.020.13c
ArgentinidaeArgentina sphyraenaLinnaeus, 175814.949.25d
SternoptychidaeArgyropelecus hemigymnusCocco, 18290.000.00d
Bothidae Arnoglossus imperialisRafinesque, 18100.400.25d
Triglidae Aspitrigla cuculusLinnaeus, 17580.660.96d
CaproidaeCapros aperLinnaeus, 17581.240.75d
Myctophidae Ceratoscopelus maderensisLowe, 18390.000.00d
Chlorophthalmidae Chlorophthalmus agassiziiBonaparte, 184053.1337.11d
Macrouridae Coelorhynchus coelorhynchusRisso, 18102.753.40d
Trachichthyidae Hoplostethus mediterraneusCuvier, 18290.480.75d
Myctophidae Hygophum benoitiCocco, 18380.000.00d
MacrouridaeHymenocephalus italicusGiglioli, 18846.642.08d
TetraodontidaeLagocephalus suezensiClark and Gohar, 19530.000.01d
Myctophidae Lampanyctus crocodilusRisso, 18100.000.00d
TrichiuridaeLepidopus caudatusEuphrasen, 17880.040.26d
Scophthalmidae Lepidorhombus whiffiagonisWalbaum, 17920.091.54d
Triglidae Lepidotrigla cavilloneLacepède, 18010.080.12d
CentriscidaeMacrorhamphosus scolopaxLinnaeus, 17580.060.04d
Myctophidae Myctophum punctatumRafinesque, 18100.000.00d
NettastomatidaeNettastoma melanurumRafinesque, 18100.050.58d
PeristediidaePeristedion cataphractumLinnaeus, 17580.030.03d
SparidaeSpicara maenaLinnaeus, 17580.040.07d
StomiidaeStomias boaRisso, 18100.000.00d
CallionymidaeSynchiropus phaetonGünther, 18610.860.49d
TetraodontidaeTorquigener flavimaculosusHardy and Randall, 19830.000.21d
TrichiuridaTrichiurus lepturusLinnaeus, 17580.000.03d
Malacostraca AristeidaeAristaeomorpha foliaceaRisso, 1827 1.665.37t
AristeidaeAristeus antennatusRisso, 18160.230.73t
PenaeidaeParapenaeus longirostrisH. Lucas, 18468.664.00t
PolybiidaeBathynectes maravignaPrestandrea, 18390.000.00d
CalappidaeCalappa granulosaLinnaeus, 17580.010.04d
Majidae Maia goltzianad’Oliveira, 18880.000.01d
Pandalidae Plesionika edwardsiiJF Brandt in von Middendorf, 18512.281.06d
Pandalidae Plesionika heterocarpusA. Costa, 18711.110.17d
Pandalidae Plesionika martiaA. Milne-Edwards, 18831.130.42d
Polychelidae Polycheles typhlopsHeller, 18620.050.04d
Cephalopoda OmmastrephidaeIllex coindetiiVérany, 18390.010.07d
LoliginidaeLoligo vulgarisLamarck, 17980.000.00c
Sepiidae Sepia officinalisLinnaeus, 17580.023.80c
Ommastrephidae Todarodes sagittatusLamarck, 17980.020.00d
Rhynchonellata TerebratulidaeGryphus vitreusBorn, 17780.250.05d
Holothuroidea Stichopodidae Stichopus regalisCuvier, 18170.060.89d
Table 2. Commercial, discard, commercial/total catch, and commercial/discard ratio, according to number and biomass (N: number; W: weight (g)).
CatchNN %WW %
Commercial22,45512.87669.9732.46
Discard151,98387.131393.9167.54
Commercial/total0.13 0.32
Commercial/discard0.15 0.48
Table 3. The calculated CPUE (kg/h) and CPUA (kg/km2) values, the total number of specimens (N), and biomass (W: kg), grouped according to target, bycatch, and discard species.
CPUE CPUA WN
Target72.260.79188.6718,407
Bycatch145.121.59481.304048
Discard385.522.921393.91151,983
Table 4. The calculated CPUE (W: kg/h) values of total, target, bycatch, and discard species according to depth and season.
DepthSeasonTargetBycatchDiscardTotal
200–299Winter9.4411.2233.7254.38
300–399Autumn1.093.0716.9921.15
Winter3.4530.4793.92127.84
Spring4.3539.0956.1799.61
400–499Autumn2.1516.33114.35132.83
500–599Autumn3.295.8119.8628.96
Winter22.109.2118.4849.79
Spring15.1816.299.2140.68
600–700Autumn11.2113.6322.8247.66
Table 5. Biodiversity indices used in the study (S: the number of species recorded, N: the total number of individuals, D: Margalef’s richness index, J’: Pielou’s evenness index, H′: Shannon–Wiener diversity index, 1-Lambda’: Simpson’s dominance index).
DEPTHSNDJ’H′1-Lambda’
200–29935332696.820.5172.210.152
300–399578702615.60.4382.270.209
400–49933402776.980.4892.110.212
500–59935804512.10.6603.100.0685
600–6992858346.690.6682.720.0938
Indices’ rating range and values Range 0–>5
Integrated > 5
Semi-disturbed > 2.05–5
Disturbed ≤ 2.05
Range 0–1
Balanced 0. 8–1
Semi-balanced 0.5–0.8
Unbalanced ≤ 0.5
Range 0–5
High status 4–5
Good status 3–4
Moderate status 2–3
Poor status 1–2
Bad status 0–1
Range 0–1
Disclaimer/Publisher’s Note: The statements, opinions and data contained in all publications are solely those of the individual author(s) and contributor(s) and not of MDPI and/or the editor(s). MDPI and/or the editor(s) disclaim responsibility for any injury to people or property resulting from any ideas, methods, instructions or products referred to in the content.

