Abstract
The analysis of traffic crashes facilitates the identification of trends that can inform strategies to enhance road safety. This study aimed to detect high-risk zones and forecast collision patterns by integrating spatial analysis and predictive modeling. Traffic incidents along the Chone–Flavio Alfaro road segment in Manabí, Ecuador, were examined using Geographic Information Systems (GIS) and Kernel Density Estimation (KDE), based on official data from the National Traffic Agency (ANT) covering the period 2017–2023. Additionally, ARIMA, Prophet, and Long Short-Term Memory (LSTM) models were applied to predict crash occurrences. The most influential contributing factors were driver distraction, excessive speed, and adverse weather. Four main crash hotspots were identified: near Chone (PS 0–2.31), PS 2.31–7.10, PS 13.39–21.31, and PS 31.27–33.92, close to Flavio Alfaro. A total of 55 crashes were recorded, with side impacts (27.3%), pedestrian-related collisions (14.5%), and rear-end crashes (12.7%) being the most frequent types. The predictive models performed well, with Prophet achieving the highest estimated accuracy (90.8%), followed by LSTM (88.2%) and ARIMA (87.6%), based on MAE evaluations. These findings underscore the potential of intelligent transportation systems (ITSs) and predictive analytics to support proactive traffic management and resilient infrastructure development in rural regions.
1. Introduction
Every year, traffic crashes result in approximately 1.3 million deaths worldwide, posing a significant threat to public health. Pedestrians, cyclists, and older adults are particularly vulnerable. In densely populated cities such as Metro Manila (Philippines), public transport and commercial truck drivers are at higher risk due to long work shifts and exhaustion, which increase the likelihood of crashes [1,2]. In rural areas, fatal crashes are often associated with alcohol consumption and poor road conditions [3]. These circumstances support the need for regions to establish integrated safety procedures that incorporate predictive modeling and spatial analysis for effective road safety management [4].
In Ecuador, traffic crashes are a major public concern that affects both families and society. Montero-Salgado et al. [5] identified contributing factors such as mechanical failures and inadequate vehicle maintenance. Although crash frequency declined between 2000 and 2019, the fatality rate increased, particularly among women and young men, and the lack of regulation enforcement, along with reckless driving, increased the risk for urban cyclists [4]. Young men are more likely to suffer traumatic brain injuries, whereas older adults have a higher fatality rate [6]. This situation calls for targeted protective measures in Ecuador’s road system.
Against this backdrop, the present study applies Geographic Information System (GIS) and Kernel Density Estimation (KDE) techniques to analyze the spatio-temporal distribution of traffic crashes along the Chone–Flavio Alfaro corridor in Ecuador. Through hotspot analysis, KDE enables the identification of high-risk areas that warrant efficient interventions [7]. Furthermore, an updated dataset was employed to locate and describe the four most hazardous segments based on kilometer markers and roadway characteristics.
Evidence from international case studies highlights the relevance of this methodology. In Hanoi (Vietnam), spatial structure analysis using GIS, combined with cluster analysis, the Moran Index, and KDE, helped identify and validate hotspots, thereby improving the management of hazardous areas [8,9]. Similarly, in Sherbrooke (Canada), combining KDE with the Critical Collision Index enabled the classification of locations where safety interventions were most urgently needed [10,11]. In Spain and Portugal, random forest machine learning and deep reinforcement learning techniques were applied to smart crosswalk systems, improving vehicle detection and mitigating crashes in critical zones [12].
Despite international advances, there is a notable absence of regional studies in Latin America that integrate predictive modeling with geospatial analysis to identify and forecast traffic-crash patterns at high spatial resolutions. Most existing research in Ecuador and neighboring countries still relies on historical statistics or GIS-based visualizations without incorporating advanced time-series models. To address this gap, the present study proposes an integrative methodology that combines ARIMA, Prophet, and LSTM models with KDE-based spatial analysis, focusing on rural roads in Ecuador.
From a methodological standpoint, the framework integrates Autoregressive Integrated Moving Average (ARIMA), Prophet, and Long Short-Term Memory (LSTM) techniques within a GIS-based spatial analysis environment. ARIMA is widely used because of its capacity to handle nonstationary data and produce reliable outputs, even with limited datasets. LSTM, a recurrent neural network, excels at capturing long-term dependencies in time-series data, making it particularly effective for modeling complex traffic patterns [13,14]. Together, ARIMA and LSTM complement each other by addressing both linear and nonlinear trends in crash frequency data [15]. Although less commonly applied in road safety studies, the Prophet has demonstrated strong performance in modeling seasonality and temporal trends in time-series forecasting [16].
Beyond model integration, this contribution is further enhanced by the development of a table summarizing crash-related factors, supported by official statistics and previous studies, and their correlations with road geometry and human behavior. Additionally, it introduces a methodological innovation by applying machine learning predictions and spatial modeling to rural roads in a low- and middle-income context, an approach that is often underrepresented in regional research.
Taken together, the predictive and spatial analysis techniques employed in this study establish a reproducible framework for road safety evaluation. The proposed methodology assists transportation authorities in prioritizing interventions, optimizing infrastructure investments, and mitigating crash risks. While ARIMA and Prophet are valuable for modeling linear and seasonal trends, LSTM demonstrates superior performance in capturing dynamic patterns and long-term dependencies in traffic datasets [17,18].
Overall, this study aims to apply spatio-temporal analysis and predictive modeling as tools for planning, prevention, and evidence-based decision-making in traffic safety. The integrated use of GIS with forecasting models (ARIMA, Prophet, and LSTM) enables the identification of high-risk locations and estimation of crash occurrences, facilitating targeted safety interventions. This approach represents one of the few predictive modeling applications specifically developed for rural Ecuadorian roads, with the broader goal of enhancing infrastructure resilience and improving traffic safety outcomes in low- and middle-income regions.
Moreover, spatio-temporal analysis is essential for understanding the dynamics of road crashes by identifying geographic patterns and temporal variations. Mohaymany et al. [19] suggested that incorporating GIS helps visualize crashes by estimating the network kernel density (NKDE). Geocoding crash data facilitates spatio-temporal assessments, which, in turn, support the formulation of mitigation strategies [20]. The use of KDE algorithms enables the identification of crash clusters across both space and time [21]. Autonomous learning methods that leverage multiple weighted spatial attributes can be applied for hotspot detection and multivariate risk factor identification [22]. Furthermore, the integration of mobile devices, voice technology, and GIS with Bayesian networks enables real-time data collection and visualization [23,24]. These approaches have been successfully implemented in Portugal, Algeria, India, Vietnam, and Benin [10,24,25].
In addition, the proposed model supports transportation planning, risk zone identification, and crash prediction. The integration of GIS facilitates the processing and fusion of large datasets to detect hazardous areas and their associated factors. Advanced models have also been developed to assess road infrastructure conditions by incorporating meteorological data to estimate crash risk and improve prediction accuracy in traffic safety studies [26,27,28]. These methodologies have proven effective in urban, rural, and tourist regions [29,30].
From this perspective, spatio-temporal analysis enables the identification of risk zones and the establishment of correlations between crash frequency and infrastructure characteristics to identify high-risk areas. This capability helps transportation agencies design more effective measures to minimize risks, optimize management, and allocate resources. It also enhances crash evaluation by identifying the critical zones and influencing variables. Moreover, improving predictions across large areas while reducing dependence on massive datasets expands the potential of spatial segmentation analysis [31,32]. This enables more precise assessments of crash patterns over time and space [33], facilitates trend identification in traffic incidents, and addresses key challenges in geographic data science [34,35]. GIS-based approaches have also been widely applied in spatial epidemiology, contributing significantly to public health outcomes [33,36,37].
Finally, Hinojosa et al. [38] highlighted the relevance of GIS as a powerful tool for modeling urban environments and analyzing traffic crash-related factors. According to Sordo et al. [39], excessive speed, alcohol consumption, and mechanical or technical vehicle failure are among the leading causes of crashes. Human behavior risks, such as speeding, cell phone use, and failure to wear seat belts, further increase the frequency and severity of incidents. Additional factors, such as vehicle overloading and the absence of safety features, significantly increase the likelihood of collisions [40,41]. Other contributing elements include insufficient signage and the proximity of roads to wooded areas, which have also been found to compromise safety [41,42,43].
This study is organized into several sections: Introduction, Materials and Methods, Results, Discussion, Conclusion, and References. The Materials and Methods section outlines the research design, sampling strategy, data collection methods, and analytical procedures. The Results section presents the main findings. The Discussion section contextualizes the results by comparing them with those of prior studies. The conclusion summarizes the core contributions and recommends the use of predictive models and GIS tools to improve road safety. Finally, the References section lists all the cited sources.
2. Materials and Methods
2.1. Road Segment
The study area comprised the Chone–Flavio Alfaro section of the Manabí Province of Ecuador. This 50 km-long road segment connects the cantons of Chone and Flavio Alfaro, starting at UTM coordinates 602,875.00 m E and 9,922,818.00 m S (0°41′53.51″ S, 80°4′31.66″ W) and ending at 611,954.16 m E and 9,950,568.27 m S (0°26′49.76″ S, 79°59′38.10″ W). It serves as an important transportation link for agricultural trade and daily travel, facilitating economic and social connectivity between Sri Lanka’s coastal and highland regions. The road passes through several rural communities and agricultural areas, underscoring its importance to the region (Figure 1).
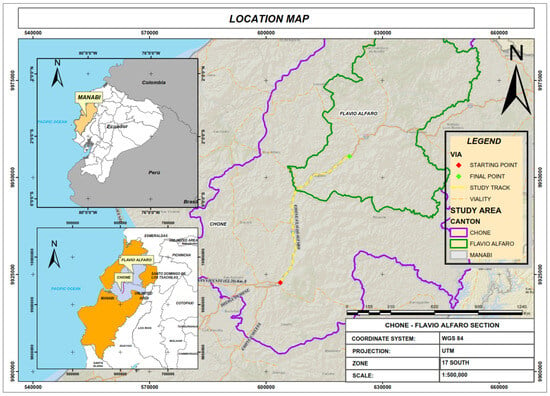
Figure 1.
Location of the Chone–Flavio Alfaro road section. Note. Includes the study track, cantonal boundaries, and administrative divisions. Source: Map developed by the authors based on topographic data collected in situ using total stations and GPS equipment.
This corridor crosses a tropical monsoon climate region, with average annual temperatures ranging from 23.3 °C to 31.3 °C in Chone and from 22.6 °C to 30.8 °C in Flavio Alfaro. The rainy season peaks in February, with monthly averages exceeding 200 mm, and August tends to be the driest month. These climatic conditions affect visibility, pavement friction, and crash risks annually. Chone has an estimated population of 140,548 inhabitants, whereas Flavio Alfaro has approximately 26,415 inhabitants, indicating a moderate vehicular demand. The combination of population density, commercial activity, and seasonal weather hazards contributes to infrastructure vulnerability, emphasizing the need for continuous monitoring of these factors.
The study determined that the average annual traffic (AAT) was 5114 vehicles. This road segment is important for the country’s commerce but presents several safety concerns. The geometric characteristics of the Chone–Flavio Alfaro road segment were evaluated following the guidelines established by the Ministry of Public Works of Ecuador in 2003 [44]. Geometric data were obtained through direct field measurements using total station equipment and GPS geo-referencing. All data were validated using official design standards to ensure technical accuracy and reliability. The design speed ranges between 70 and 110 km/h, which does not comply with the recommended limits of 80–100 km/h, indicating potential safety risks. A minimum curve radius of 210 m is generally compliant with the standard, allowing for the safe maneuvering of heavy vehicles. However, Curve 3, with a radius of 140 m, did not meet the requirement and required a reduction in speed to minimize the risk of lane departure.
Table 1 summarizes the geometric conditions evaluated, including speed standards, curve radii, sight distances, and other road characteristics in relation to the 2003 MOP standards [44].

Table 1.
Geometric conditions on the Chone–Flavio Alfaro Road (Point 1: PK10–PK15).
To understand the broader context of road safety risks, Table 2 presents the main factors contributing to traffic crashes on the Chone–Flavio Alfaro segment. These include human behavior, environmental conditions, road infrastructure deficiencies, and institutional limitations, all of which affect crash frequency and severity in this area.

Table 2.
Factors contributing to road crashes on the Chone–Flavio Alfaro segment.
2.2. Crash Data
The analysis focused on crash data from the Chone–Flavio Alfaro road segment, examining the frequency of incidents, contributing factors, and types of crashes recorded between 2017 and 2023. The segment presented multiple road safety issues related to infrastructure conditions and driver behaviors. The crash data were originally obtained in a spreadsheet format (.xlsx) from the official reports of the National Traffic Agency (ANT) of Ecuador, which include fields for date, location, crash type, and contributing factors. These data are considered reliable because they were sourced from official government records that were compiled through systematic reporting mechanisms. The geographic referencing of crash sites was performed using data collected with both total stations and GPS equipment, ensuring high spatial precision during the field surveys. Minor inconsistencies were resolved by cross-validating spatial coordinates with road kilometer markers and field logbooks.
The processed dataset was then converted into a shapefile (.shp) format using ArcGIS Pro for spatial analyses and visualization. The final spatial resolution corresponded to a cartographic scale of 1:25,000, with a positional accuracy of approximately ±15 m, verified using official cartography and Google Earth satellite imagery. This ensured a comprehensive and validated dataset suitable for spatio-temporal crash pattern analysis in recent years. Descriptive and inferential statistical analyses were performed to evaluate the crash patterns and causes. In the study segment, 55 crashes were recorded between 2017 and 2023, involving different types of incidents and their associated causes.
The most common types of crashes reported were collisions and run-offs, which were primarily attributed to driver inattention, adverse environmental conditions, and, in some cases, driver fitness level. In 2019, crashes, head-on collisions, and rear-end collisions were documented, with excessive speed as a recurring factor. In 2020, no crashes were recorded because of mobility restrictions imposed during the COVID-19 pandemic. However, in 2021 and 2023, serious incidents such as lateral displacements and eccentric head-on collisions were observed, reinforcing the need for improved road surveillance and infrastructure modifications. Table 3 summarizes the main types of collisions and their contributing factors between 2017 and 2023.

Table 3.
Types of crashes and their predominant causes.
The distribution of crashes over time was as follows: in 2019, the highest number of incidents was recorded, mainly due to excessive speed and inattention; in 2017 and 2018, multiple collisions were attributed to inattention, adverse weather conditions, and mechanical failures; in 2020, no collisions were recorded due to pandemic restrictions; in 2021, only one incident, attributed to post-pandemic effects, was reported; and in 2023, the number of collisions increased, mainly due to inattention and non-compliance with traffic signs, as shown in Figure 2. Furthermore, the percentage distribution of collision types was analyzed, with lane departures (27.3%) being the most frequent, followed by rear-end (14.5%) and general collisions (12.7%). Collisions with motorcycles and animals were comparatively less frequent (Table 4).
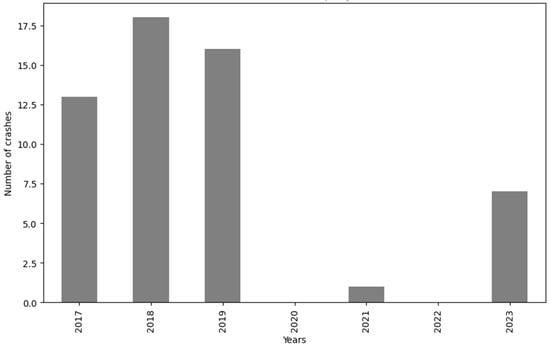
Figure 2.
Annual distribution of traffic crashes (2017–2023). Note. Shows peak values in 2018–2019 and a marked decline during the COVID-19 period. Source: Authors’ elaboration based on ANT records and field data.

Table 4.
Types of road traffic crashes.
2.3. Spatial Analysis Using Kernel Density Estimation
To identify traffic crash hotspots, Kernel Density Estimation was applied using ArcGIS Pro. KDE is a non-parametric method that estimates the spatial distribution of point events, such as road crashes, by calculating the density of events around each output raster cell. This approach is widely used in traffic-safety studies to detect clusters and prioritize intervention zones.
The KDE function is based on the following equation:
where
- f(x): estimated density at point x;
- n: number of events (e.g., crashes);
- h: bandwidth (search radiu);
- K: kernel function (usually Gaussian);
- xi: coordinates of the i-th crash event.
A search radius of 1000 m was selected based on previous studies on road crash spatial distribution [8,9], ensuring a balance between resolution and generalization. The raster output resolution was set to 50 m, which was aligned with the scale of 1:25,000 used in this study.
The resulting KDE surface allowed the identification of three major hotspots along the Chone–Flavio Alfaro segment, corresponding to areas with recurrent incidents caused by geometric road deficiencies and adverse weather conditions. These areas were cross-validated using field observations and ANT-crash reports.
2.4. Hotspot Analysis Using Getis-Ord Gi*
In addition to KDE, this study applied hotspot analysis using the Getis-Ord Gi* statistic to identify statistically significant clusters with high crash frequencies. This spatial statistical method detects local spatial autocorrelation by comparing the sum of values in a defined neighborhood to the global sum of all values, thereby calculating z-scores and p-values to assess the clustering significance [46].
The Getis-Ord Gi* statistic is computed as follows:
where
- xj: attribute value for feature j;
- wi,j: spatial weight between feature i and j;
- : mean of all attribute values;
- S: standard deviation of all attribute values;
- n is the total number of features in the study area.
The analysis was conducted using ArcGIS Pro 3.2 with a fixed neighborhood distance of 1500 m and a Euclidean distance. The resulting z-scores were classified into confidence levels of 90%, 95%, and 99%, where high positive z-scores with low p-values indicated statistically significant hotspots, and high negative z-scores represented cold spots [47].
2.5. Space-Time Cube Analysis
To incorporate the temporal dimension into spatial pattern detection, a space–time cube analysis was performed using ArcGIS Pro. This geostatistical technique organizes georeferenced events, such as traffic crashes, into a three-dimensional data structure, in which each “cube” represents a combination of spatial location and time step. This method enables the exploration of temporal trends, emerging clusters, and space–time autocorrelation [45,48].
Each cube represents a spatio-temporal bin defined by the geographic extent and time interval. The general formulation for trend analysis used in this study is based on the Mann-Kendall trend test, a non-parametric test for identifying monotonic trends over time.
The Mann-Kendall test statistic S is computed as follows:
where
The cube was generated with a spatial interval of 1000 m and a temporal interval of one year for the period of 2017–2023. The data input consisted of crash geolocations and timestamps that were previously geocoded from the ANT reports. The methodology was based on recommendations for transportation risk studies [45,48].
2.6. Collision Prediction Models
To forecast future traffic collisions on the Chone–Flavio Alfaro road section, three complementary time-series models were applied: ARIMA, Prophet, and LSTM. These techniques were selected to capture both linear and nonlinear patterns in crash data, thereby offering a robust predictive framework.
The Autoregressive Integrated Moving Average (ARIMA) model was used to capture linear trends and seasonality in the historical crash data from 2017 to 2023. Before modeling, the time-series data were tested for stationarity using the Augmented Dickey–Fuller (ADF) test. Differencing techniques were applied to stabilize the mean and remove autocorrelations. The model parameters (p, d, q) were selected based on the Akaike Information Criterion (AIC) to ensure optimal performance [49].
The Prophet model, developed by Facebook, was incorporated because of its flexibility in handling complex seasonality and missing data. This model detected weekly and annual seasonality and provided an additive decomposition of the trend and seasonal components with built-in change-point detection [50]. It is particularly useful for forecasting irregular or holiday-influenced crash trends.
Long Short-Term Memory (LSTM) networks were used to model nonlinear relationships. LSTMs, a class of recurrent neural networks (RNNs), can learn long-term dependencies and capture complex temporal dynamics in traffic-crash data. The input series were normalized using the MinMaxScaler to improve convergence. The model architecture consisted of an LSTM layer followed by a dense output layer, trained using a mean squared error (MSE) loss function and the Adam optimizer [51].
All models were implemented and trained using the Python libraries.
- Pandas 1.5.3 (import pandas as pd): Data handling, preprocessing, and structuring;
- NumPy 1.24.2 (import numpy as np): Mathematical calculations and operations with arrays;
- Matplotlib 3.7.1 (import matplotlib.pyplot as plt): Visualization of time series data and forecasting results;
- Statsmodels 0.14.0 (from statsmodels.tsa.arima.model import ARIMA): ARIMA model development and implementation;
- Prophet 1.1.2 (from prophet import Prophet): Seasonal decomposition and forecasting;
- TensorFlow/Keras 2.11.0 (import tensorflow as tf, from tensorflow.keras.models import Sequential, from tensorflow.keras.layers import LSTM, Dense): Construction and training of the LSTM model;
- Scikit-learn 1.2.2 (from sklearn.preprocessing import MinMaxScaler): Data normalization using MinMaxScaler to improve model performance.
Each model was trained and validated using historical crash data to ensure accurate forecasts for road-safety planning.
Evaluation Metrics Used
The prediction models were evaluated by determining the prediction accuracy using the Root Mean Square Error (RMSE) and Mean Absolute Error (MAE). These error metrics were chosen because they are useful for evaluating the effectiveness of a time-series model and provide a means of comparing models. Furthermore, they were evaluated based on their ability to explain changes in crash occurrence and the patterns associated with the data.
The following formulas were used to quantify these errors:
where yi represents the actual observed vs, the predicted values, and n the number of observations.
The implementation and evaluation steps were performed in Python 3.10.12 using the aforementioned libraries for data manipulation and model fitting and validation. In particular, the RMSE and MAE were calculated using sklearn.metrics for an unbiased assessment of predictive performance [52]. To assess model predictability, the RMSE was used to estimate the standard deviation of the residuals, and the MAE was used to measure the mean absolute differences between the measured and expected values. The evaluation was performed using test datasets to reliably assess the effectiveness of the predictions at different time intervals.
3. Results
3.1. Spatial Analysis
The analysis was performed using RStudio 2023.03.0+386, Kernel Density Estimation (KDE), and ArcGIS 3.2. These tools made it possible to determine the areas most prone to collisions, as well as the spatial distribution along the stretch of the Chone–Flavio Alfaro highway [8,45,48]. Traffic crashes were graphically represented using kernel density maps that illustrated different levels of crash intensity. The distribution is shown in Figure 3, where darker shades indicate higher crash densities and lighter shades indicate lower crash densities.
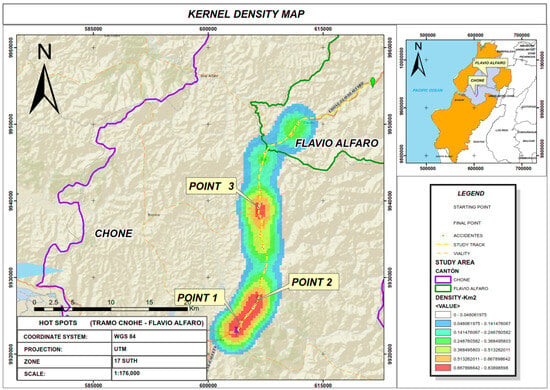
Figure 3.
Kernel density map of traffic crash hotspots. Note. Displays crash concentration along the Chone–Flavio Alfaro road section (2017–2023), based on ANT records and topographic data collected in the field. Source: Map generated by the authors using ArcGIS Pro 3.2.
There are four critical points (PS) with the highest collision density:
Point 1, located at the entrance to Chone, between PS 0 and PS 2.31, has a notable concentration of collisions caused by traffic congestion, sharp curves, and inadequate signage. Inattention at the wheel and excessive speed are key factors contributing to collisions owing to the lack of clear traffic control measures, as illustrated in Figure 4.
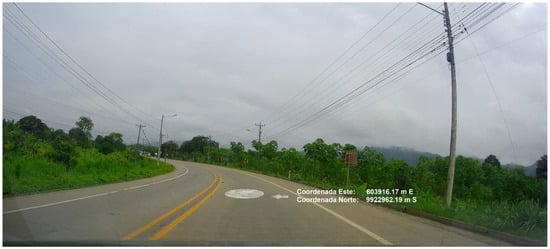
Figure 4.
Curved road segment near Point 2. Note. Field image showing limited visibility and deficient road signage. Coordinates were obtained through a topographic survey using a total station and GPS.
Point 2, which extends from PS 2.31 to PS 7.10, is characterized by a high incidence of side collisions and rollovers, mainly due to poor road infrastructure and reduced visibility, particularly in adverse weather conditions.
Point 3, which extends from PS 13.39 to PS 21.31, is a high-traffic area with multiple complex intersections. Most collisions in this segment were caused by driver errors, such as failure to yield or being distracted while driving.
Point 4, located near Flavio Alfaro, had a high frequency of head-on and rear-end collision occurrences. These incidents were mainly related to deteriorating road conditions and unfavorable weather factors, in addition to drunk driving and distraction.
Critical crash locations are presented in Figure 5.
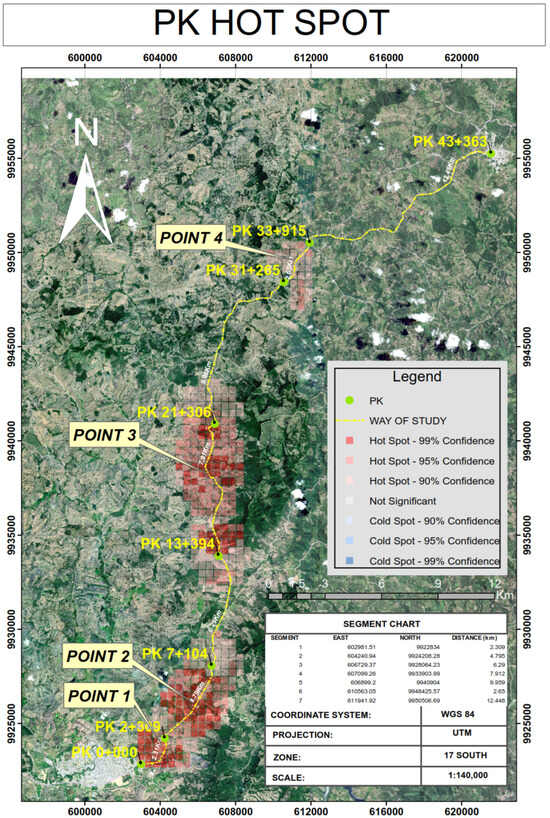
Figure 5.
Critical crash locations identified (Points 1–4). Note. Spatial distribution based on Getis-Ord Gi* statistic with a 90–99% confidence level. Data were processed using ArcGIS Pro and verified through field georeferencing. Source: Authors’ elaboration.
The hotspot map in Figure 6 visualizes the locations of high collision densities and provides a framework for prioritizing intervention strategies.
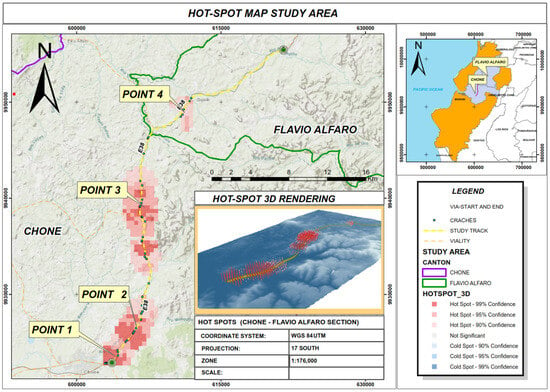
Figure 6.
2D and 3D visualizations of crash hotspots. Note. Hotspot clusters were generated using the Getis-Ord Gi* statistic in ArcGIS Pro to identify statistically significant crash patterns along the Chone–Flavio Alfaro road (2017–2023). Source: Authors’ elaboration.
Figure 7 and Figure 8 illustrate the spatial distribution of collision hotspots for the periods 2017–2019 and 2021–2023, allowing for a comparison of the pre- and post-pandemic traffic patterns. Figure 7 shows that between 2017 and 2019, collision hotspots were predominantly concentrated between PS 0 and PS 7.10, particularly in the curved sections with insufficient road markings. These collisions are primarily attributed to infrastructure deficiencies and driver negligence. Figure 8 indicates a shift in collision density toward Flavio Alfaro, particularly between PS 31.27 and PS 33.92, where an increase in serious collisions was observed. These incidents were attributed to deteriorating road conditions and adverse weather effects, with 55 collisions recorded that year.
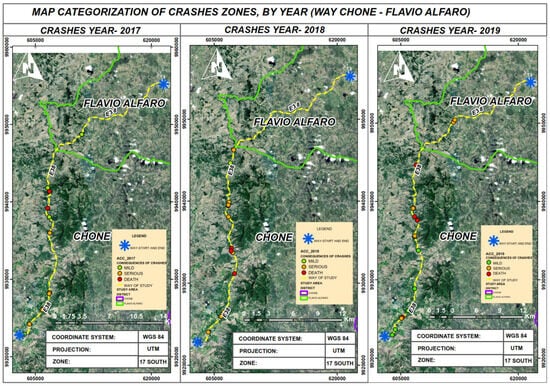
Figure 7.
Annual crash zone distribution (2017–2019). Note. Comparative maps along the Chone–Flavio Alfaro road, based on ANT records and categorized by frequency and severity using geocoded data in GIS.
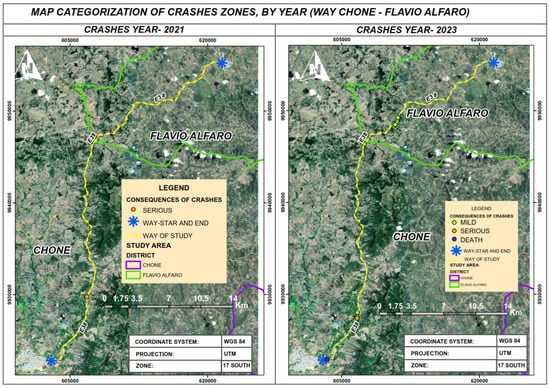
Figure 8.
Crash zone variation in 2021 and 2023. Note. Maps based on georeferenced ANT data showing variations in severity and spatial distribution along the Chone–Flavio Alfaro corridor during the post-pandemic period. Source: Authors’ elaboration.
Figure 8 indicates a shift in collision density toward Flavio Alfaro, particularly between PS 31.27 and PS 33.92, where an increase in serious collisions was observed. These incidents were attributed to deteriorating road conditions and adverse weather effects, with 55 collisions recorded that year. The analysis identified statistically significant temporal trends in crash frequency, highlighting persistent hotspots along segments PS 2.31–7.10 and PS 13.39–21.31, with an increased risk during the rainy months. Moreover, the space–time cube revealed emerging high-risk zones near PS 31.27–33.92, which showed increasing crash trends in recent years.
3.2. Predictive Analysis
3.2.1. ARIMA Model Results
The ARIMA model was applied to forecast monthly crash frequencies on the Chone–Flavio Alfaro Highway using data from 2017 to 2023. This model is particularly effective for identifying short-term linear trends in time-series data. The implementation was performed in Python using the statsmodels.tsa.arima library. Before training, the time series was evaluated for stationarity, and first-order differencing was applied to stabilize the variance. The model parameters (p = 1, d = 1, q = 1) were selected based on the Akaike Information Criterion (AIC), ensuring a parsimonious and statistically sound fit.
Figure 9 illustrates the forecasts for the first 12 months of 2024. While the historical series exhibits sporadic crash activity with periods of no events, the ARIMA forecast shows a conservative projection with near-zero values. This behavior reflects the model’s sensitivity to recent low-incident periods, and although it captures short-term patterns effectively, it may underestimate the risk in highly variable or irregular datasets. Nonetheless, the output remains useful for basic anticipatory analyses and short-term risk monitoring.
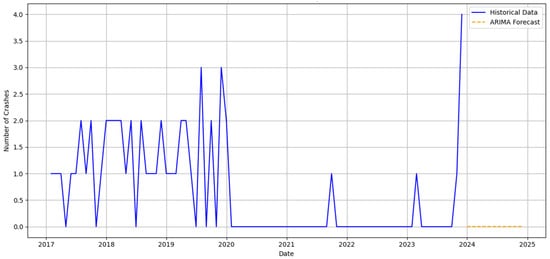
Figure 9.
Monthly crash prediction with ARIMA. Note. The figure shows actual and forecasted values based on ANT records. Modeling and visualization were performed in Python. Source: Authors’ elaboration using data from the National Traffic Agency.
3.2.2. Prophet Model Results
The Prophet model, developed by Meta, was employed to detect seasonal variations and cyclical trends in crash data for the Chone–Flavio Alfaro road segment. This time-series forecasting tool was implemented in Python using the Prophet library and trained on monthly crash records from 2017 to 2023.
Unlike traditional statistical methods, Prophet is robust to missing values and can accommodate both linear and nonlinear trends with seasonal decompositions. In this study, the model was configured with multiplicative seasonality and a calibrated changepoint to better capture fluctuations in crash frequency over time.
As shown in Figure 10, the forecast for 2024 reveals low but fluctuating crash levels, with slight increases projected during historically risky periods. The shaded areas represent the 95% confidence intervals, which reflect the probabilistic nature of the predictions. These intervals are essential for guiding decision-making under uncertainty, particularly in rural infrastructure planning and risk-anticipation scenarios.
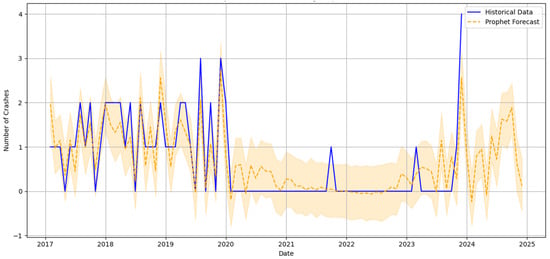
Figure 10.
Monthly crash prediction with Prophet. Note. The figure displays observed and forecasted values with 95% confidence intervals. Modeling was based on ANT data and performed using Python.
3.2.3. LSTM Model Results
An LSTM neural network was applied to model the temporal evolution of traffic crashes on the Chone–Flavio Alfaro road segment. The model was developed in Python using TensorFlow. Keras library and trained on monthly crash data from 2017 to 2023.
LSTM networks are particularly suited for capturing long-term dependencies and nonlinear dynamics in sequential datasets. Unlike traditional statistical models, they can learn hidden temporal patterns that are not immediately evident using linear methods. In this enhanced version, the model architecture was configured with a 12-month input window (time_steps = 12) and consisted of two stacked LSTM layers (64 units each), followed by a dense output layer. Data normalization was performed using MinMaxScaler from scikit-learn 1.2.2, and the model was trained via backpropagation using appropriate loss and optimization functions.
The 2024 forecast yielded moderately fluctuating crash values, reflecting the model’s capacity to generalize from sparse and irregular historical patterns. As shown in Figure 11, the LSTM model demonstrated the ability to capture medium- and long-term temporal dependencies that may not be fully captured by ARIMA or Prophet. However, based on the test dataset, the model achieved a Mean Absolute Error (MAE) of 0.83 and a Root Mean Square Error (RMSE) of 1.06, indicating a lower precision compared to Prophet, though still within acceptable predictive bounds for this type of dataset.
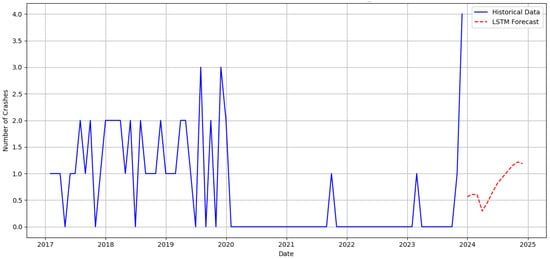
Figure 11.
LSTM-based monthly crash prediction. Note. The enhanced LSTM model used a 12-month input window to predict traffic crashes. The figure shows real and forecasted values from 2017 to 2023, based on data from the National Traffic Agency. Source: Authors’ elaboration.
3.3. Model Evaluation (RMSE and MAE)
To assess the predictive accuracy of the models, the Root Mean Square Error (RMSE) and Mean Absolute Error (MAE) were calculated by comparing the predicted and observed crash values for the test dataset. These metrics offer complementary insights: RMSE emphasizes larger errors by squaring the residuals, whereas MAE reflects the average magnitude of deviations regardless of direction.
Additionally, the estimated accuracy percentages were calculated using the following formula:
Accuracy (%) = 100 × (1 − MAE/mean of actual values)
The comparative performance is summarized in Table 5, based on crash records from Ecuador’s National Traffic Agency (ANT), and processed using Python.

Table 5.
Comparison of model performance (RMSE and MAE).
Among the evaluated models, Prophet achieved the lowest RMSE (0.47) and highest estimated accuracy (90.8%), suggesting superior performance in capturing overall patterns with fewer large deviations. ARIMA also performed consistently (RMSE = 1.18, MAE = 0.46, accuracy = 87.6%), confirming its strength in capturing short-term linear patterns.
LSTM showed a higher RMSE (1.06) and MAE (0.83), with a lower estimated accuracy (77.6%), indicating limitations in generalizing from sparse or irregular patterns in this specific dataset, despite its capacity to model long-term dependencies. Overall, Prophet appears to be the most effective model under the current configuration, followed by ARIMA, while the LSTM model may require additional tuning or more extensive data for improved precision.
4. Discussion
4.1. Spatial Patterns and High-Risk Areas
The analysis of hotspots provided information on temporal changes in collision density, showing seasonal trends and changes in risk zones for collisions. Critical areas, such as Hotspots 1 and 2, recorded high collision frequencies during the wet season, when visibility is low and pavements are wet, thereby increasing the likelihood of incidents. These results are consistent with previous spatial studies on collisions that emphasize the need to include meteorological factors in collision prediction models [25,28]. In the spatial analysis using RStudio, ArcGIS, and KDE, many hotspots were identified in the study segment, which correspond to the zones of interest described in previous research using Kernel Density Estimation and GIS-based analysis [9,10]. Point 1, near Chone, and Point 2, farther along the segment, have been identified as high-risk due to traffic volume and poor road signage.
Other studies have proposed infrastructure improvements and more effective traffic management to reduce collision rates [25]. The descriptive analysis highlighted the importance of driver-related problems, poor road conditions, and weather damage in influencing crash rates. The trends observed in this study reinforce previous findings, indicating that a major contribution to crashes is human error in the form of inattention at the wheel, speeding, and violation of traffic rules [38,41].
Moreover, socioeconomic vulnerability appears to amplify road safety risks in the region. According to ENEMDU [53], poverty affects 42.2% of the rural population in Ecuador, and extreme poverty reaches 23.7%, with education levels remaining low in these areas. These conditions can limit access to road safety education, proper vehicle maintenance, and awareness of traffic laws, particularly in rural areas such as those surrounding the Chone–Flavio Alfaro road, potentially increasing the crash frequency and severity.
Additionally, the land-use context along road segments further influences the crash distribution. Sections of the corridor, especially between PK 7+100 and PK 21+300, are adjacent to commercial zones, informal markets, and agricultural loading areas that generate high volumes of pedestrian and vehicular traffic. These land uses create complex mobility patterns and conflict points, increasing the probability of collisions. This is consistent with previous findings that associate mixed-use and commercial developments with elevated crash risks due to intensified activity and inadequate infrastructure adaptation [42].
4.2. Detection of Emerging Risk Patterns
In collision data, the ARIMA and Prophet models were particularly useful for detecting short-term seasonal trends and changes. These models are widely used to capture systematic behavior in transportation systems and support planning during high-risk periods [11,16]. In this study, they identified increased crash frequencies during holidays and adverse weather, which is consistent with earlier findings [17]. Both models captured subtle pattern shifts that may signal emerging risks that are not evident through conventional analyses.
The usefulness of LSTM in predicting multivariate road safety patterns has been well documented, especially for spatio-temporal data [18,28]. The integration of spatial analysis in this study supports the role of data-driven approaches in enhancing road safety. Artificial intelligence and learning algorithms have shown the potential to increase the effectiveness of active crash prevention strategies [26,27].
4.3. Technologies for New Intelligent Transportation Systems
The increasing availability of real-time data from sensors and connected devices opens new possibilities for predictive safety modeling. LSTM networks outperform traditional models by capturing nonlinear relationships and long-term dependencies [13], thereby enabling the detection of complex patterns that are not captured by simpler approaches [45]. The future integration of LSTM with real-time sources, such as weather stations, traffic cameras, and IoT systems, could enhance dynamic risk assessment [9]. This would support data-driven traffic management, allowing proactive interventions, as highlighted in recent studies [18,40].
LSTM’s scalability makes it suitable for large-scale deployments, where adaptive systems must respond to evolving traffic conditions and infrastructure changes [46]. Its use in Intelligent Transportation Systems (ITSs) could enable real-time alerts in hazardous zones, triggered by dynamic conditions such as congestion or bad weather—an approach already in place in some regions [34].
Moreover, the integration of predictive analytics with digital planning tools strengthens both real-time and long-term infrastructure resilience. Machine learning and geospatial analysis within ITS platforms can guide maintenance strategies, reduce environmental impacts, and prolong the road network’s life [48]. Anticipating high-risk areas through predictive insights aligns with modern infrastructure management practices and supports sustainable mobility planning in urban and rural settings.
4.4. Sustainability and Resource Efficiency in Road Safety Management
The application of predictive models in road safety not only reduces the frequency and severity of crashes but also contributes to sustainability and efficiency in the use of resources. By implementing predictive maintenance, interventions are reduced, resource expenditure is optimized, and the useful life of infrastructure is extended. This supports a more sustainable and cost-effective approach to road safety management, which is consistent with the findings of previous studies [31,32].
Predictive tools also support the early identification of high-risk segments, thereby reducing the environmental impact of emergency interventions and improving long-term planning. These strategies aid in the development of broader transportation policies by supporting the creation of safer, more efficient, and environmentally sustainable mobility systems [37,40].
Based on the study results, several safety policy recommendations were proposed. First, enforcement strategies should be intensified at identified hotspots, especially during the rainy season and holidays, using tools such as speed cameras and by conducting targeted patrols. Second, infrastructure policies should prioritize signage upgrades, pavement repair, and geometric redesign in segments with recurring incidents. Third, public education campaigns should be developed for high-risk rural communities to promote safe driving. Finally, predictive models should be integrated into transportation planning processes to enable dynamic resource allocation and design data-informed safety programs.
Forecasting Models in Transportation and Road Safety Management
The use of forecasting techniques such as ARIMA, Prophet, and LSTM offers a data-driven approach to improving road safety by predicting traffic accidents. These models enable authorities to anticipate crash trends and implement proactive strategies.
- Resource allocation: Forecasting high-risk periods and locations supports the efficient deployment of patrols and emergency services;
- Maintenance planning: Crash-prone areas can be prioritized for infrastructure repairs, thereby reducing the likelihood of incidents;
- Early warning systems: Forecasts can be used to feed real-time alert systems to warn drivers during hazardous periods.
In the comparative evaluation, Prophet achieved the lowest RMSE (0.47) and MAE (0.34), indicating its strong performance in capturing smoothed seasonal patterns. ARIMA (RMSE = 1.18, MAE = 0.46) followed closely, showing robustness in linear trend detection. LSTM (RMSE = 1.06, MAE = 0.83) provided valuable insights into nonlinear dependencies, despite a higher error range.
4.5. Scope and Generalizability of Findings
Although this study focuses on a specific road segment in rural Ecuador, its methodological framework, which combines spatial analysis with ARIMA, Prophet, and LSTM modeling, can be adapted to other geographic contexts. The generalizability depends on the similarity of the road conditions, traffic flows, and socioeconomic factors. Areas with deficient signage, frequent rainfall, and vulnerable populations may reflect comparable risk patterns.
However, extrapolation must be performed cautiously. Differences in data quality, driver behavior, law enforcement, and land use can affect the model performance and hotspot accuracy. Thus, although the approach is replicable, model calibration is essential to ensure context-specific reliability.
5. Conclusions
This study applied spatial analysis and predictive modeling to evaluate road crash patterns on the Chone–Flavio Alfaro road segment in Manabí, Ecuador. The results provide key insights into proactive road-safety management. The main conclusions are as follows:
- Four statistically significant hotspots were identified using Kernel Density Estimation and Getis-Ord Gi*, particularly in segments PS 0–2.31, PS 2.31–7.10, PS 13.39–21.31, and PS 31.27–33.92;
- Driver distraction, excessive speed, and adverse weather conditions are the predominant factors contributing to traffic collisions, as confirmed by both descriptive data and field surveys;
- The Prophet model achieved the best predictive performance (RMSE = 0.47; MAE = 0.34), followed by ARIMA (RMSE = 1.18; MAE = 0.46) and LSTM (RMSE = 1.06; MAE = 0.83). Prophet showed greater precision in capturing short-term seasonal variations, while LSTM remained valuable for modeling nonlinear temporal dependencies;
- Temporal analysis revealed a concentration of collisions during the rainy season, particularly between PS 13.39 and PS 21.31, supporting the inclusion of seasonal variables in risk prediction;
- Predictive analytics and spatial tools such as GIS, KDE, and space–time cube modeling offer a reproducible framework for detecting crash patterns and informing targeted interventions;
- Integrating these models into public transport planning can help prioritize maintenance, allocate resources more efficiently, and support evidence-based road safety policies.
This approach contributes to sustainability by reducing emergency interventions, extending infrastructure life, and minimizing the environmental and economic impacts of reactive roadwork maintenance. However, certain limitations of this study must be acknowledged. The crash data relied on official reports, which may omit unreported minor incidents and thus underestimate the total crash frequency. Furthermore, although the predictive models demonstrated satisfactory performance, their accuracy depended on the completeness and quality of the historical datasets. Future research could improve forecasting precision by incorporating real-time traffic and environmental variables and expanding the range of influencing factors considered.
Author Contributions
Conceptualization, L.A.M.-P. and A.M.P.-Z.; Methodology, L.A.M.-P., A.M.P.-Z. and A.G.; Software, L.A.M.-P.; Validation, A.M.P.-Z. and A.G.; Formal analysis, L.A.M.-P., A.M.P.-Z. and A.G.; Investigation, L.A.M.-P., A.M.P.-Z. and A.G.; Resources, L.A.M.-P.; Data curation, L.A.M.-P., A.M.P.-Z. and A.G.; Writing original draft preparation, L.A.M.-P., A.M.P.-Z. and A.G.; Writing review and editing, L.A.M.-P., A.M.P.-Z. and A.G.; Visualization, L.A.M.-P., A.M.P.-Z. and A.G.; Supervision, L.A.M.-P., A.M.P.-Z. and A.G.; Project administration, L.A.M.-P., A.M.P.-Z. and A.G.; Funding acquisition, L.A.M.-P., A.M.P.-Z. and A.G. All authors have read and agreed to the published version of the manuscript.
Funding
This research received no external funding.
Institutional Review Board Statement
Not applicable.
Informed Consent Statement
Not applicable.
Data Availability Statement
The data used in this study were obtained from the National Traffic Agency (ANT) of Ecuador and are not publicly available due to data use agreements.
Conflicts of Interest
The authors declare no conflict of interest.
References
- United Nations. With 1.3 Million Annual Road Deaths, UN Wants to Halve Number by 2030; United Nations: New York, NY, USA, 2021. [Google Scholar]
- Lu, S.F. P.3.19 Effect of occupational work and safety issues on road crash injuries in the philippines. Occup. Environ. Med. 2019, 76, A101. [Google Scholar] [CrossRef]
- Lasota, D.; Al-Wathinani, A.; Krajewski, P.; Goniewicz, K.; Pawłowski, W. Alcohol and Road Accidents Involving Pedestrians as Unprotected Road Users. Int. J. Environ. Res. Public Health 2020, 17, 8995. [Google Scholar] [CrossRef] [PubMed]
- Espinoza-Molina, F.; Ojeda-Romero, C.F.; Zumba-Paucar, H.D.; Pillajo-Quijia, G.; Arenas-Ramírez, B.; Aparicio-Izquierdo, F. Road Safety as a Public Health Problem: Case of Ecuador in the Period 2000–2019. Sustainability 2021, 13, 8033. [Google Scholar] [CrossRef]
- Montero-Salgado, J.P.; Muñoz-Sanz, J.; Arenas-Ramírez, B.; Alén-Cordero, C. Identification of the Mechanical Failure Factors with Potential Influencing Road Accidents in Ecuador. Int. J. Environ. Res. Public Health 2022, 19, 7787. [Google Scholar] [CrossRef]
- Ortiz-Prado, E.; Mascialino, G.; Paz, C.; Rodriguez-Lorenzana, A.; Gómez-Barreno, L.; Simbaña-Rivera, K.; Diaz, A.M.; Coral-Almeida, M.; Espinosa, P.S. A Nationwide Study of Incidence and Mortality Due to Traumatic Brain Injury in Ecuador (2004–2016). Neuroepidemiology 2019, 54, 33–44. [Google Scholar] [CrossRef] [PubMed]
- Shahzad, M. Review of road accident analysis using GIS technique. Int. J. Inj. Control Saf. Promot. 2020, 27, 472–481. [Google Scholar] [CrossRef]
- Harirforoush, H.; Bellalite, L. A new integrated GIS-based analysis to detect hotspots: A case study of the city of Sherbrooke. Accid. Anal. Prev. 2016, 130, 62–74. [Google Scholar] [CrossRef]
- Kazmi, S.M.A.; Ahmed, M.; Mumtaz, R.; Anwar, Z. Spatiotemporal Clustering and Analysis of Road Accident Hotspots by Exploiting GIS Technology and Kernel Density Estimation. Comput. J. 2020, 65, 155–176. [Google Scholar] [CrossRef]
- Nogueira, P.; Silva, M.; Infante, P.; Nogueira, V.; Manuel, P.; Afonso, A.; Jacinto, G.; Rego, L.; Quaresma, P.; Saias, J.; et al. Learning from Accidents: Spatial Intelligence Applied to Road Accidents with Insights from a Case Study in Setúbal District, Portugal. ISPRS Int. J. Geo Inf. 2023, 12, 93. [Google Scholar] [CrossRef]
- Le, K.G.; Liu, P.; Lin, L. Determining the road traffic accident hotspots using GIS-based temporal-spatial statistical analytic techniques in Hanoi, Vietnam. Geo-Spat. Inf. Sci. 2020, 23, 153–164. [Google Scholar] [CrossRef]
- Lozano Dominguez, J.M.; Al-Tam, F.; Sanguino, T.d.J.M.; Correia, N. Vehicle Detection System for Smart Crosswalks Using Sensors and Machine Learning. In Proceedings of the 2021 18th International Multi-Conference on Systems, Signals & Devices (SSD), Monastir, Tunisia, 22–25 March 2021; IEEE: Piscataway, NJ, USA, 2021; pp. 984–991. [Google Scholar] [CrossRef]
- Duan, C.; Hu, M.; Zhang, H. Comparison of ARIMA and LSTM in Predicting Structural Deformation of Tunnels during Operation Period. Data 2023, 8, 104. [Google Scholar] [CrossRef]
- Shahid, F.; Zameer, A.; Muneeb, M. Predictions for COVID-19 with deep learning models of LSTM, GRU and Bi-LSTM. Chaos Solitons Fractals 2020, 140, 110212. [Google Scholar] [CrossRef] [PubMed]
- Wang, W.; Ma, B.; Guo, X.; Chen, Y.; Xu, Y. A Hybrid ARIMA-LSTM Model for Short-Term Vehicle Speed Prediction. Energies 2024, 17, 3736. [Google Scholar] [CrossRef]
- de Zarzà, I.; de Curtò, J.; Roig, G.; Calafate, C.T. LLM Multimodal Traffic Accident Forecasting. Sensors 2023, 23, 9225. [Google Scholar] [CrossRef]
- Li, H.; Gao, Q.; Zhang, Z.; Zhang, Y.; Ren, G. Spatial and Temporal Prediction of Secondary Crashes Combining Stacked Sparse Auto-Encoder and Long Short-Term Memory. SSRN Electron. J. 2023, 191, 107205. [Google Scholar] [CrossRef]
- Asadi, R.; Regan, A.C. A spatio-temporal decomposition based deep neural network for time series forecasting. Appl. Soft Comput. 2020, 87, 105963. [Google Scholar] [CrossRef]
- Mohaymany, A.S.; Shahri, M.; Mirbagheri, B. GIS-based method for detecting high-crash-risk road segments using network kernel density estimation. Geo-Spat. Inf. Sci. 2013, 16, 113–119. [Google Scholar] [CrossRef]
- Al-Ahmadi, H.M.; Jamal, A.; Ahmed, T.; Rahman, M.T.; Reza, I.; Farooq, D. Calibrating the Highway Safety Manual Predictive Models for Multilane Rural Highway Segments in Saudi Arabia. Arab. J. Sci. Eng. 2021, 46, 11471–11485. [Google Scholar] [CrossRef]
- Zhang, Y.; Zhu, F.; Li, Q.; Qiu, Z.; Xie, Y. Exploring Spatiotemporal Patterns of Expressway Traffic Accidents Based on Density Clustering and Bayesian Network. ISPRS Int. J. Geo Inf. 2023, 12, 73. [Google Scholar] [CrossRef]
- Al-Ruzouq, R.; Hamad, K.; Dabous, S.A.; Zeiada, W.; Khalil, M.A.; Voigt, T. Weighted Multi-attribute Framework to Identify Freeway Incident Hot Spots in a Spatiotemporal Context. Arab. J. Sci. Eng. 2019, 44, 8205–8223. [Google Scholar] [CrossRef]
- Gharbi, A.; Haddadi, S. Application of the mobile GIS for the improvement of the knowledge and the management of the road network. Appl. Geomat. 2020, 12, 23–39. [Google Scholar] [CrossRef]
- Zhang, M.; Kecojevic, V.; Komljenovic, D. Investigation of haul truck-related fatal accidents in surface mining using fault tree analysis. Saf. Sci. 2014, 65, 106–117. [Google Scholar] [CrossRef]
- Debnath, P. A QGIS-Based Road Network Analysis for Sustainable Road Network Infrastructure: An Application to the Cachar District in Assam, India. Infrastructures 2022, 30, 114. [Google Scholar] [CrossRef]
- Briz-Redón, Á.; Martínez-Ruiz, F.; Montes, F. Spatial analysis of traffic accidents near and between road intersections in a directed linear network. Accid. Anal. Prev. 2019, 132, 105252. [Google Scholar] [CrossRef] [PubMed]
- Chung, W.; Abdel-Aty, M.; Lee, J. Spatial analysis of the effective coverage of land-based weather stations for traffic crashes. Appl. Geogr. 2018, 90, 17–27. [Google Scholar] [CrossRef]
- Wang, B.; Lin, Y.; Guo, S.; Wan, H. GSNet: Learning Spatial-Temporal Correlations from Geographical and Semantic Aspects for Traffic Accident Risk Forecasting. Proc. AAAI Conf. Artif. Intell. 2021, 35, 4402–4409. [Google Scholar] [CrossRef]
- Al-Omari, A.; Shatnawi, N.; Khedaywi, T.; Miqdady, T. Prediction of traffic accidents hot spots using fuzzy logic and GIS. Appl. Geomat. 2020, 12, 149–161. [Google Scholar] [CrossRef]
- Su, J.-M.; Wang, Y.-M.; Chang, C.; Wu, P.-J. Application of a Geographic Information System to Analyze Traffic Accidents Using Nantou County, Taiwan, as an Example. J. Indian Soc. Remote Sens. 2019, 47, 101–111. [Google Scholar] [CrossRef]
- Zhu, A.; Lu, G.; Liu, J.; Qin, C.; Zhou, C. Spatial prediction based on Third Law of Geography. Ann. GIS 2018, 24, 225–240. [Google Scholar] [CrossRef]
- Ferro-Diez, L.E.; Villegas, N.M.; Diaz-Cely, J.; Acosta, S.G. Geo-Spatial Market Segmentation & Characterization Exploiting User Generated Text Through Transformers & Density-Based Clustering. IEEE Access 2021, 9, 55698–55713. [Google Scholar] [CrossRef]
- Curtis, A.; Curtis, J.W.; Ajayakumar, J.; Jefferis, E.; Mitchell, S. Same space—Different perspectives: Comparative analysis of geographic context through sketch maps and spatial video geonarratives. Int. J. Geogr. Inf. Sci. 2019, 33, 1224–1250. [Google Scholar] [CrossRef]
- Singleton, A.; Arribas-Bel, D. Geographic Data Science. Geogr. Anal. 2021, 53, 61–75. [Google Scholar] [CrossRef]
- Guhaniyogi, R.; Banerjee, S. Meta-Kriging: Scalable Bayesian Modeling and Inference for Massive Spatial Datasets. Technometrics 2018, 60, 430–444. [Google Scholar] [CrossRef]
- Malik, K.R.; Habib, M.A.; Khalid, S.; Ahmad, M.; Alfawair, M.; Ahmad, A.; Jeon, G. A generic methodology for geo-related data semantic annotation. Concurr. Comput. 2018, 30, e4495. [Google Scholar] [CrossRef]
- Cho, J.; You, S.C.; Lee, S.; Park, D.; Park, B.; Hripcsak, G.; Park, R.W. Application of Epidemiological Geographic Information System: An Open-Source Spatial Analysis Tool Based on the OMOP Common Data Model. Int. J. Environ. Res. Public Health 2020, 17, 7824. [Google Scholar] [CrossRef]
- Hinojosa Reyes, R.; Varela Sanchez, G.; Campos Alanís, J. Población en riesgo: Análisis espacio—Temporal de accidentes viales, mediante el uso de herramientas sig en el municipio de toluca, estado de méxico, 2000–2005. GeoFocus Rev. Int. Cienc. Tecnol. Inf. Geogr. 2019, 23, 49–69. [Google Scholar] [CrossRef]
- Sordo, L.; Córdoba, R.; Gual, A.; Sureda, X. Límites para el consumo de bajo riesgo de alcohol en función de la mortalidad asociada. Rev. Esp. Salud Publica 2020, 94, e202011167. [Google Scholar]
- Pauer, G.; Sipos, T.; Török, Á. Statistical analysis of the effects of disruptive factors of driving in simulated environment. Transport 2019, 34, 1–8. [Google Scholar] [CrossRef]
- Klinjun, N.; Kelly, M.; Praditsathaporn, C.; Petsirasan, R. Identification of Factors Affecting Road Traffic Injuries Incidence and Severity in Southern Thailand Based on Accident Investigation Reports. Sustainability 2021, 13, 12467. [Google Scholar] [CrossRef]
- Saha, D.; Dumbaugh, E.; Merlin, L.A. A conceptual framework to understand the role of built environment on traffic safety. J. Safety Res. 2020, 75, 41–50. [Google Scholar] [CrossRef]
- Pagany, R. Wildlife-vehicle collisions—Influencing factors, data collection and research methods. Biol. Conserv. 2020, 251, 108758. [Google Scholar] [CrossRef]
- MOP. Normas de Diseño Geométrico. 2003. Available online: https://es.scribd.com/doc/64165603/Normas-de-Diseno-Geometrico-2003 (accessed on 20 May 2025).
- Jia, R.; Khadka, A.; Kim, I. Traffic crash analysis with point-of-interest spatial clustering. Accid. Anal. Prev. 2018, 121, 223–230. [Google Scholar] [CrossRef] [PubMed]
- Ord, J.K.; Getis, A. Local Spatial Autocorrelation Statistics: Distributional Issues and an Application. Geogr. Anal. 1995, 27, 286–306. [Google Scholar] [CrossRef]
- Esri. How Hot Spot Analysis (Getis-Ord Gi*) Works. Available online: https://pro.arcgis.com/en/pro-app/latest/tool-reference/spatial-statistics/h-how-hot-spot-analysis-getis-ord-gi-spatial-stati.htm (accessed on 19 April 2025).
- Le, K.G.; Liu, P.; Lin, L.T. Traffic accident hotspot identification by integrating kernel density estimation and spatial autocorrelation analysis: A case study. Int. J. Crashworthiness 2022, 27, 543–553. [Google Scholar] [CrossRef]
- Hyndman, R.J.; Athanasopoulos, G. Forecasting: Principles and Practice, 2nd ed.; OTexts: Melbourne, Australia, 2018; Available online: https://otexts.com/fpp2/ (accessed on 20 April 2025).
- Taylor, S.J.; Letham, B. Forecasting at Scale. Am. Stat. 2018, 72, 37–45. [Google Scholar] [CrossRef]
- Karim, F.; Majumdar, S.; Darabi, H.; Chen, S. LSTM Fully Convolutional Networks for Time Series Classification. IEEE Access 2017, 6, 1662–1669. [Google Scholar] [CrossRef]
- Gneiting, T.; Raftery, A.E. Strictly proper scoring rules, prediction, and estimation. J. Am. Stat. Assoc. 2007, 102, 359–378. [Google Scholar] [CrossRef]
- INEC. Boletín Técnico N° 02-2024-ENEMDU Pobreza y Desigualdad. January 2024. Available online: https://www.ecuadorencifras.gob.ec/documentos/web-inec/POBREZA/2023/Diciembre/202312_Boletin_pobreza_ENEMDU.pdf (accessed on 19 April 2025).
Disclaimer/Publisher’s Note: The statements, opinions and data contained in all publications are solely those of the individual author(s) and contributor(s) and not of MDPI and/or the editor(s). MDPI and/or the editor(s) disclaim responsibility for any injury to people or property resulting from any ideas, methods, instructions or products referred to in the content. |
© 2025 by the authors. Licensee MDPI, Basel, Switzerland. This article is an open access article distributed under the terms and conditions of the Creative Commons Attribution (CC BY) license (https://creativecommons.org/licenses/by/4.0/).