
Sustainability Evaluation of the Al-Qasab Playa by Integrating Hydrogeochemical and Graphical, ArcGIS Watershed, and Thermodynamic Geochemical Modeling Approaches

 , , and
Abstract
1. Introduction
1.1. Playas in Saudi Arabia
- Delineating the source and origin of water in the study area (renewability) has been partially fulfilled through remote sensing data (SRTM-DEM) processing.
- Supporting the information gathered from step one through the hydrochemical investigation of the interrelationships among the rainwater chemical composition with those of the source well and solar evaporation ponds.
- Employing thermodynamic geochemical modelling to identify the precipitation tendency and sequence of the different mineral assemblages.
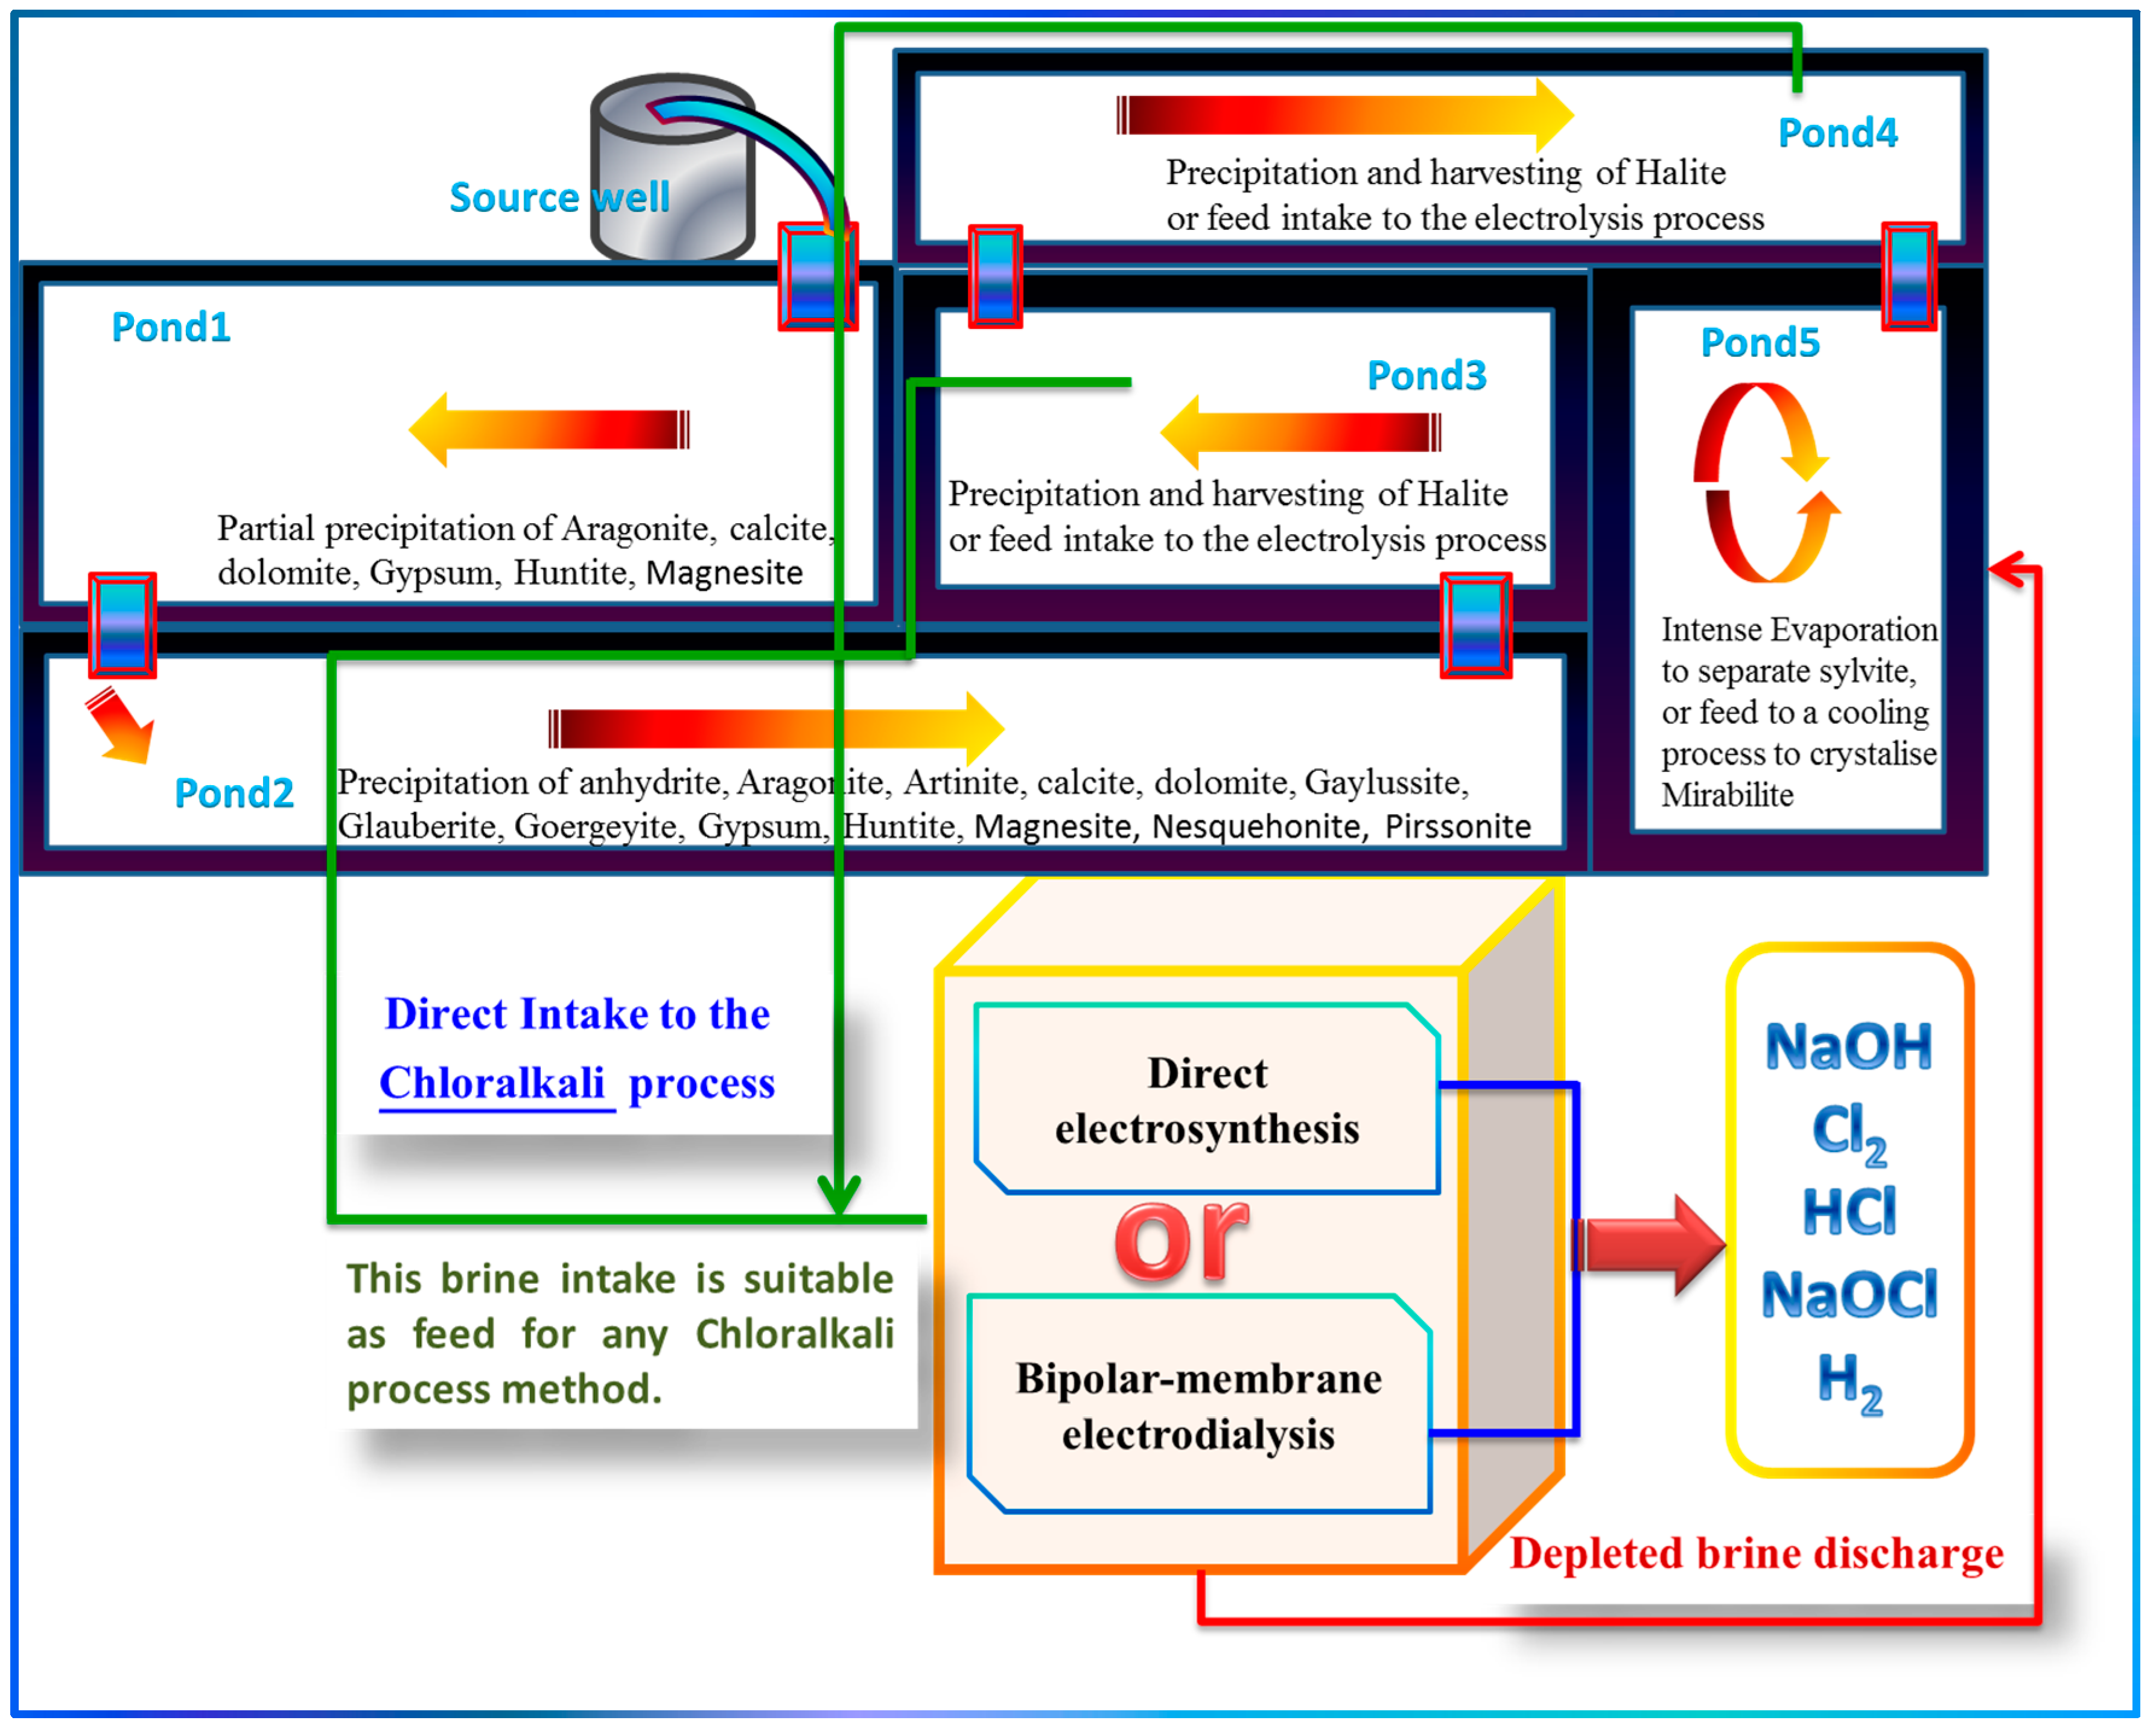
- Proposing an improved design for the solar evaporation ponds and their operation to provide a ready feed (i.e., needs no or minimal pretreatment stages) to the electrolysis process, not to the halite harvesting process itself, i.e., devising a new design that is anticipated to fulfil the aims.
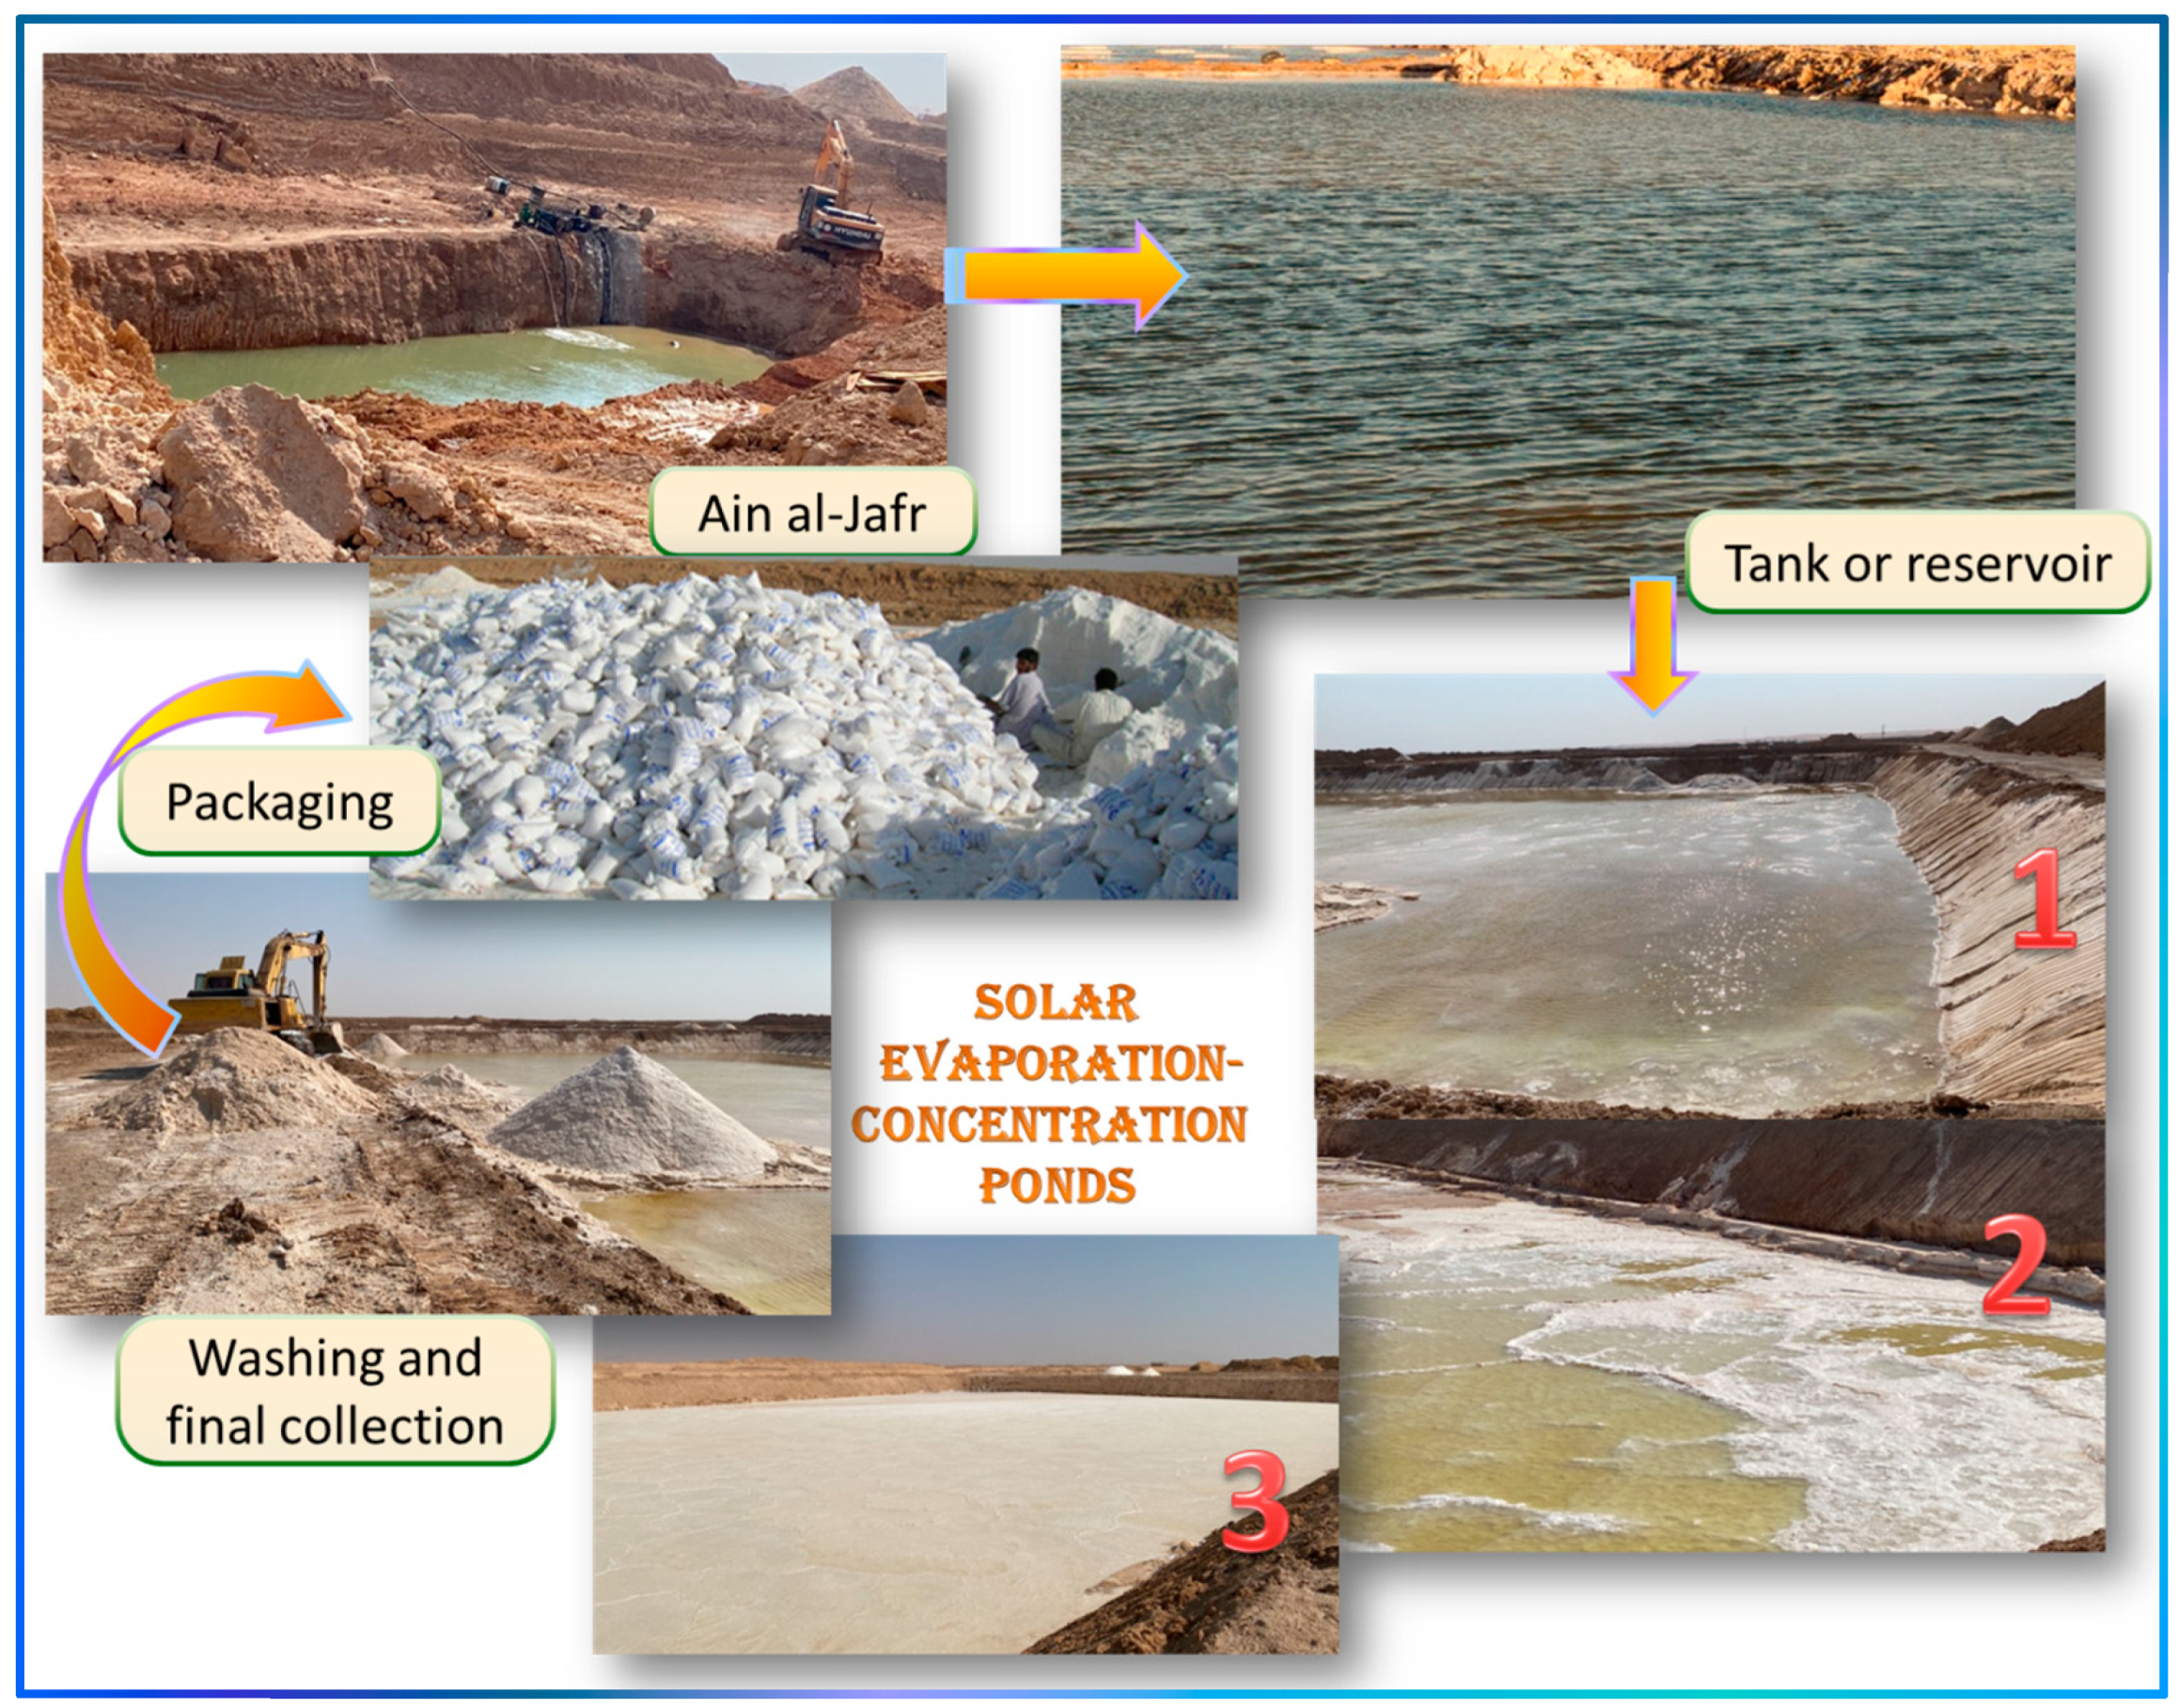
1.2. Description of the Al-Qasab Site and the Salt Harvesting Folkloric Process
- The salt producer digs a spring or a well called Ain Al-Jafr (i.e., the local name in Arabic, which means the mouth or hole of the salt mine).
- A large clay reservoir called a tank is made adjacent to Ain Al-Jafr. This reservoir shall be slightly above ground level to allow the salt water to flow into the next ponds.
- Medium-depth ponds of different lengths are excavated next to the reservoir.
- Water is pumped from the well or spring (Ain Al-Jafr) using pumps to fill the main reservoir or tank.
- The ponds are filled consecutively from the tank, which is concentrated by solar evaporation until the salt solubility limit is reached and deposited on the pond’s surface, forming a thick layer of white salt. This concentration process spans two to four months depending on the climate conditions, especially air temperature and the intensity of the wind.
2. Materials and Methods
2.1. Sampling, Preservation, and Wet-Chemistry Analyses
2.2. Watershed Delineation
2.3. Hydrogeochemical Analysis
3. Results and Discussion
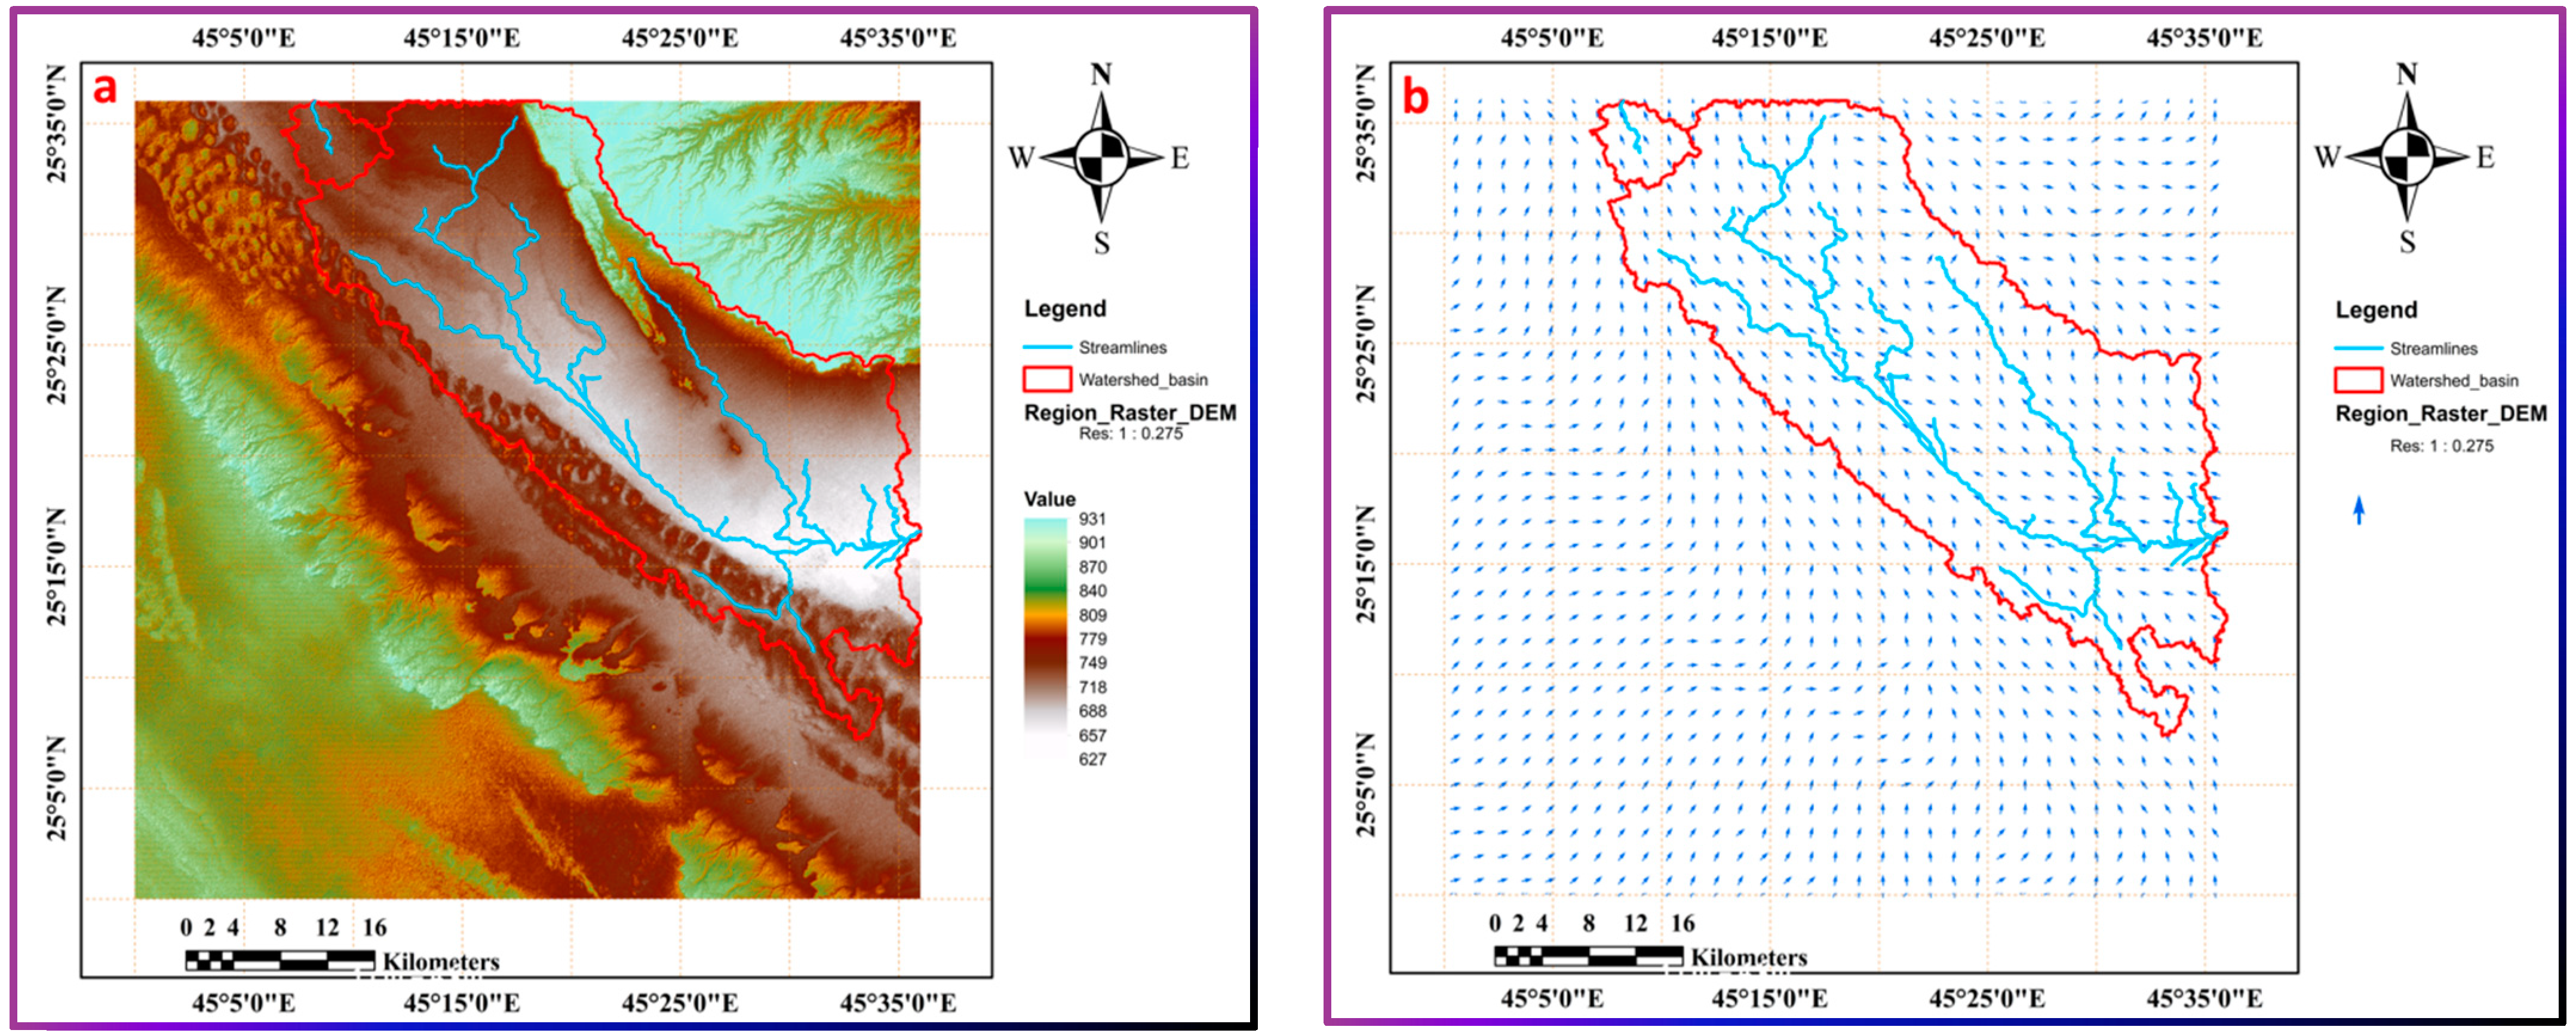
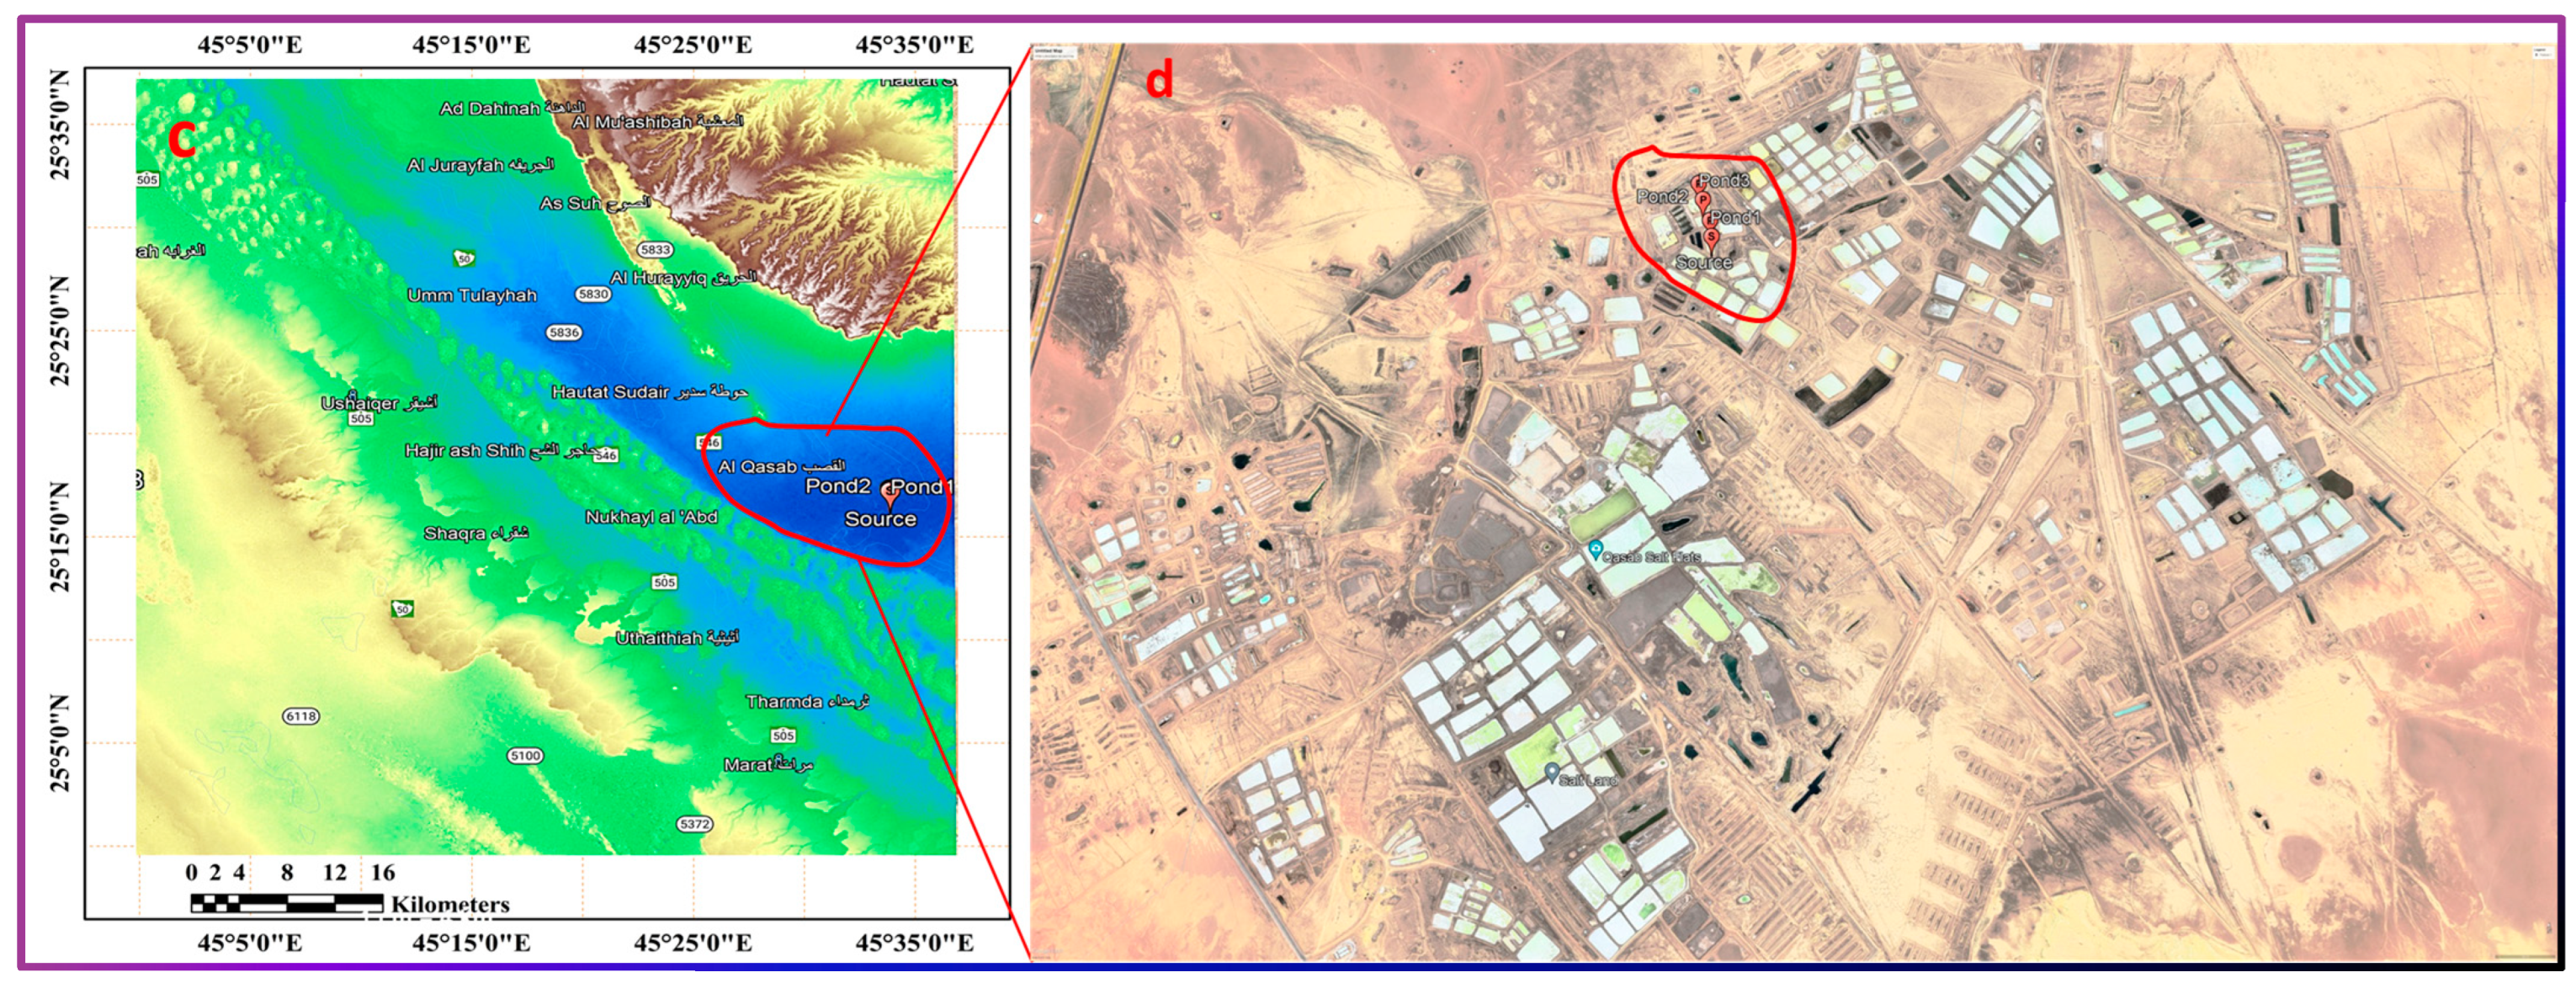
3.1. Delineation of the Watershed Drainage Basin
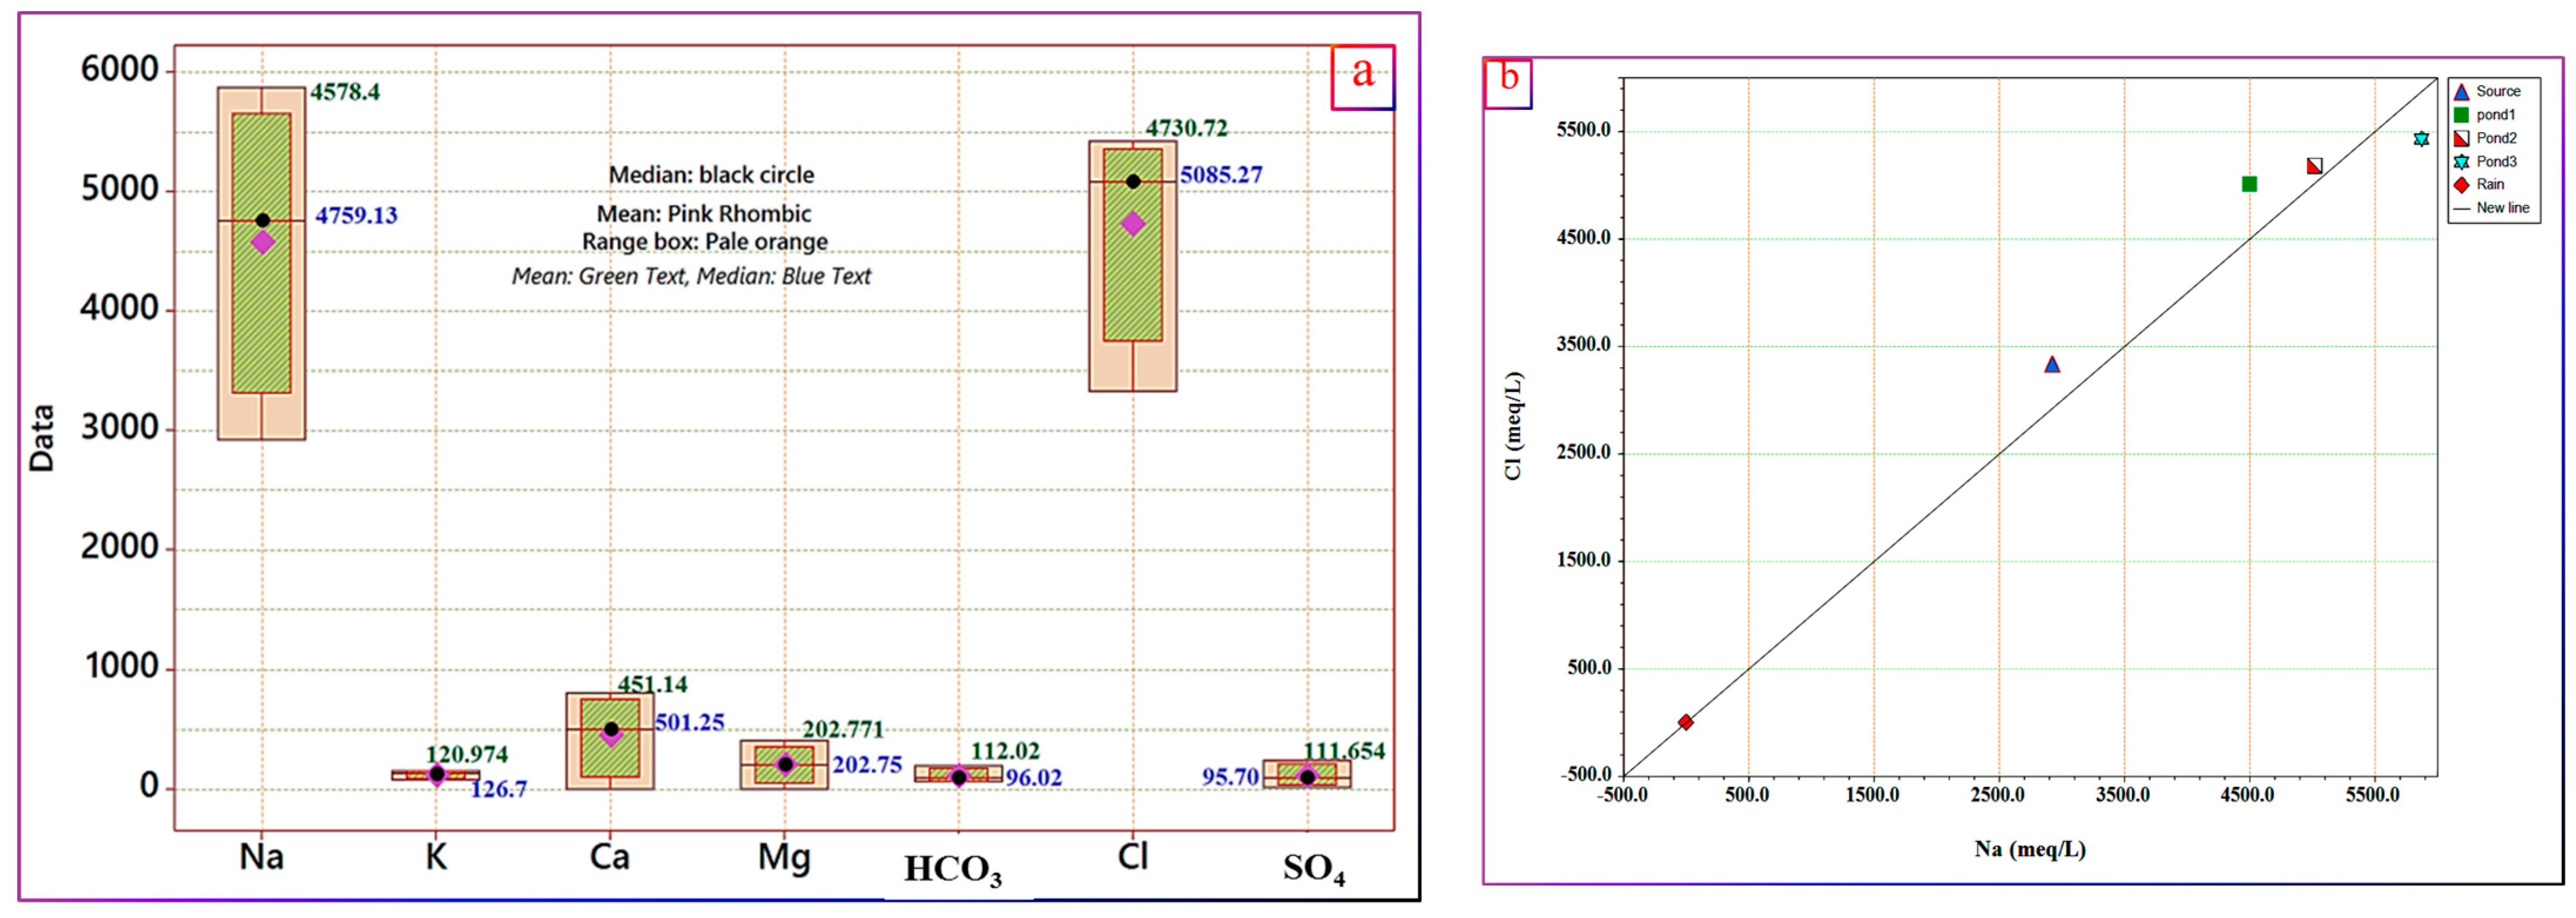
3.2. Descriptive Statistics of the Physicochemical Data
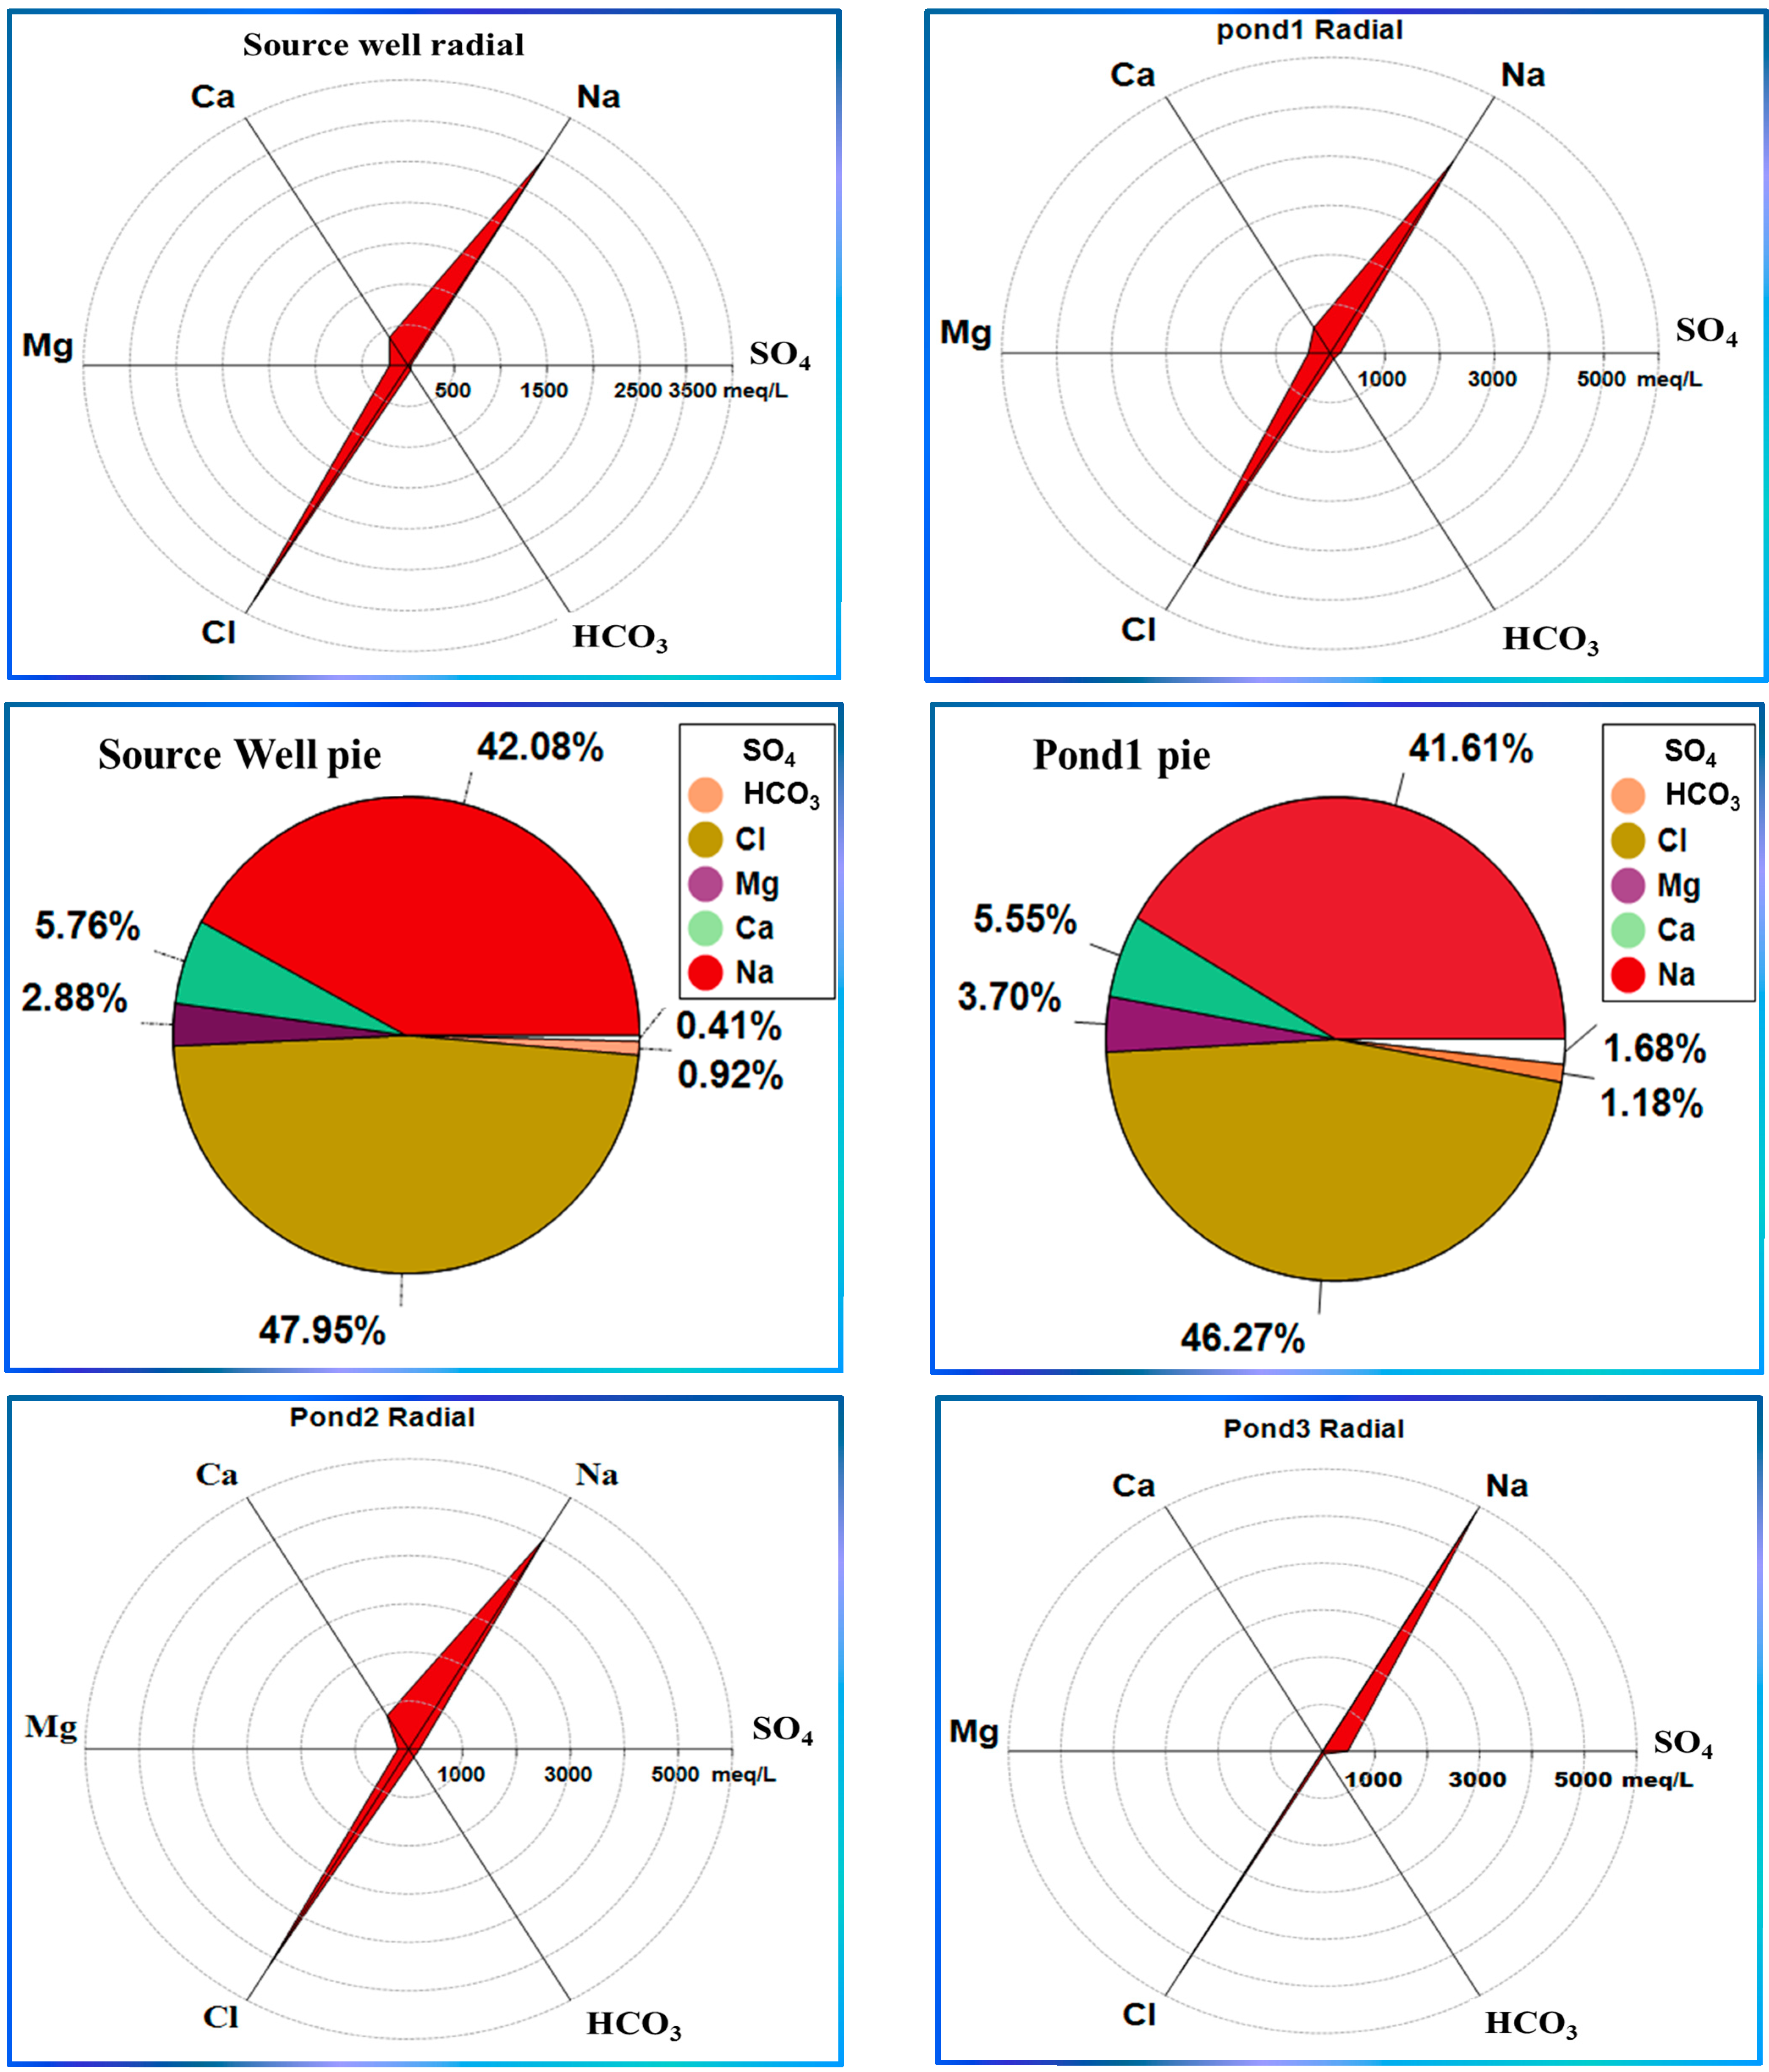
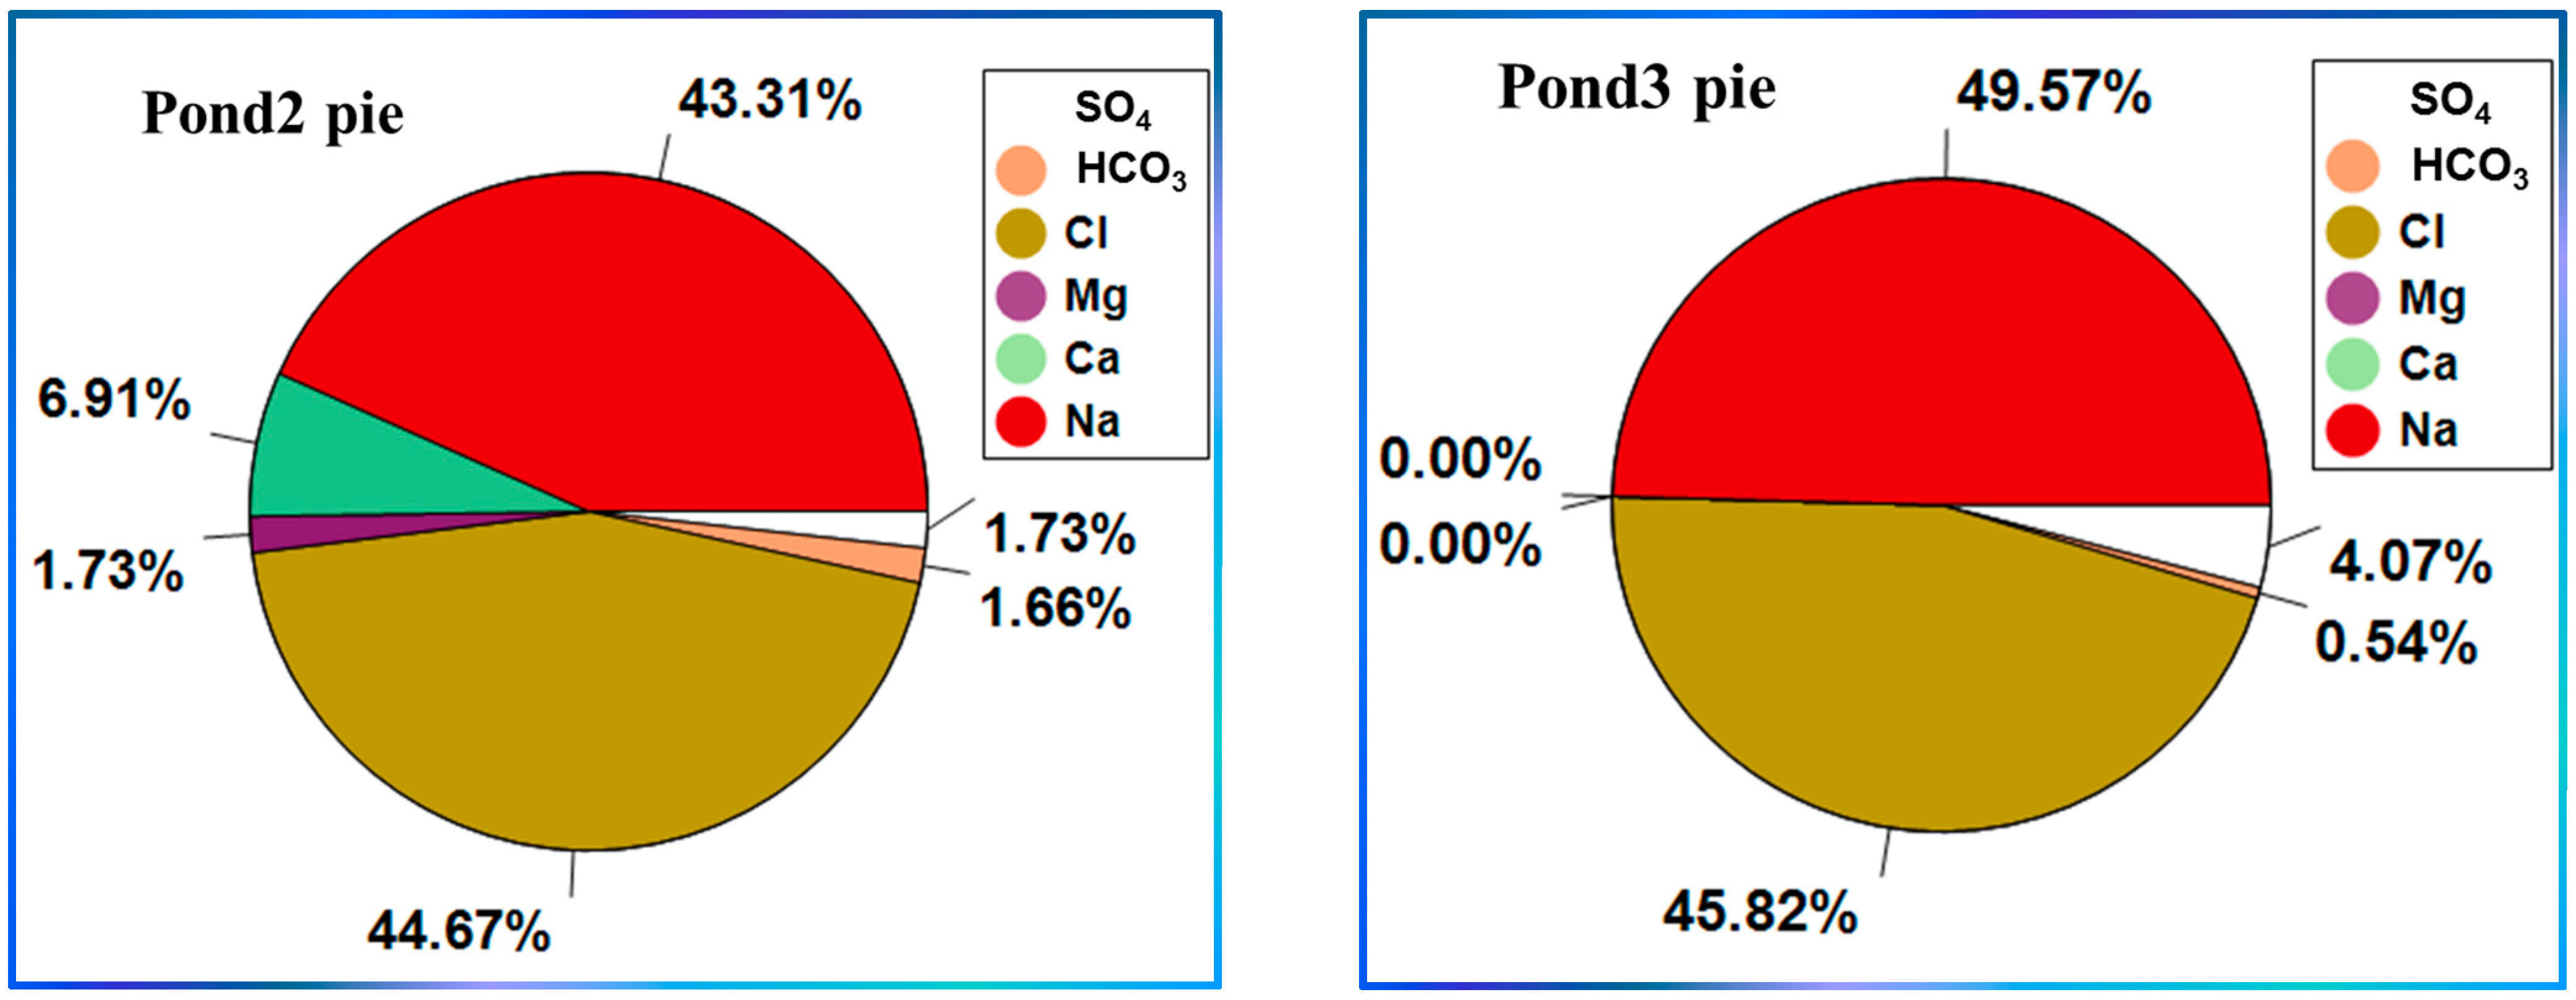
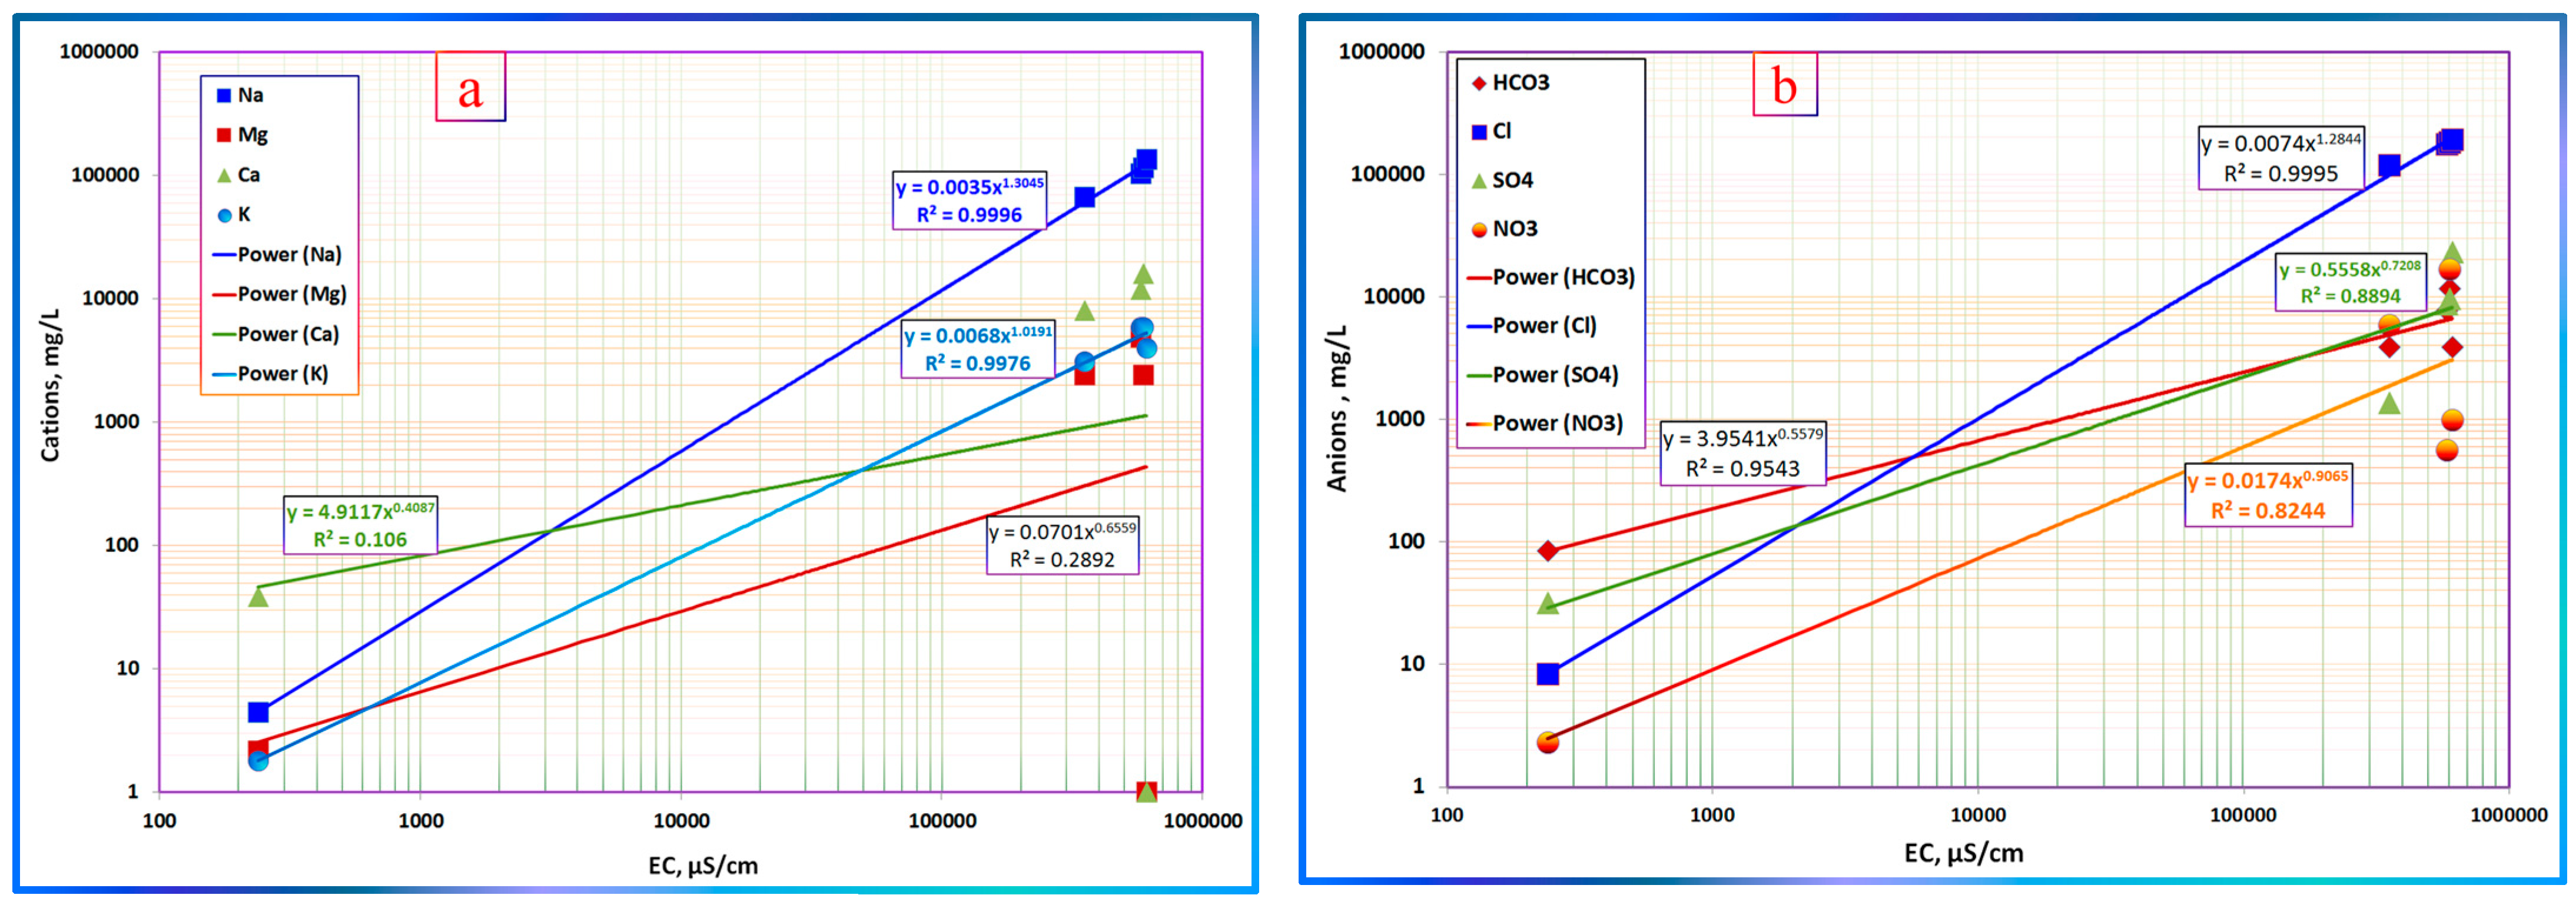
3.3. Major Constituent Distribution
3.4. HydroGeochemical Changes Using Geochemical Diagrams
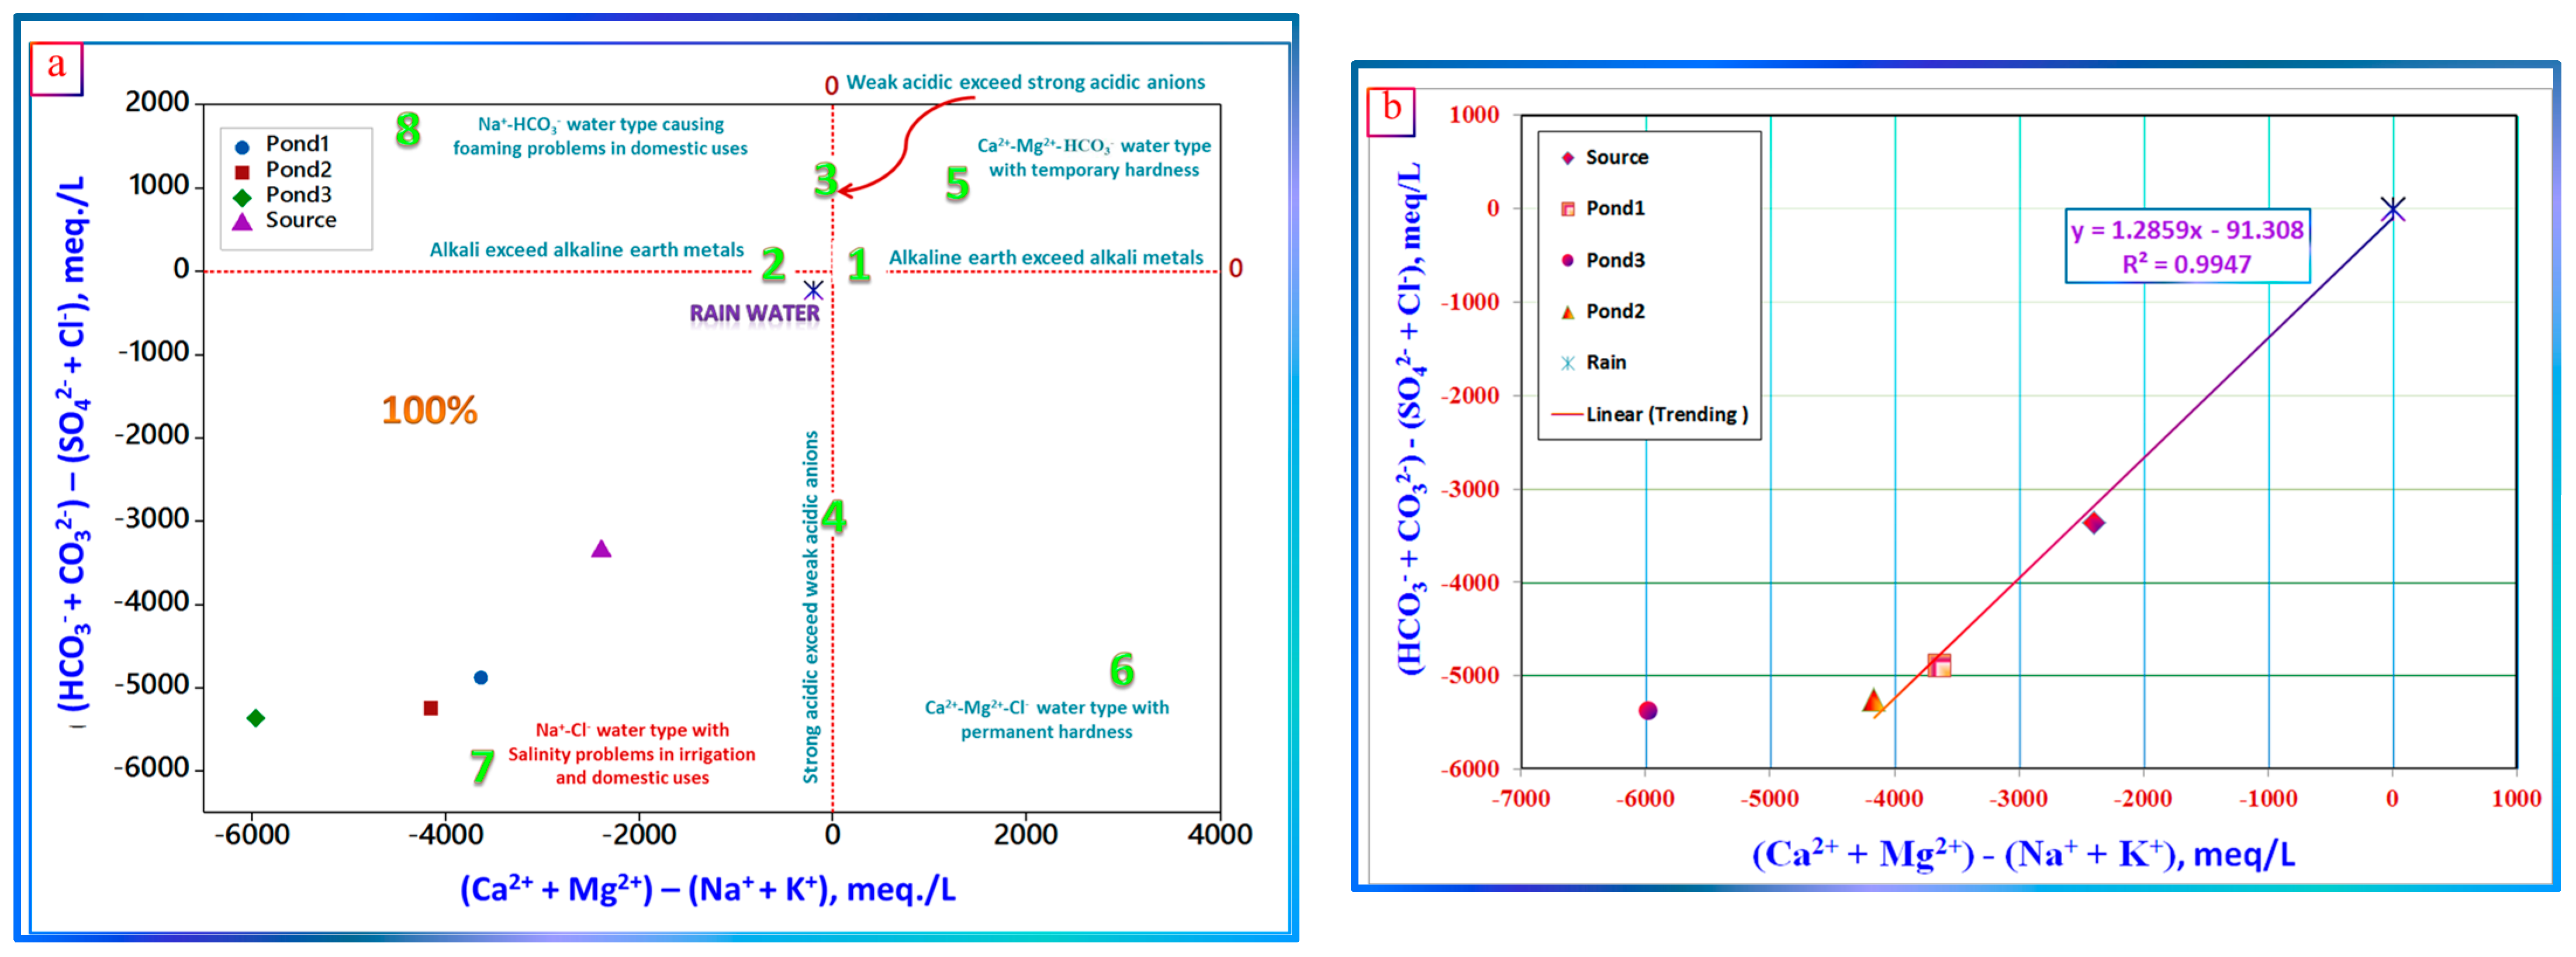
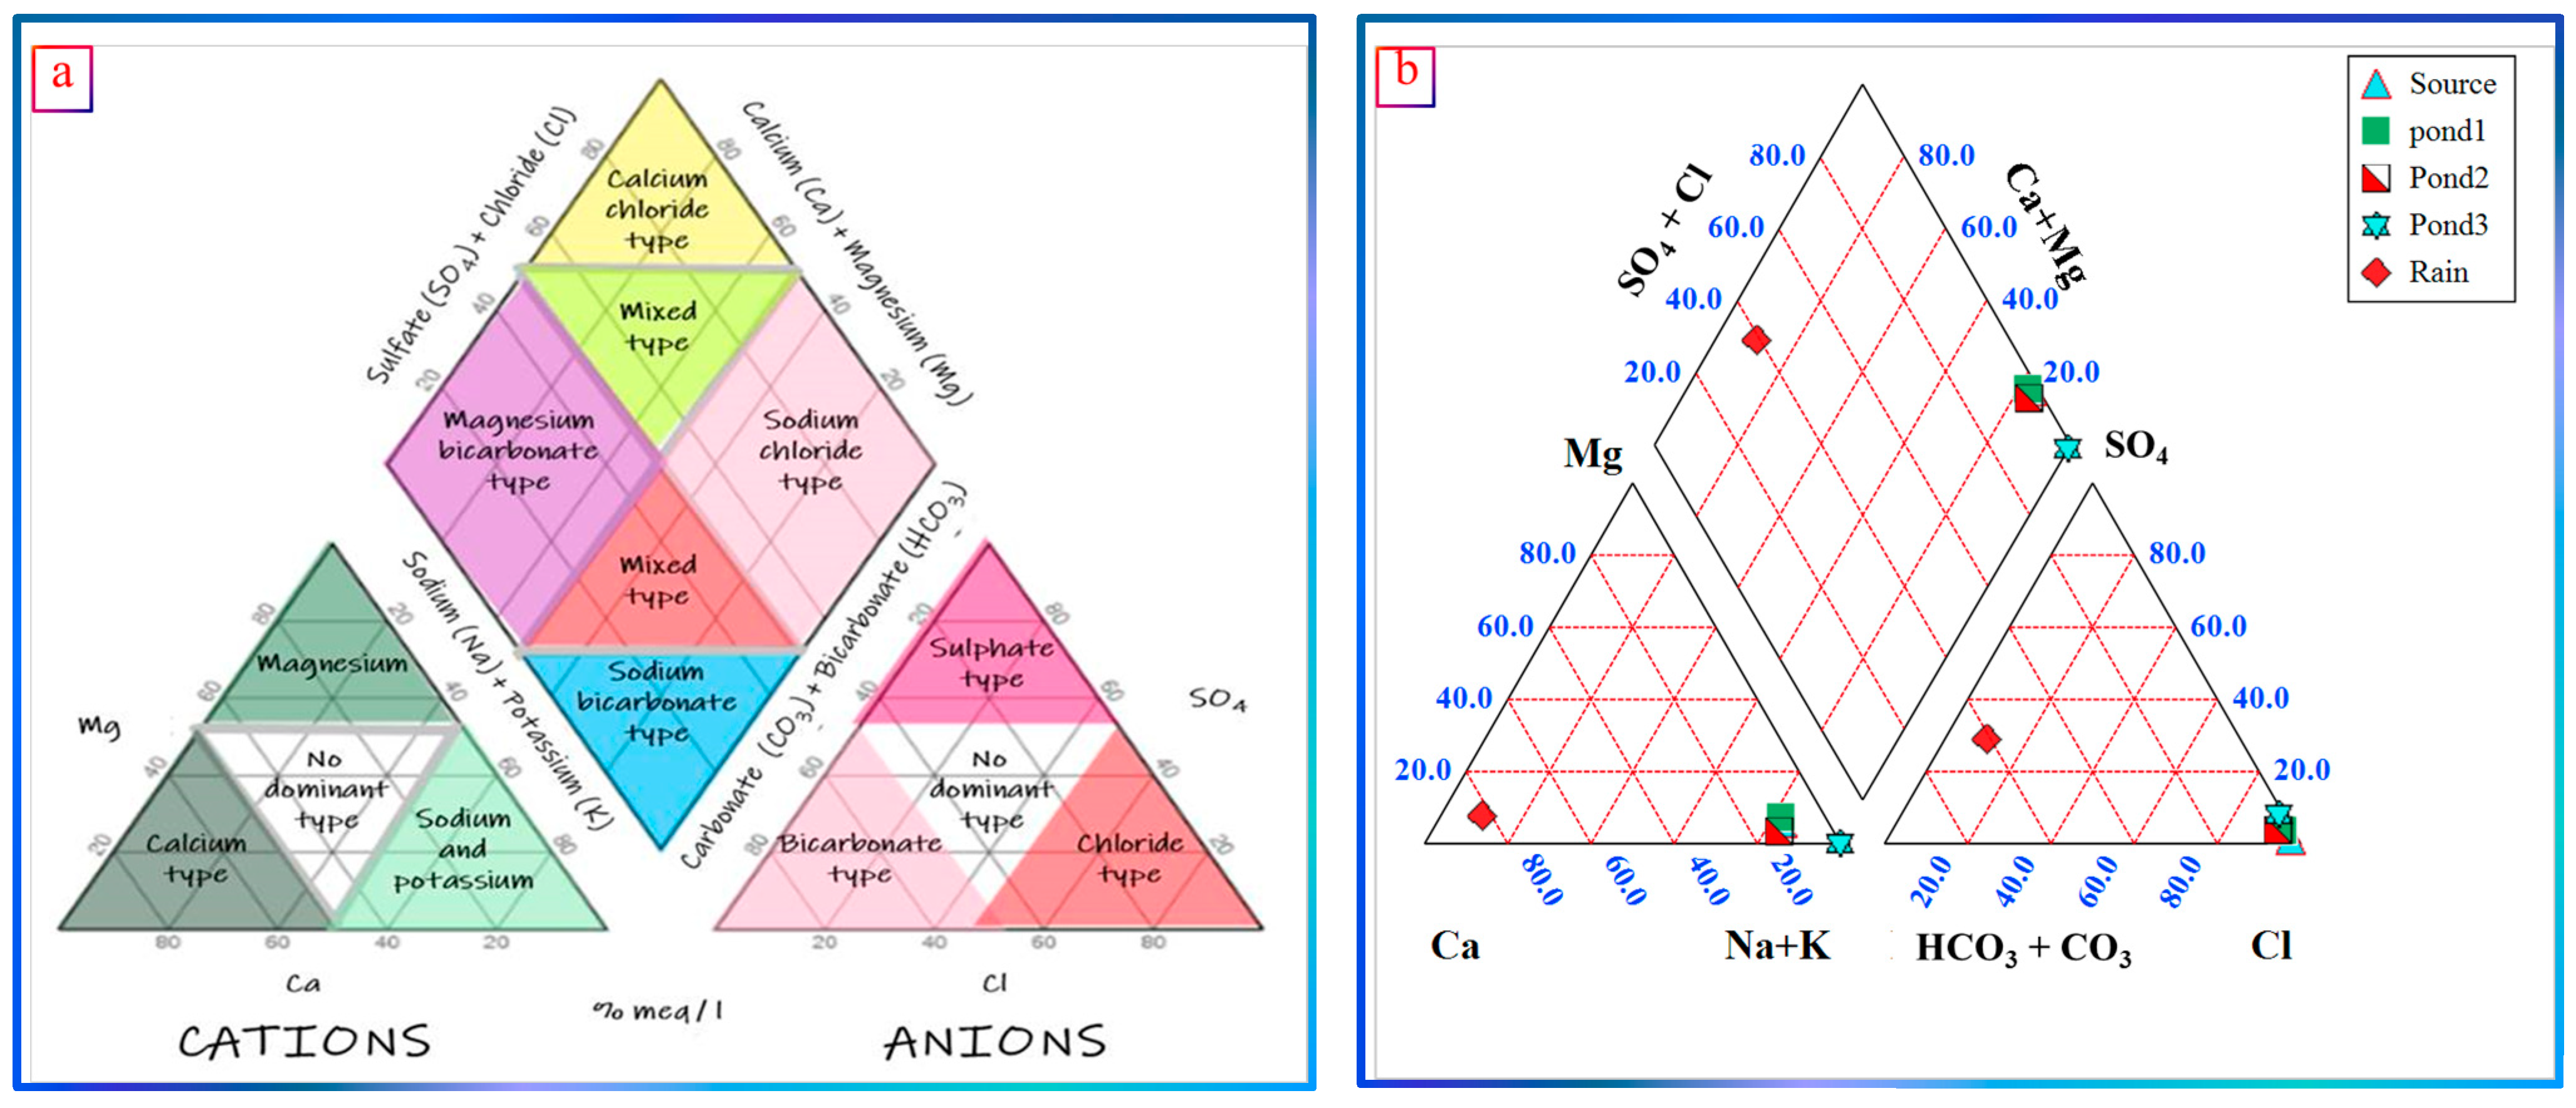
- Chadha Plot
- b.
- Piper Plot
- c.
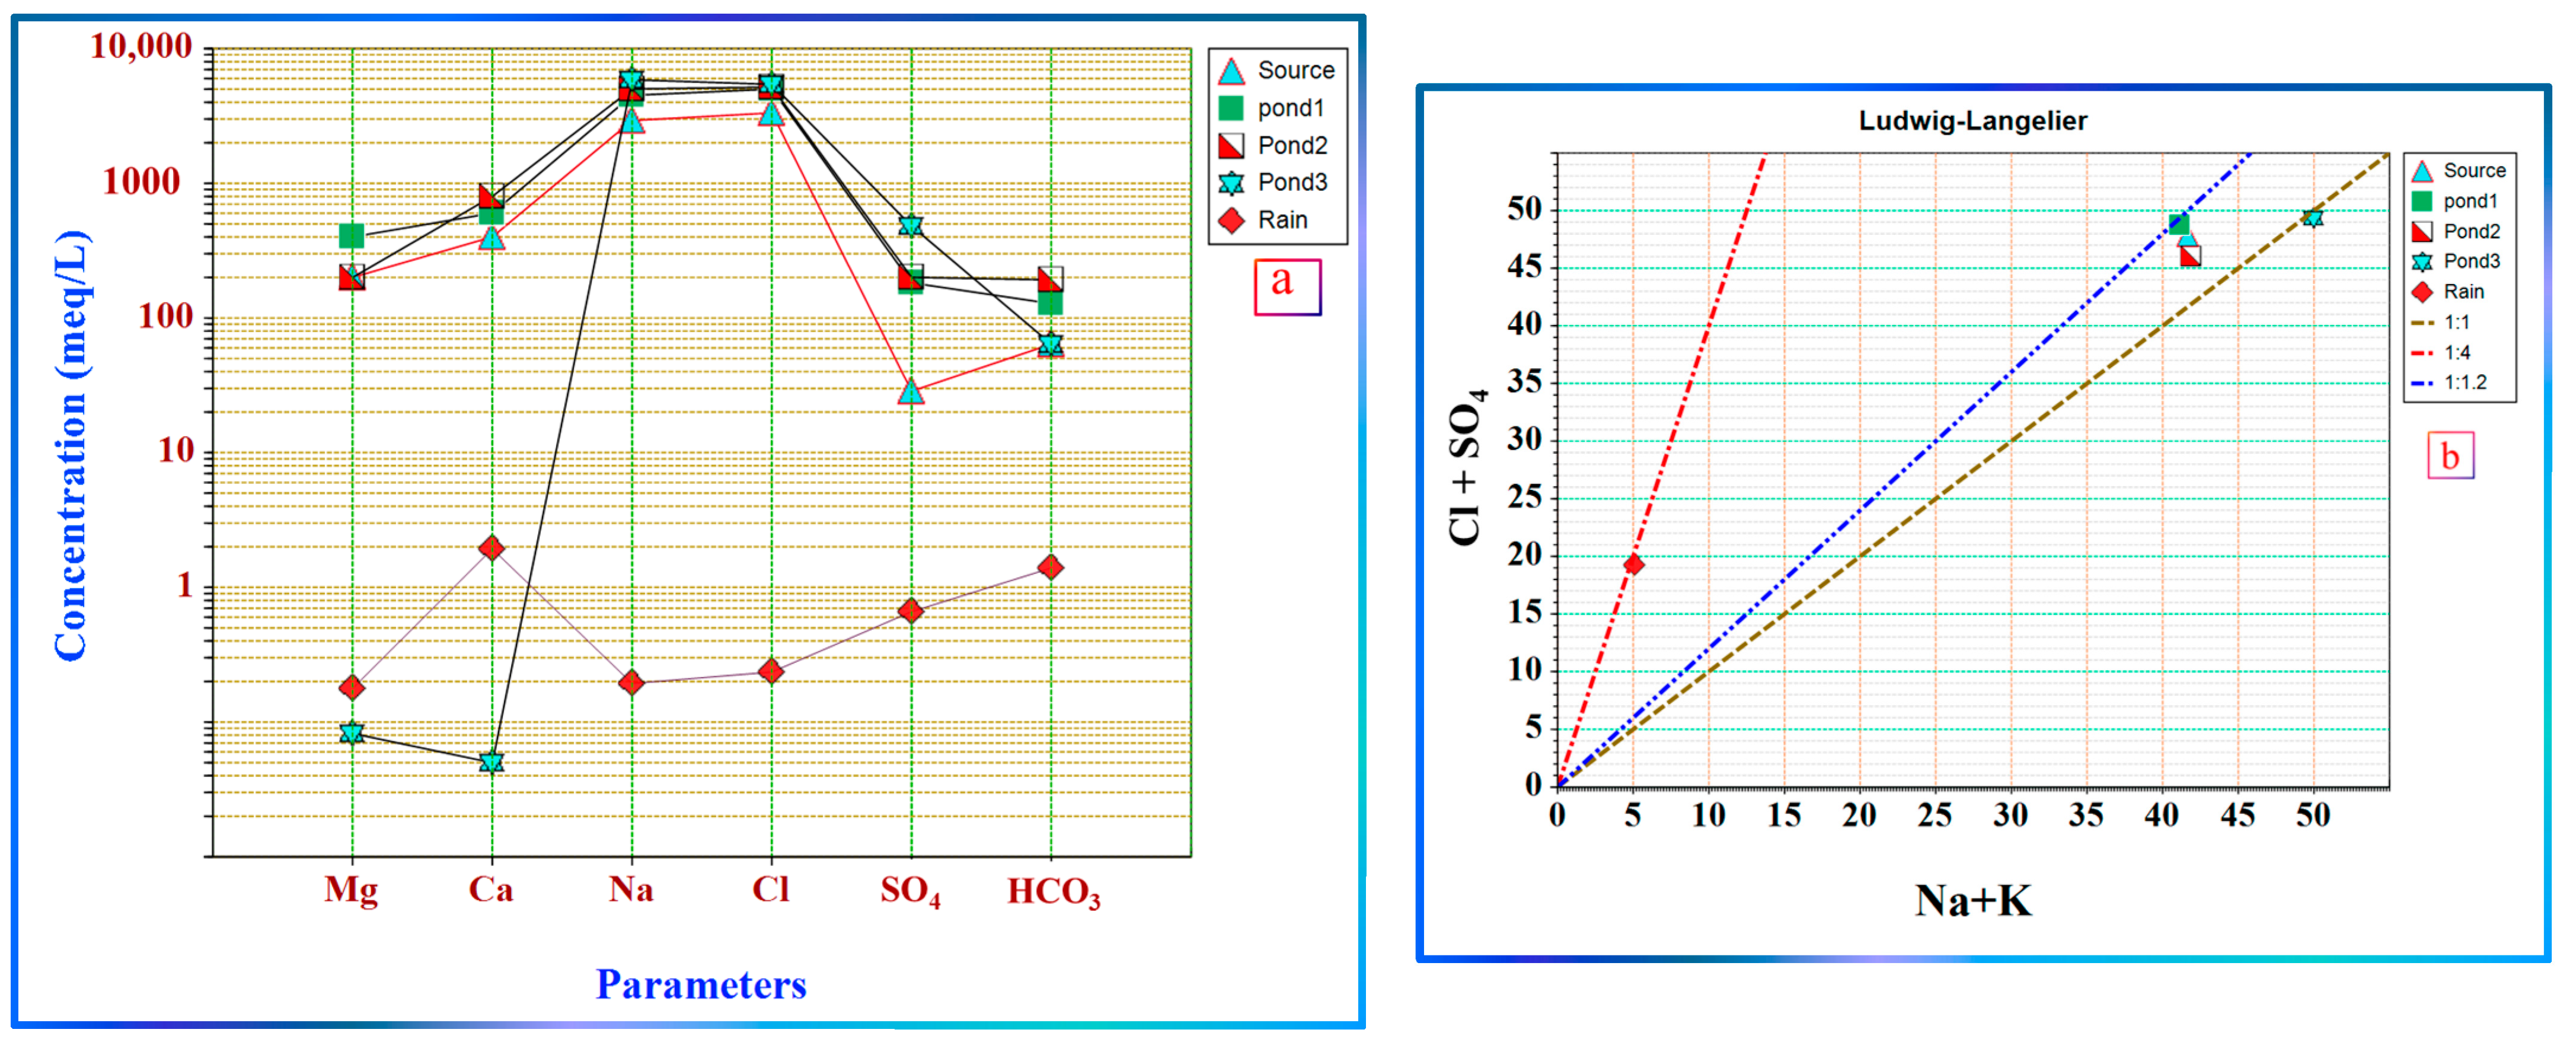
- Schoeller diagram and Ludwig–Langelier plot
- d.
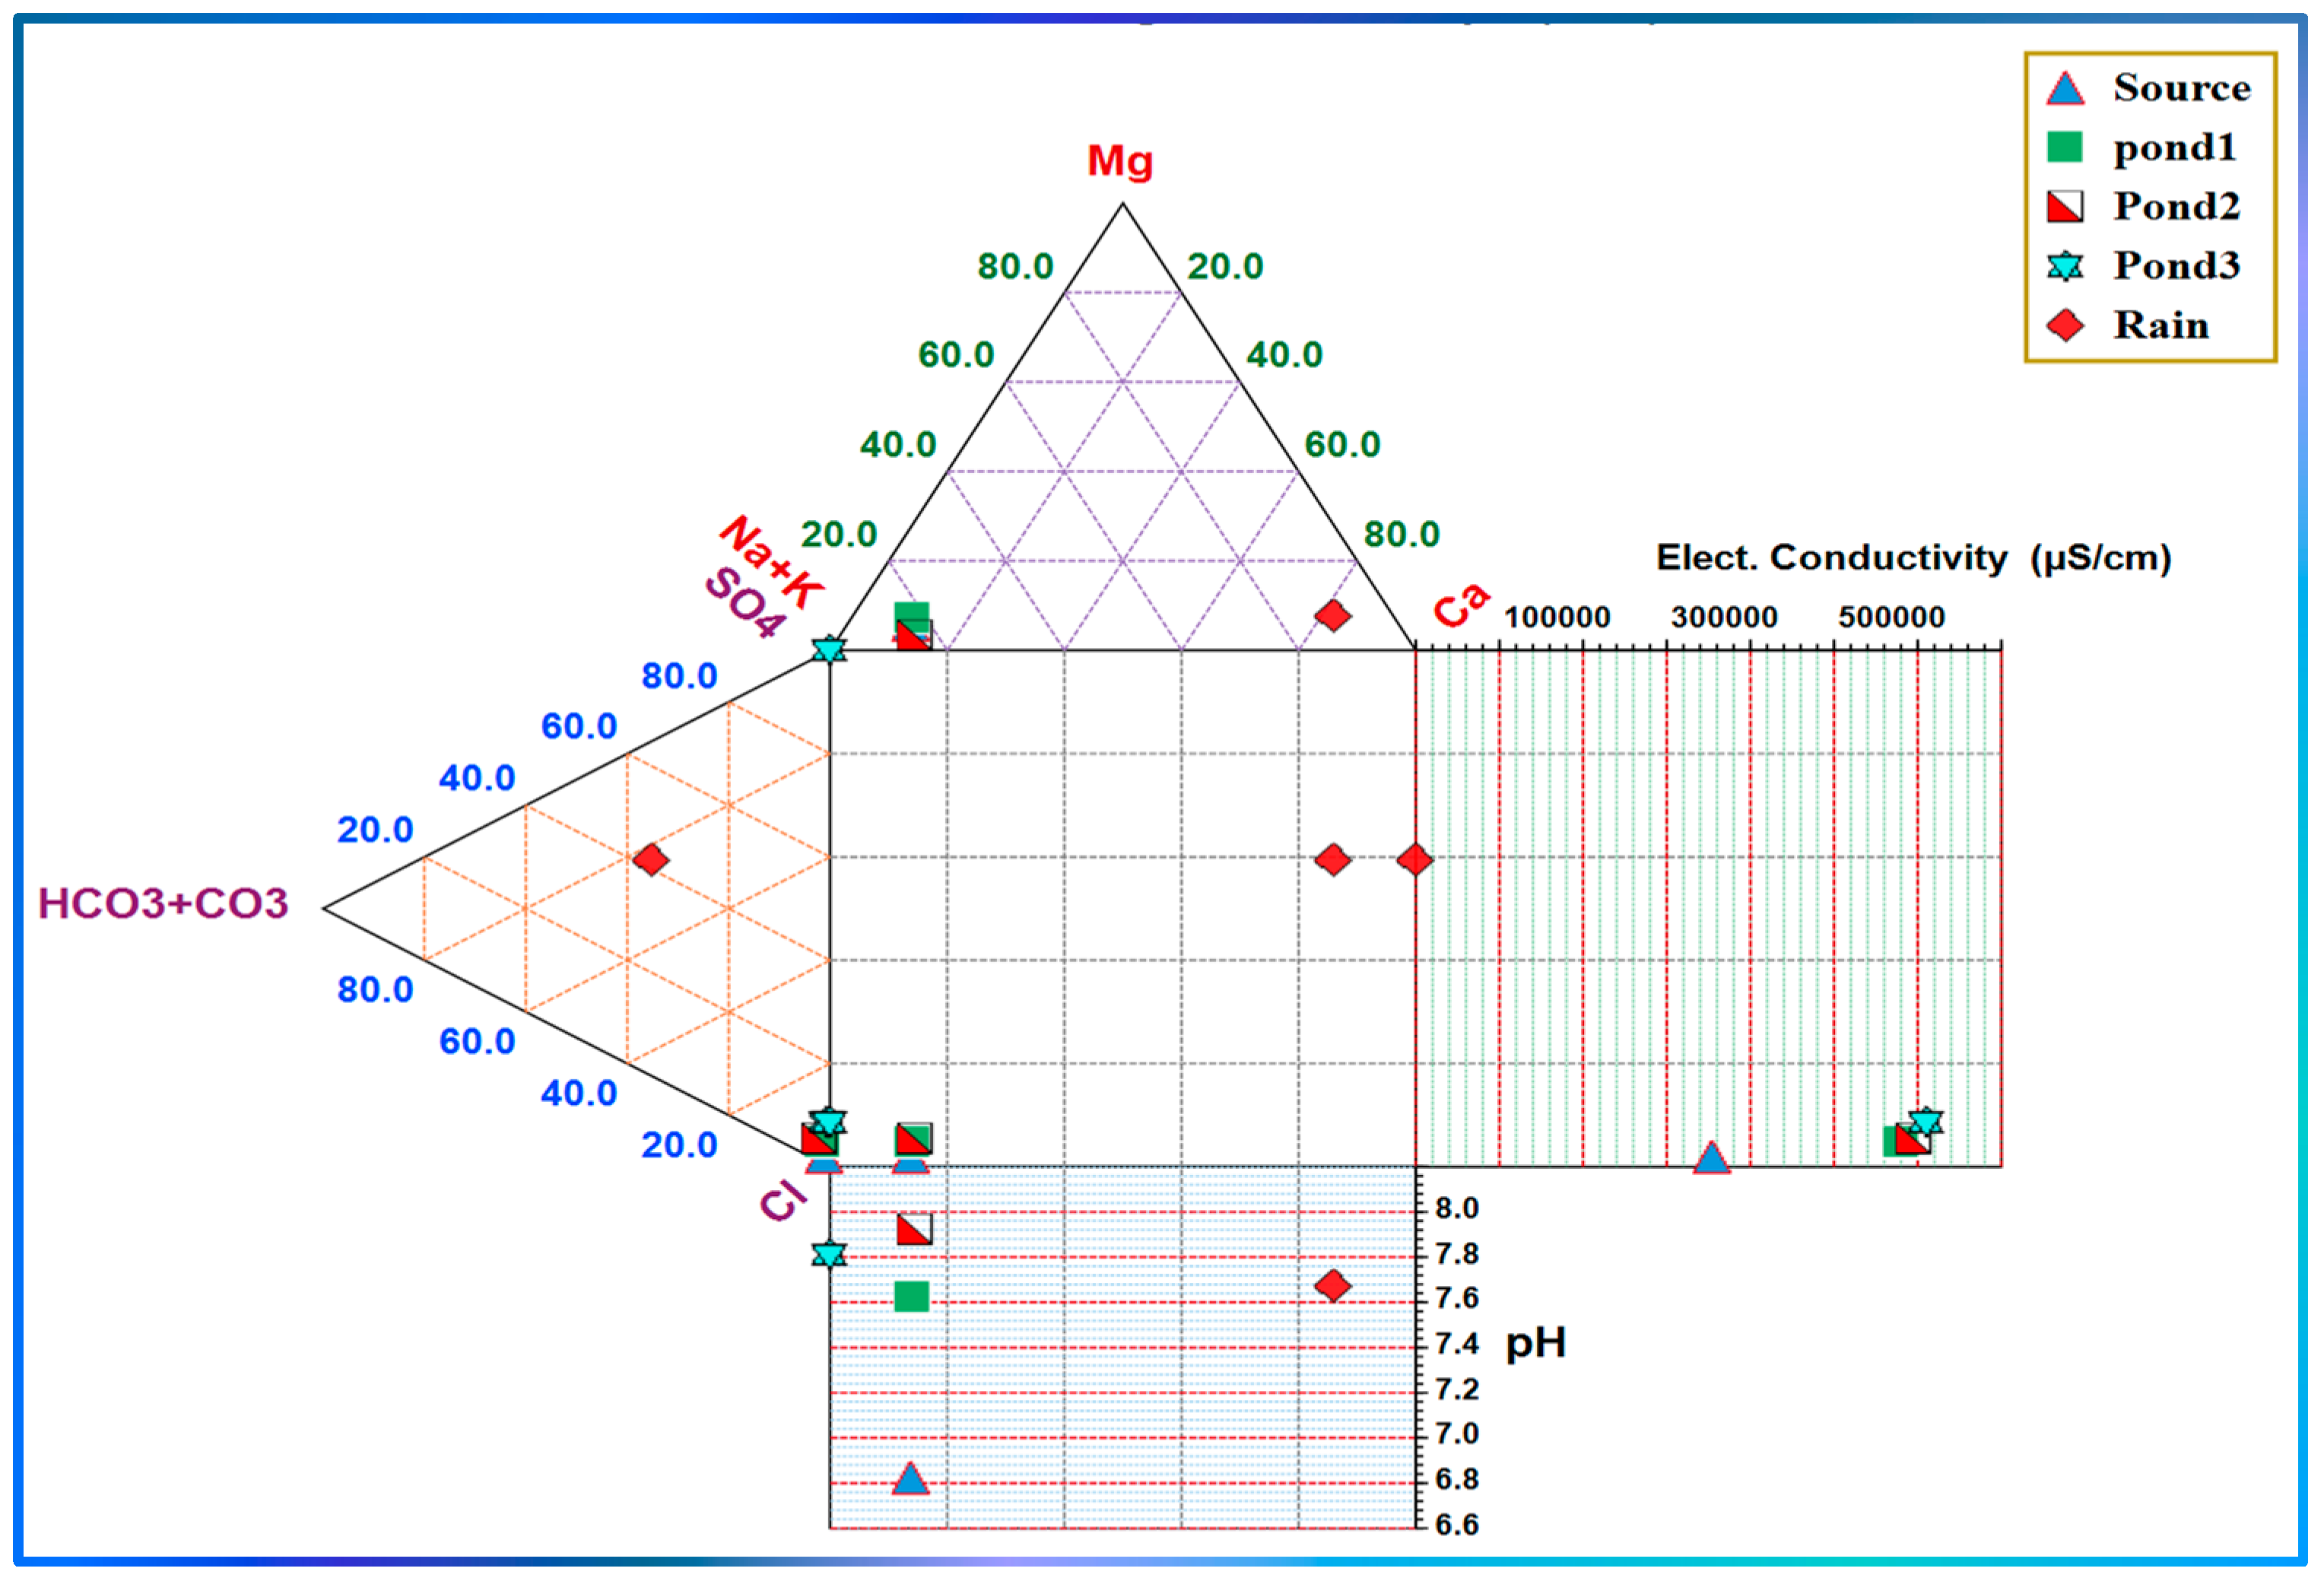
- Durov diagram
- e.
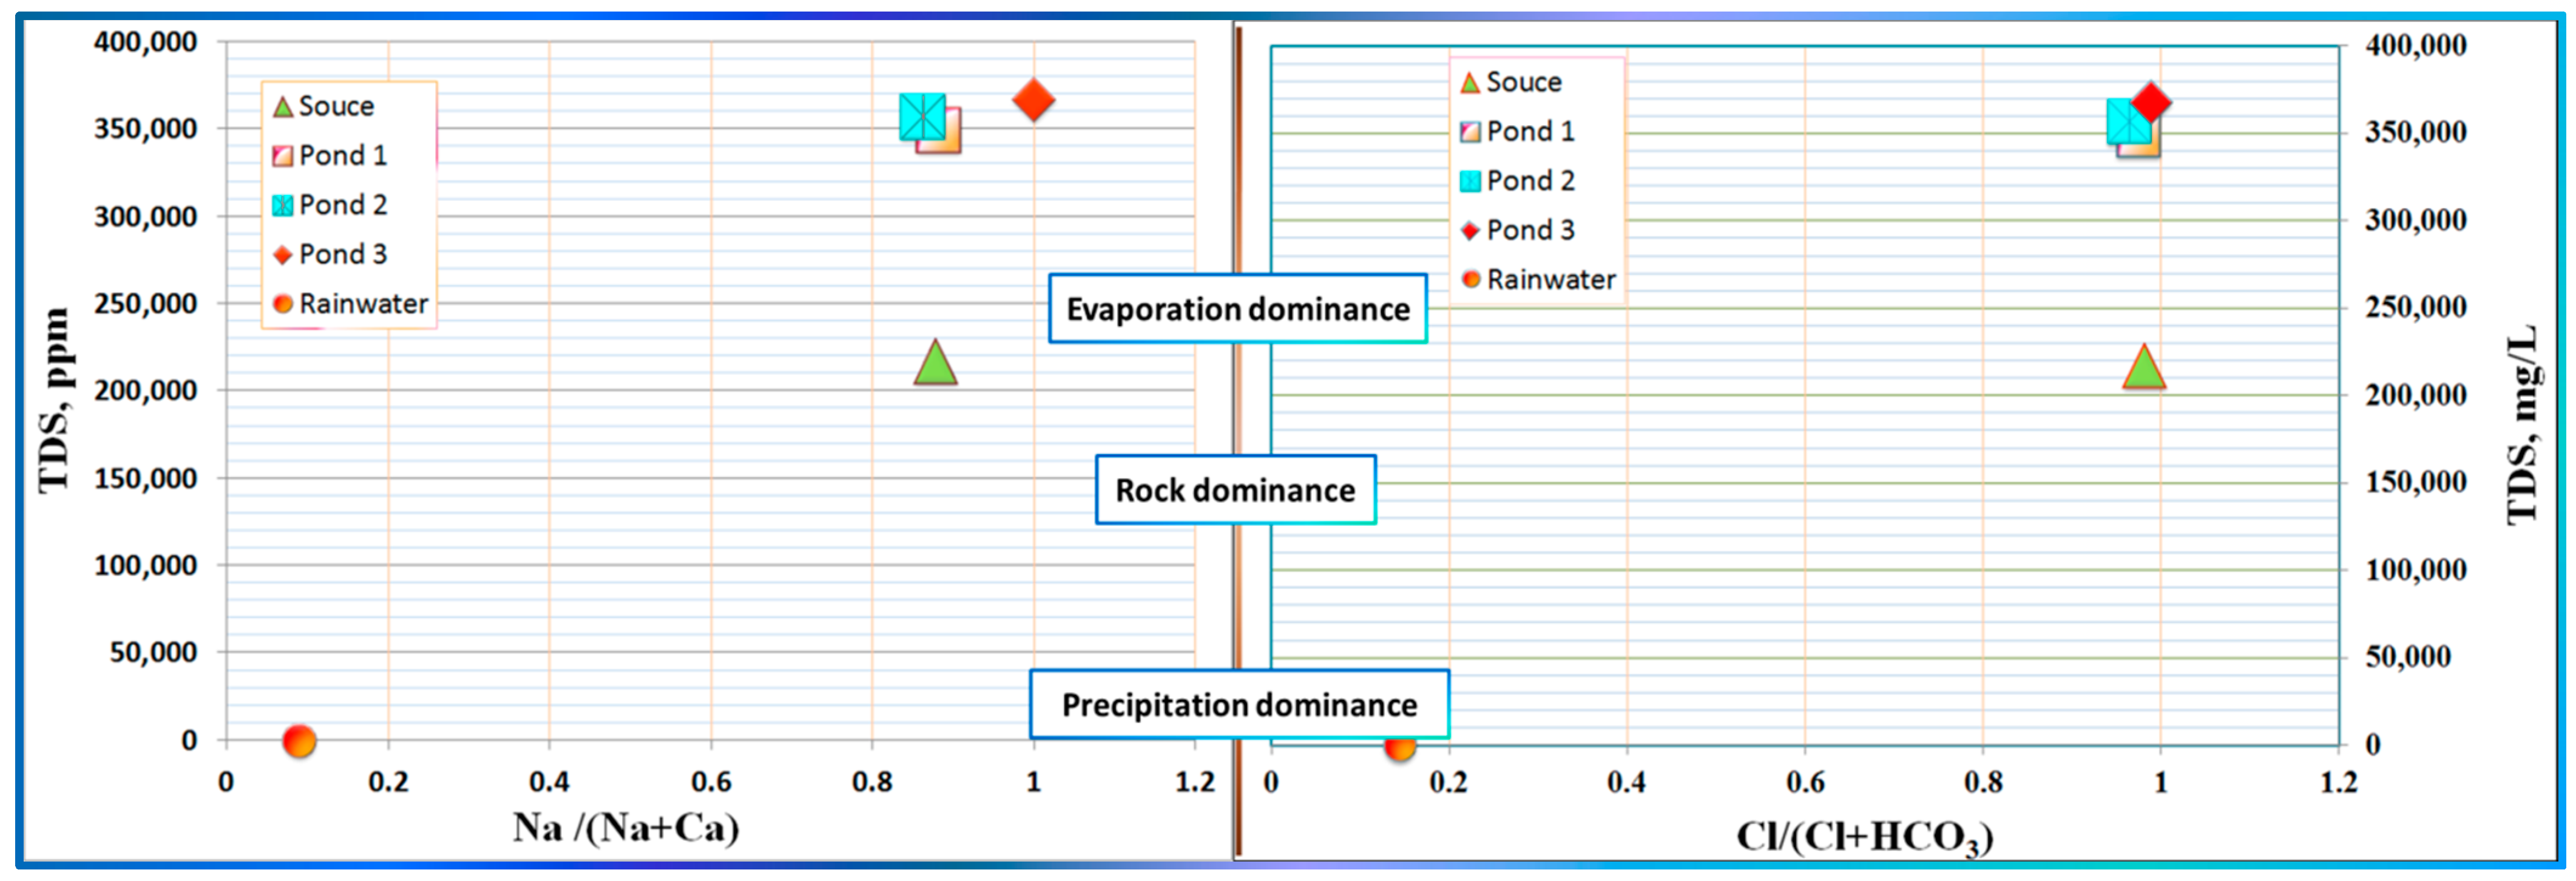
- Gibbs Diagram
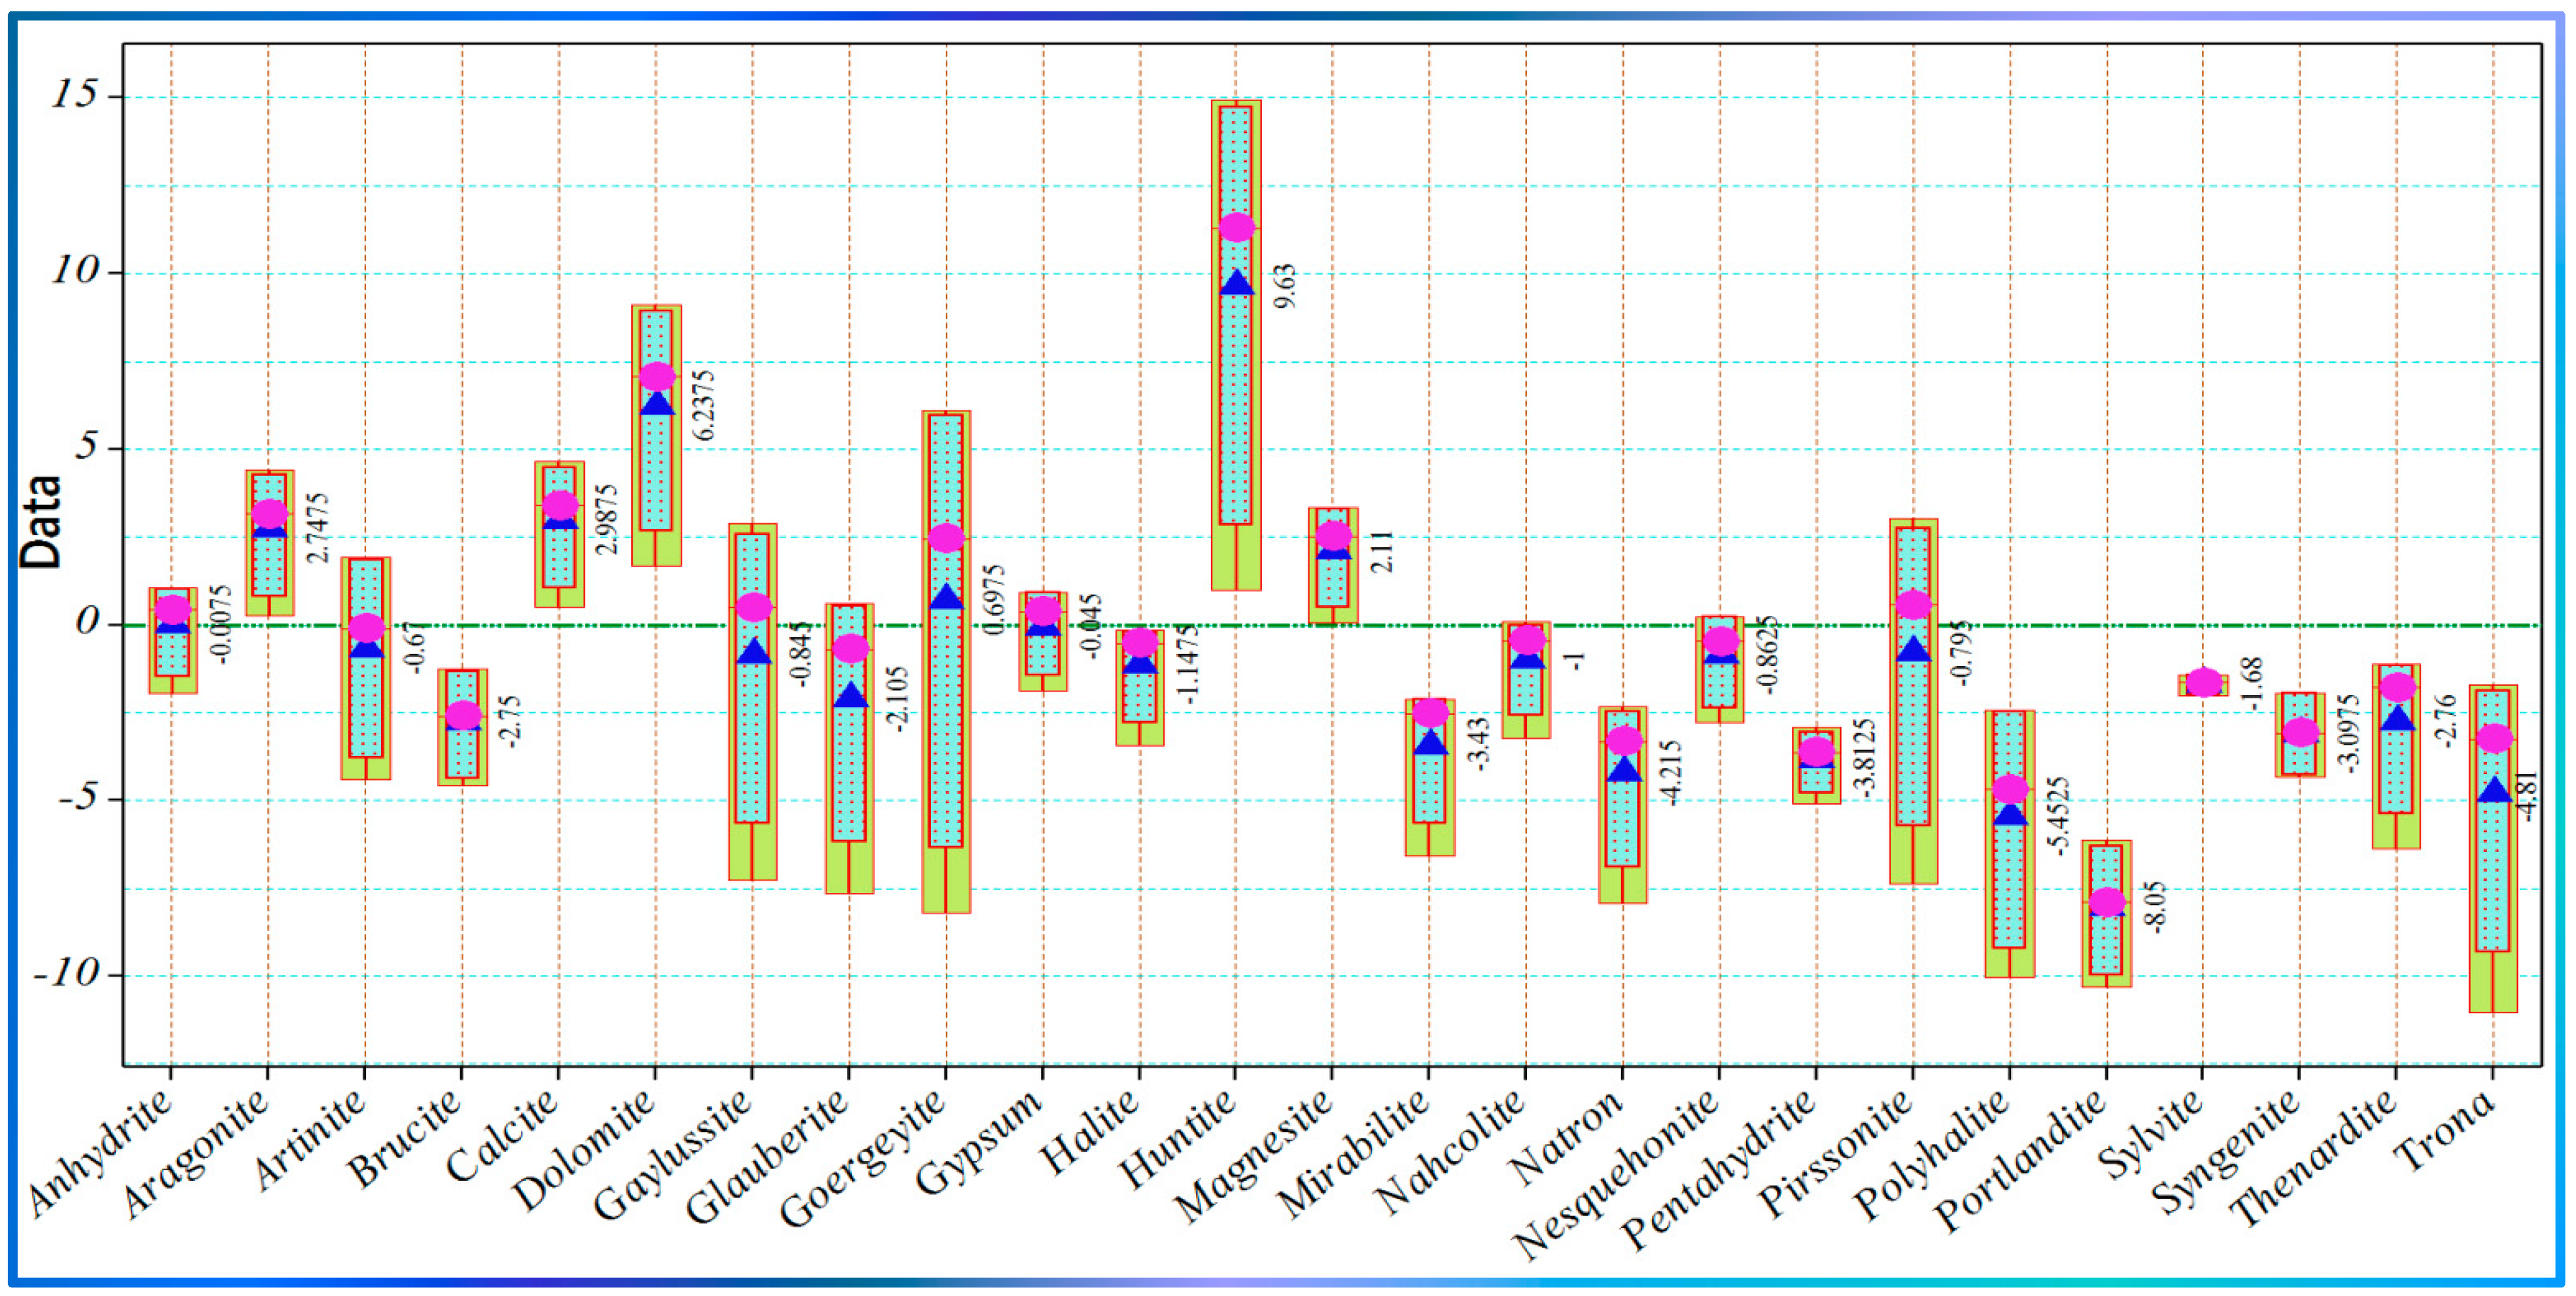
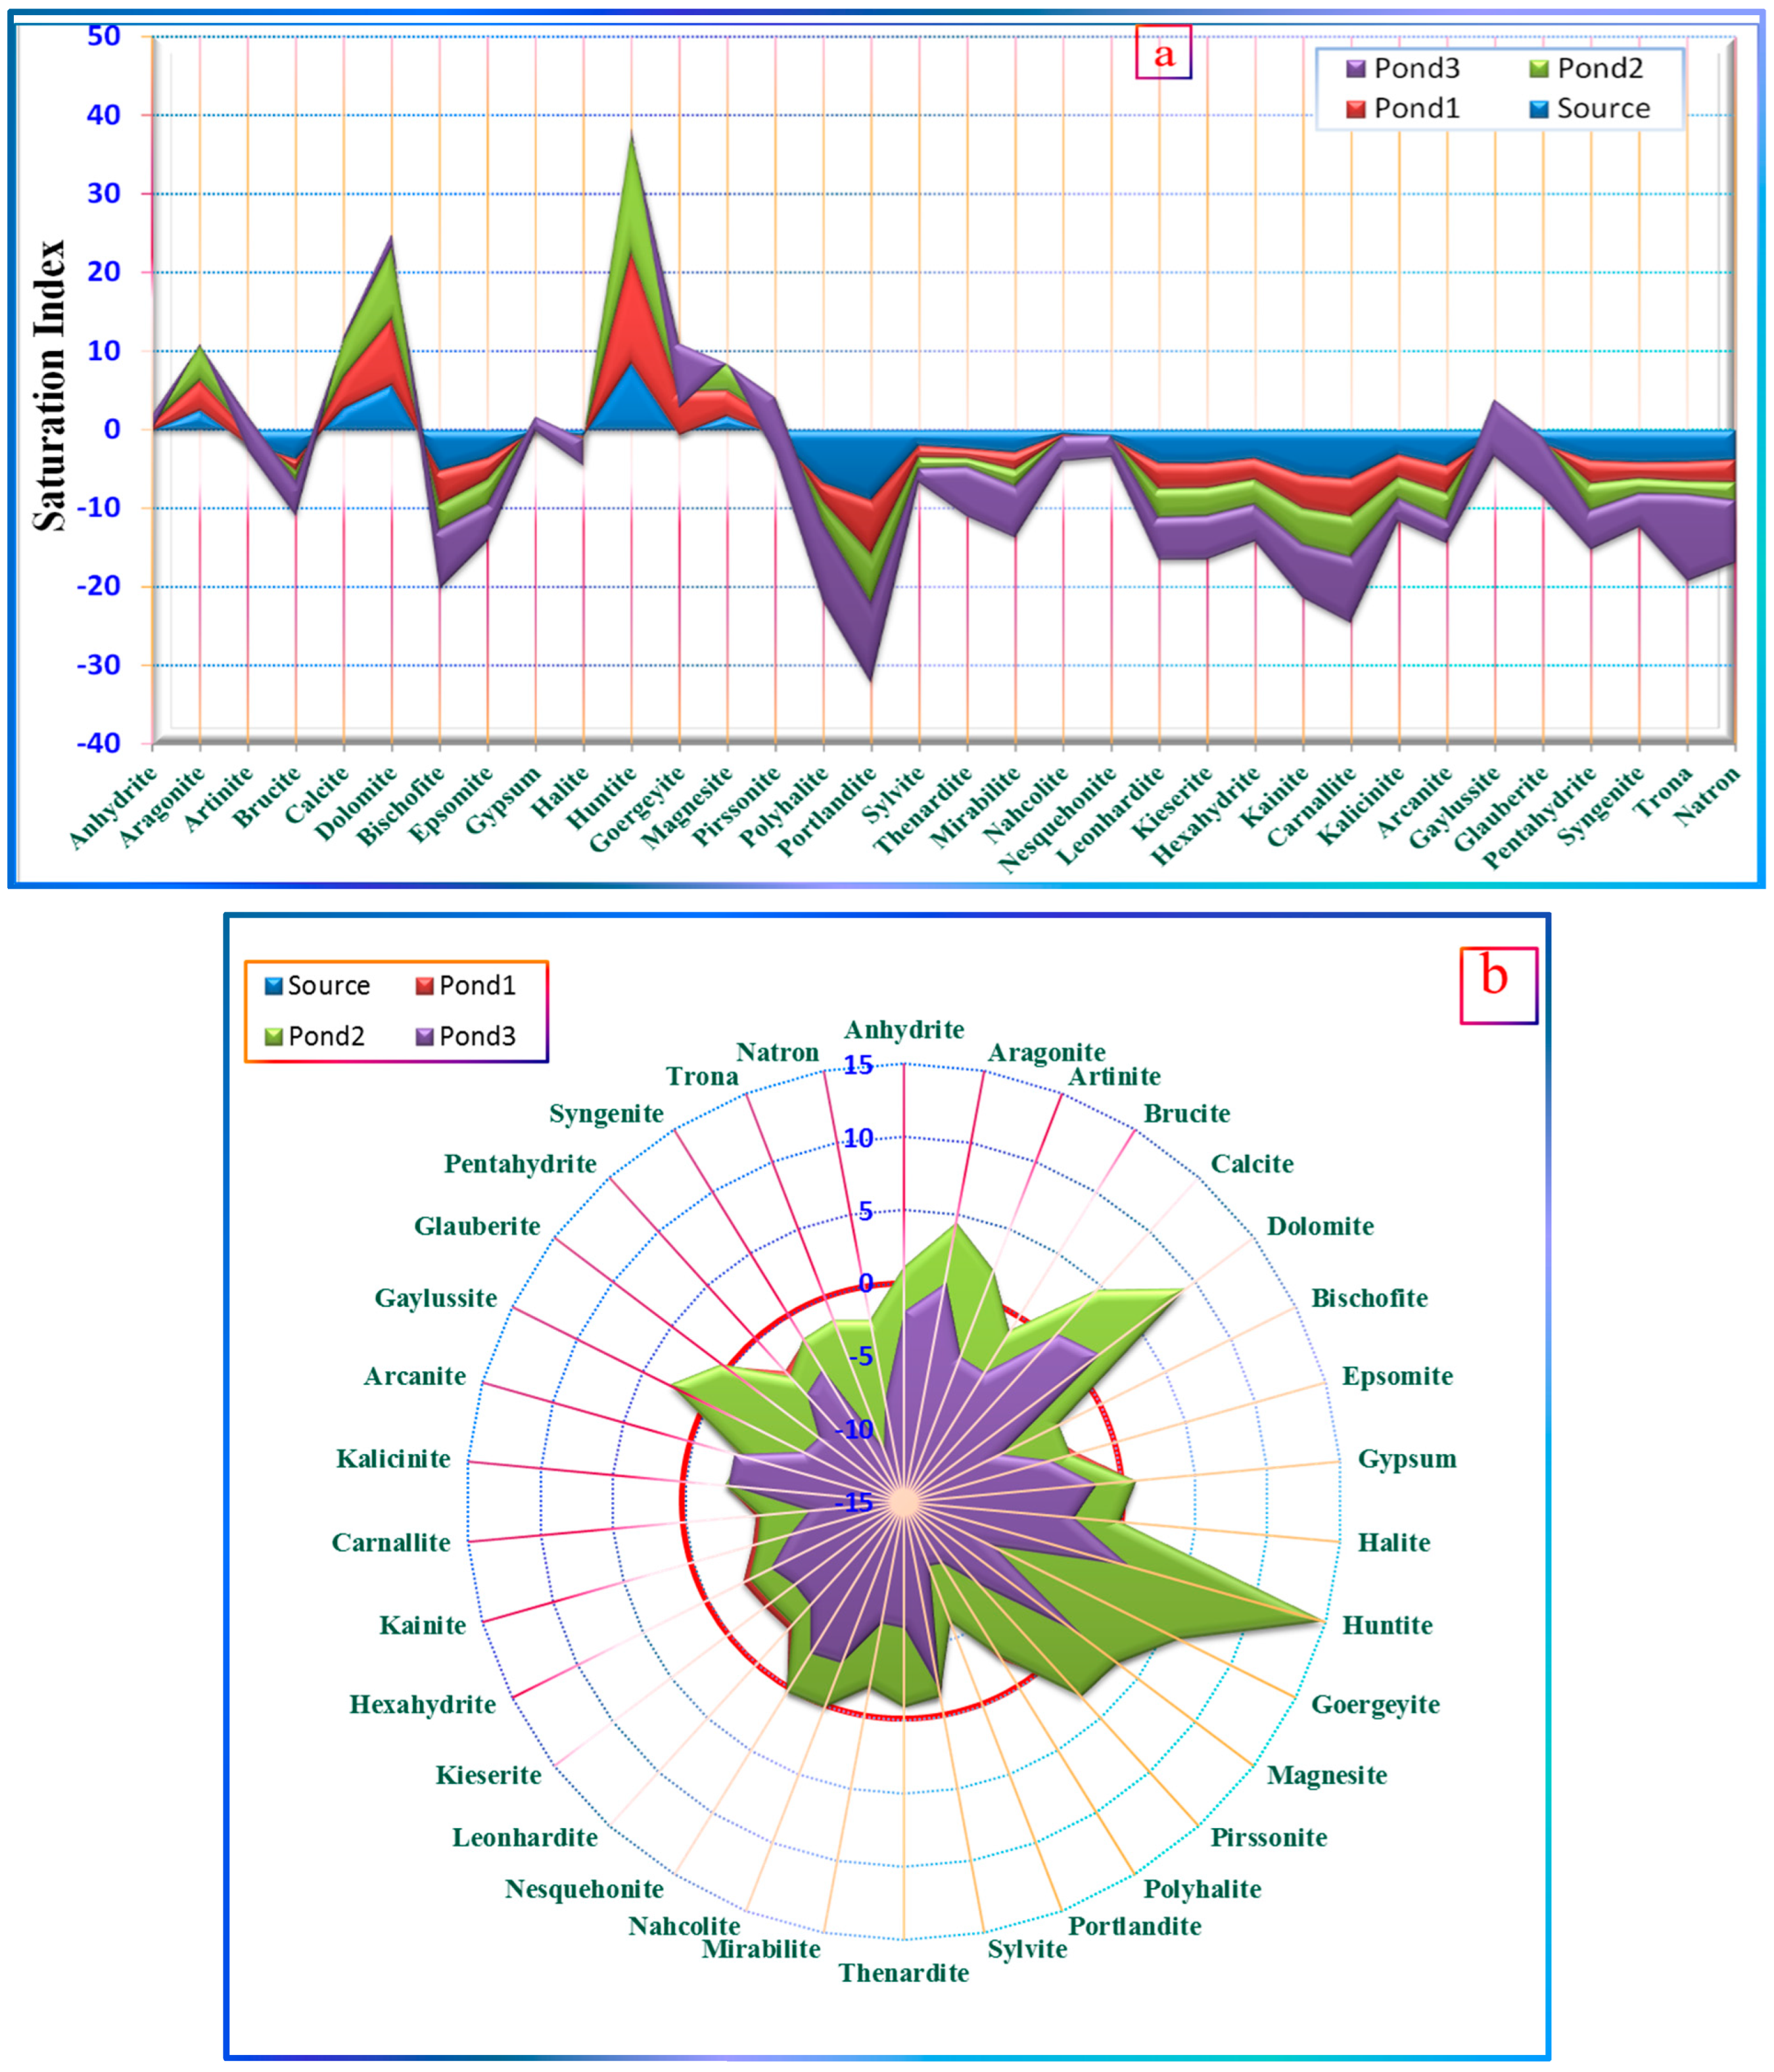
3.5. Thermodynamic-Based Geochemical Analysis Using PHREEQC Software
3.6. Climatic Conditions
4. Conclusions
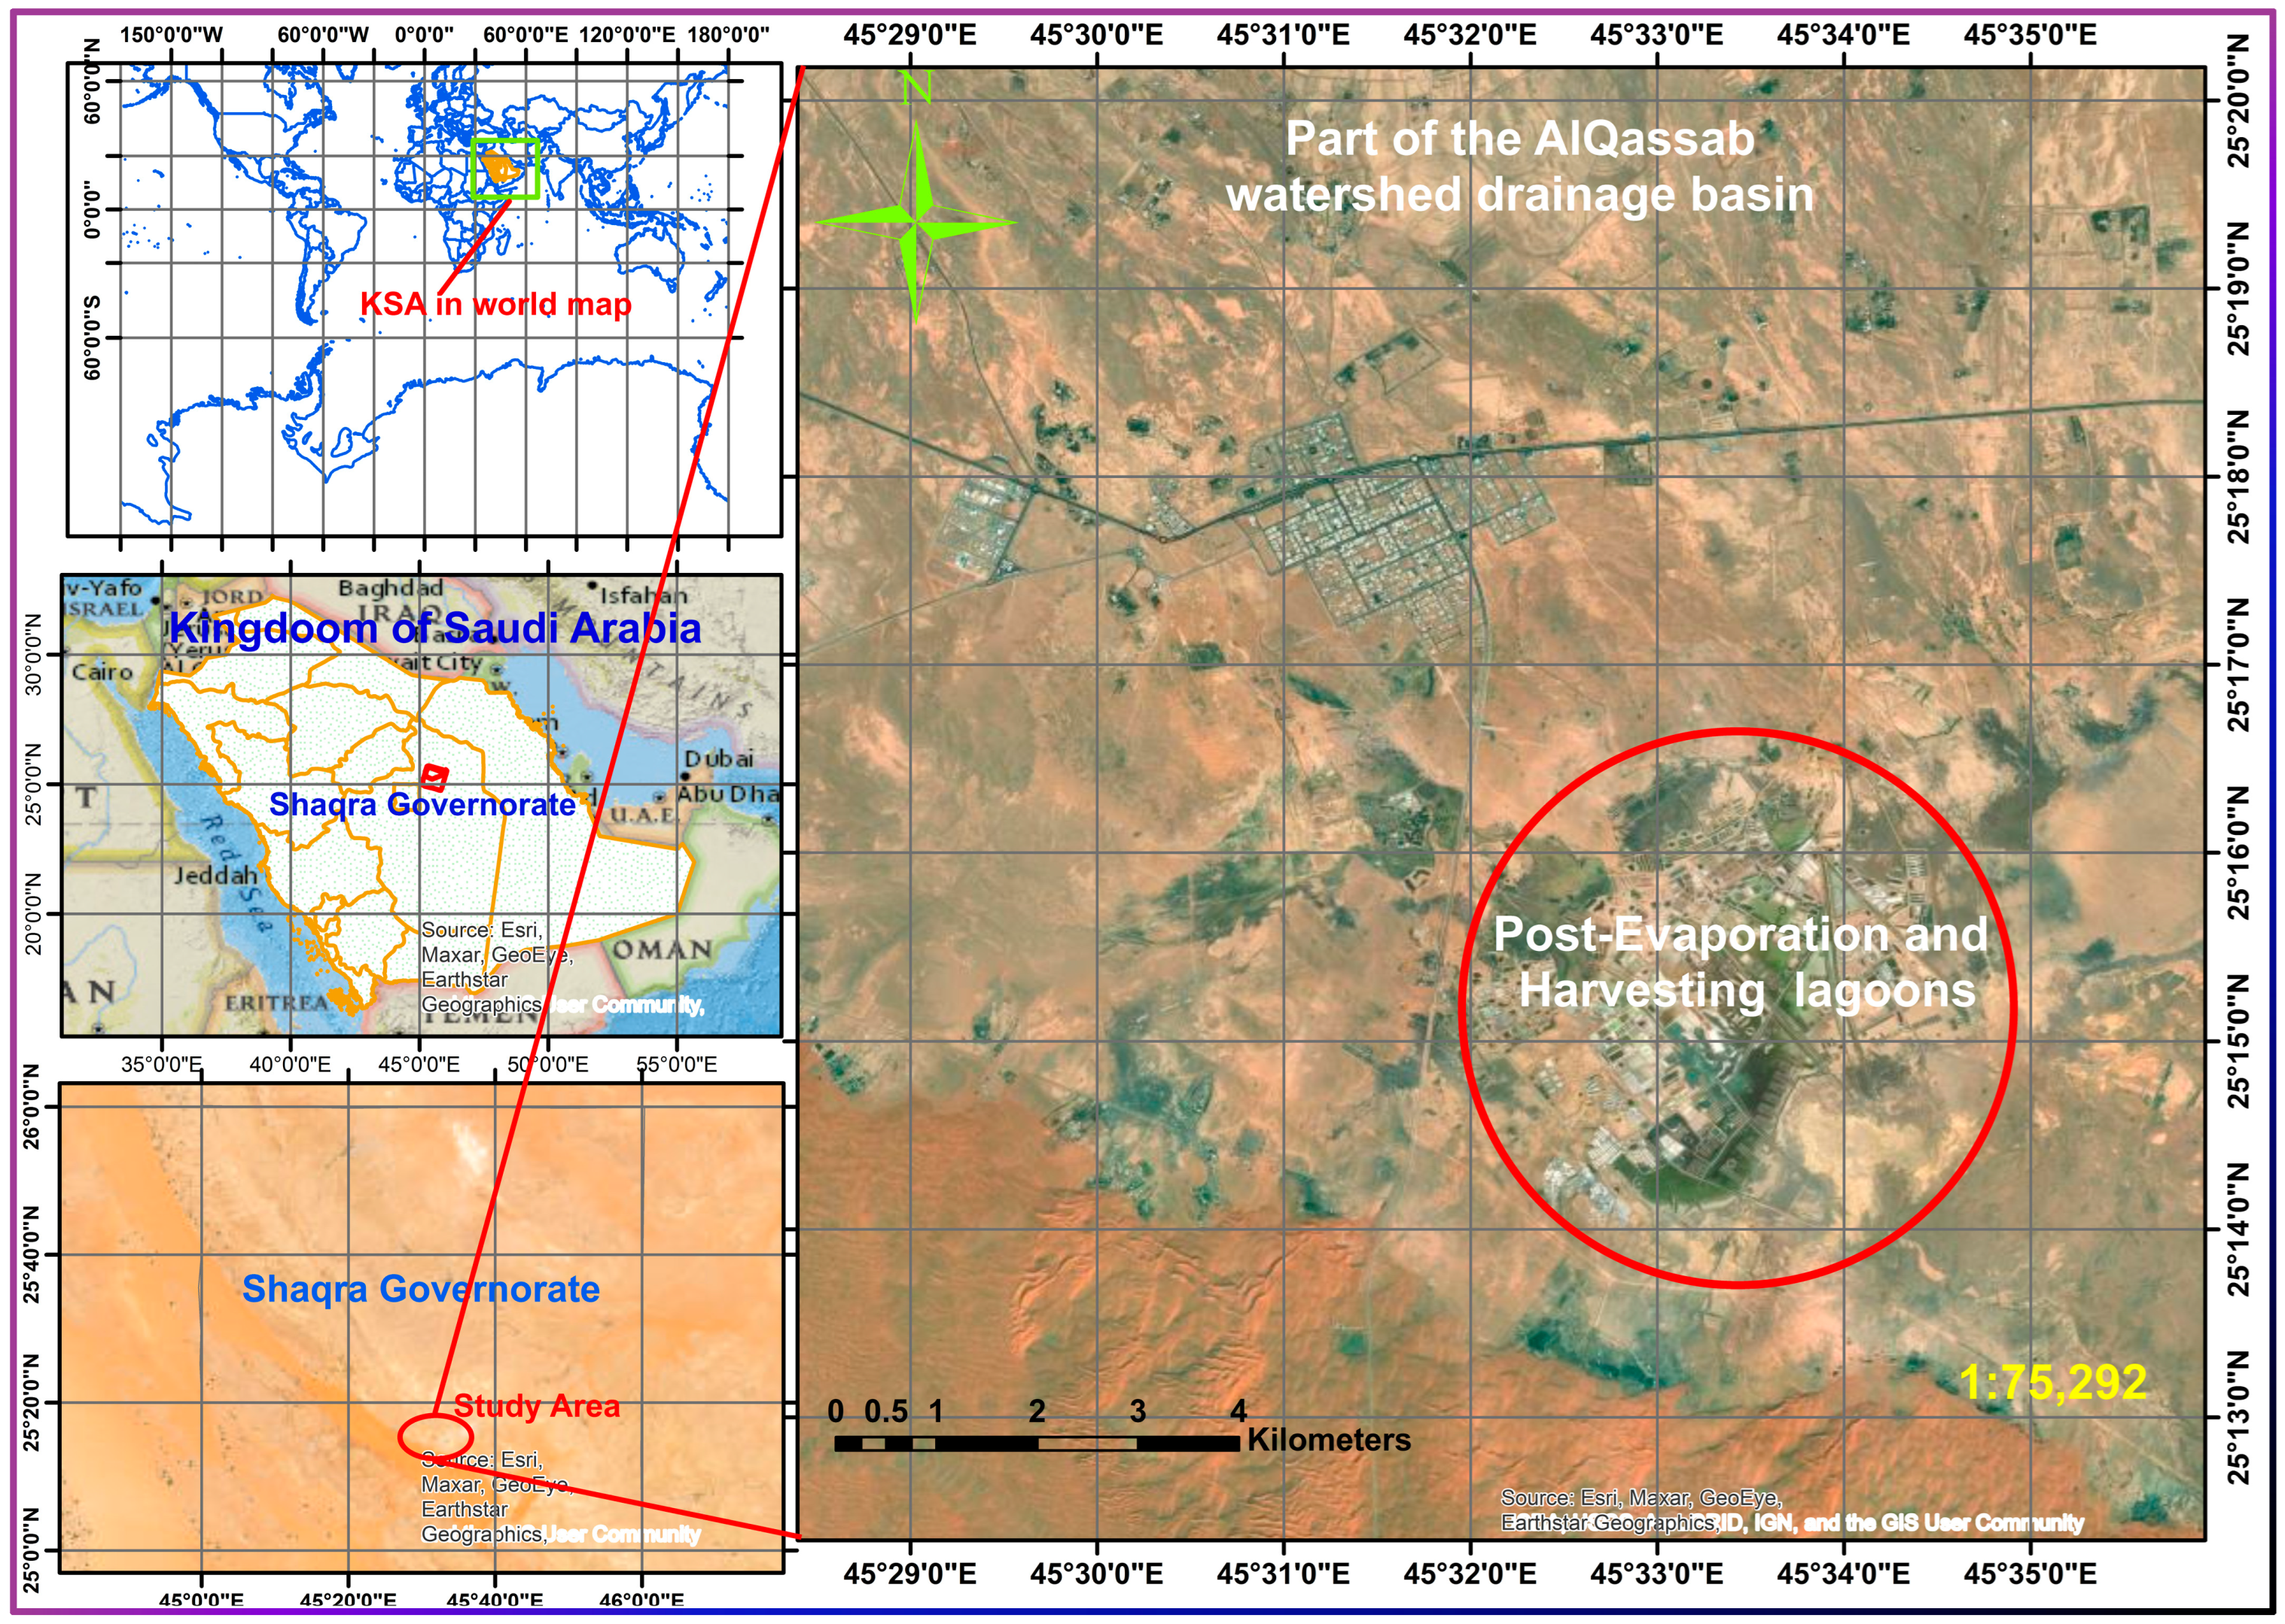
- The SRTM-DEM information indicates that the Al-Qasab watershed is a nonmarine closed basin with a drainage watershed area of 1290 km2, which is considerably large enough to secure a long-term supply of salts, as confirmed through its continuous operation from the Chrestician seventh century until now. The slope and relative elevation parameters control recharge to the Playa watershed with the harvesting solar evaporation ponds being ≈30 km2 in area.
- The linear regression coefficients for EC or TDS for the pond with the source well water (considered pond 1) was 0.696. The concentration changes at ponds 2 and 3 were mild, which may be ascribed to the precipitation of some constituents reaching their solubility limits and the negative effect of concentration on the vaporization tendency according to Raoult’s law.
- The relationship of EC and TDS with the pond number followed a polynomial regression (i.e., the extent of evaporation) with R2 values of 0.9491 and 0.946, respectively, indicating the significant impact of evaporation on the source well water.
- The Chadha plot reveals a perfect fit of the linear regression, with an R2 value of 0.9947 including the rainwater, source well water, and pond 1 and pond 2 samples, confirming the rainwater origin of the source water as they fit with pond 1 and pond 2, which were exposed to vigorous solar evaporation.
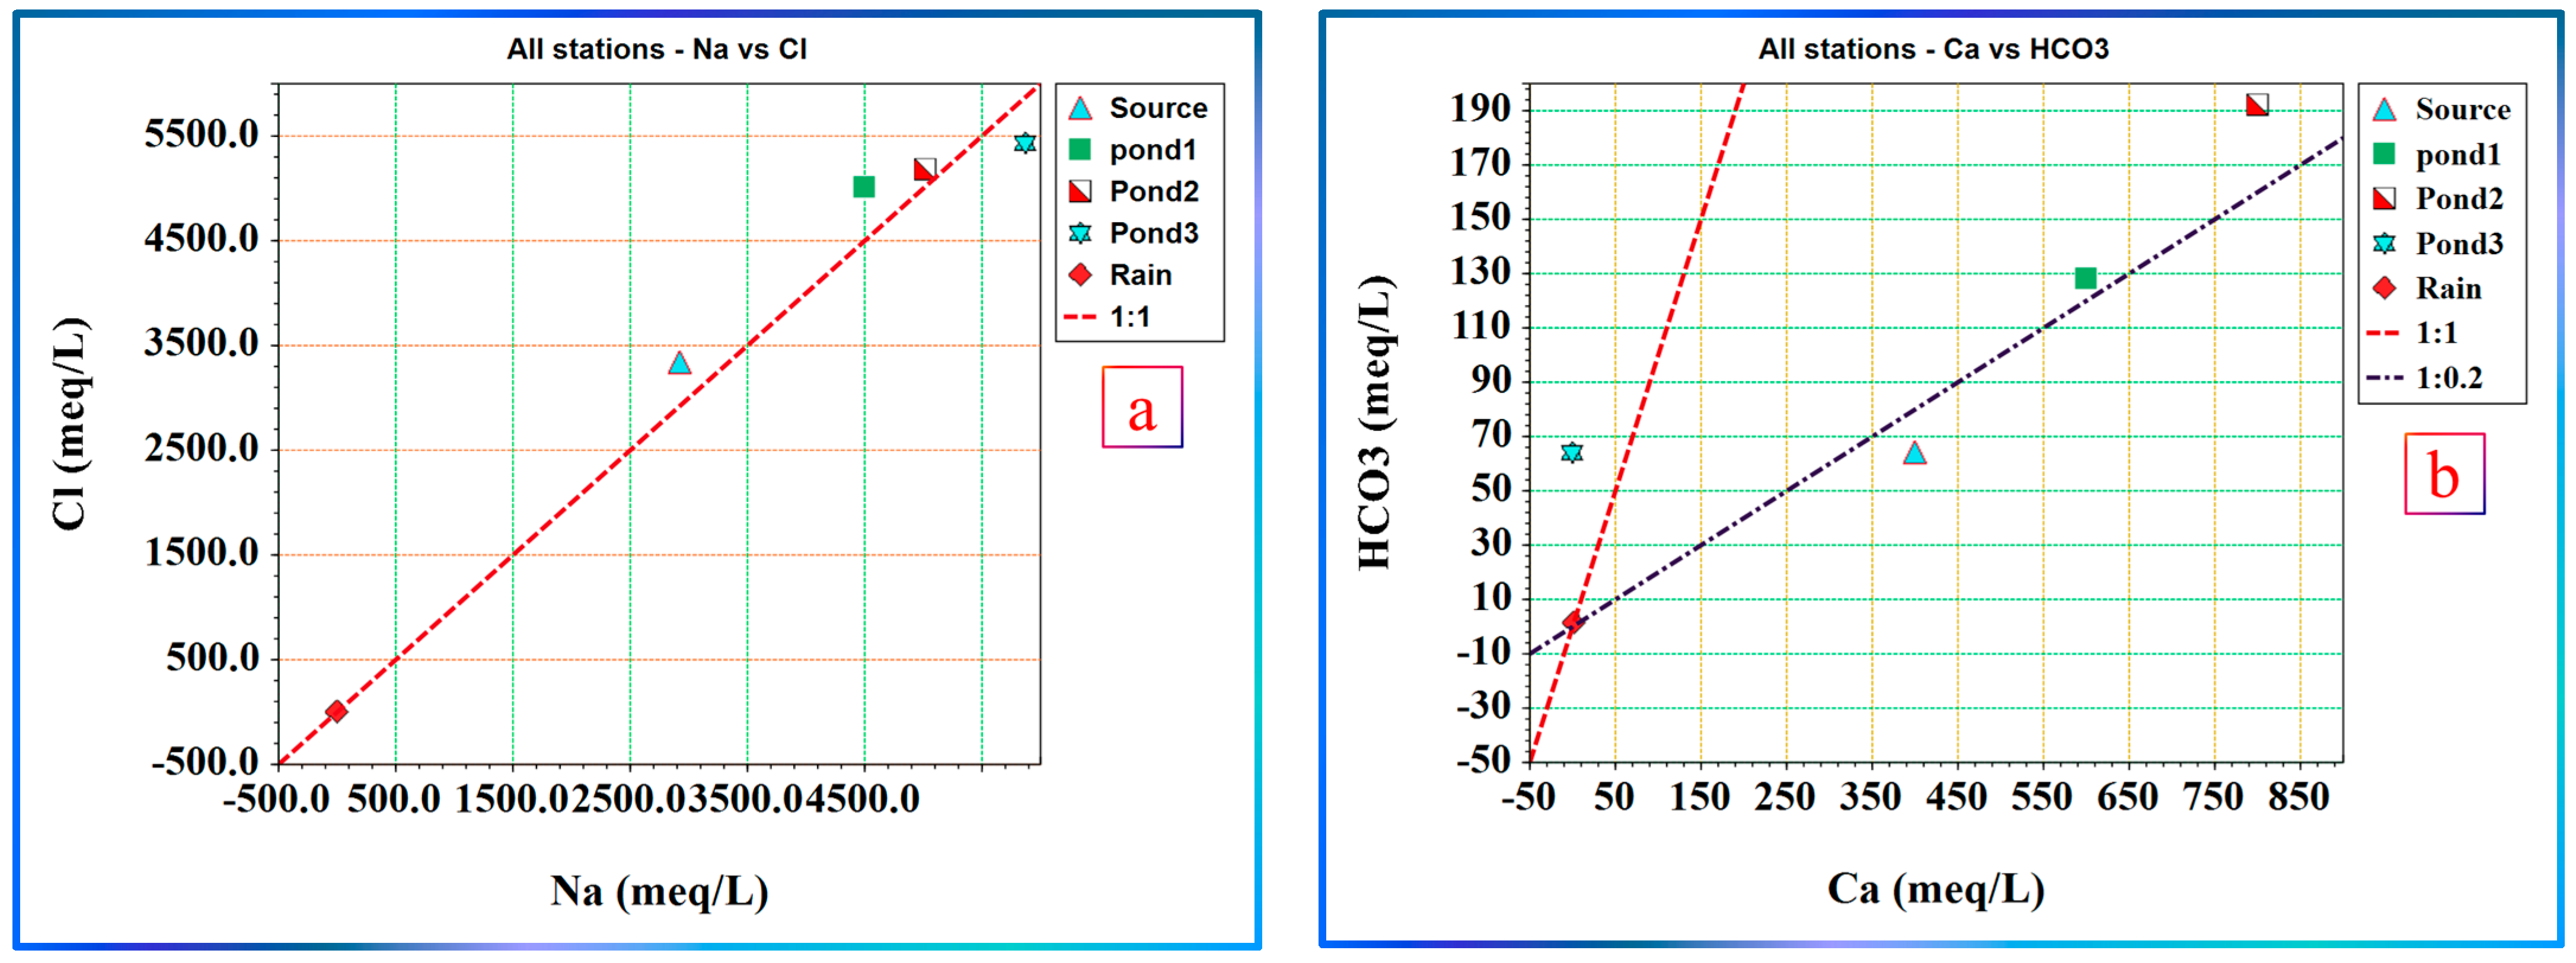
- The hardness-forming ions are primarily removed in pond 3, eliminating the need for costly and power-consuming steps of softening using ion exchange resins or nanofiltration as it can be used directly as a readily available feed for the chlor-alkali process for producing NaOH, Cl2, and H2 gases through electrolysis.
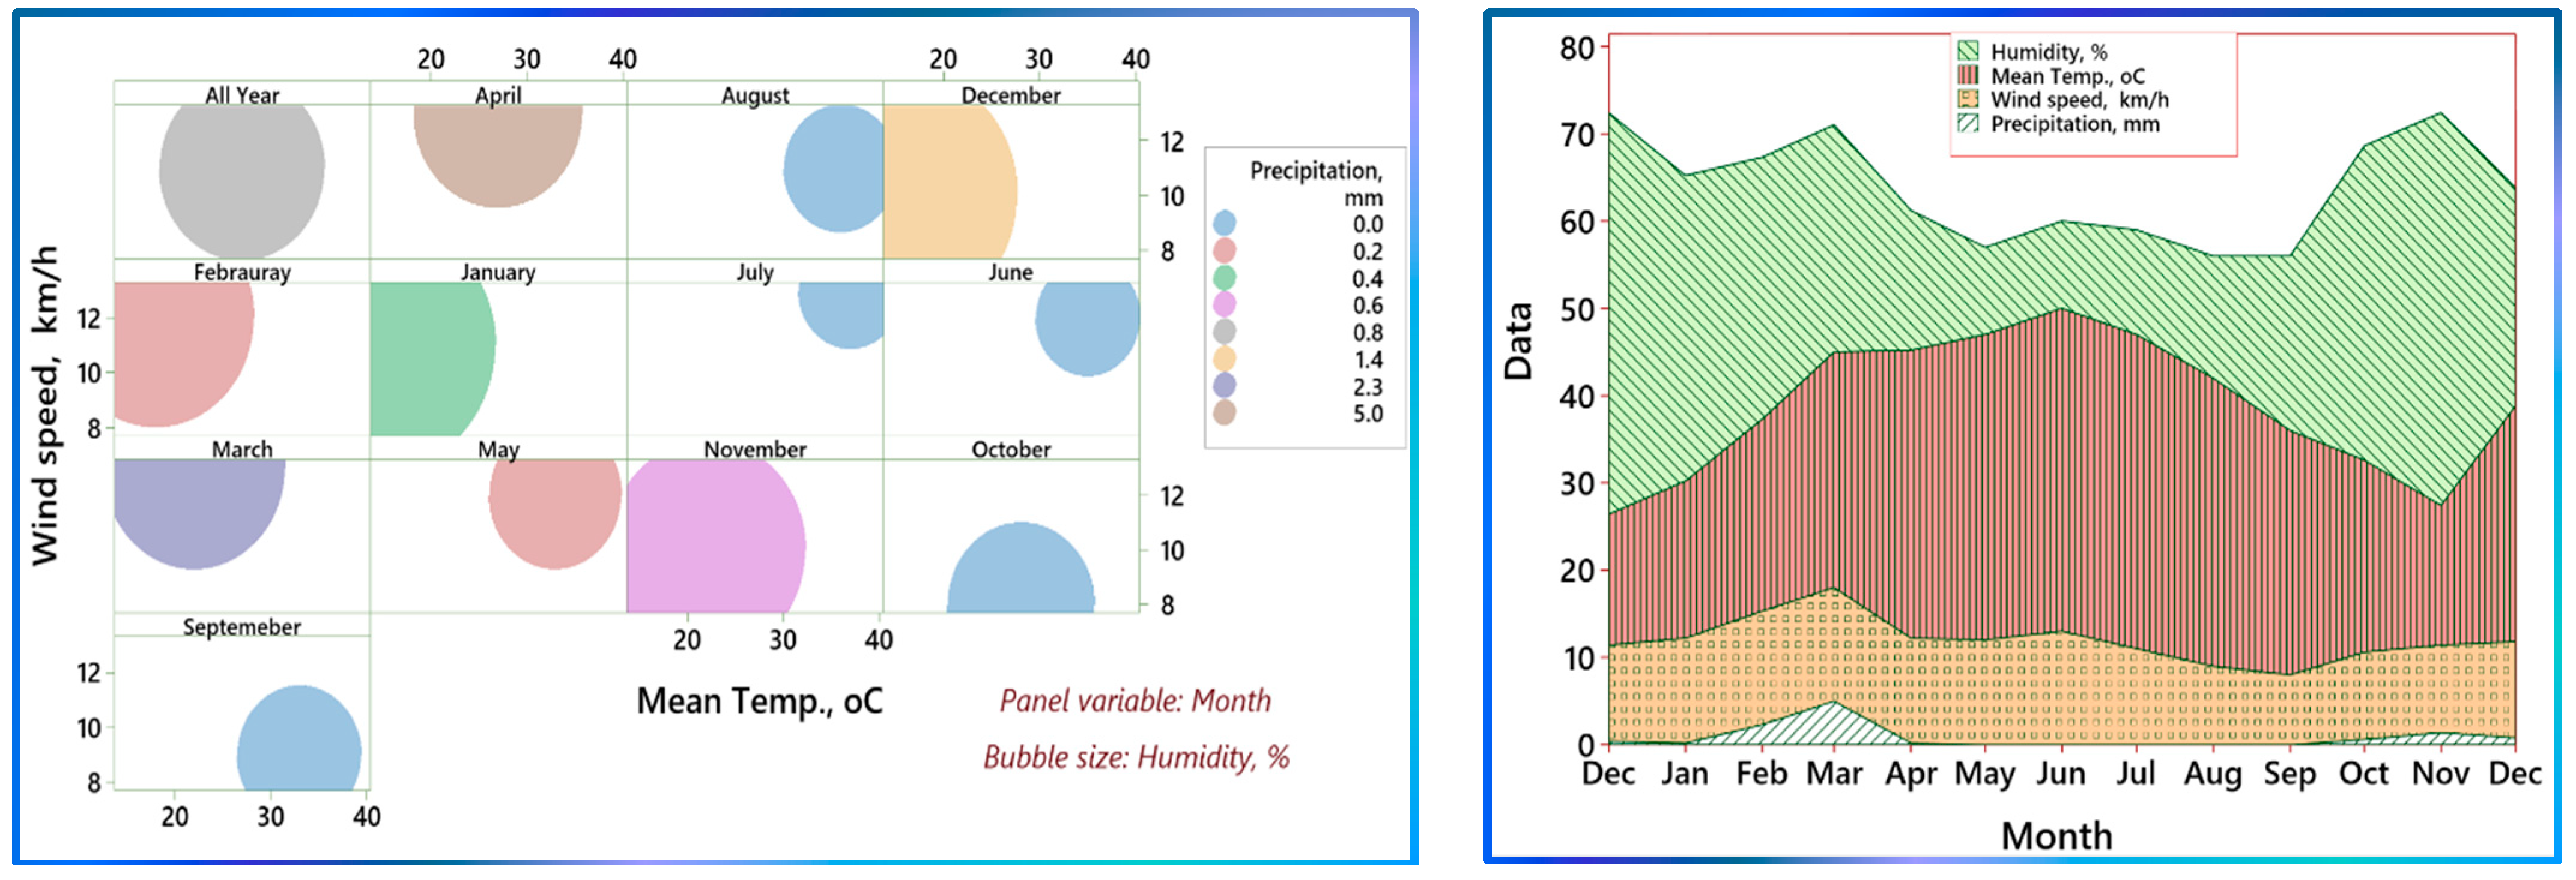
- The climatic conditions in the region are best from the evaporative concentration point of view, allowing the establishment of feasible evaporation rates in due time courses to plan an industrial process.
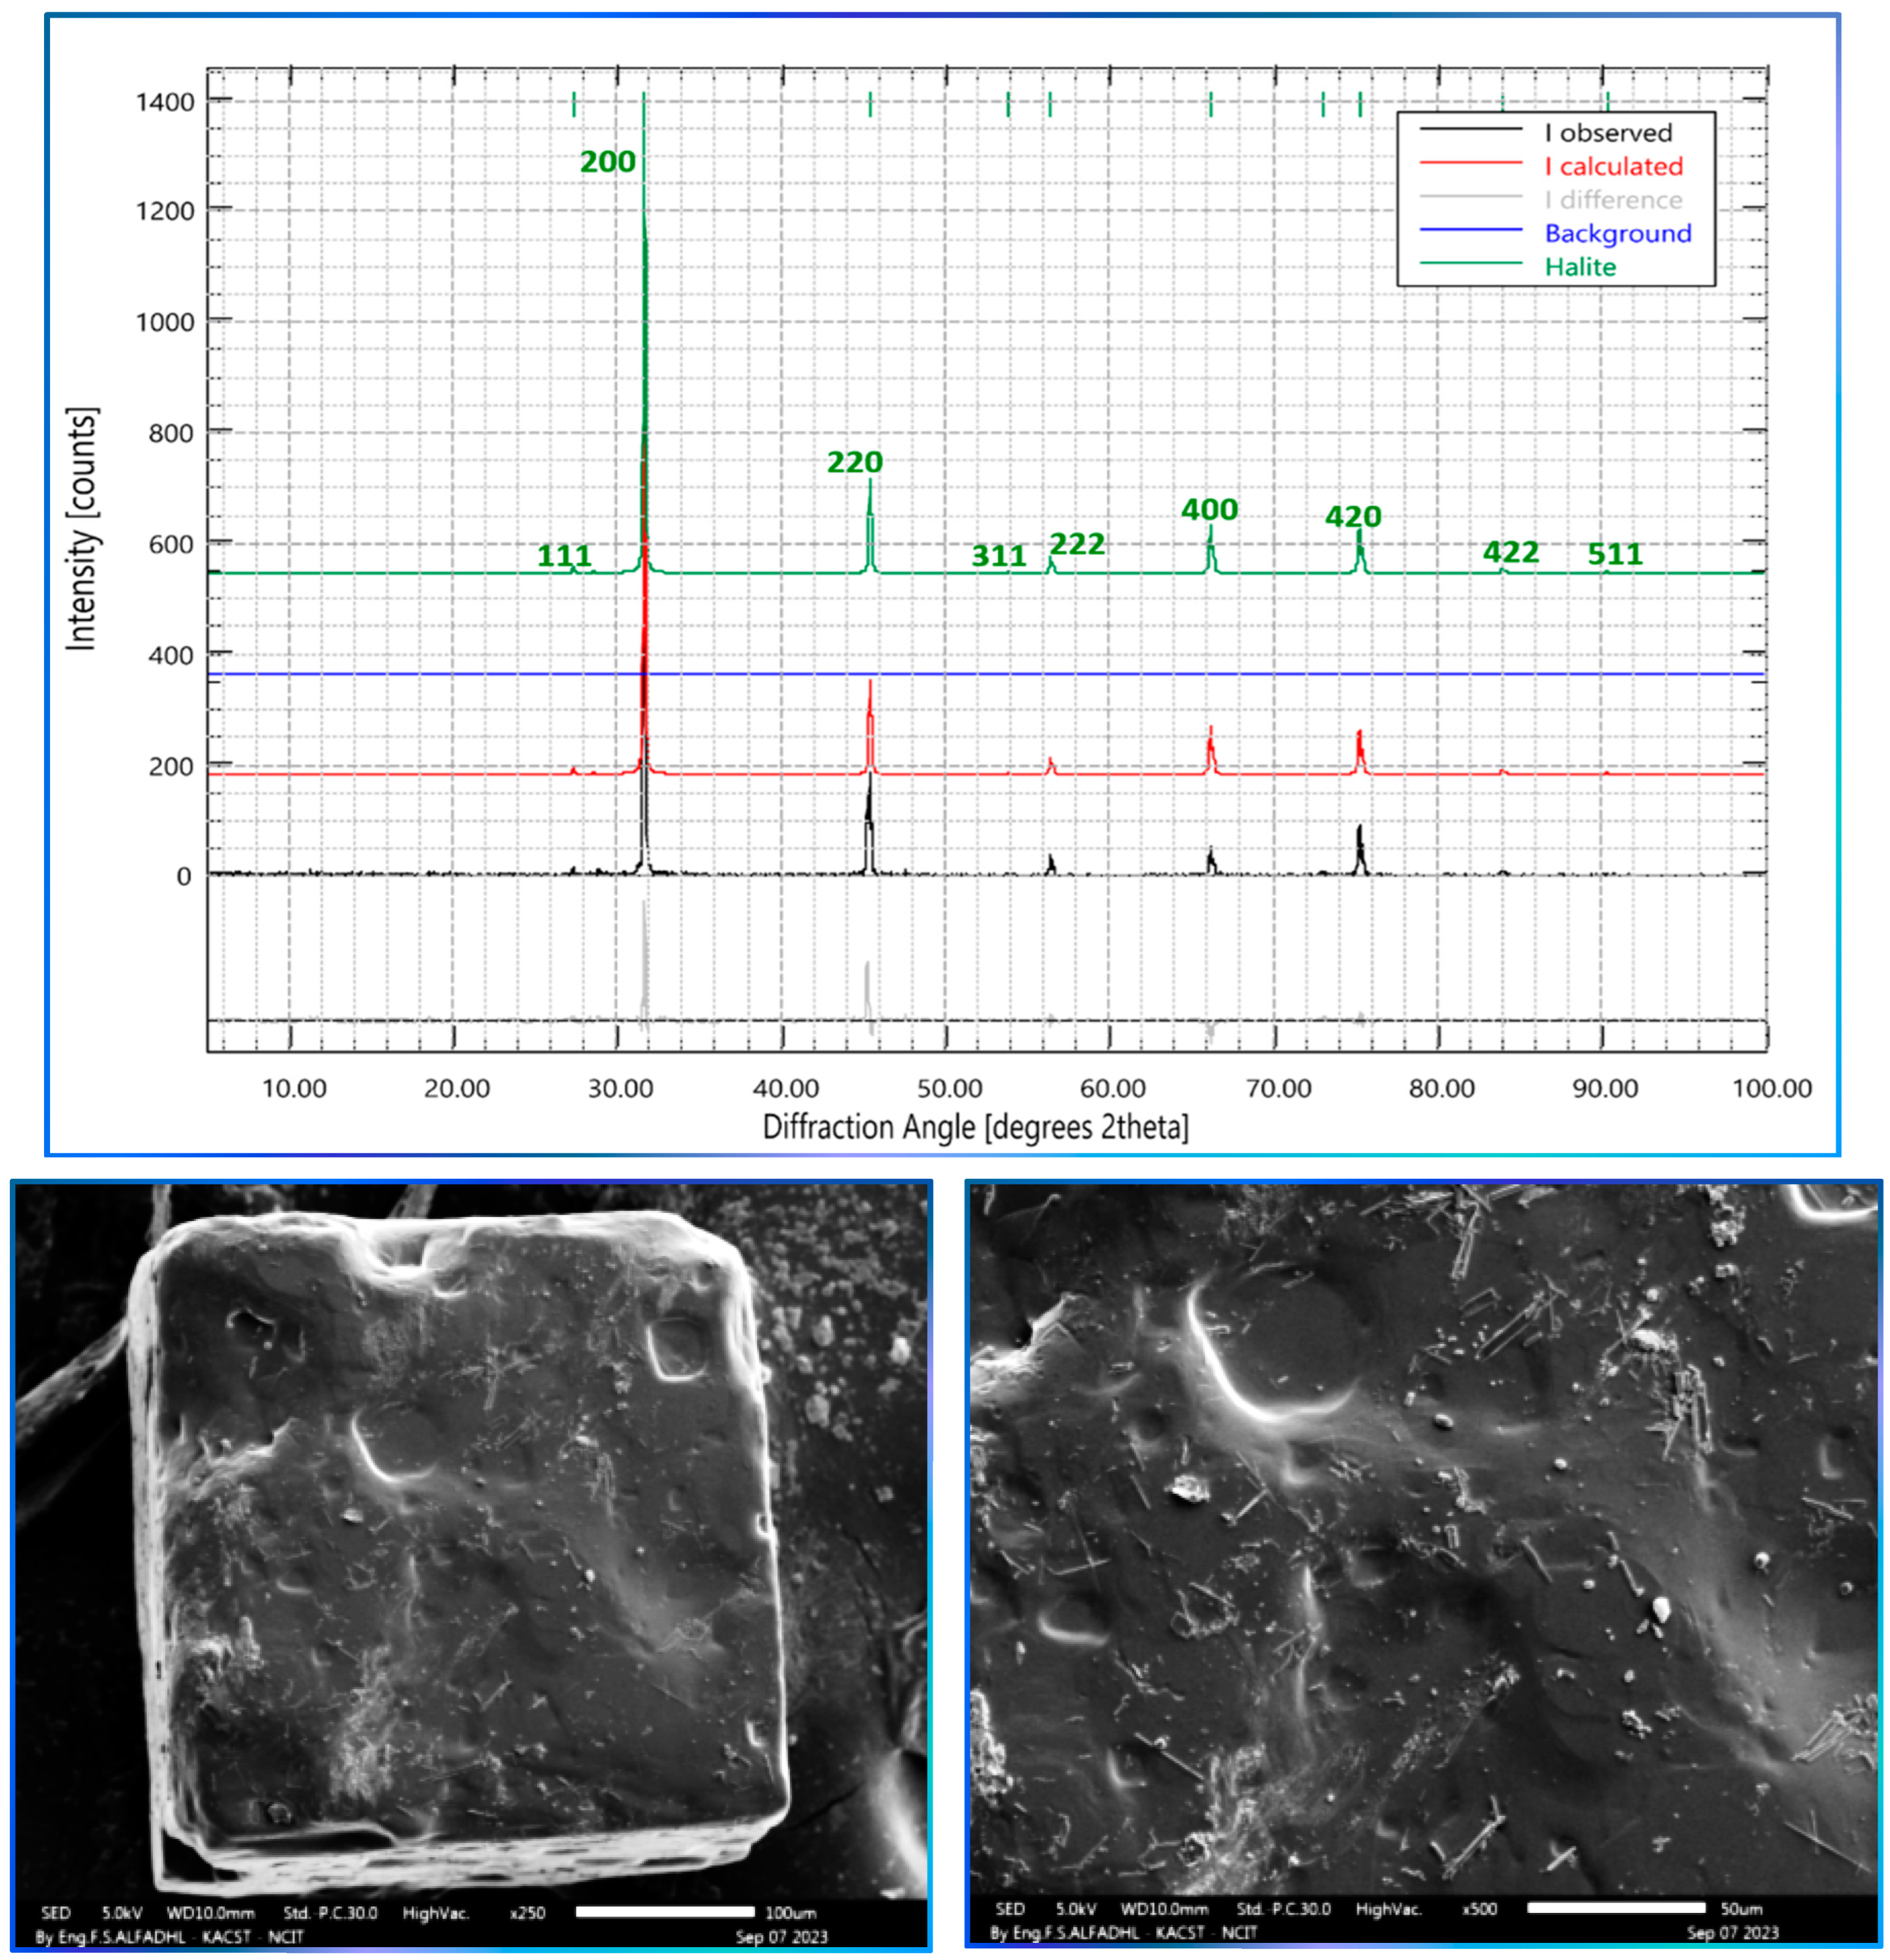
- The XRD spectra and the SEM-EDS of the harvested halite confirmed its purity with only one cubic phase of cubic halite with a unit cell of Cl4Na4 and a cell parameter (a) of 0.56423, providing pure salt.
- Pond 2 in the current operating folkloric pond design demonstrated the highest SIs, even for halite.
- An improved design of the current folkloric methodology has been proposed conceptually based on the SI calculated thermodynamically to provide a readily available feed intake for the chlor-alkali electrolysis process with or without minimal pretreatment.
Supplementary Materials
Author Contributions
Funding
Institutional Review Board Statement
Informed Consent Statement
Data Availability Statement
Conflicts of Interest
References
- Al-Harbi, O.; Hussain, G.; Khan, M. Sedimentology, Mineralogy and Geochemistry of Al-Awshaziyah Inland Sabkha, Central Saudi Arabia. Arid Land Res. Manag. 2006, 20, 117–132. [Google Scholar] [CrossRef]
- Al-Saafin, A.K. The Characterization of Sabkhas in the Eastern Parts of Saudi Arabia and Its Implications for Engineering. Ph.D. Thesis, Queen Mary University of London, London, UK, 1996; p. 316. [Google Scholar]
- Kolodny, Y. Hypersaline Ecosystems, The Gavish Sabkha; Springer: Berlin/Heidelberg, Germany, 1986; Volume 50, ISBN 9783642702921. [Google Scholar]
- AL-Amoudi, O.S.B.; Aiban, S.A.; Al-Abdul Wahhab, H.I. Variability and Characteristics of Eastern Saudi Sabkha Soils. In Proceedings of the International Conference on Soil Mechanics and Foundation Engineering, Hamburg, Germany, 6–12 September 1997; pp. 17–20. Available online: https://www.issmge.org/publications/publication/variability-and-characteristics-of-eastern-saudi-sabkha-soils (accessed on 7 February 2024).
- Chatterjee, B.C.; Sarma, N.; Sahu, P.P.; Oki, E. Literature Survey. Lect. Notes Electr. Eng. 2017, 410, 17–34. [Google Scholar] [CrossRef]
- Sabtan, A.A.; Shehata, W.M. Problematic Sabkha—A Potential Source of Fresh Water. Bull. Eng. Geol. Environ. 2002, 61, 153–159. [Google Scholar] [CrossRef]
- All, K.; Hossain, D. Geotechnical and Geochemical Characteristics of Obhor Sub-Soil. J. King Abdulaziz Univ. Sci. 1988, 1, 205–225. [Google Scholar] [CrossRef]
- Sabtan, A.A.; Shehata, W.M. Hydrogeology of Al-Lith Sabkha, Saudi Arabia. J. Asian Earth Sci. 2003, 21, 423–429. [Google Scholar] [CrossRef]
- Ye, C.; Mao, J.; Ren, Y.; Li, Y.; Lin, Y.; Power, I.M.; Luo, Y. Salt Crystallization Sequences of Nonmarine Brine and Their Application for the Formation of Potassium Deposits. Aquat. Geochem. 2018, 24, 209–229. [Google Scholar] [CrossRef]
- Taj, R.J.; Aref, M.A. Structural and Textural Characteristics of Surface Halite Crusts of a Supratidal, Ephemeral Halite Pan, South Jeddah, Red Sea Coast, Saudi Arabia. Facies 2015, 61, 2. [Google Scholar] [CrossRef]
- Attia, O.E.A. Sedimentological Characteristics and Geochemical Evolution of Nabq Sabkha, Gulf of Aqaba, Sinai, Egypt. Arab. J. Geosci. 2013, 6, 2045–2059. [Google Scholar] [CrossRef]
- Manning, C.E.; Aranovich, L.Y. Brines at High Pressure and Temperature: Thermodynamic, Petrologic and Geochemical Effects. Precambrian Res. 2014, 253, 6–16. [Google Scholar] [CrossRef]
- Akili, W. Scholars’ Mine Foundations over Salt-Encrusted Flats (Sabkha): Profiles, Properties, and Design Guidelines; IFCEE: Dallas, TX, USA, 2004; pp. 1–9. [Google Scholar]
- Hussain, M.; Al-Shaibani, A.; Al-Ramadan, K.; Wood, W.W. Geochemistry and Isotopic Analysis of Brines in the Coastal Sabkhas, Eastern Region, Kingdom of Saudi Arabia. J. Arid Environ. 2020, 178, 104142. [Google Scholar] [CrossRef]
- Saeed, W.; Shouakar-Stash, O.; Unger, A.; Wood, W.W.; Parker, B. Chemical Evolution of an Inland Sabkha: A Case Study from Sabkha Matti, Saudi Arabia. Hydrogeol. J. 2021, 29, 1939–1951. [Google Scholar] [CrossRef]
- Hidayatulloh, A.; Chaabani, A.; Zhang, L.; Elhag, M. DEM Study on Hydrological Response in Makkah City, Saudi Arabia. Sustainability 2022, 14, 13369. [Google Scholar] [CrossRef]
- Rahman, M.M.; Arya, D.S.; Goel, N.K. Limitation of 90 m SRTM DEM in Drainage Network Delineation Using D8 Method-a Case Study in Flat Terrain of Bangladesh. Appl. Geomat. 2010, 2, 49–58. [Google Scholar] [CrossRef]
- Available online: https://Earthexplorer.Usgs.Gov (accessed on 7 February 2024).
- Quevauviller, P.; Thompson, K.C. Analytical Methods for Drinking Water; John Wiley & Sons: Hoboken, NJ, USA, 2005; ISBN 9780470094938. [Google Scholar]
- DPIR Methodology for the Sampling of Surface Water. North. Territ. Gov. 1998, 11, 1–11.
- UGSS. National Field Manual for the Collection of Water-Quality Data. U.S. Geological Survey Techniques of Water-Resources Investigations, Book 9; UGSS: Reston, VA, USA, 2015. [Google Scholar]
- APHA. Standard Methods: For the Examination of Water and Waste Water, 23rd ed.; Rodger, B., Andrew, E., Rice, E., Eds.; American Public Health Association: Washington, DC, USA, 2017. [Google Scholar]
- Middleton, K.R. A New Procedure for Rapid Determination of Nitrate and a Study of the Preparation of the Phenol-Sulphonic Acid Reagent. J. Appl. Chem. 1958, 8, 505–509. [Google Scholar] [CrossRef]
- Gomaa, H.E.; Alotibi, A.A.; Charni, M.; Gomaa, F.A. Integrating GIS, Statistical, Hydrogeochemical Modeling and Graphical Approaches for Hydrogeochemical Evaluation of Ad-Dawadmi Ground Water, Saudi Arabia: Status and Implications of Evaporation and Rock–Water Interactions. Sustainability 2023, 15, 4863. [Google Scholar] [CrossRef]
- Abdelkader, M.M.; Al-amoud, A.I.; El, M.; El-feky, A. Remote Sensing Applications: Society and Environment Assessment of Flash Flood Hazard Based on Morphometric Aspects and Rainfall-Runoff Modeling in Wadi Nisah, Central Saudi Arabia. Remote Sens. Appl. Soc. Environ. 2021, 23, 100562. [Google Scholar]
- Raja Shekar, P.; Mathew, A. Morphometric Analysis of Watersheds: A Comprehensive Review of Data Sources, Quality, and Geospatial Techniques. Watershed Ecol. Environ. 2024, 6, 13–25. [Google Scholar] [CrossRef]
- Bogale, A. Morphometric Analysis of a Drainage Basin Using Geographical Information System in Gilgel Abay Watershed, Lake Tana Basin, Upper Blue Nile Basin, Ethiopia. Appl. Water Sci. 2021, 11, 122. [Google Scholar] [CrossRef]
- Sukristiyanti, S.; Maria, R.; Lestiana, H. Watershed-Based Morphometric Analysis: A Review. IOP Conf. Ser. Earth Environ. Sci. 2018, 118, 012028. [Google Scholar] [CrossRef]
- Chadha, D.K. A Proposed New Diagram for Geochemical Classification of Natural Waters and Interpretation of Chemical Data. Hydrogeol. J. 1999, 7, 431–439. [Google Scholar] [CrossRef]
- Piper, A.M. A Graphic Procedure in the Geochemical Interpretation of Water-Analyses. Transcation, Am. Geophys. Union 1944, 25, 914–928. [Google Scholar]
- Alabdula’aly, A.I.; Khan, M.A. Chemistry of Rain Water in Riyadh, Saudi Arabia. Arch. Environ. Contam. Toxicol. 2000, 39, 66–73. [Google Scholar] [CrossRef] [PubMed]
- Lorenz, D. Piper Plot and Stiff Diagram Examples. 2016; pp. 1–9. Available online: https://pubs.usgs.gov/of/2016/1188/downloads/ofr20161188_appendix8.pdf (accessed on 15 January 2024).
- Güler, C.; Thyne, G.D.; Mccray, J.E.; Turner, A.K. Evaluation of Graphical and Multivariate Statistical Methods for Classification of Water Chemistry Data. Hydrogeol. J. 2002, 10, 455–474. [Google Scholar] [CrossRef]
- Adimalla, N.; Kumar, S.; Peiyue, V. Evaluation of Groundwater Quality, Peddavagu in Central Telangana (PCT), South India: An Insight of Controlling Factors of Fluoride Enrichment. Model. Earth Syst. Environ. 2018, 4, 841–852. [Google Scholar] [CrossRef]
- AlSuhaimi, A.O.; AlMohaimidi, K.M.; Momani, K.A. Preliminary Assessment for Physicochemical Quality Parameters of Groundwater in Oqdus Area, Saudi Arabia. J. Saudi Soc. Agric. Sci. 2019, 18, 22–31. [Google Scholar] [CrossRef]
- Chidambaram, S.; Anandhan, P.; Prasanna, M. V Major Ion Chemistry and Identification of Hydrogeochemical Processes Controlling Groundwater in and around Neyveli Lignite Mines, Tamil Nadu, South India. Arab. J. Geosci. 2012, 6, 3451–3467. [Google Scholar] [CrossRef]
- Feth, J.H.; Gibbs, R.J. Mechanisms Controlling World Water Chemistry: Evaporation-Crystallization Process. Am. Assoc. Adv. Sci. Stable 1971, 172, 870–872. [Google Scholar] [CrossRef]
- Bouwer, H. Irrigation and Global Water Outlook. Natl. Conf. Publ. Inst. Eng. Aust. 1994, 2, 221–231. [Google Scholar] [CrossRef]
- Thiel, G.P.; Kumar, A.; Gómez-González, A.; Lienhard, J.H. Utilization of Desalination Brine for Sodium Hydroxide Production: Technologies, Engineering Principles, Recovery Limits, and Future Directions. ACS Sustain. Chem. Eng. 2017, 5, 11147–11162. [Google Scholar] [CrossRef]
- Kumar, A.; Phillips, K.R.; Thiel, G.P.; Schröder, U.; Lienhard, J.H. Direct Electrosynthesis of Sodium Hydroxide and Hydrochloric Acid from Brine Streams. Nat. Catal. 2019, 2, 106–113. [Google Scholar] [CrossRef]
- Hine, F.; O’Brien, T.F.; Bommaraju, T.V. Handbook of Chlor-Alkali Technology, Volume I: Fundamentals; Springer: Berlin/Heidelberg, Germany, 2005; ISBN 2381970770. [Google Scholar]
- USGS PhreeqC. Available online: https://www.usgs.gov/software/phreeqc-version-3 (accessed on 22 February 2024).
- Climate & Weather Averages in Riyadh, Saudi Arabia. Available online: https://www.timeanddate.com/weather/saudi-arabia/riyadh/climate (accessed on 15 January 2024).


| Variable | Mean | SE Mean | StDev | Minimum | Q1 | Median | Q3 | Maximum | Range | IQR | Skewness | Kurtosis | Anderson–Darling Normality Test | |
|---|---|---|---|---|---|---|---|---|---|---|---|---|---|---|
| p-Value | Decision | |||||||||||||
| Na (ppm) | 105,303 | 14,250 | 28,500 | 67,260 | 76,320 | 109,460 | 130,130 | 135,033 | 67,773 | 53,810 | −0.80 | 1.08 | 0.64 | Fail to Rej. H0 |
| Na (epm) | 4578 | 620 | 1239 | 2924 | 3318 | 4759 | 5658 | 5871 | 2947 | 2340 | −0.80 | 1.08 | 0.64 | Fail to Rej. H0 |
| K (ppm) | 4718 | 699 | 1398 | 3100 | 3325 | 4941 | 5888 | 5890 | 2790 | 2563 | −0.35 | −4.03 | 0.212 | Fail to Rej. H0 |
| K (epm) | 121.0 | 17.9 | 35.8 | 79.5 | 85.3 | 126.7 | 151.0 | 151.0 | 71.5 | 65.7 | −0.35 | −4.03 | 0.212 | Fail to Rej. H0 |
| Ca (ppm) | 9023 | 3424 | 6848 | 1 | 2006 | 10,025 | 15,038 | 16,040 | 16,039 | 13,032 | −0.75 | 0.34 | 0.705 | Fail to Rej. H0 |
| Caepm | 451 | 171 | 342 | 0 | 100 | 501 | 752 | 802 | 802 | 652 | −0.75 | 0.34 | 0.705 | Fail to Rej. H0 |
| Mg (ppm) | 2433 | 993 | 1986 | 1 | 609 | 2433 | 4258 | 4866 | 4865 | 3649 | 0.00 | 1.50 | 0.41 | Fail to Rej. H0 |
| Mgepm | 202.8 | 82.8 | 165.5 | 0.1 | 50.8 | 202.8 | 354.8 | 405.5 | 405.4 | 304.1 | 0.00 | 1.50 | 0.41 | Fail to Rej. H0 |
| TC (ppm) | 121,477 | 13,904 | 27,808 | 80,813 | 92,181 | 132,661 | 139,590 | 139,775 | 58,962 | 47,409 | −1.72 | 2.90 | 0.081 | Fail to Rej. H0 |
| TC (epm) | 5352 | 592 | 1183 | 3607 | 4119 | 5815 | 6123 | 6173 | 2566 | 2004 | −1.81 | 3.34 | 0.075 | Fail to Rej. H0 |
| HCO3 (ppm) | 6833 | 1869 | 3738 | 3904 | 3904 | 5857 | 10,738 | 11,714 | 7810 | 6834 | 0.85 | −1.29 | 0.255 | Fail to Rej. H0 |
| HCO3 (epm) | 112.0 | 30.6 | 61.3 | 64.0 | 64.0 | 96.0 | 176.0 | 192.0 | 128.0 | 112.0 | 0.85 | −1.29 | 0.255 | Fail to Rej. H0 |
| Cl (ppm) | 167,941 | 16,865 | 33,730 | 118,198 | 133,024 | 180,527 | 190,271 | 192,510 | 74,312 | 57,248 | −1.80 | 3.38 | 0.079 | Fail to Rej. H0 |
| Cl (epm) | 4731 | 475 | 950 | 3330 | 3747 | 5085 | 5360 | 5423 | 2093 | 1613 | −1.80 | 3.38 | 0.079 | Fail to Rej. H0 |
| SO4 (ppm) | 10,719 | 4530 | 9061 | 1375 | 3219 | 9188 | 19,750 | 23,125 | 21,750 | 16,531 | 0.97 | 1.99 | 0.356 | Fail to Rej. H0 |
| SO4 (epm) | 111.7 | 47.2 | 94.4 | 14.3 | 33.5 | 95.7 | 205.7 | 240.9 | 226.6 | 172.2 | 0.97 | 1.99 | 0.356 | Fail to Rej. H0 |
| NO3 (ppm) | 6067 | 3799 | 7597 | 558 | 665 | 3414 | 14121 | 16,881 | 16,323 | 13,456 | 1.47 | 1.77 | 0.166 | Fail to Rej. H0 |
| NO3 (epm) | 97.8 | 61.3 | 122.5 | 9.0 | 10.7 | 55.1 | 227.8 | 272.3 | 263.3 | 217.0 | 1.47 | 1.77 | 0.166 | Fail to Rej. H0 |
| TA (ppm) | 191,559 | 21,670 | 43,341 | 129,318 | 145,643 | 207,572 | 221,462 | 221,774 | 92,456 | 75,819 | −1.55 | 2.13 | 0.13 | Fail to Rej. H0 |
| TA (epm) | 5164 | 567 | 1135 | 3516 | 3967 | 5577 | 5947 | 5985 | 2468 | 1980 | −1.65 | 2.63 | 0.13 | Fail to Rej. H0 |
| ICB | 1.765 | 0.735 | 1.471 | −0.090 | 0.249 | 2.040 | 3.006 | 3.071 | 3.161 | 2.757 | −0.66 | −2.09 | 0.424 | Fail to Rej. H0 |
| EC, microS/cm | 535,650 | 60,558 | 121,117 | 354,900 | 411,425 | 588,400 | 607,125 | 610,900 | 256,000 | 195,700 | −1.94 | 3.79 | 0.029 | Reject H0 |
| TDS (ppm) | 322,625 | 35,366 | 70,731 | 217,100 | 250,150 | 353,100 | 364,625 | 367,200 | 150,100 | 114,475 | −1.94 | 3.79 | 0.03 | Reject H0 |
| pH | 7.542 | 0.249 | 0.497 | 6.820 | 7.020 | 7.715 | 7.892 | 7.920 | 1.100 | 0.872 | −1.65 | 2.73 | 0.149 | Fail to Rej. H0 |
| Density(gm/cm3) | 1.255 | 0.0323 | 0.0645 | 1.160 | 11,875 | 128 | 1.2975 | 1.3 | 0.140 | 0.110 | −1.78 | 3.22 | 0.084 | Fail to Rej. H0 |
| DOCPPM | 128.7 | 56.8 | 113.7 | 0.0 | 19.0 | 128.6 | 238.6 | 257.7 | 257.7 | 219.6 | 0.0044 | −2.19 | 0.783 | Fail to Rej. H0 |
| Mineral Name | Chemical Formula | Saturation Index | Mineral Name | Chemical Formula | Saturation Index | ||||||
|---|---|---|---|---|---|---|---|---|---|---|---|
| Source Well | Pond 1 | Pond 2 | Pond 3 | Source Well | Pond 1 | Pond 2 | Pond 3 | ||||
| Anhydrite | CaSO4 | −0.09 | 0.94 | 1.05 | −1.93 | Kieserite | MgSO4·H2O | −4.27 | −3.11 | −3.54 | −5.56 |
| Aragonite | CaCO3 | 2.52 | 3.80 | 4.41 | 0.26 | Labile_S | Na4Ca(SO4)3·2H2O | −4.59 | −1.32 | −1.06 | −14.36 |
| Arcanite | K2SO4 | −4.58 | −3.43 | −3.47 | −2.95 | Leonhardite | MgSO4·4H2O | −4.23 | −3.21 | −3.65 | −5.43 |
| Artinite | Mg2CO3(OH)2·3H2O | −1.89 | 1.67 | 1.94 | −4.4 | Leonite | K2Mg(SO4)2·4H2O | −7.38 | −5.22 | −5.7 | −6.96 |
| Bischofite | MgCl2·6H2O | −5.18 | −4.3 | −3.17 | −7.58 | Magnesite | MgCO3 | 1.80 | 3.25 | 3.33 | 0.06 |
| Bloedite | Na2Mg(SO4)2·4H2O | −5.53 | −3.34 | −3.71 | −10.73 | Mirabilite | Na2SO4·10H2O | −2.87 | −2.16 | −2.12 | −6.57 |
| Brucite | Mg(OH)2 | −3.71 | −1.47 | −1.26 | −4.56 | Nahcolite | NaHCO3 | −0.58 | −0.31 | 0.1 | −3.21 |
| Calcite | CaCO3 | 2.76 | 4.04 | 4.65 | 0.5 | Natron | Na2CO3·10H2O | −3.79 | −2.83 | −2.33 | −7.91 |
| Carnallite | KMgCl3·6H2O | −6.21 | −4.79 | −5.14 | −8.42 | Nesquehonite | MgCO3·3H2O | −1.12 | 0.20 | 0.25 | −2.78 |
| Dolomite | CaMg(CO3)2 | 5.7 | 8.43 | 9.12 | 1.70 | Pentahydrite | MgSO4·5H2O | −3.89 | −2.92 | −3.37 | −5.07 |
| Epsomite | MgSO4:7H2O | −3.58 | −2.69 | −3.17 | −4.69 | Pirssonite | Na2Ca(CO3)2·2H2O | −0.73 | 1.86 | 3.04 | −7.35 |
| Gaylussite | CaNa2(CO3)2·5H2O | −0.73 | 1.73 | 2.88 | −7.26 | Polyhalite | K2MgCa2(SO4)4·2H2O | −6.72 | −2.41 | −2.65 | −10.03 |
| Glauberite | Na2Ca(SO4)2 | −1.79 | 0.40 | 0.6 | −7.63 | Portlandite | Ca(OH)2 | −8.93 | −6.86 | −6.12 | −10.29 |
| Goergeyite | K2Ca5(SO4)6·H2O | −0.67 | 5.57 | 6.09 | −8.20 | Schoenite | K2Mg(SO4)2·6H2O | −7.16 | −5.08 | −5.58 | −6.67 |
| Gypsum | CaSO4·2H2O | −0.09 | 0.84 | 0.94 | −1.87 | Sylvite | KCl | −2.01 | −1.46 | −1.43 | −1.82 |
| Halite | NaCl | −0.79 | −0.23 | −0.15 | −3.42 | Syngenite | K2Ca(SO4)2·H2O | −4.13 | −2.01 | −1.94 | −4.31 |
| Hexahydrite | MgSO4·6H2O | −3.61 | −2.68 | −3.15 | −4.76 | Thenardite | Na2SO4 | −2.36 | −1.20 | −1.12 | −6.36 |
| Huntite | CaMg3(CO3)4 | 8.47 | 14.11 | 14.96 | 0.98 | Trona | Na3H(CO3)2·2H2O | −4.05 | −2.46 | −1.69 | −11.04 |
| Kainite | KMgClSO4·3H2O | −5.78 | −4.17 | −4.59 | −6.83 | CO2(g) | CO2 | −0.43 | −1.26 | −1.41 | −1.29 |
| Kalicinite | KHCO3 | −3.12 | −2.87 | −2.71 | −2.94 | H2O(g) | H2O | −1.09 | −1.13 | −1.14 | −1.06 |
Disclaimer/Publisher’s Note: The statements, opinions and data contained in all publications are solely those of the individual author(s) and contributor(s) and not of MDPI and/or the editor(s). MDPI and/or the editor(s) disclaim responsibility for any injury to people or property resulting from any ideas, methods, instructions or products referred to in the content. |
© 2024 by the authors. Licensee MDPI, Basel, Switzerland. This article is an open access article distributed under the terms and conditions of the Creative Commons Attribution (CC BY) license (https://creativecommons.org/licenses/by/4.0/).
Share and Cite
Gomaa, H.E.; Gomaa, F.A.; Abdel Azeem, S.M.; Alotaibi, A.A. Sustainability Evaluation of the Al-Qasab Playa by Integrating Hydrogeochemical and Graphical, ArcGIS Watershed, and Thermodynamic Geochemical Modeling Approaches. Sustainability 2024, 16, 2118. https://doi.org/10.3390/su16052118
Gomaa HE, Gomaa FA, Abdel Azeem SM, Alotaibi AA. Sustainability Evaluation of the Al-Qasab Playa by Integrating Hydrogeochemical and Graphical, ArcGIS Watershed, and Thermodynamic Geochemical Modeling Approaches. Sustainability. 2024; 16(5):2118. https://doi.org/10.3390/su16052118
Chicago/Turabian StyleGomaa, Hassan E., Fatma A. Gomaa, Sami M. Abdel Azeem, and Abdullah A. Alotaibi. 2024. "Sustainability Evaluation of the Al-Qasab Playa by Integrating Hydrogeochemical and Graphical, ArcGIS Watershed, and Thermodynamic Geochemical Modeling Approaches" Sustainability 16, no. 5: 2118. https://doi.org/10.3390/su16052118
APA StyleGomaa, H. E., Gomaa, F. A., Abdel Azeem, S. M., & Alotaibi, A. A. (2024). Sustainability Evaluation of the Al-Qasab Playa by Integrating Hydrogeochemical and Graphical, ArcGIS Watershed, and Thermodynamic Geochemical Modeling Approaches. Sustainability, 16(5), 2118. https://doi.org/10.3390/su16052118