Article

Determination of the Shear Strength of Unsaturated Loess Samples from Conventional Triaxial Shear Tests Applying Rubber Membrane Correction

1
Department of Civil and Transportation Engineering, Henan University of Urban Construction, Pingdingshan 467036, China
2
Department of Civil Engineering, University of Ottawa, Ottawa, ON K1N 6N5, Canada
3
School of Earth Science and Engineering, Hohai University, Nanjing 211100, China
4
Northwest Institute of Eco-Environment and Resources, Chinese Academy of Sciences, Lanzhou 730000, China
*
Authors to whom correspondence should be addressed.
Sustainability 2024, 16(5), 2120; https://doi.org/10.3390/su16052120
Submission received: 15 January 2024 / Revised: 24 February 2024 / Accepted: 29 February 2024 / Published: 4 March 2024

Abstract

:
The shear strength parameters of loess samples are determined from conventional triaxial shear test results and used in the rational design of sustainable geotechnical infrastructures. However, the rubber membrane that is used in the triaxial shear apparatus for applying the all-around pressure to the test specimen has a significant influence on the measured shear strength parameters. In this paper, remolded and undisturbed unsaturated loess samples from northwest China are used in a comprehensive testing program to determine the shear strength from triaxial tests and understand the influence of a rubber membrane. The results show that the measured undrained cohesion from unconsolidated undrained triaxial tests on unsaturated soil specimens with and without a rubber membrane are significantly different. In this study, differences in the shear strength with and without a rubber membrane are assessed from shear strength index values that can be determined from undrained cohesion and the internal friction angle derived from conventional triaxial tests. Experimental results suggest that predominant changes arise mainly in the undrained cohesion values. The change rate of shear strength indices values of undisturbed loess shows a strong correlation with its water content; however, it is weak for remolded loess. The correlation coefficient between error and measured values of all shear strength indices is more than 0.8. Empirical correction relationships for triaxial shear tests with a rubber membrane for three different types of loess were established from the investigations. The simple approach used in this study can be used as a reference to apply corrections to the measured undrained cohesion values of unsaturated loess samples from northwest China.

1. Introduction

The cohesion and the angle of internal friction are the two key parameters required for reliable determination and interpretation of the shear strength of soils. Information about these two parameters is required in the rational design of a sustainable geotechnical infrastructure considering stability aspects [1,2,3]. Triaxial shear testing equipment is widely used for determining the conventional shear strength parameters for saturated soils [4,5]. In a triaxial test, the specimen used for testing is wrapped with a rubber membrane to separate it from water (oil), which facilitates applying boundary stresses and controlling the drainage conditions to determine the drained or undrained shear strength of saturated soils [6]. However, the rubber membrane introduces errors in the measured effective shear strength parameters (i.e., c′ and ϕ′) that are typically determined from consolidation drained (CD) and consolidated undrained test (CU) tests. The rubber membrane can likely become embedded into the pore space of the soil particles with the application of high confining pressure; due to this reason, the measured volume change of the specimen is typically greater than the real value [7]. The measured effective shear strength parameters from the CU tests can be influenced due to the rubber membrane that impacts the volume change behavior and introduces errors in the results (i.e., the effect of membrane compliance) [8]. Both CD and CU tests are performed on saturated soil specimens. Studies from the literature suggest that the rubber membrane contributes to a maximum of 85% volumetric measurement errors [9] and up to a 50% error in the shear strength [10]. Along similar lines, the total shear strength parameters (i.e., cu and ϕu = 0) that are determined from UU tests are also influenced. In addition, the influence of the type and the thickness of the rubber membrane can influence the triaxial test results [11,12].
There are four commonly used methods to address the errors associated with a rubber membrane in soil shear strength testing:
(i)
Change the force conditions: Filling the space between the rubber membrane and the specimen with the liquid rubber, copper, or other materials [12,13,14] to reduce the embedded volume. However, this technique also has an impact on the test results by reducing the actual influence of the axial force conditions of the specimen, triggering new errors;
(ii)
Instrumental compensation method: Water is replenished within the specimen [15,16,17] or between a special dual membrane [18] to compensate for the embedded volume of the rubber membrane. This method compensates for the localized drainage of the specimen due to the embedded rubber membrane and is believed to eliminate 100% of the effect [19];
(iii)
Optimization of measurement systems: Typically, water is continuously injected or withdrawn either by using manual techniques [20] or by using computerized control techniques [15,21,22] to compensate for the effect of membrane compliance. Copper rods of different diameters and the same height are placed in the specimen, and the embedded volume is estimated by the linear relationship between the change of total volume and diameter of copper rods [23]. The copper rod method has been subsequently improved by many scholars [24,25,26]. Various empirical calculations for determining the embedded volume have also been proposed [27,28];
(iv)
Analytical derivation method: Martin et al. [29] proposed a theoretical and computational method based on the generation and development of pore pressure. The analytical expression of the embedded volume has been derived by the elasto-mechanical method used in calibration and applied to correct the measured data. However, this technique is found to not be suitable for well-graded coarse-grained soil samples [6].
The different methods summarized are mainly derived from studies on saturated soils. Studies about the influence of a rubber membrane on the strength of loess deposits from the triaxial shear test are rather limited in the literature, which warrants further investigation. Loess deposits that are widely distributed throughout the world are typically in a state of unsaturated condition. These deposits are extensively found within China, particularly in the Xian, Shanxi, and Henan provinces [30,31,32,33]. The main characteristics of loess, which is regarded as a problematic soil, are wet subsidence and its associated structural problems with the performance of geotechnical infrastructures constructed with them or within them [34,35]. The accuracy of loess parameters is crucial for engineering stability analysis and disaster assessment [36,37] for assuring the sustainability of infrastructures designed in problematic loess deposits. The compressive strength and shear strength are recognized as fundamental mechanical properties by the geotechnical community [38]. According to the Mohr–Coulomb strength theory, which is widely used in civil engineering [39,40,41,42,43,44], the shear strength envelope of saturated samples from unconsolidated undrained tests (UU tests) theoretically should be horizontal (i.e., ϕu = 0). However, as discussed, the loess is typically in a state of unsaturated condition. Due to this, UU tests will be influenced due to suction; for this reason, the shear strength envelope may not be horizontal. In this study, UU tests were, however, performed on identical loess samples (remolded or undisturbed) with the same water content, applying different confining pressures quickly. The suction change associated with the application of confining pressure was ignored as samples were sheared quickly. In other words, rigorous interpretation of unsaturated soils in terms of two independent stress state variables, namely, net normal stress and suction, is not extended in this study. However, for quantifying the results, the shear strength index (i.e., the cohesion and the internal friction angle) is determined using the pq curve (i.e., modified shear strength envelope). As discussed earlier, UU test results with a rubber membrane contribute to errors in the determined shear strength index values. Therefore, in this study, a UU test (σ3 = 0) (which is a conventional unconfined compression, UC, test) is conducted without a rubber membrane. This test can provide a reliable shear strength index that can be used to correct the UU test with a rubber membrane. The focus of this paper is to (i) quantify the influence of a rubber membrane on the measured shear strength of undisturbed and remolded loess on unsaturated specimens; (ii) identify the influence mechanisms and factors of a rubber membrane on the measured loess shear strength by the UU test; (iii) propose correction relationships considering the influence of a rubber membrane on the shear strength of undisturbed and remolded loess, respectively; and (iv) extend a conventional approach for interpreting the total shear strength of unsaturated soils (i.e., loess deposits of northwest China).
The correction method that is proposed in this study can also be used for other types of soils, extending the approach described in this study. In other words, new relationships have to be developed by performing experimental studies. It is important to note that the proposed correction relationships are valid only for the loess samples used in this study (i.e., from northwest China).

2. Experiments and Methods

2.1. Soil Samples and Physical Properties
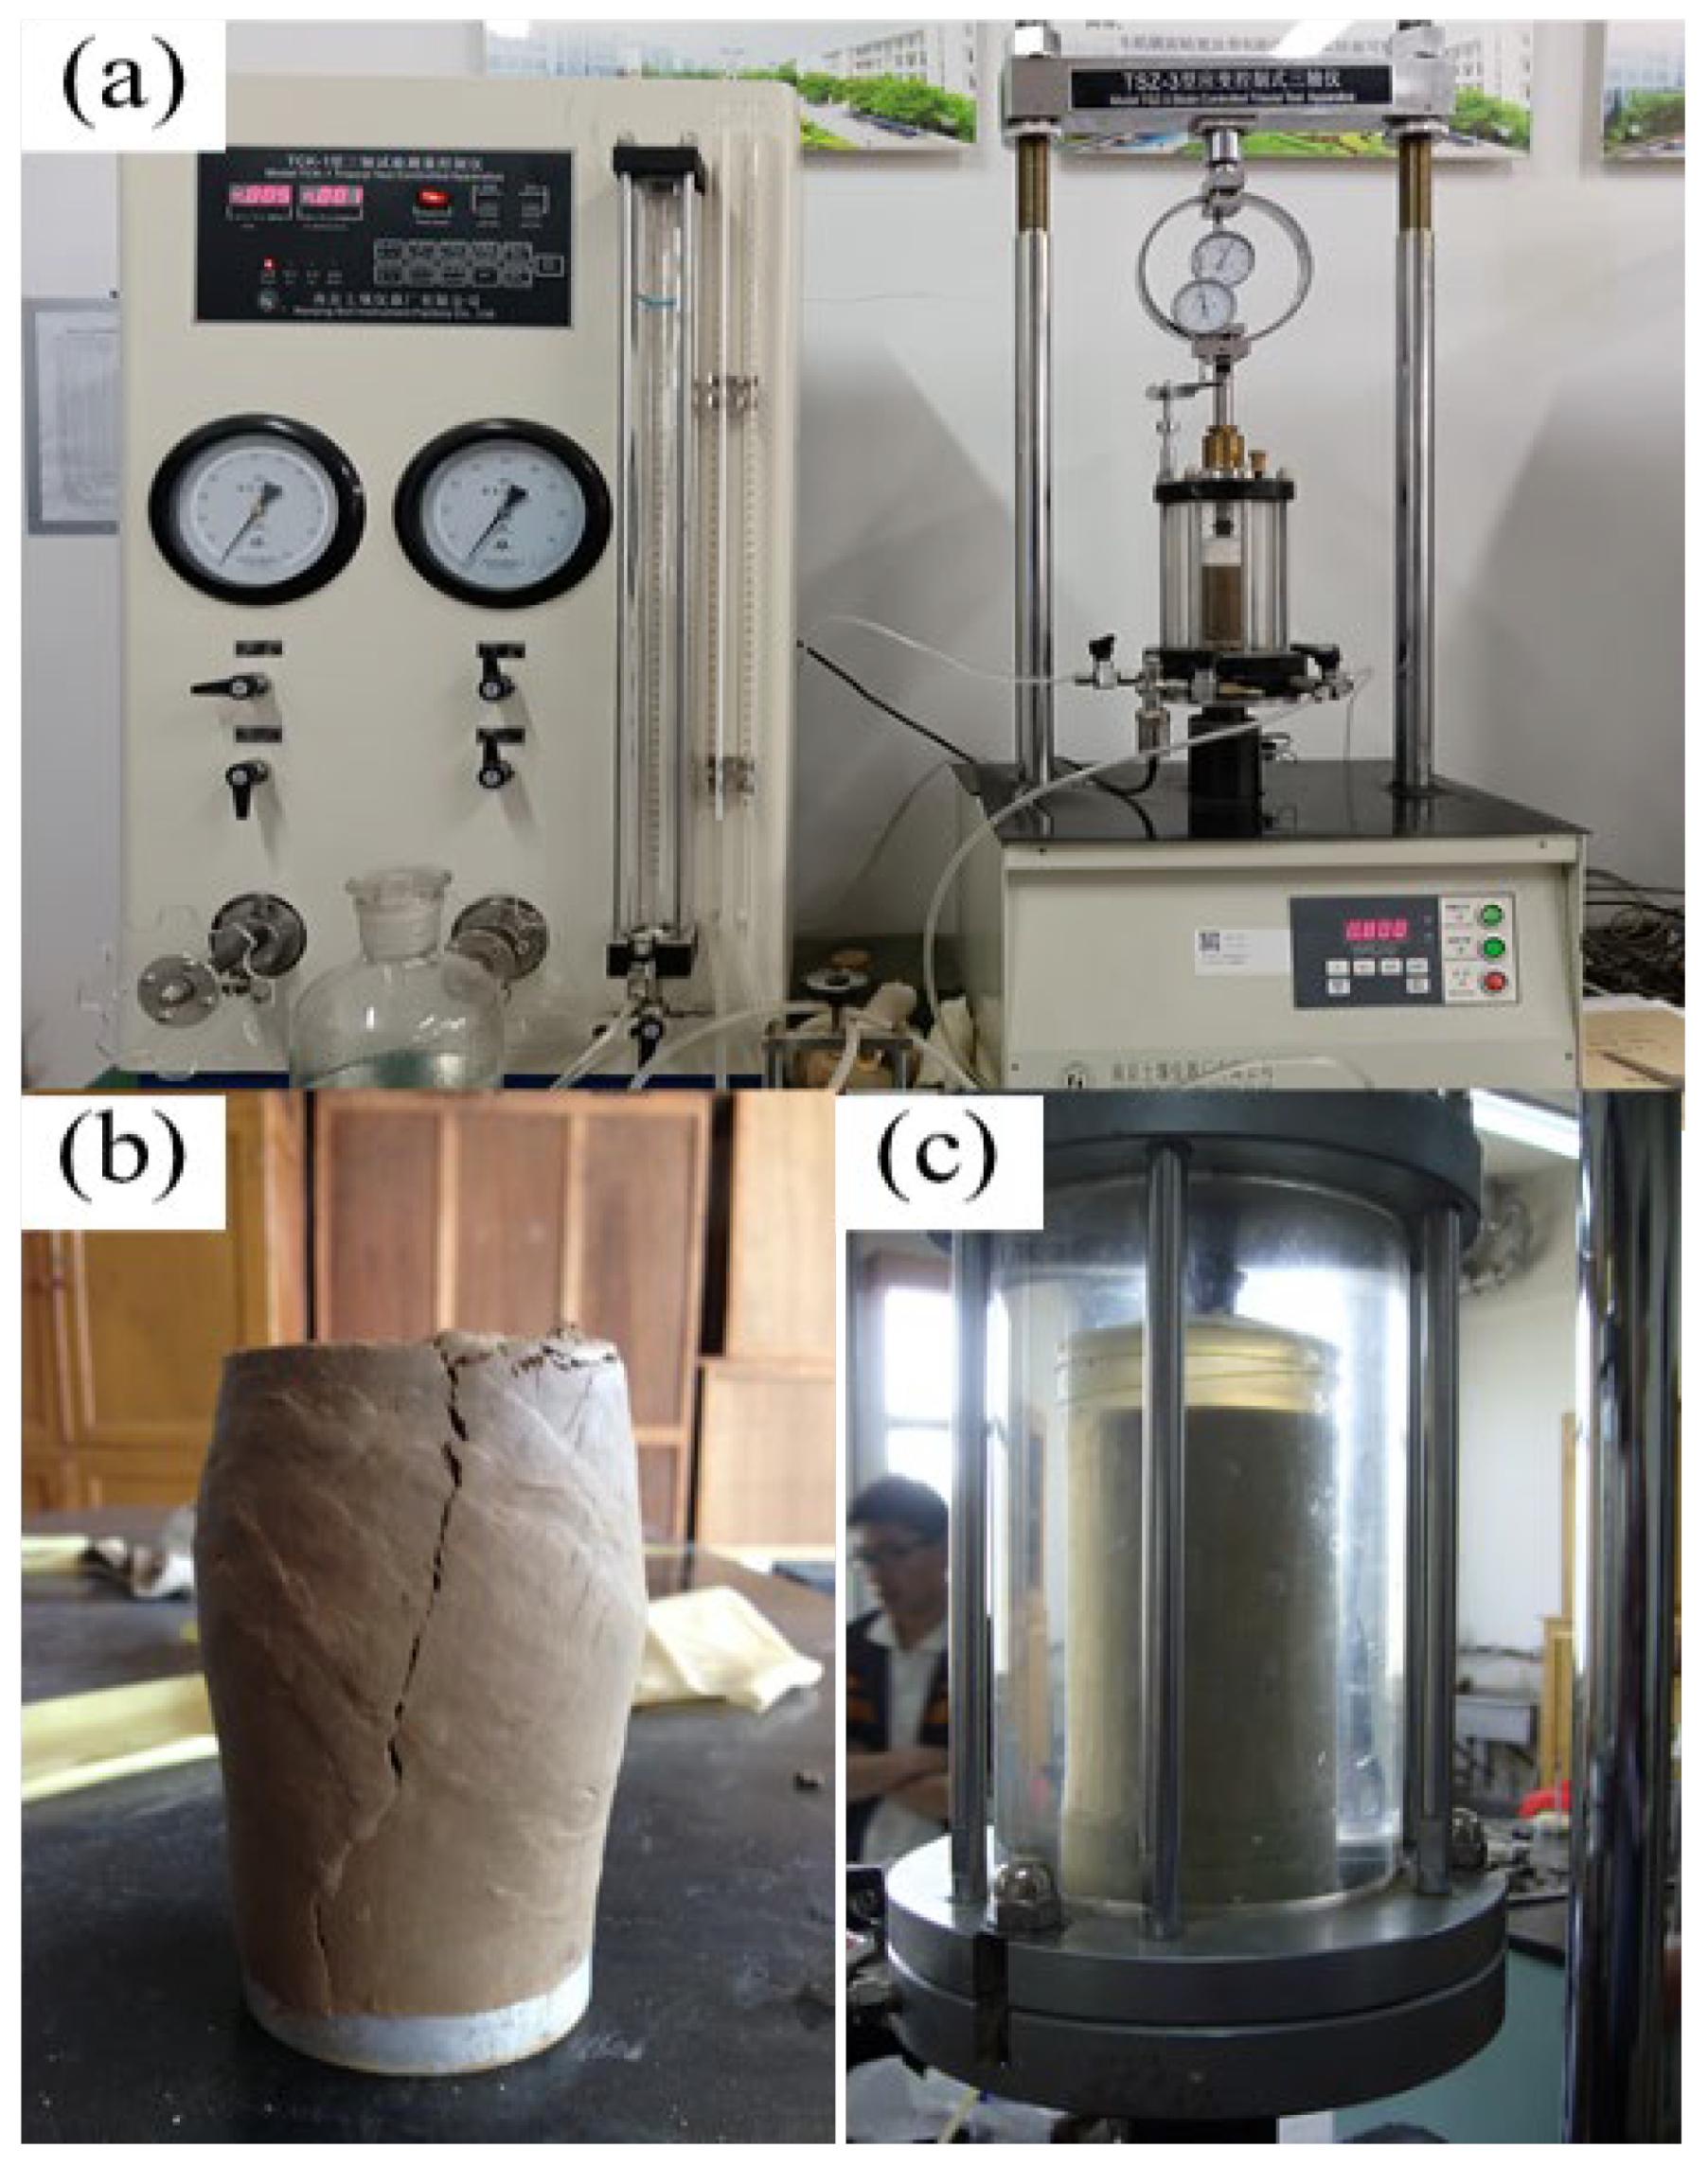
All unsaturated loess samples used in this study are collected from man-made high and steep slopes and the palm face of the tunnel projects that are distributed in Lanzhou, Dingxi, and Yanan in northwest China. The specific sampling locations and the related physical parameters are listed in Table 1. To minimize the disturbance, all undisturbed loess samples were processed on-site as cylindrical samples with a diameter of 100 mm and a height of 150 mm. The samples collected from the field were processed in the laboratory into standard specimens with a diameter of 61.8 mm and a height of 125 mm. The remolded samples were prepared by statically compacting them using the hydraulic compression method in the laboratory [45]. The test samples constitute remolded loess (S1R-S3R), Q3 undisturbed loess (S4UD-S6UD), and Q2 undisturbed loess (S7UD-S9UD). The water content (w), dry density (ρd), void ratio (e), degree of saturation (Sr), and plasticity index (IP) of all samples are listed in Table 1.

2.2. Experiments

UU tests with and without a rubber membrane on three types of loess samples (S1R–S9UD) were conducted in triaxial shear equipment using the conventional strain-controlled triaxial instrument (TSZ-3) (Figure 1) manufactured by the Nanjing Soil Instrument Factory, which is mainly composed of a pressure chamber, a pressure system, and a pore water pressure system. The maximum load is 30 kN, and the loading rate can be adjusted between 0.002 and 4.5 mm/min, with a relative error ≤ 5%. The confining and axial pressure are digital display and numerically controlled (control error ± 1% FS), with maximum values of 2.0 MPa and 1.0 MPa, respectively. The maximum pore pressure can be measured up to 2.0 MPa, which is also a digital display, and the measurement error is ±1% FS. Rubber membranes with a thickness of 0.2 mm are used for performing the tests and are also supplied by the same manufacturer of this equipment. For each loess sample, four or five identical specimens with the same water content were prepared. On one of the specimens, a UU test (confined pressure is equal to 0) was conducted without a rubber membrane, and the other four (or three) specimens were tested quickly under UU conditions (applying different confined pressures) with a rubber membrane. After the specimens were placed and the confined pressure was set, the axial stress was gradually increased until the specimens failed or deformed (Figure 1b). The modified failure envelope results are summarized (Figure 2). As discussed earlier, the suction change during the test was ignored as the test specimens were sheared quickly. It is important to note that an angle of internal friction has to be measured; unlike saturated soils, the angle of internal friction, φu = 0 is not equal to zero.

2.3. Methods

2.3.1. Method 1

The principal stress and shear stress were calculated using Equation (1) from the UU tests performed with a rubber membrane on unsaturated loess specimens. Extending the Mohr–Coulomb strength theory, the modified shear strength envelope (Line Kf) was plotted (Figure 2), and the undrained cohesion cu and internal friction angle φu were calculated by Equation (2) (Method 1). However, the UU tests performed with different confining pressures with a rubber membrane provide cu and φu values, but error exists. The cu and φu are referred to as the measured cohesion and internal friction angle, respectively, in this study.
s = σ 1 + σ 3 2 t = σ 1 σ 3 2 ,
t = s sin φ u + c u cos φ u
where s is the average principal stress, kPa (symbol p is also used in the literature); t (symbol q is also used in the literature) is the shear stress (the symbol q is also used in the literature), kPa; σ1, σ3 are the maximum and minimum principal stresses, kPa, respectively; cu is the undrained cohesion, kPa; and φu is the effective internal friction angle, °. The criteria for failure are summarized below.
sin φ u = ( σ 1 σ 3 ) / 2 c u cot φ u + ( σ 1 + σ 3 ) / 2 ,

2.3.2. Method 2

The UU test, with confining pressure equal to 0, as discussed earlier, was conducted without a rubber membrane, which means the measured shear strength of loess was reliable (i.e., without rubber membrane influence). Such a test is a conventional unconfined compression (UC) test. We corrected the shear strength from Method 1 by introducing the UU test (σ3 = 0), which can reflect the true shear strength. The corrected shear strength envelope (Line Kf0) is the best-fit line of all measured points in the pq coordinates, which comprises the UU test results with and without a rubber membrane (Method 2). It means the combination of one test without a membrane and some tests with a membrane. Compared with Kf, Kf0 can reflect the true shear strength values. Accordingly, the corrected cohesion cu0 and internal friction angle φu0 can be determined (Equation (2)), and the two parameters are referred to as the corrected cohesion and corrected internal friction angle.

3. Results

3.1. Loess Shear Strength

According to the test data, the corresponding shear strength lines Kf and Kf0 can be obtained by extending Method 1 and 2, respectively (see Section 2.3) using (Equation (2)). Figure 2 summarizes typical results. The shear strength index from the Kf and Kf0 are shown in Table 2. It can be seen that under the influence of a rubber membrane, the Kf0 are lower than the Kf to different degrees, which relates to the distortion of shear strength from the UU test with a rubber membrane. The measured cohesion cu obtained by Method 1 for different specimens is significantly higher than the cu0 obtained from correction by Method 2, and the internal friction angle φu is reduced compared with φu0 (Figure 2 and Table 2). This phenomenon indicates that the rubber membrane played a damping role during the UU test, resulting in greater shear strength than the actual value.

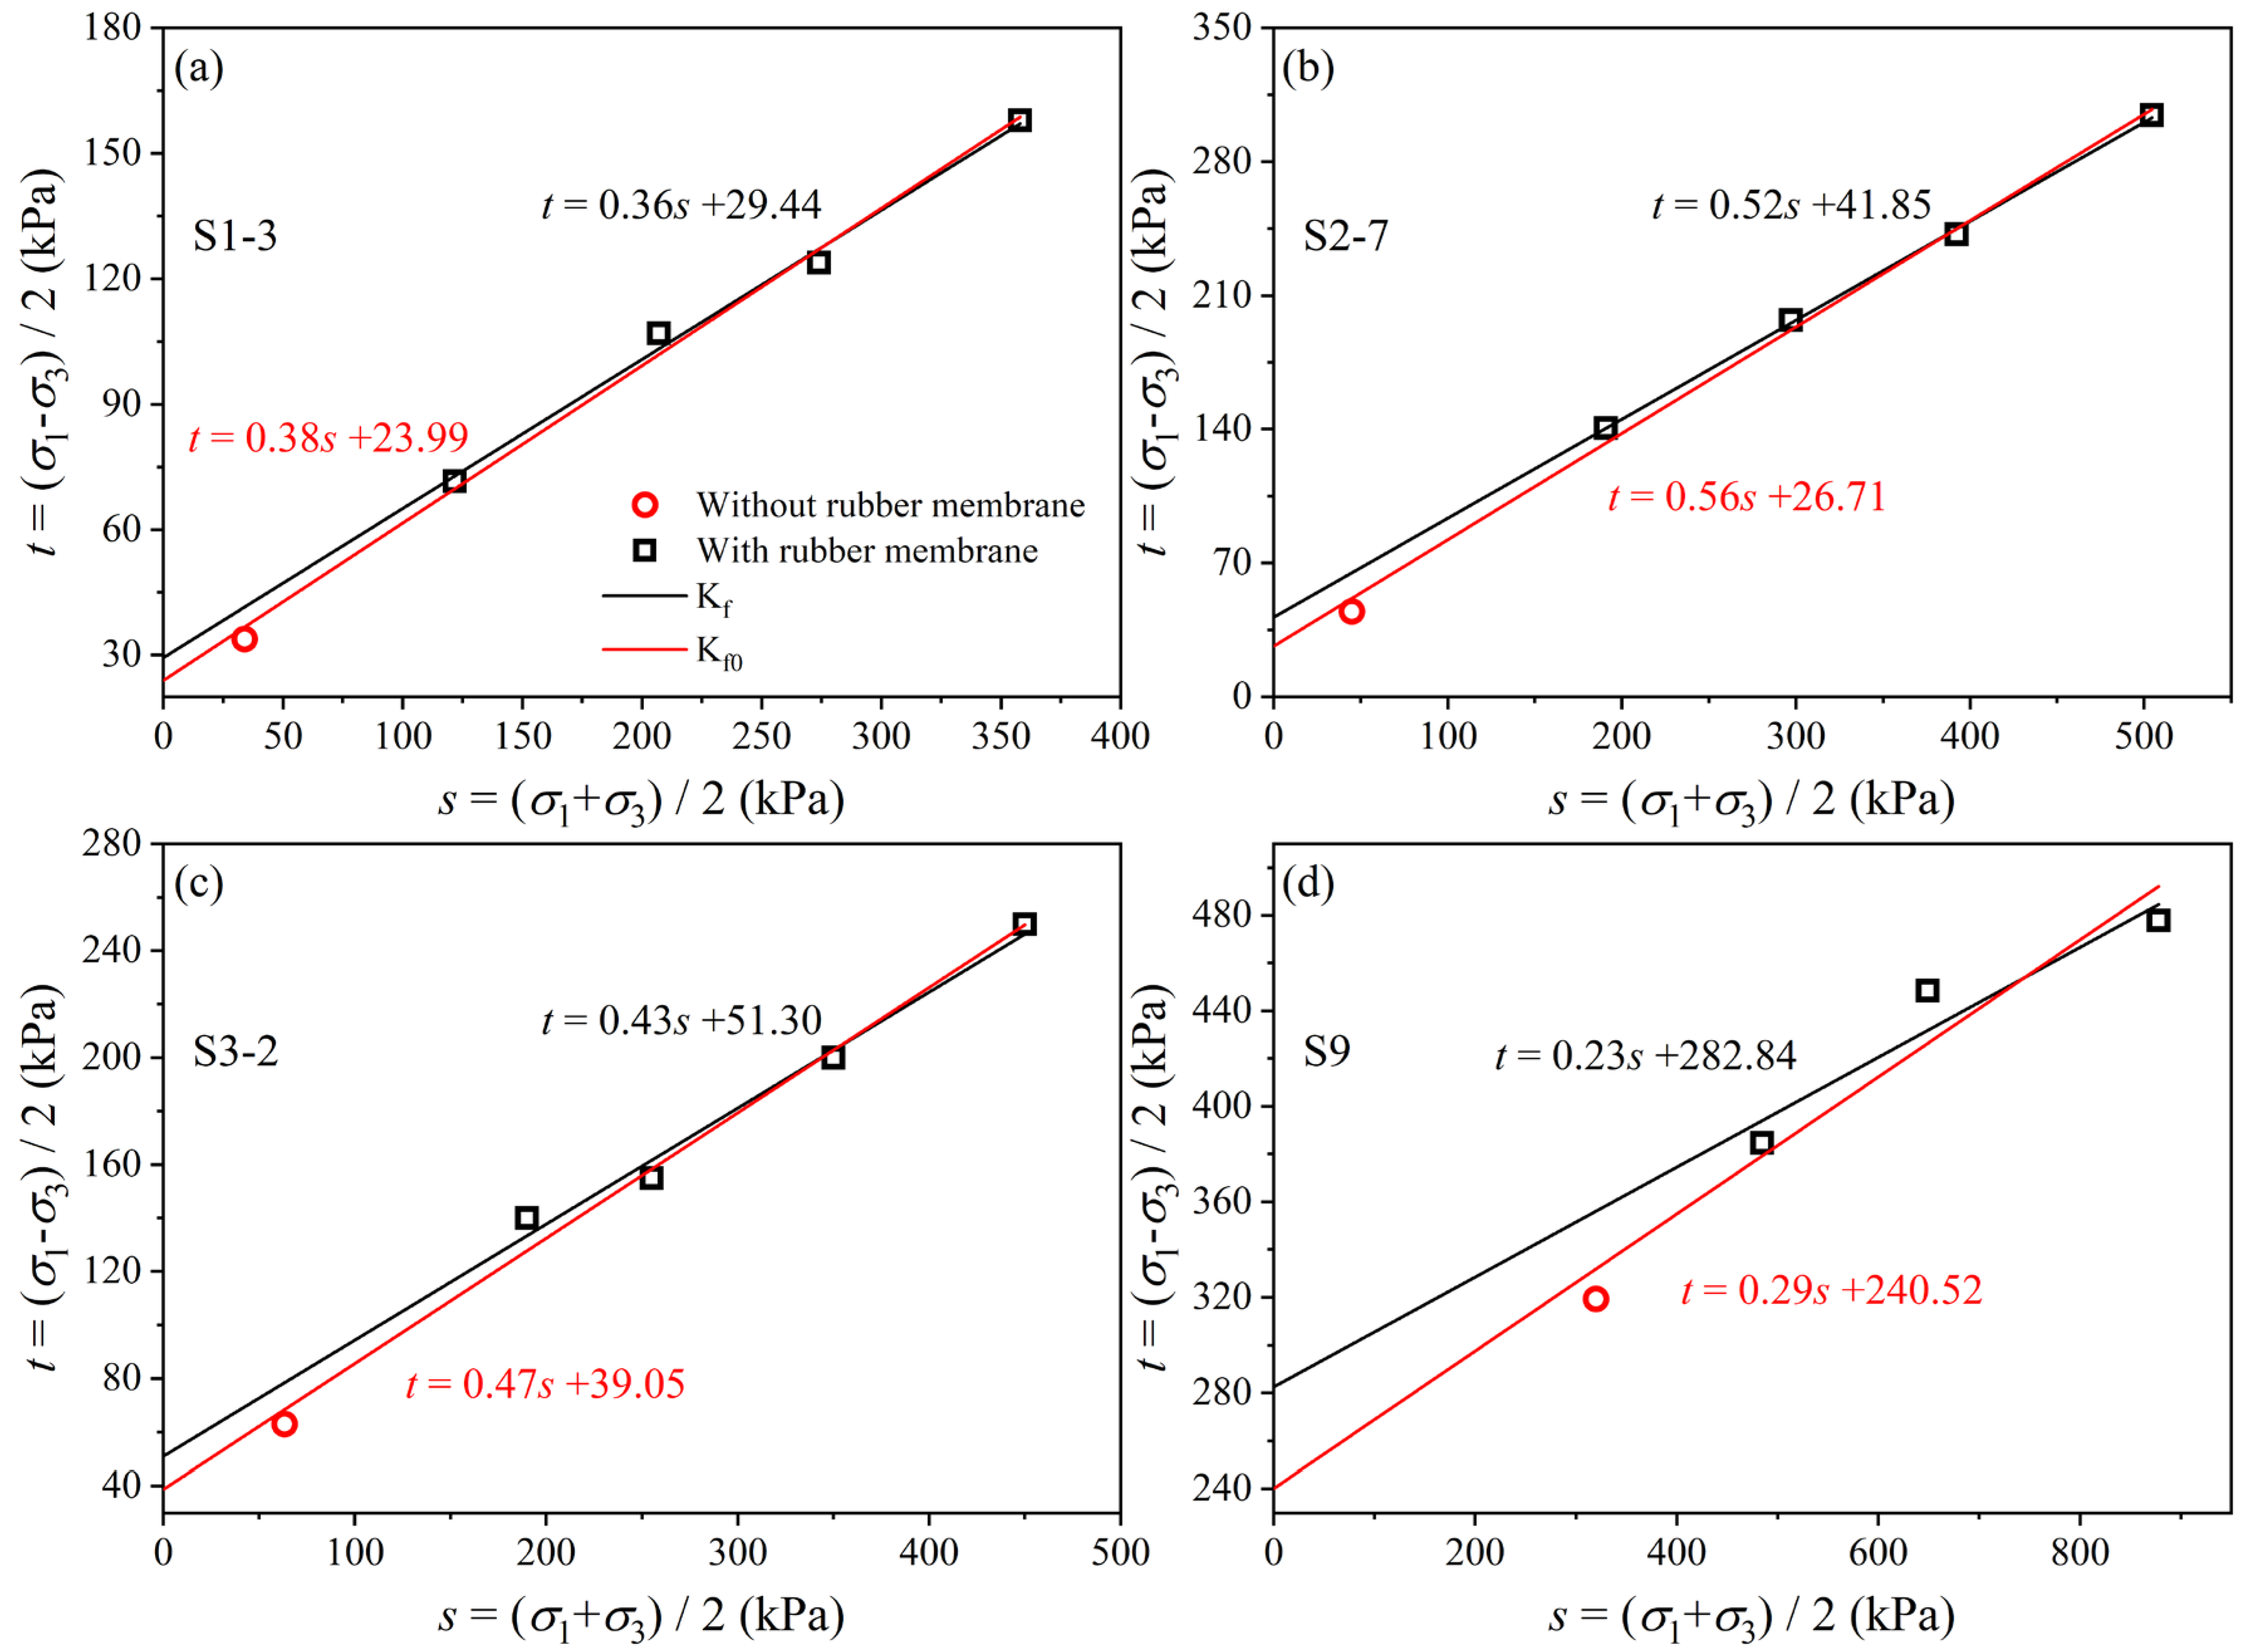
3.2. Calculation of Shear Strength Error under the Influence of a Rubber Membrane

The measured cu obtained under the UU test with a rubber membrane is increasing with respect to the corrected cu0, while φu is in contrast, so the following parameters are defined to quantify the error of measured shear strength with a rubber membrane, respectively:
Δ c = c u c u 0 ,
Δ φ = φ u 0 φ u ,
where Δc is the loss amount of measured cohesion, kPa; and Δφ is the increment amount of the measured internal friction angle.
The change in shear strength can be explained using the parameters introduced below.
η = Δ c c u ,
λ = Δ φ φ u ,
where η is the loss ratio of measured cohesion, %; and λ is the increment ratio of the measured internal friction angle, %. In the above equation, the Δc and Δφ are used to characterize the amount of difference, while the η and λ are set to characterize the ratio of difference.
Due to the influence of structure on the undisturbed loess, there are differences in the physical and mechanical properties between the remolded and undisturbed loess. So too are the Q2 and Q3 loess due to the different periods and endowment environment of the undisturbed loess. Therefore, the influence degree of the rubber membrane on remolded loess, Q3 undisturbed loess, and Q2 undisturbed loess are considered separately using the following index values:
x ¯ = 1 n i = 1 n x i ,
s = 1 n 1 i = 1 n x i x ¯ 2 ,
c v = s x ¯ ,
where xi is the measured value of shear strength of each loess sample; n is the total number of samples; x ¯ is the average shear strength of different soil sample types; s is the corresponding standard deviation; and cv is the corresponding coefficient of variation.
The errors of different types of loess are calculated according to the above formula (Figure 3 and Table 3). The average values of the measured cohesion cu and internal friction angle φu obtained are 61.12 kPa and 27.57°, respectively, for the remolded loess. The corrected cu0 and φu0 are 50.86 kPa and 29.29°, and the Δc, Δφ, η, and λ are 10.26 kPa, 1.72°, 19.56%, and 7.21%, respectively, under the influence of the rubber membrane. In addition, the increment rate of the internal friction angle was higher than 16% when the water content was higher than 19% (Table 1 and Table 3). The shear strength of the specimen is less when it is closer to a fully saturated condition; however, for such scenarios, the test specimen is prone to deformation. In other words, the rubber membrane has a greater impact on the shear strength. A higher standard deviation and coefficient of variation is observed in remolded loess samples (Table 3), indicating the greatly varied shear strength of the remolded loess, which is consistent with Figure 3. It is associated with the mechanical characteristics of the remolded soils that were artificially influenced.
The coefficients of variation of the Q3 undisturbed loess indices are relatively minimal (Table 3). The average measured cohesion and internal friction angle are 56.33 kPa and 16.09°, and those of corrected parameters are 45.87 kPa and 17.94°, respectively. The Δc, Δφ, η, and λ of Q3 undisturbed loess are 10.46 kPa, 1.85°, 18.78%, and 12.72%, respectively, while those of Q2 undisturbed loess are 14.61 kPa, 0.55°, 3.6%, and 1.71%, respectively. Due to the influence structure of Q2 undisturbed loess, the cohesion value is significantly large compared to Q3 undisturbed loess and remolded loess (Table 2). Hence, the error amount in the measured shear strength of Q2 undisturbed loess caused by the rubber membrane is larger, but the error rate is smaller. The increment of cohesion caused by the rubber membrane is between 4.79 and 17.25 kPa (Figure 3 and Table 3), while the loss of internal friction angle is basically within 3°, corresponding to the change rate of 2.21–35.74% and 1.60–19.89%, respectively. These results suggest that the influence of the rubber membrane on the internal friction angle is relatively small in comparison to cohesion.

4. Discussions

4.1. Factors Affecting the Error of Shear Strength Index

4.1.1. Types of Soil Sample

The Q2 undisturbed loess with the highest shear strength had the larger Δc, as well as the smaller Δφ, η, and λ in comparison to the Q3 undisturbed and remolded loess, which offered greater resistance to the influence of the rubber membrane. That is to say, the higher the shear strength of the loess, the less it is affected by the rubber membrane. Such a behavior may be attributed to the non-homogeneity and anisotropy of the loess. The cohesion of the horizontal samples (S5, S7) was significantly smaller than that of the vertical samples (S6, S8), whereas the difference in the internal friction angle was relatively small. It is mainly related to the fact that the loess, distributed at different elevations, were subjected to the different influences of self-gravitational stresses.

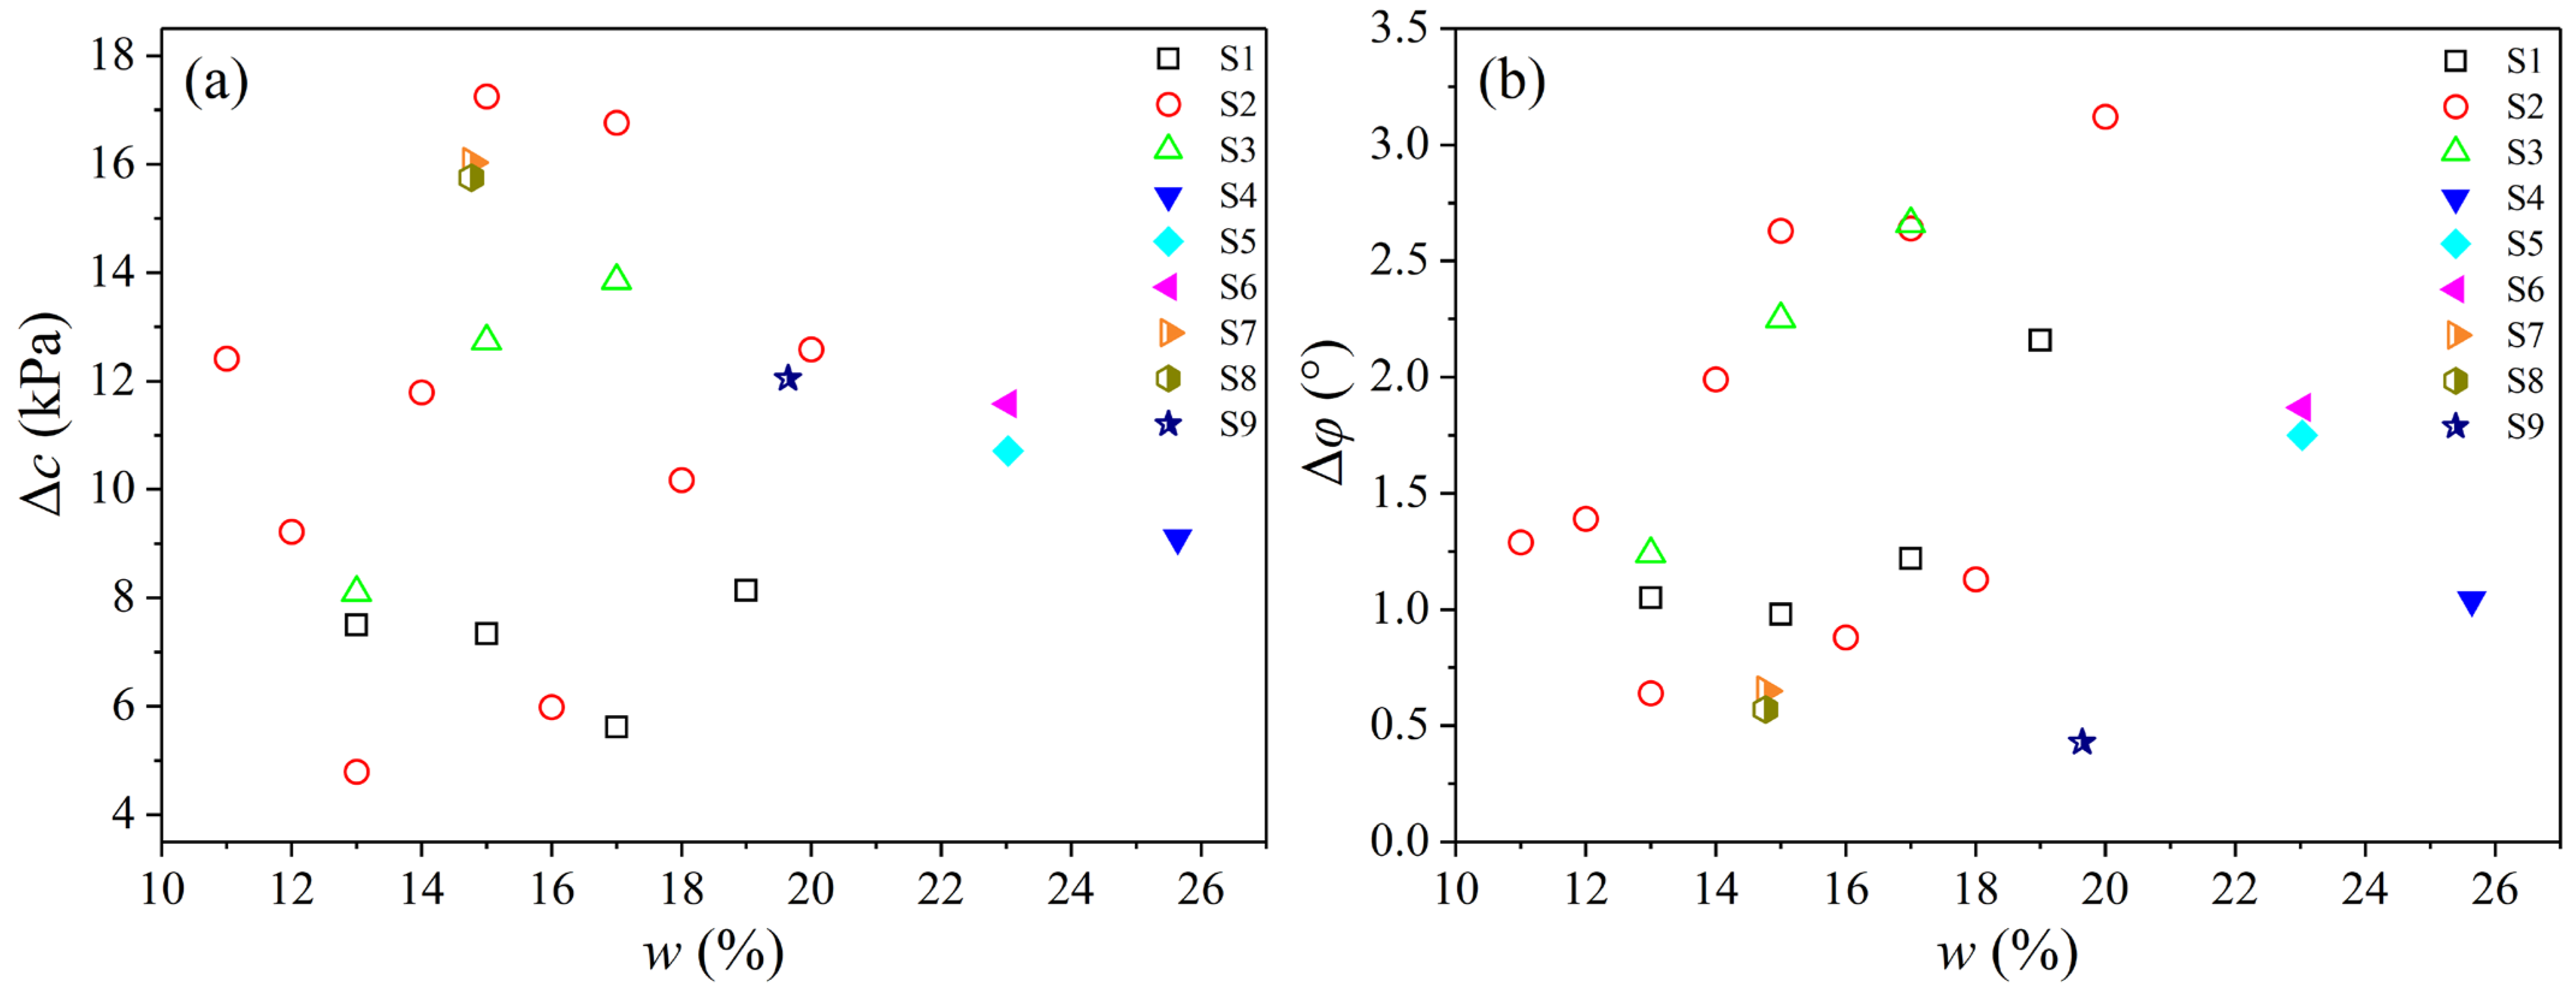
4.1.2. Water Content

(a)
Relationship to the change amount of shear strength
The shear strength of the undisturbed loess is closely related to the water content naturally. The two types of undisturbed loess, Q3 and Q2, basically show a similar change rule that with increased w, the shear strength of them decreases so that the Δcu and Δφu show a downward trend (Figure 4). For remolded loess, the natural structure and shear strength index were damaged after remolding, so the change amount of cohesion, Δc, and internal friction angle, Δφ, is disordered with the changed water content w (Figure 4), indicating that there is no significant correlation between them.
(b)
Relationship to the change rate of shear strength
It can be seen that the loss rate of cohesion, η, increases linearly with an increase in w (Figure 5a). By linearly fitting the η for remolded and undisturbed soils at different w, respectively, Equations (12) and (13) can be determined. The coefficients of determination, R2, of the fitting were 0.62 and 0.74, respectively. The linear slopes of the remolded loess were higher than those of the undisturbed loess, and the maximum η of the remolded loess and undisturbed loess was 35.74% and 22.12%, respectively (Table 3). It can be concluded that the η of remolded loess shows larger correlations with w than that of undisturbed loess. It is worth noting that the degree of dispersion of the remolded soil samples is high (Figure 5), which indicates that the cohesion of remolded loess is not only determined by the water content.
η = 2.97 w 25.85 .
η = 1.62 w 21.50 .
There is a positive correlation between the w and λ (i.e., the λ increases with the gradual increase in the water content) (Figure 5b). The relationship between them was obtained by fitting Equations (14) and (15), and the R2 were 0.58 and 0.95, respectively. It showed a high correlation in the undisturbed loess, while that in the remolded loess was much weaker, which was mainly related to the destroyed structure and shear strength of the remolded loess. The increase rate of λ − w is smaller in the undisturbed loess than in the remolded loess, which is consistent with a. It could be summarized that the change rate of shear strength in remolded loess is influenced by water content to a greater extent, while the fitting relationship between them is better in undisturbed loess.
λ = 1.77 × 10 4 w 3.83 .
λ = 3.78 × 10 6 w 4.66 .

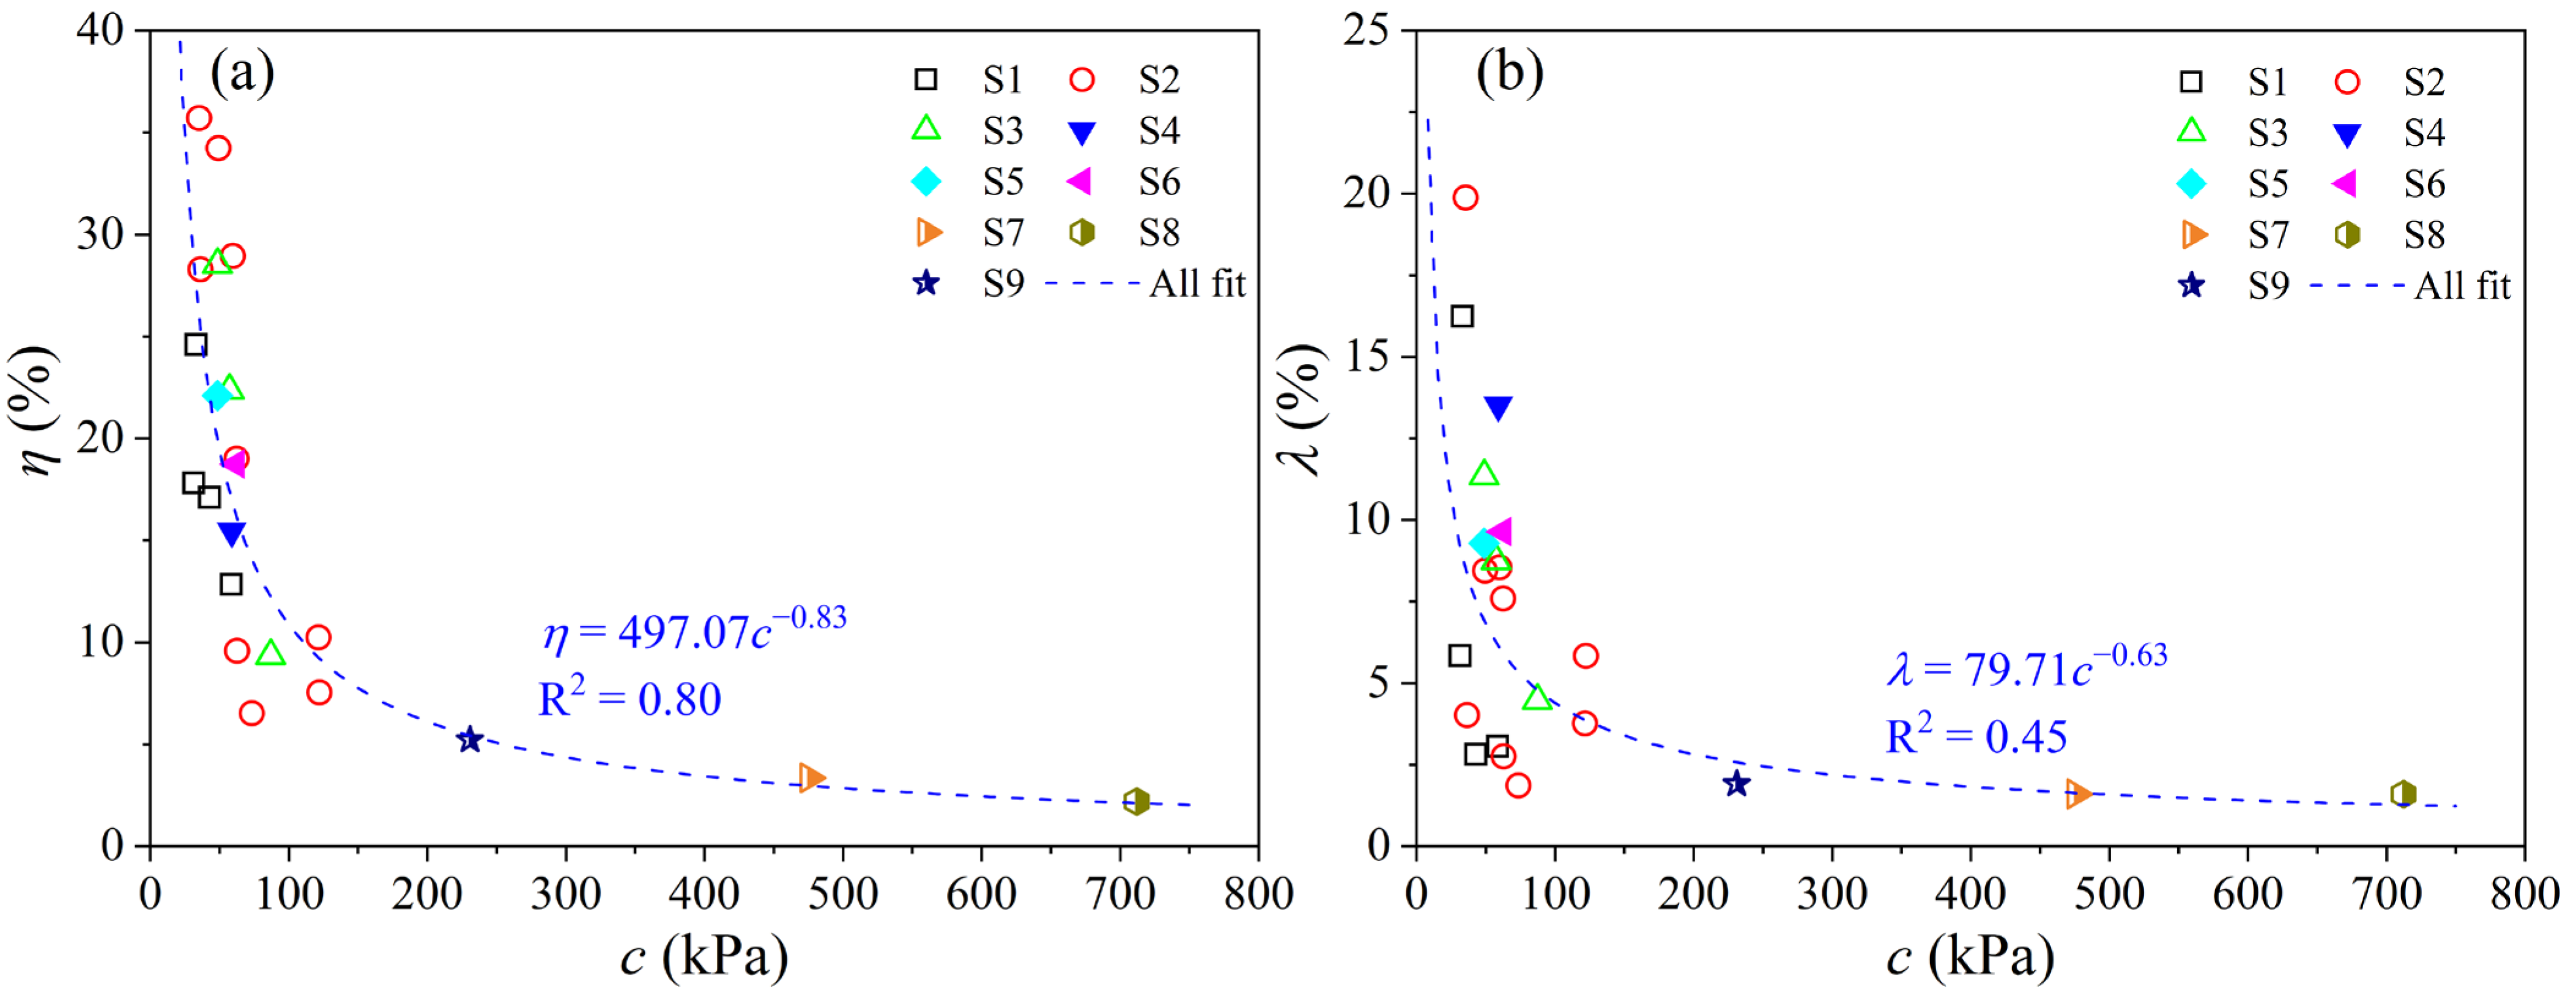
4.1.3. Measured Cohesion cu

By fitting the measured cohesion, cu, with the loss rate of cohesion, η, (Figure 6a), it was illustrated that the η showed a decreasing power type with an increasing cu for all types of loess samples (Equation (16)). R2 is 0.80 for these results, suggesting a good fitting effect. Similarly, the relationship between cu and λ can be obtained (i.e., Equation (17)) with a coefficient of determination, R2, value of 0.45. In conclusion, the η of each type of loess shows the same decreasing law in relation to the cu, which is mainly related to increases in the shear strength of loess with increased cohesion. Therefore, loess is less affected by the rubber membrane in the UU test, which suggests that the higher the shear strength of loess, the lower the change rate in the shear strength (Figure 3). The correlation between the cu and λ is relatively weak and can be ignored.
η = 497.07 c u 0.83 .
λ = 79.71 c u 0.63 .

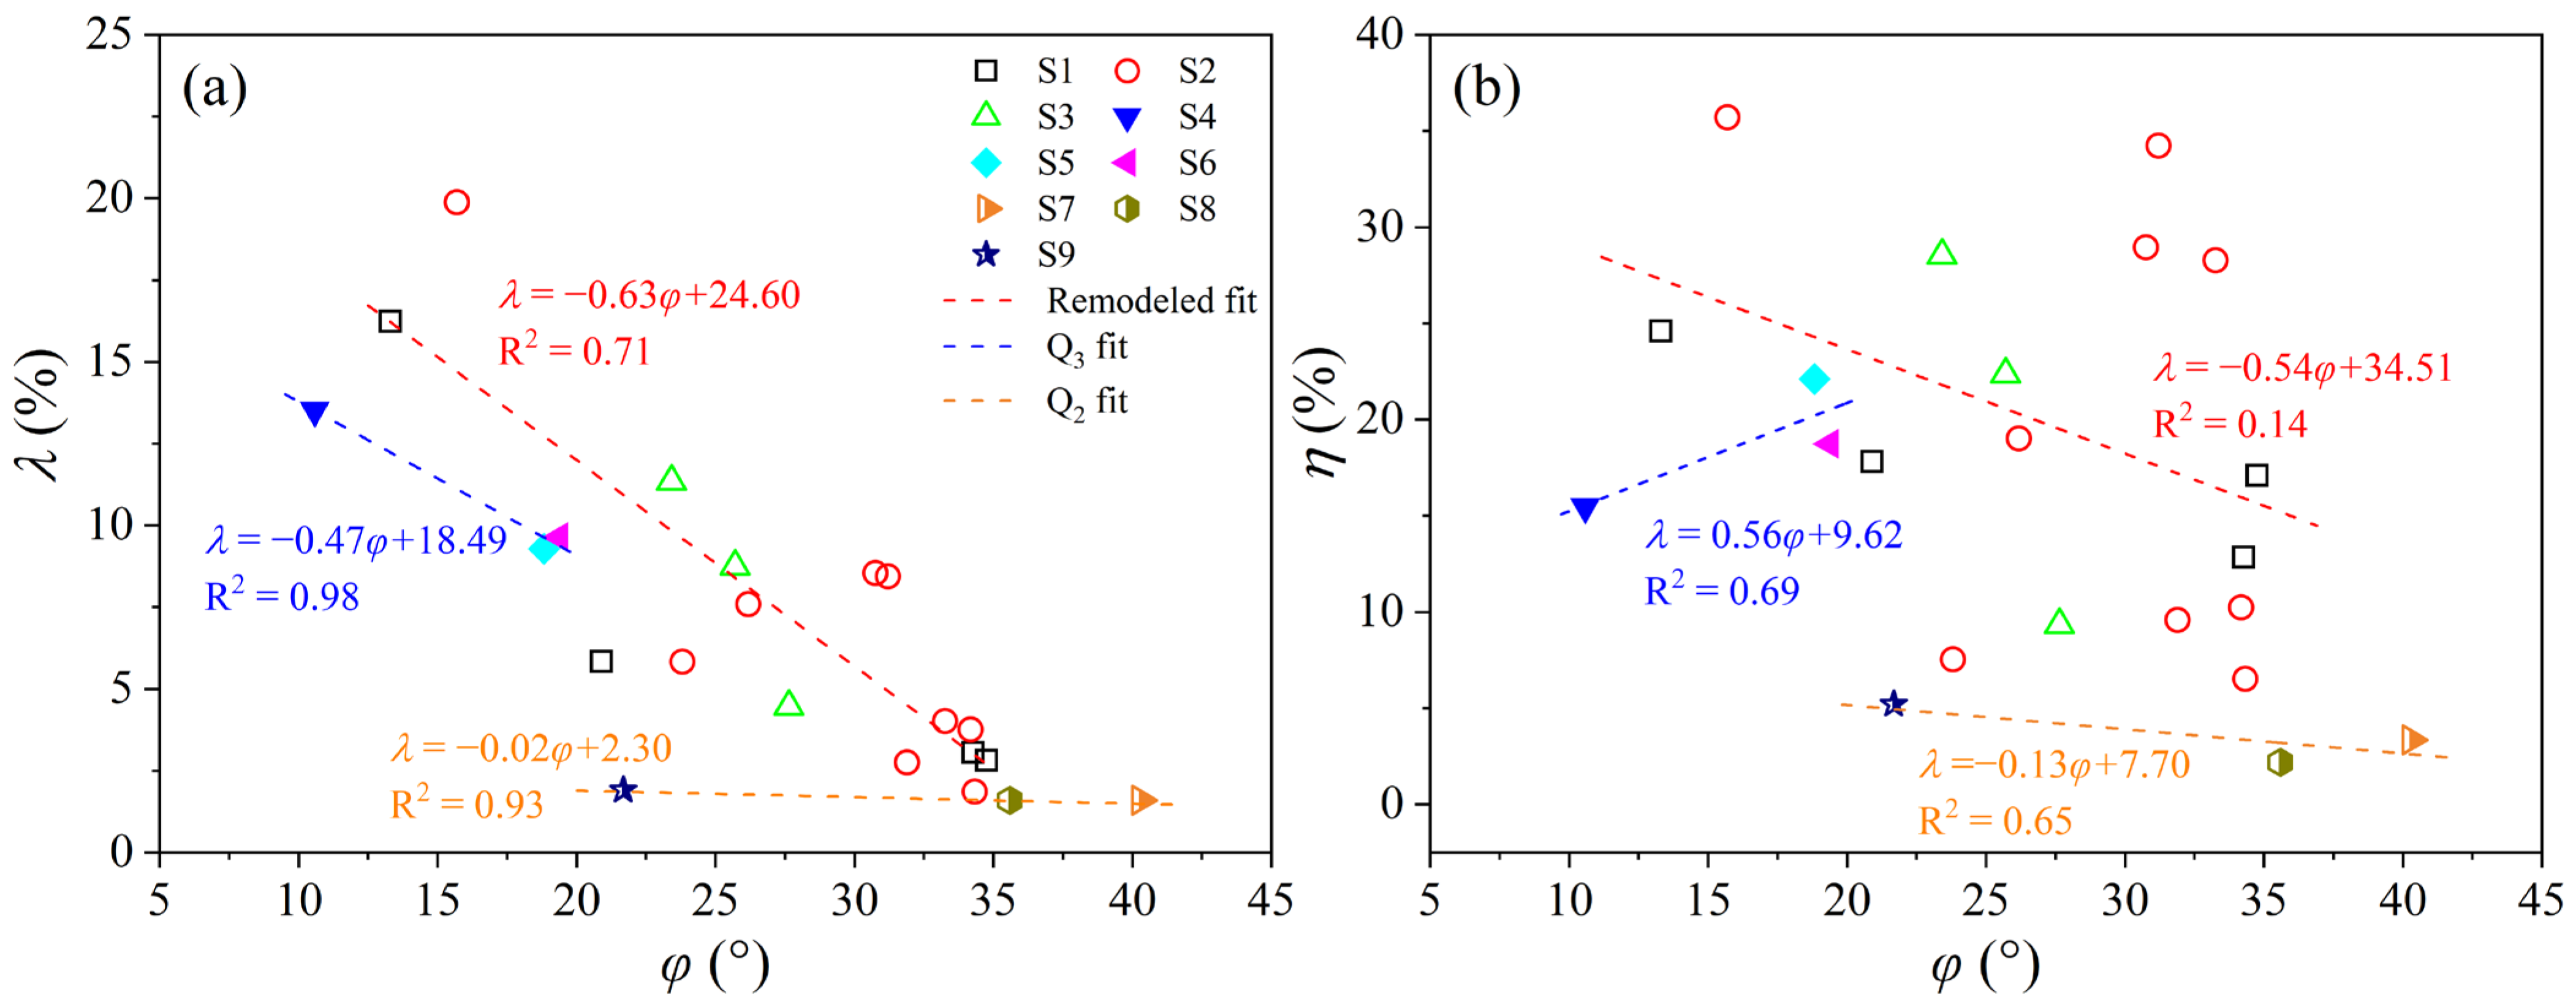
4.1.4. Measured Internal Friction Angle φu

By correlating the measured internal friction angle, φu, with the increased rate of the internal friction angle, λ, for different types of loess (Figure 7a), the fitted equations for the remolded loess, Q3 undisturbed loess, and Q2 undisturbed loess were obtained respectively (Equations (18)–(20)). The R2 were 0.71, 0.98, and 0.93, respectively, and the λ of all loess showed a linear decrease with increased φu. It was mostly because the shear strength of loess rose as the φu increased, increasing resistance to the rubber membrane and therefore lowering the change rate. Similarly, by fitting the relationship between the φu and η of all types of loess, the fitting equation and the coefficient of determination were obtained (Figure 7b). Different types of loess showed an obvious difference, and the correlation calculation results are absolutely poor, indicating that the loss rate of cohesion is not very correlated with the measured internal friction angle, whose effect can be ignored.
λ = 0.63 φ u + 24.60 .
λ = 0.47 φ u + 18.49 .
λ = 0.02 φ u + 2.30 .

4.2. Correction for Measured Shear Strength Index

The shear strength of loess as per the discussed procedures is determined by a triaxial shear test; however, there is a certain error between the measured cohesion and internal friction angle and the real value due to the influence of the rubber membrane. To obtain more reliable shear strength of loess for use in engineering projects from triaxial shear test results, it is necessary to correct the measured shear strength. Combining Equations (5) and (7), the correction formula for cohesion can be obtained as below:
c u 0 = c u c u η .
Also based on Equations (6) and (8), the correction formula for the internal friction angle can be deduced as follows:
φ u 0 = φ u + φ u λ .
In Equations (19) and (20), the measured cohesion, cu, and internal friction angle, φu, as well as the basic physical and mechanical characteristics of the loess, such as water content, w, can be obtained from the triaxial shear tests. However, the loss rate of cohesion, η, and the increment rate of the internal friction angle, λ, are unknown quantities. Hence, it is necessary to establish the relationship between these two indices and the available parameters to realize the final correction. Due to the different properties of remolded and undisturbed loess, the correction methods are discussed separately.

4.2.1. Remolded Loess

For remolded soils, the correlation between water content and loess shear strength is weak due to the structure disruption, which it is difficult to portray in mathematical relationships (Figure 5). Based on the previous analysis, the power function was used to fit the cuη, which showed a better fitting effect (Figure 6). Hence, Equation (16) was substituted into Equation (21), and the corrected cohesion of the remolded soil was able to be obtained:
c r e = c u 497.07 c u 0.17 .
Similarly, the linear fit of the relationship between the φu and λ of the remolded loess was relatively good. For this reason, Equation (18) was substituted into Equation (22) to derive the corrected value of internal friction angle for remolded loess:
φ r e = 0.63 φ u 2 + 25.60 φ u .

4.2.2. Undisturbed Loess

(a)
Corrections based on measured shear strength indices
Referring to the correction methods for the remolded loess above, empirical equations for correcting the shear strength of Q3 and Q2 undisturbed loess can be obtained. Since the cuη relationship of all loess generally conforms to the power function (Figure 6), the correction formula for the undisturbed loess is consistent with that for the remolded loess, i.e., Equation (23). By substituting Equations (19) and (20) into Equation (22), respectively, the corrected formula of the internal friction angle for different undisturbed loess can be obtained:
φ Q 3 = 0.47 φ u 2 + 19.49 φ u .
φ Q 2 = 0.02 φ u 2 + 3.30 φ u .
(b)
Corrections based on measured water content
The difference between undisturbed and remolded loess is reflected in whether the natural soil structure is maintained or not. It means the shear strength of undisturbed loess is directly related to the water content, so the measured shear strength of undisturbed loess can be corrected by the functional relationship between them that is well-established in this paper. Equations (13) and (15) are substituted into Equations (21) and (22), respectively, and the modified formulas of cohesion and internal friction angle for the undisturbed loess are obtained as follows:
c un = c u ( 22.50 0.0162 w ) .
φ un = φ u ( 1 + 1.81 × 10 15 w 4.66 )
In this study, experimental data with rubber membrane were used for samples without rubber membranes for proposing an empirical correction formula. This approach is different from previous studies in which experimental errors caused by rubber membranes were compensated directly in the early test stage; due to this reason, no comparative studies were conducted. It is worth noting that there are also some shortcomings in this study. Due to the limitation of experimental instruments and conditions in the experimental stage, a test with zero confining pressure and a rubber membrane was not carried out. In future, the authors propose carrying out relevant more experimental research studies to further promote the understanding of this problem.

5. Conclusions

In this study, the influence of a rubber membrane on the measured triaxial shear strength was investigated by performing UU tests with and without a rubber membrane of undisturbed and remolded unsaturated loess samples from Lanzhou, Dingxi, and Yanan in northwest China. Based on these investigations, several relationships for corrections were proposed that can be useful for reliable estimation of the mechanical properties of loess from simple conventional tests. The modified method proposed in this paper can also be applied to other types of soils by establishing new empirical relationships. The main conclusions are summarized below:
(1)
The measured undrained cohesion, cu, from the UU test with a rubber membrane is significantly larger than the corrected value, cu0, and the differentials are 5–17.5 kPa. The rate of change ranges from 2.21% to 35.74%. Meanwhile, the measured internal friction angle, φu, is less than the corrected value, φu0, with the amount being 0.43–3.12°. The rate of change ranges from 1.60% to 19.89%, which is significantly less compared to the undrained cohesion;
(2)
The influence degree of the rubber membrane on the measured cohesion, cu, and internal friction angle, φu, of loess in the UU test is inversely proportional to the loess shear strength. The loss rate of cohesion shows a power function decay law with the measured cohesion, while the increased rate of the internal friction angle illustrates a negative linear correlation with the measured internal friction angle. Both the change rate of cohesion and the internal friction angle of undisturbed loess increased linearly with the increase in water content;
(3)
Based on the test data, the relationship between the shear strength indices and influencing factors of types of loess was fitted with the determination coefficient R2 basically being more than 0.8. Empirical correction formulae for the measured shear strength indices developed from the UU tests with a rubber membrane of remolded loess, Q3 undisturbed loess, and Q2 undisturbed loess were established, respectively. The proposed correction formulae can be used for correcting the mechanical parameters of loess in engineering practice applications and designing sustainable infrastructure in problematic loess deposits of northwest China.
(4)
The proposed correction method in this study can be extended to other soils to develop new relationships. However, it is important to note that the proposed correction relationships are valid only for the mechanical parameters of loess samples from northwest China.

Author Contributions

Conceptualization, Z.Z. and R.H.; methodology, Z.Z. and X.W.; experimental, X.W. and R.H.; resources, R.H.; writing—original draft preparation, Z.Z. and X.W.; writing—review and editing, Z.Z. and S.V.; funding acquisition, R.H. All authors have read and agreed to the published version of the manuscript.

Funding

This research was funded by China Gezhouba Group Co., Ltd. (Grant no. GZBJC-XADT-[2019]001) and the China Scholarship Council (File no. 202008410133).

Data Availability Statement

The data can be obtained by contacting the authors.

Conflicts of Interest

The authors declare no conflicts of interest.

References

  1. Cai, G.; Li, J.; Liu, S.; Li, J.; Han, B.; He, X.; Zhao, C. Simulation of Triaxial Tests for Unsaturated Soils under a Tension–Shear State by the Discrete Element Method. Sustainability 2022, 14, 9122. [Google Scholar] [CrossRef]
  2. Nguyen, Q.H.; Ly, H.-B.; Ho, L.S.; Al-Ansari, N.; Van Le, H.; Tran, V.Q.; Prakash, I.; Pham, B.T. Influence of Data Splitting on Performance of Machine Learning Models in Prediction of Shear Strength of Soil. Math. Probl. Eng. 2021, 2021, 4832864. [Google Scholar] [CrossRef]
  3. Peng, P.; Li, Z.; Zhang, X.; Liu, W.; Sui, S.; Xu, H. Slope Failure Risk Assessment Considering Both the Randomness of Groundwater Level and Soil Shear Strength Parameters. Sustainability 2023, 15, 7464. [Google Scholar] [CrossRef]
  4. Liu, H.; Lyu, X.; Wang, J.; He, X.; Zhang, Y. The Dependence between Shear Strength Parameters and Microstructure of Subgrade Soil in Seasonal Permafrost Area. Sustainability 2020, 12, 1264. [Google Scholar] [CrossRef]
  5. Soldo, A.; Miletić, M. Study on Shear Strength of Xanthan Gum-Amended Soil. Sustainability 2019, 11, 6142. [Google Scholar] [CrossRef]
  6. Xu, W.; Chen, S.; Fu, Z.; Ji, E. Measuring Method for Membrane Penetration Capacity of Coarse-Grained Soil in Triaxial Tests. Chin. J. Geotech. Eng. 2021, 43, 1536–1541. [Google Scholar] [CrossRef]
  7. Newland, P.L.; Allely, B.H. Volume Changes in Drained Triaxial Tests on Granular Materials. Geotechnique 1957, 7, 17–34. [Google Scholar] [CrossRef]
  8. Evans, M.D.; Seed, H.B. Undrained Cyclic Triaxial Testing of Gravels: The Effect of Membrane Compliance; College of Engineering, University of California: Oakland, CA, USA, 1987. [Google Scholar]
  9. Noor, M.J.M.; Nyuin, J.D.; Derahman, A. A Graphical Method for Membrane Penetration in Triaxial Tests on Granular Soils. J. Inst. Eng. Malays. 2012, 73, 23–30. [Google Scholar]
  10. Chen, C.; Zang, H. Some Problems in Triaxial Test on Saturated Sands. Chin. J. Geotech. Eng. 2000, 22, 659–663. [Google Scholar]
  11. Alhani, I.J.; Noor, M.J.M.; Albadri, W.M. Membrane Penetration Effects on Shear Strength and Volume Change of Soil during Triaxial Test. AIP Conf. Proc. 2018, 2020, 020008. [Google Scholar]
  12. Raghunandan, M.E.; Sharma, J.S.; Pradhan, B. A Review on the Effect of Rubber Membrane in Triaxial Tests. Arab. J. Geosci. 2015, 8, 3195–3206. [Google Scholar] [CrossRef]
  13. Tsoi, W.-Y.; Lee, K.-M. Membrane Penetration Remedy for the Testing of Lightly Cemented Scrap Rubber Tire Chips. Geotech. Test. J. 2008, 32, 55–63. [Google Scholar] [CrossRef]
  14. Choi, J.W.; Ishibashi, I. An Experimental Method for Determining Membrane Penetration. Geotech. Test. J. 1992, 15, 413–417. [Google Scholar] [CrossRef]
  15. Ramana, K.V.; Raju, V.S. Constant-Volume Triaxial Tests to Study the Effects of Membrane Penetration. Geotech. Test. J. 1981, 4, 117–122. [Google Scholar] [CrossRef]
  16. Tokimatsu, K.; Nakamura, K. A Liquefaction Test without Membrane Penetration Effects. Soils Found. 1986, 26, 127–138. [Google Scholar] [CrossRef]
  17. Seed, R.B.; Hossain, A. Development of a Laboratory Technique for Correcting Results of Undrained Triaxial Shear Tests on Soils Containing Coarse Particles for Effects of Membrane Compliance; US Army Engineer Waterways Experiment Station, Geotechnical Laboratory: Vicksburg, MS, USA, 1987. [Google Scholar]
  18. Kramer, S.L.; Sivaneswaran, N. A Nondestructive, Specimen-Specific Method for Measurement of Membrane Penetration in the Triaxial Test. Geotech. Test. J. 1989, 12, 50–59. [Google Scholar] [CrossRef]
  19. Wang, L.; Sun, R.; Liu, H.; Yuan, X.; Wang, Y. New Method to Compensate for Membrane Compliance in Dynamic Triaxial Liquefaction Tests on Gravelly Soils. Chin. J. Geotech. Eng. 2020, 42, 2281–2290. [Google Scholar] [CrossRef]
  20. Sivathayalan, S.; Vaid, Y.P. Truly Undrained Response of Granular Soils with No Membrane-Penetration Effects. Can. Geotech. J. 1998, 35, 730–739. [Google Scholar] [CrossRef]
  21. Nicholson, P.G.; Seed, R.B.; Anwar, H.A. Elimination of Membrane Compliance in Undrained Triaxial Testing. II. Mitigation by Injection Compensation. Can. Geotech. J. 1993, 30, 739–746. [Google Scholar] [CrossRef]
  22. Tokimatsu, K.; Nakamura, K. A Simplified Correction for Membrane Compliance in Liquefaction Tests. Soils Found. 1987, 27, 111–122. [Google Scholar] [CrossRef]
  23. Roscoe, K.H.; Schofield, A.N.; Thurairajah, A. An Evaluation of Test Data for Selecting a Yield Criterion for Soils; ASTM International: West Conshohocken, PA, USA, 1964. [Google Scholar]
  24. Raju, V.S.; Sadasivan, S.K. Membrane Penetration in Triaxial Tests on Sands. J. Geotech. Eng. Div. 1974, 100, 482–489. [Google Scholar] [CrossRef]
  25. Bopp, P.A.; Lade, P. V Membrane Penetration in Granular Materials at High Pressures. Geotech. Test. J. 1997, 20, 272–278. [Google Scholar] [CrossRef]
  26. Ji, E.; Zhu, J.; Wang, Q.; Jiang, M. Experiment of Membrane Penetration on Coarse Grained Soil. J. Geotech. Eng. 2018, 40, 346–352. [Google Scholar]
  27. Vaid, Y.P.; Negussey, D. A Critical Assessment of Membrane Penetration in the Triaxial Test. Geotech. Test. J. 1984, 7, 70–76. [Google Scholar] [CrossRef]
  28. Frydman, S.; Zeitlen, J.G.; Alpan, I. The Membrane Effect in Triaxial Testing of Granular Soils. J. Test. Eval. 1973, 1, 37–41. [Google Scholar] [CrossRef]
  29. Martin, G.R.; Seed, H.B.; Finn, W.D.L. Effects of System Compliance on Liquefaction Tests. J. Geotech. Eng. Div. 1978, 104, 463–479. [Google Scholar] [CrossRef]
  30. Li, Y.; Shi, W.; Aydin, A.; Beroya-Eitner, M.A.; Gao, G. Loess Genesis and Worldwide Distribution. Earth-Sci. Rev. 2020, 201, 102947. [Google Scholar] [CrossRef]
  31. Peng, J.; Wang, S.; Wang, Q.; Zhuang, J.; Huang, W.; Zhu, X.; Leng, Y.; Ma, P. Distribution and Genetic Types of Loess Landslides in China. J. Asian Earth Sci. 2019, 170, 329–350. [Google Scholar] [CrossRef]
  32. Fu, B.; Wang, S.; Liu, Y.; Liu, J.; Liang, W.; Miao, C. Hydrogeomorphic Ecosystem Responses to Natural and Anthropogenic Changes in the Loess Plateau of China. Annu. Rev. Earth Planet. Sci. 2017, 45, 223–243. [Google Scholar] [CrossRef]
  33. Nouaouria, M.S.; Guenfoud, M.; Lafifi, B. Engineering Properties of Loess in Algeria. Eng. Geol. 2008, 99, 85–90. [Google Scholar] [CrossRef]
  34. Wei, J.-Z.; Zheng, K.; Zhang, F.; Fang, C.; Zhou, Y.-Y.; Li, X.-C.; Li, F.-M.; Ye, J.-S. Migration of Rural Residents to Urban Areas Drives Grassland Vegetation Increase in China’s Loess Plateau. Sustainability 2019, 11, 6764. [Google Scholar] [CrossRef]
  35. Lv, Y.; Zhang, C.; Zhao, J. Collapsibility Mechanisms and Water Diffusion Morphologies of Loess in Weibei Area. Sustainability 2023, 15, 8573. [Google Scholar] [CrossRef]
  36. Gong, B. Study of PLSR-BP Model for Stability Assessment of Loess Slope Based on Particle Swarm Optimization. Sci. Rep. 2021, 11, 17888. [Google Scholar] [CrossRef] [PubMed]
  37. Li, G.; Xue, Y.; Qu, C.; Qiu, D.; Liu, Q.; Ma, X. Stability Classification Probability Model of Loess Deposits Based on MCS-Cloud. Environ. Sci. Pollut. Res. 2023, 30, 31218–31230. [Google Scholar] [CrossRef]
  38. Zhou, W.-H.; Xu, X.; Garg, A. Measurement of Unsaturated Shear Strength Parameters of Silty Sand and Its Correlation with Unconfined Compressive Strength. Measurement 2016, 93, 351–358. [Google Scholar] [CrossRef]
  39. Chen, S.-L.; Wang, X. A Graphical Method for Undrained Analysis of Cavity Expansion in Mohr–Coulomb Soil. Géotechnique 2022, 1–13. [Google Scholar] [CrossRef]
  40. Tang, J.; Chen, X.; Cui, L.; Liu, Z. Strain Localization of Mohr-Coulomb Soils with Non-Associated Plasticity Based on Micropolar Continuum Theory. J. Rock Mech. Geotech. Eng. 2023, 15, 3316–3327. [Google Scholar] [CrossRef]
  41. Yu, L.; Lyu, C.; Wang, M.; Xu, T. Three-Dimensional Upper Bound Limit Analysis of a Deep Soil-Tunnel Subjected to Pore Pressure Based on the Nonlinear Mohr-Coulomb Criterion. Comput. Geotech. 2019, 112, 293–301. [Google Scholar] [CrossRef]
  42. Pei, Q.; Zou, W.; Han, Z.; Wang, X.; Xia, X. Compression Behaviors of a Freeze–Thaw Impacted Clay under Saturated and Unsaturated Conditions. Acta Geotech. 2024, 1–18. [Google Scholar] [CrossRef]
  43. Han, Z.; Zhang, P.; Zou, W.; Fan, K.; Vanapalli, S.K.; Wan, L. At-Rest Lateral Earth Pressure of Compacted Expansive Soils: Experimental Investigations and Prediction Approach. J. Rock Mech. Geotech. Eng. 2024. [Google Scholar] [CrossRef]
  44. Fan, K.; Yang, G.; Zou, W.; Han, Z.; Shen, Y. Lateral Earth Pressure of Granular Backfills on Retaining Walls with Expanded Polystyrene Geofoam Inclusions under Limited Surcharge Loading. J. Rock Mech. Geotech. Eng. 2023. [Google Scholar] [CrossRef]
  45. Ministry of Housing and Urban-Rural Development, P.R. of China. Standard for Geotechnical Testing Method; Ministry of Housing and Urban-Rural Development: Beijing, China, 2019; 684p. [Google Scholar]
Figure 1. Equipment used for performing shear strength tests: (a) strain-controlled triaxial test; (b) the UU test without rubber membrane; (c) the UU test with rubber membrane.
Sustainability 16 02120 g001
Figure 2. The different measured s-t points and corresponding shear strength lines (Kf0 and Kf) of loess samples from the UU test with and without rubber membrane. (a) S1-3; (b) S2-7; (c) S3-2; (d) S9.
Sustainability 16 02120 g002
Figure 3. Error analysis of shear strength index values for different types of loess samples tested. (a) cohesion; (b) internal friction angle.
Sustainability 16 02120 g003
Figure 4. Relationship between the change in cohesion and friction angle for samples with different initial water contents. (a) cohesion; (b) internal friction angle.
Sustainability 16 02120 g004
Figure 5. Relationship between water content and change ratio of shear strength. (a) cohesion; (b) internal friction angle.
Sustainability 16 02120 g005
Figure 6. Relationship between the measured cohesion and the change rate of shear strength index values. (a) cohesion; (b) internal friction angle.
Sustainability 16 02120 g006
Figure 7. Relationship between measured internal friction angle and change rate of shear strength index. (a) cohesion; (b) internal friction angle.
Sustainability 16 02120 g007
Table 1. Physical properties of loess samples in different sampling locations.
Sample NO.Loess TypesAgeSampling Locationw (%)ρd (g/cm3)eSr (%)IP
S1-1-RRemolded
loess
/Lanzhou13.001.700.5959.6713.95
S1-2-R15.0068.85
S1-3-R17.0078.03
S1-4-R19.0087.21
S2-1-RWangjiagou
tunnel
11.001.700.5950.4915.56
S2-2-R12.0055.08
S2-3-R13.0059.67
S2-4-R14.0064.26
S2-5-R15.0068.85
S2-6-R16.0073.44
S2-7-R17.0078.03
S2-8-R18.0082.62
S2-9-R20.0091.80
S3-1-RBeiershilipu
tunnel
13.001.700.5959.6713.51
S3-2-R15.0068.85
S3-3-R17.0078.03
S4-UDUndisturbed
loess
Q3Weijiazui tunnel25.641.550.7493.3113.12
S5-UDWangjiagou tunnel23.031.650.6497.7115.56
S6-UD
S7-UDQ2Xujiachuan tunnel14.771.920.4198.1617.76
S8-UD
S9-UDXinbantashan tunnel19.641.680.6187.3415.95
Note: S1R: Jiuzhou, Lanzhou; S2R–S8UD: Baoji–Lanzhou tunnels; S9UD: Yanan railway tunnels. S5UD and S7UD are horizontal samples, and S6UD and S8UD are vertical samples. The R in the sample no. means remolded loess, and UD means undisturbed loess.
Table 2. The shear strength of all loesses from different shear strength lines (Kf and Kf0).
Sample No.KfKf0Sample No.KfKf0
tanφucutanφu0cu0tanφucutanφu0cu0
S1-1-R0.6858.320.7150.82S2-8-R0.6635.940.6925.77
S1-2-R0.6942.870.7235.53S2-9-R0.2835.20.3422.62
S1-3-R0.3831.520.4125.9S3-1-R0.5286.670.5578.56
S1-4-R0.2425.080.2424.94S3-2-R0.4856.930.5344.2
S2-1-R0.68121.090.71108.68S3-3-R0.4348.510.4934.67
S2-2-R0.44121.820.47112.6S4-UD0.1958.850.2149.75
S2-3-R0.6873.250.768.46S5-UD0.3448.420.3837.71
S2-4-R0.4961.950.5450.16S6-UD0.3561.720.3950.14
S2-5-R0.5959.550.6642.3S7-UD0.85474.970.87458.94
S2-6-R0.6262.340.6456.35S8-UD0.72711.720.73695.97
S2-7-R0.6148.920.6732.16S9-UD0.4230.820.41218.77
Table 3. Comparative analysis of changes in shear strength of different types of loess samples.
Soil TypesParameterscu (kPa)φu (°)cu0 (kPa)φu0 (°)Δc (kPa)Δφ (°)η (%)λ (%)
Remolded
loess
Range31.52–121.8213.30–34.7522.62–112.6015.46–35.734.79–17.250.64–3.126.54–35.742.76–19.89
x ¯ 61.1227.5750.8629.2910.261.7219.567.21
s27.956.7628.226.373.820.789.715.06
cv0.460.250.550.220.370.460.500.70
Undisturbed
Q3
Range48.42–61.7210.58–19.3837.71–50.1412.01–21.259.10–11.581.04–1.8715.46–22.129.30–13.52
x ¯ 56.3316.0945.8717.9410.461.8518.7812.72
s7.005.227.075.151.260.103.335.62
cv0.120.320.150.290.120.050.180.44
Undisturbed
Q2
Range230.82–711.7221.67–40.28218.77–695.9722.10–40.9312.05–16.030.43–0.652.21–5.221.60–1.92
x ¯ 472.5032.51457.8933.0614.610.553.601.71
s240.4610.24238.609.792.220.111.520.18
cv0.510.310.520.300.150.200.420.11
Disclaimer/Publisher’s Note: The statements, opinions and data contained in all publications are solely those of the individual author(s) and contributor(s) and not of MDPI and/or the editor(s). MDPI and/or the editor(s) disclaim responsibility for any injury to people or property resulting from any ideas, methods, instructions or products referred to in the content.

