Abstract
This paper presents a comprehensive sustainability framework tailored to schools in conflict areas, which suffer from weaknesses in education infrastructures and services. The primary objective is to assess the sustainability of public schools in these areas, focusing on the West Bank of Palestine. Concerning international assessment tools, which often prioritize the environmental aspect over social and economic considerations, this study offers a comprehensive collection of indicators addressing the environmental, social, and economic dimensions of sustainability in public schools. The research methodology integrates insights from the literature review, the Palestinian context, and experts’ opinions, which were collected through questionnaires. The Analytical Hierarchy Process (AHP) method is used to determine the weights of the indicators. Applying this methodology to 54 Palestinian public schools revealed a low level of sustainability. Improvement recommendations include implementing green building principles, promoting social inclusion, and collaborating with local organizations to enhance economic conditions. This study provides a foundation for future research endeavors by presenting a robust framework for assessing sustainability in public schools in the Palestinian Territories.
1. Introduction
Schools are an important platform for promoting sustainability because of their critical role in shaping the beliefs and behaviors of future generations []. Education for sustainability aims to equip people with the information, capabilities, and mindset needed to understand and deal with social, economic, and environmental issues and encourage their active participation in creating a more sustainable future []. A sustainable school aims to seamlessly integrate sustainability ideas into all aspects of its activities, not just the surrounding physical environment []. This strategy targets all parties involved in the school, including students, staff, families, and the larger community, by implementing various policies and procedures to promote a quality and physically beneficial learning environment [].
The education system in conflict zones such as Palestine suffers from significant obstacles, including political unrest, shortages of trained teachers, outdated curricula, and financial constraints []. The ongoing political unrest in the region has led to the demolition of schools, restrictions on access and movement, and the evacuation of teachers and students alike []. As a result, many schools suffer from a lack of resources and infrastructure, which negatively affects the level of education. Due to the lack of opportunities in Palestine, many teachers are looking for work abroad, further exacerbating these difficulties []. There are currently very few skilled and experienced teachers resulting from this trend. The situation is exacerbated by outdated curricula that do not adequately focus on critical thinking, problem-solving techniques, technology, and innovation—all critical to success in today’s globalized economy [].
However, there is a notable gap in the availability of effective methods and tools to assess school sustainability across its three pillars []. While international tools such as LEED for School and BREEAM Education include indicators for sustainability and education, they show some limitations in the Palestinian context. For example, the LEED for school framework consists of seven categories for evaluating school sustainability []. In 2008, BREEAM Education introduced the MAN 10 Index, which focused on “development as an educational resource” to encourage sustainable education through building design and refurbishment []. Table 1 shows that the LEED, BREEAM, and SBTool assessment methods focus on environmental features, neglecting social and economic issues. Considering the significance of the social and economic factors to the Palestinian population, international assessment methods should be adapted to the Palestinian context by consulting experts in the field of sustainability.

Table 1.
The weight of the sustainability dimensions in the international tools [,].
Several studies have proposed tools for assessing school building sustainability considering specific regional contexts. Ref. [] focused on implementing sustainability in school buildings in Iraq. They used a combination of BREEAM, LEED, PBRS, AlSa’fat, SBTool, and expert opinions. Although the study primarily assessed environmental sustainability in school buildings, it did not consider the social and economic indicators. Ref. [] adapted the SBTool methodology to determine the sustainability of secondary school buildings in Portugal. Their study included LEED for Schools, BREEAM Education, and SBTool. This research represents the initial sustainability assessment of Portuguese school construction, focusing on the adaptability of SBTool to evaluate basic education institutions. Ref. [] sought to develop guidelines for assessing school sustainability in Egypt, using the Eco-Schools Program in Cyprus and Canada, the Green Schools Program in Ireland, and LEED for Schools. This study represents the first evaluation of the sustainability of Egyptian schools. Notably, it applied the same framework to both new and existing schools, raising concerns about effectiveness due to different indicators between these two cases. In Palestine, this kind of sustainability framework and analysis is absent.
This paper aims to establish a comprehensive sustainability framework for Palestinian schools and use this methodology to assess the sustainability of a significant group of schools to make recommendations to improve school sustainability in Palestine.
2. Methodology and Materials
Figure 1 shows the proposed framework. It includes three stages. The first stage presents the international frameworks for sustainability, focusing on BREEAM Education, LEED for Schools, and SBtool for K-12 schools. It also analyzes the Palestinian context, emphasizing the drivers and barriers behind implementing sustainability in Palestinian schools. The second stage presents the assessment model, which includes pressure, state, and response indicators. The third stage concerns data collection and analysis. The AHP method and a questionnaire administered to a panel of experts are used to determine the indicators’ relevance and weights. Data about the schools are collected using a questionnaire administered to the school’s administration. Data analysis is based on the sustainability index.
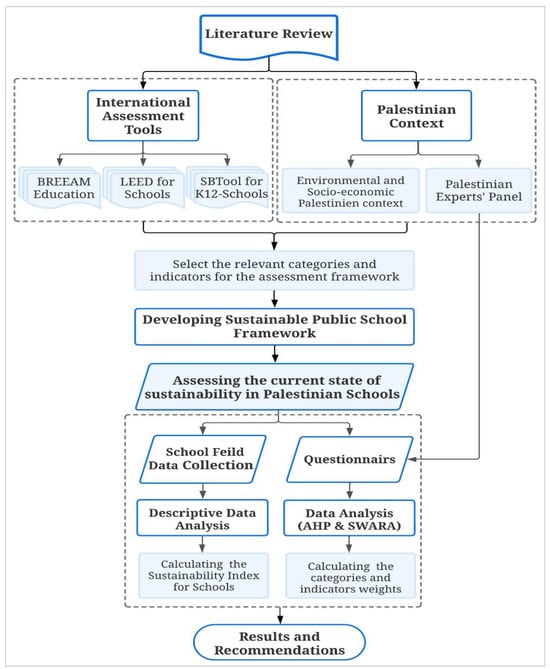
Figure 1.
The methodology steps for schools’ sustainability assessment.
The following sections present the implementation of the sustainability framework for schools, emphasizing the selection of indicators and adapting this framework to the Palestinian context.
2.1. Implementation of the Sustainability School Framework
The Pressure–State–Response (PSR) method is prominent in sustainability []. This framework is valuable for understanding the actions and events that affect the system’s state and provides insights into appropriate responses for educational institutions and stakeholders. The basic concept of the PSR model revolves around answering the key questions: “What happened?”, “Why did it happen?”, and “How should it be addressed?”. It creates an index that systematically evaluates the consequences of stress, changes in state, and the effectiveness of problem-solving approaches [].
After a comprehensive literature review and analysis of educational conditions in Palestine, we identified eleven main pressure criteria. These criteria are organized into four categories for environmental, five for social, and two for the economic dimension of sustainability. The following sections present the significance and role of the environmental, social, and economic indicators and compare the selected indicators with the international ones.
2.1.1. The PSR Environmental Indicators
Buildings significantly impact the environment as they consume resources, produce waste, and release emissions into the atmosphere throughout their life cycle []. Buildings constitute one of the most significant sources of carbon dioxide emissions and global warming. Five criteria are selected for the environment: energy efficiency, water efficiency, indoor quality, waste management, and site development, as shown in Table 2.
Table 2.
The PSR environmental indicators for schools.
Energy Efficiency
School buildings have always been a target of energy conservation interests. This is because energy efficiency and indoor comfort are the most important characteristics of a well-functioning school based on the principles of sustainable architecture []. Energy performance in school buildings is evaluated by assessing the condition of the indicators, i.e., the HVAC system, external and internal lighting, and the building envelope, to determine how much energy savings could be achieved. Other energy-saving methods and renewable energy technologies play an essential role in assessment schemes to find more sustainable energy use. Although Palestinian schools do not use heating or cooling systems such as HVAC, they were included in the assessment. This is because, in line with future aspirations, it is possible to use these resources to increase the comfort of students and school staff.
Water Efficiency
Due to population growth and the resulting increase in demand for this resource, there is growing concern about water scarcity. Therefore, the rational use of water in buildings is becoming increasingly necessary. Schools are among the types of buildings that consume large amounts of water []. Therefore, in this category, water consumption must be reduced by eliminating potable water use in landscaping, innovative treatment and reuse of water, and reducing the use of municipal water supply.
Energy and water efficiency benefits schools in many ways: financially, educationally, socially, and environmentally:
- It reduces water and energy costs so that more can be done with the school budget.
- It provides excellent leadership opportunities and hands-on learning activities for students.
- It builds a strong school culture based on good communication and shared goals.
- It contributes to a better environment through efficient energy and water use, and individuals can do their part to build a better and more sustainable planet now and in the future.
Indoor Environmental Quality (IEQ)
Within educational settings, the effects of IEQ factors on students’ health, well-being, and academic performance are significant []. The IEQ includes thermal comfort, indoor air quality, acoustic comfort, visual comfort, and safety. Ref. [] showed that getting plenty of daylight improved the students’ performance by 7% to 18%. Inadequate lighting can disrupt circadian rhythms, affecting hormone levels and the sleep–wake cycle. Children are more sensitive to temperatures than adults []. This sensitivity is attributed to their high metabolic rates and limited opportunities for adaptation in classroom environments.
Furthermore, research conducted by [] showed that children are more vulnerable to air pollutants than adults due to immature lung and metabolic. In addition, Ref. [] demonstrated that students were more productive and happy and learned more effectively when they were not distracted by noises from outside or from surrounding spaces and occupants. Poor IEQ in the classroom has been associated with decreased attention spans and adverse effects on memory and concentration among pupils.
Waste Management
Schools generally produce a wide range of waste, including food, paper, sanitary, electrical and electronic equipment (WEEE), plastics, furniture, and glass. In the UK, for example, elementary schools produce about 45 kg of waste per pupil, while secondary schools produce 22 kg per pupil []. This can be a unique challenge when it comes to managing everything in a convenient, sustainable, and cost-effective manner. Therefore, schools should prioritize reducing waste production and adopting a recycling culture. Waste separation, reduction, recycling, and composting are good options for waste management. Waste separation is the first step in school waste management. Labeled boxes should be available for glass, paper, plastic, cans, and organic waste. Recycling of waste within the school should be considered. Recycling grey water in schools reduces water consumption. Recycling informs good practices at work and at home.
Site Development
Site development is essential to building sustainability []. This category aims to reduce the building’s impact on ecosystems and promote landscaping. This category comprises three indicators: green spaces, the heat island effect, and shaded areas. Green spaces can significantly enhance children’s mental, physical, and social development from infancy to adulthood []. A green view from a school’s windows correlates with better academic performance and student concentration. Heat islands occur when there are dense concentrations of pavement, buildings, and other surfaces that absorb and retain heat. This effect increases energy costs (e.g., for air conditioning), air pollution, and heat-related illnesses. Therefore, materials with a low solar reflectance index (SRI) must be used to reduce the heat effect. The shading structure is an important and valuable addition to schools. Shading of outdoor areas can protect students and staff from the sun’s harmful UV rays and protect outdoor furniture and playground equipment from high temperatures. However, building these shade structures in a way that does not conflict with passive design strategies, such as allowing the sun into classrooms in the winter, is very important.
2.1.2. The PSR Social Indicators
The social aspect of the school is essential because, in school, we learn to live with and for society. However, the social dimension of schools is considered less frequently than the environmental and economic dimensions [,]. Therefore, the Palestinian school framework is clearly interested in the social aspect, which includes five criteria, namely social equity, health and comfort, social cohesion, accessibility, and teaching quality, as shown in Table 3.
Table 3.
The PSR social sustainable indicators for schools.
Social Equity
Equity reflects the goals being the same for all students, but the support needed to achieve those goals depends on the student’s needs []. Most schools focus on horizontal equity, meaning they treat students who are already considered equal similarly. However, in most schools, students come from different backgrounds, and some enjoy more privileges than others. Therefore, teachers must focus on vertical equity, where individual resources are provided based on student needs [].
This category can be achieved through two indicators: social inclusion and human-centered design. Social inclusion is the process of improving the conditions for student participation in schools and enhancing the abilities, opportunities, and dignity of disadvantaged people, particularly low-income students and those with disabilities. Human-centered design is a problem-solving approach that places education stakeholders at the center of the development process. The critical stakeholders needed in this approach are students, teachers, and parents.
Social Cohesion
This category focuses on the importance of the social and physical integration of the school into society. The school should promote participation and the preservation of traditions in society. This helps create a positive school culture for students and teachers []. Teachers are motivated to work when the school has a positive culture because they see the big picture, while students are in a better mental and emotional state to learn. This happens by focusing on social and extracurricular activities in school to maintain the cultural value of society and enhance a positive school culture.
Accessibility
This category concerns easy access to school, regardless of the type of transportation used. The school should be located as close as possible to public transportation services. This helps encourage the use of public transport rather than private transportation. In addition, this category focuses on the importance of providing car parks separate from student movement corridors, playgrounds, and other school facilities.
Teaching Quality
Quality instruction is one of the school’s main pillars for improving student achievement. Supporting each teacher in delivering quality instruction is critical to achieving the best outcomes for all students, especially the most disadvantaged. The success rate, attendance rate, and number of expulsions and dropouts are used to evaluate this category.
2.1.3. The PSR Economic Indicators
Education is the key to economic growth []. The purpose of education is to meet all kinds of demands and needs of both society and individuals. The relationship between education and the economy can be summarized as follows []: (i) education raises the manpower needed by the economy (contribution to production); (ii) there is a specific cost of operating and benefiting from the education service (training cost); (iii) education has an impact on income generation at the individual (micro) and societal (macro) levels; and (iv) education service has the property of being a commodity.
The effects of education on economic growth are assessed by two categories: annual operating costs on education and the index of unemployment rates with advanced education, as shown in Table 4.
Table 4.
The PSR economic indicators for schools.
Annual Operation Cost
Per-student spending in educational institutions is influenced by the cost of instructional materials and facilities, the number of students enrolled in the education system, teachers’ salaries, pension systems, and the programs offered (e.g., general education or vocational). In addition, policies to reduce average class sizes, attract talented teachers, or change staffing structures also affected per-pupil spending. Education expenditures include operating costs for energy, water, and maintenance. Here, of course, we are only concerned with the school level, so we have yet to include teachers’ salaries, for example, because this is the government’s responsibility at all levels of education, not just at the school level.
Impact on Local Economic
The employment rate is one of the most meaningful indicators of economic growth. Indeed, schools employ many teachers, administrators, and staff. Therefore, it is essential to develop an indicator that identifies the contribution of schools to creating jobs in society and helps reduce the unemployment rate. The importance of school production activities is the possibility of using school facilities after classes. Nationally, there are many attempts to use school facilities for childcare, entertainment activities, and vocational training centers. This helps students learn about economic growth and productivity meaningfully and strengthens schools’ role in serving society and individuals effectively and beneficially.
2.1.4. Comparison between the Palestinian School’s Framework and International Frameworks
Comparing the proposed framework for assessing sustainability in Palestinian schools with existing frameworks such as LEED for Schools, BREEAM Education, and SBTool for K-12 Schools, as shown in Figure 2, several important points can be highlighted:
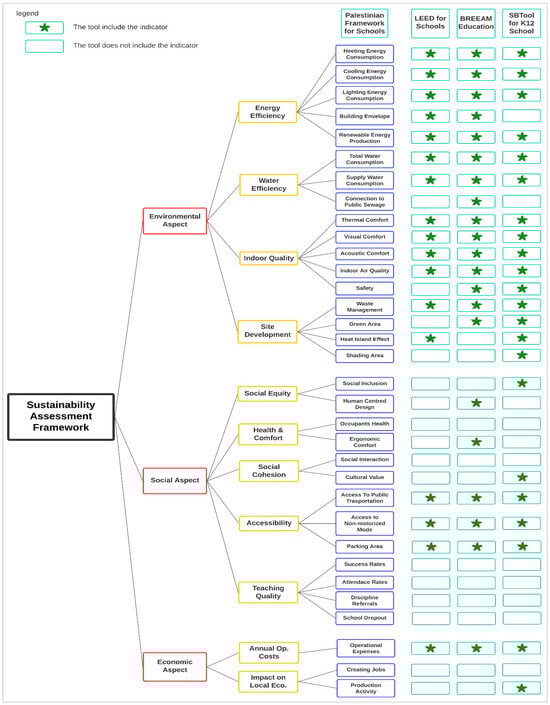
Figure 2.
Comparison between the school’s framework and international frameworks.
- The proposed Palestinian framework covers various environmental aspects that are consistent with other frameworks. Unlike other frameworks, it demonstrates a comprehensive approach to environmental sustainability.
- Unlike some existing frameworks, the proposed framework focuses on social aspects. It recognizes the importance of fostering a supportive and inclusive school environment that addresses the diverse needs of students and supports their well-being. This focus on social aspects is consistent with the overarching goal of holistic sustainability. However, it is essential to note that other frameworks include some social indicators, such as accessibility. The difficulty is that they are not placed in a separate and systematic category.
- Teaching quality is another crucial aspect of the proposed Palestinian framework. The framework emphasizes the critical role of educational outcomes in assessing sustainability. A school’s sustainability encompasses its infrastructure, educational effectiveness, and student achievement.
- Economic aspects are integrated into the proposed framework, as in the other frameworks, by assessing annual operating costs. Another important idea is the contribution to local economic development. Thus, the Palestinian framework addresses the practical aspect of sustainability.
In summary, the proposed framework for school sustainability assessment in Palestine is characterized by its holistic environmental, social, and economic coverage. This framework is compatible with existing international tools that consider the specific needs and challenges of schools in Palestine, thus promoting sustainable development in the education sector.
2.2. Application to Palestinian Schools
The proposed framework’s application to Palestinian schools is based on data collection using questionnaires and school data fields. Two questionnaires were used for data collection. The first targeted experts to determine the weighting of each indicator and its applicability to the local context of Palestine, while the second addressed school principals to obtain physical and social information about the schools. In the following sections, these steps are described in detail. The collected data are then used to determine a sustainability index and indicator weights using the AHP method. The following sections present the questionnaire for experts and the panel of experts involved in this research and data analysis using the AHP method and the sustainability index.
2.2.1. Experts’ Questionnaire
The experts’ questionnaire is used to determine the importance of each assessment indicator and its applicability to the local context of Palestine through the opinion of experts. This quantitative questionnaire consisted of closed questions in rating scales conducted to Palestinian experts. The questionnaire includes two parts. The first part focuses on collecting personal information from the respondents, including their background and experience with sustainable projects, etc. The second part focuses on the list of sustainability indicators and asks respondents to rate the importance of each indicator on a five-point scale: 1 = completely unimportant, 2 = unimportant, 3 = neutral, 4 = important, and 5 = very important. In addition, respondents can indicate additional evaluation points that they consider relevant, important, or missing.
Table 5 summarizes the profile of the twenty-eight (28) specialists. About 64% of them hold a doctoral degree. They cover the fields of energy, electrical engineering, architecture, civil engineering, and economics. Approximately 50% of the experts are architects. Experience is split approximately 50/50 between the public and private sectors. Additionally, 86% of experts have worked in the sustainability field for more than ten years.
Table 5.
The experts’ personal information.
2.2.2. School Field Data
The school questionnaire included four sections of closed questions about the academic year 2021–2022. The first section focuses on general information about the school, including school gender, grade level, location, number of students and staff, and construction date. The second section addresses the environmental and physical aspects of the schools, including energy-related issues, water and sanitation issues, and site development. The third section focuses on the social aspect, including teaching quality, student engagement, dropout rates, and accessibility. It aims to provide insights into the various social dimensions of schools. The final section addresses economic considerations. It includes questions about the number of new employees, annual maintenance, and school profit-making activities.
The questionnaire was conducted with school administrators because they comprehensively understand the school’s operations and policies. They provide general information about the school, socioeconomic issues, and environmental characteristics. Schools from the Tulkarm and Nablus governorates in the West Bank were selected for the application. This selection is due to the possibility of obtaining information and data from the Directorate of Education and Schools. Tulkarm governorate is in the northwestern part of the West Bank and borders the Mediterranean Sea to the west. Nablus Governorate is in the northern part of the West Bank. The region is characterized by rugged mountains, including Mount Gerizim and Mount Ebal, deep valleys, and fertile plains. Nablus is known for its historical and architectural heritage, including the well-preserved Old City with its traditional markets, narrow streets, and historic buildings. By including schools from Tulkarm and Nablus, we were able to cover both social and geographic diversity.
There are 409 public schools in these two governorates. Tulkarm has 141 schools with 43,115 students and 2193 teachers, while Nablus has 268 schools with 84,288 students and 4128 teachers.
2.2.3. Data Analysis Using the AHP Method
The objective of the data analysis is to rank the indicators based on experts’ opinions and determine their relative weight to calculate the overall sustainability score. The Analytic Hierarchy Process (AHP) method is used for this purpose. This method is a structured method for decision-making proposed by Thomas L. Saaty in the 1970s []. It provides a framework for complex decisions by decomposing them into a hierarchical structure and systematically evaluating the relative importance of criteria and alternatives. The calculation process in AHP includes the following steps []:
- Hierarchical structuring: identify the decision problem and divide it into a hierarchy of criteria and alternatives.
- Pairwise comparisons: using pairwise comparisons, evaluate the relative importance of the criteria and alternatives.
- Calculate the weights: calculate the criteria weights by summing the scores of the pairwise comparisons using matrix algebra.
- Consistency check: perform a consistency check to ensure the reliability of the judgments. The consistency ratio (CR) is calculated to evaluate the consistency of the pairwise comparisons. The judgments may need to be revised if the CR exceeds a predetermined threshold (usually 0.1).
- Aggregation and decision-making: to obtain an overall score or ranking, aggregate the weights of the criteria and alternatives. To do this, multiply the criteria weights by the corresponding ratings of the other options and add them together.
2.2.4. Data Analysis Using the Sustainability Index
The sustainability index is a metric designed to measure and assess the overall sustainability performance of a system, organization, or entity. It provides a quantitative representation of how well a system meets environmental, social, and economic objectives, often considering various indicators within these dimensions. Calculating a sustainability index typically involves the following steps:
- Define Indicators: identify indicators representing critical sustainability aspects in the selected context.
- Assign Weights: assign weights to each indicator based on its relative importance in contributing to overall sustainability.
- Data Collection: collect quantitative data for each indicator and ensure the data are accurate, up-to-date, and relevant to the indicators.
- Normalization: normalize the data to bring all indicators to a comparable scale. This step is crucial when the indicators have different units of measurement or magnitudes.
- Score Calculation: calculate the sustainability index using a formula that combines the normalized values of each indicator with the assigned weights. Scores typically exist on a scale, e.g., 0 to 100.
- Interpretation: interpret the sustainability index to understand the overall sustainability performance. Higher values generally indicate better sustainability performance.
3. Results and Discussion
This section first presents the experts’ opinions and how they were used to weight the indicators and assess the sustainability of a group of schools using the sustainability index.
3.1. Expert Responses
A group of twenty-eight Palestinian experts evaluated the set of indicators, and Table 6 shows the results graphically in the form of a heatmap. According to this heatmap, nearly 86% of experts gave the set of indicators high ratings (score of 4 or 5), while only 12% gave it an average level of 3. According to experts, this result confirms the indicators’ importance, comprehensiveness, and applicability for sustainability assessment in Palestinian schools. The total scores had a standard deviation of 7 and a mean of 120, ranging from 108 (heat island effect) to 135 (social inclusion).
3.2. Categories and Indicators’ Weights
As shown in Figure 3, experts gave the greatest weight—46%—to categories related to the social component. This is consistent with the goals of the Palestinian education system. The first goal of the Palestinian Ministry of Education’s strategic plan (2021–2023) is to ensure everyone’s access to education in a safe, equitable, and comprehensive manner. The second goal is to raise the level of education by raising standards, strengthening procedures and inputs, evaluating results, and creating systems to track progress []. The importance of the environmental aspect of the school can be observed in second place in terms of energy and water consumption, the quality of the internal environment, and the site’s sustainability. Third place was assigned for the economic aspect with 17%. This means that when we expand the social category, we can direct the attention of experts toward it and achieve a balance between the three aspects, which is the primary goal of the framework.
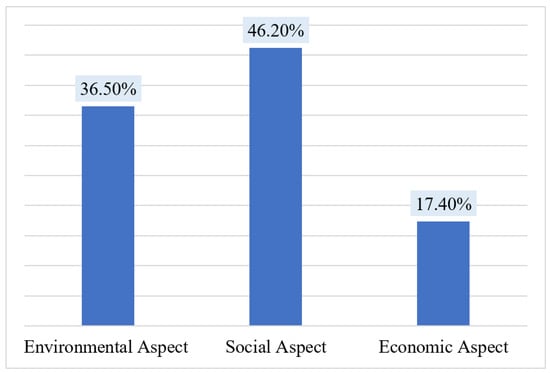
Figure 3.
The weight of sustainability pillars is based on experts’ responses.
Table 6.
Heatmap results for each indicator are based on expert responses [].
Table 6.
Heatmap results for each indicator are based on expert responses [].
| Aspect | Category | Indicator | ID | Scale for Quantitative Parameters | Global Score | ||||
|---|---|---|---|---|---|---|---|---|---|
| 1 to 5 (1 Less Important, 5 More Important) | |||||||||
| 1 | 2 | 3 | 4 | 5 | |||||
| Environmental Aspect | Energy Use Efficiency | Heating Energy Consumption | P1 | 0 | 1 | 1 | 10 | 16 | 125 |
| Cooling Energy Consumption | P2 | 0 | 2 | 3 | 11 | 12 | 117 | ||
| Lighting Energy Consumption | P3 | 0 | 4 | 3 | 11 | 10 | 111 | ||
| Building Envelope Insulation | P4 | 0 | 1 | 1 | 8 | 18 | 127 | ||
| Renewable Energy Production | P5 | 0 | 0 | 6 | 6 | 16 | 122 | ||
| Water Use Efficiency | Total Water Consumption | P6 | 0 | 0 | 0 | 12 | 16 | 128 | |
| Water Harvesting and Greywater Recycling | P7 | 0 | 0 | 7 | 11 | 10 | 115 | ||
| Connection to Public Sewage | P8 | 0 | 2 | 7 | 8 | 11 | 112 | ||
| Indoor Quality | Thermal Comfort | P9 | 0 | 0 | 2 | 10 | 16 | 126 | |
| Visual Comfort | P10 | 0 | 0 | 3 | 12 | 13 | 122 | ||
| Acoustic Comfort | P11 | 0 | 1 | 3 | 11 | 13 | 120 | ||
| Indoor Air Quality | P12 | 0 | 0 | 1 | 5 | 22 | 133 | ||
| Safety and Security | P13 | 0 | 1 | 1 | 8 | 18 | 127 | ||
| Site Development | Waste Management Strategies | P14 | 0 | 1 | 0 | 20 | 7 | 117 | |
| Green Areas | P15 | 0 | 0 | 3 | 9 | 16 | 125 | ||
| Heat Island Effect | P16 | 0 | 1 | 7 | 15 | 5 | 108 | ||
| Shading Area | P17 | 0 | 0 | 3 | 15 | 10 | 119 | ||
| Social Aspect | Social Equity | Social Inclusion | P18 | 0 | 0 | 1 | 3 | 24 | 135 |
| Human Centred Design | P19 | 0 | 0 | 2 | 18 | 8 | 118 | ||
| Health and Comfort | Occupants Health | P20 | 0 | 0 | 0 | 7 | 21 | 133 | |
| Ergonomic Comfort | P21 | 0 | 1 | 3 | 12 | 12 | 119 | ||
| Social Cohesion | Social Interaction | P22 | 0 | 0 | 2 | 15 | 11 | 121 | |
| Cultural Value | P23 | 0 | 0 | 3 | 11 | 14 | 123 | ||
| Accessibility | Access to Public Transportation | P24 | 0 | 0 | 1 | 12 | 15 | 126 | |
| Access to non-motorized | P25 | 0 | 0 | 4 | 11 | 13 | 121 | ||
| Parking Area | P26 | 0 | 2 | 1 | 15 | 10 | 117 | ||
| Teaching Quality | Success Rate | P27 | 0 | 0 | 4 | 16 | 8 | 116 | |
| Attendance Rate | P28 | 0 | 0 | 4 | 14 | 10 | 118 | ||
| School Dropout | P29 | 0 | 2 | 7 | 11 | 8 | 109 | ||
| Discipline Referrals | P30 | 0 | 3 | 6 | 10 | 9 | 109 | ||
| Economic Aspect | Annual Operating Costs | Operational Energy Expenses | P31 | 0 | 1 | 5 | 13 | 9 | 114 |
| Operational Water Expenses | P32 | 0 | 1 | 5 | 15 | 7 | 112 | ||
| Maintenance Cost | P33 | 0 | 0 | 4 | 15 | 9 | 117 | ||
| Influence on Local Economy | Creating Jobs/Employment | P34 | 0 | 0 | 6 | 9 | 13 | 119 | |
| Social Activity | P35 | 0 | 2 | 7 | 10 | 9 | 110 | ||
Table 7 shows the AHP matrix and category weights. The consistency ratio (CR) for this matrix is 5.90, which is less than 10%. “Social Equity” received the highest weighting of 9.63%, while “Quality of Teaching” received the lowest of 8.57%.
Table 7.
The AHP matrix according to the experts’ opinions.
Table 8 displays the order and weighting of the indicators. “Social inclusion” is the most important factor, weighing 3.22%. This measure evaluates how well a public school can serve low-income and disabled students. It draws attention to a school’s vital role in promoting social equity and justice, which is one of the main goals of pursuing sustainable education. Next come the “Occupant Health” and “Indoor Air Quality” scores, which have identical scores. The most important concept of sustainability is providing a healthy indoor environment for students, as explained.
Table 8.
The weights of indicators by applying AHP method.
The weighting of the indicators is consistent with the concepts of sustainability and the context of the schools in Palestine. For example, “insulation of the building envelope” and “shading of the exterior facades” are of greater importance than “renewable energy generation” since energy conservation is better than the generation of the alternative. Similarly, “energy use for cooling” is considered less important than “energy use for heating” because schools are generally not operational during the summer. The same logic applies to the “heat island effect” indicator.
Experts attach great importance to indoor environment quality. Notably, the indicators related to indoor quality occupy a place in the upper half of the priority list. For example, the “indoor air quality” indicator ranks second across all criteria. It is followed by “Safety”, “Thermal Comfort”, “Visual Comfort”, and finally, “Acoustic Comfort”, which ranks 16th out of a total of 35 indicators. This underscores the importance of indoor quality for students and school staff and highlights the profound impact these indicators have on health and educational outcomes. Consequently, they play a critical role in shaping the nation’s future and the next generation.
According to experts, “access to public transportation” is crucial since public school facilities must be easily accessible via these services. Social indicators, such as “cultural value”, “social interaction”, “access to non-motorized transportation”, “ergonomic comfort”, and “human-centered design”, are generally more valuable than environmental and economic indicators. Regarding the economic component, measures related to “job creation” receive greater weight than those related to “operation and maintenance costs”. This underscores how important schools are to society as active and productive institutions.
3.3. Application to Schools
Data were collected from 40 schools from Tulkarm and 14 schools from Nablus, including 37 elementary schools and 17 secondary schools, as shown in Figure 4. Secondary schools included 9 scientific secondary schools, 13 literary secondary schools, 1 industrial school, and 4 schools focused on entrepreneurship and business. Regarding gender, there were 26 schools for girls, 19 for boys, and 9 for both genders at the primary level. In addition, schools from different geographic areas were included in the data collection: Villages (13), cities (6), and large towns (35). In terms of the construction date, the selected schools showed a wide range, with the oldest school established in 1908 and the youngest in 2020. The average building area is 1395 m2 and the median is 1002 m2, while the mode value is 1200, indicating the most frequent occurrence of this value in the dataset. The range value is 7395, illustrating significant variability in school building square footage in the selected group. This range results in varying student population densities, ranging from 0.07 to 1.82 students/m2, with an average of 0.42 students/m2.
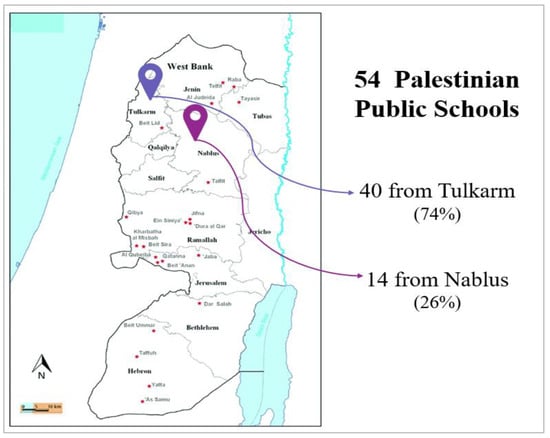
Figure 4.
The location of selected schools.
3.4. Sustainability Index for Schools
Figure 5 shows the sustainability index values obtained from the sample of Palestinian schools. These values range from a minimum of 0.229 to a maximum of 0.479, with a mean value of 0.343. These values indicate the extent to which schools in Palestine adopt sustainable practices, with higher index values indicating higher levels of sustainability. We notice a difference in sustainability performance between schools, but generally, sustainability is very low, at less than 50%. At the same time, it is better than the worst value, which is 0. This shows that progress is being made towards sustainability, although there is still room for improvement in social, environmental, and economic aspects. Here, we notice an important aspect: The school that achieved the highest sustainability index is the school that achieved a balanced approach to the three pillars of sustainability. In contrast, this school, which ranked 7, received the highest score for social performance, while the overall performance was very low due to ignoring the environmental and economic aspects. Instead of focusing only on excellence in a specific category, all indicators should be considered satisfactorily.
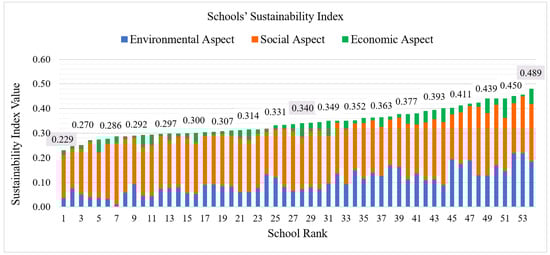
Figure 5.
The sustainability index values for Palestinian public schools.
These findings suggest that the policies or measures implemented by the Palestinian education system support sustainability to some extent and that schools are committed to adhering to these policies. However, more effort and commitment are needed to increase the overall level of sustainability in Palestinian schools. This indicates that further improvements and initiatives are required to strengthen sustainability practices and ensure more consistent and comprehensive implementation throughout the education system.
According to the results presented in Figure 6, the sustainability index for secondary schools is very close to that of primary schools (6% lower). This contradicts the concept that secondary schools, being more aware and responsible, will exhibit higher levels of sustainability. However, the reason behind this discrepancy is that social rather than environmental indicators primarily influence the sustainability of primary schools. While secondary schools show significantly lower energy and water consumption, primary schools excel in social inclusion, which is very important according to the expert opinions presented earlier. Regarding school gender, there is no noticeable difference between female and male schools regarding sustainability. This is because these schools have an apparent convergence regarding all sustainability aspects, including environmental, social, and economic.
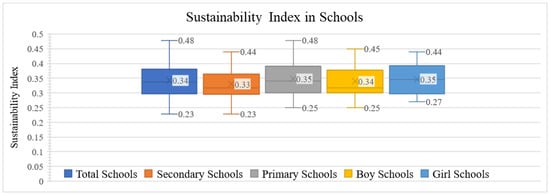
Figure 6.
The sustainability index with the schools’ grade and gender.
4. Conclusions
This paper presented a comprehensive framework for assessing the sustainability of public schools in conflict areas, focusing on the West Bank in Palestine. The framework is based on a review of international standards and their adaptation to the Palestinian context through local experts’ opinions. It comprises 35 indicators across 11 sustainability categories: energy efficiency, water efficiency, indoor quality, site development, social equity, health and comfort, social cohesion, accessibility, instructional quality, impact on local economies, and annual operating costs. The framework uses the Sustainability Index as a global indicator of sustainability in schools.
The framework was applied to assess 54 schools in the Palestinian territory. The results show a low overall sustainability level. Girls’ schools have a slight advantage over boys’ schools due to their higher social inclusion. Likewise, primary schools outperform secondary schools in terms of overall sustainability, although the latter has a clear advantage in the environmental area. The results underscore the importance of social indicators in influencing and determining the overall sustainability of schools, especially social inclusion.
This research suggests some recommendations for improving the schools’ sustainability, particularly implementing green building principles, using renewable energy sources, fostering social inclusion, and attracting local organizations to enhance schools’ economic situations.
Although this study was limited to 54 schools, it provides a foundation for future research by expanding its application to a larger geographic scope and including experts with more social and economic experts. In addition, this research has not addressed the new challenges in the Palestinian territories, particularly in Gaza. Future research should consider these new and complex challenges to adapt the proposed framework to the imperative of rapid but sustainable reconstruction of the education infrastructure, considering the geopolitical context, the vast destruction, and the urgent need of the population for essential services.
Author Contributions
Conceptualization, A.B.; methodology, A.B.; software, A.B. and M.B.; validation, A.B. and M.B.; formal analysis, A.B. and M.B.; resources, A.B. and M.B.; data curation, A.B.; writing—original draft, A.B.; writing—review and editing, I.S.; visualization, A.B.; supervision, I.S.; project administration, I.S.; funding acquisition, I.S. All authors have read and agreed to the published version of the manuscript.
Funding
We would like to acknowledge the financial support of The General Consulate of France in Jerusalem for funding the Ph.D. studies of the first author, and the support of the authors through “ALMAQDISI” program.
Institutional Review Board Statement
This study was reviewed by the An-Najah National University IRB committee and was approved on 29 April 2024.
Informed Consent Statement
Not applicable.
Data Availability Statement
The original contributions presented in the study are included in the article, further inquiries can be directed to the corresponding authors.
Conflicts of Interest
The authors declare no conflicts of interest.
References
- Hidayat, Y.A.; Rohman, M.A.; Utomo, C. Social sustainability indicators for school buildings in Surabaya. In IOP Conference Series: Earth and Environmental Science, Proceedings of the International Conference on Planning towards Sustainability (ICoPS) 2019, Surakarta, Indonesia, 6–7 November 2019; IOP Publishing: Bristol, UK, 2020; Volume 447, p. 447. [Google Scholar] [CrossRef]
- Figueiró, P.S.; Neutzling, D.; Lessa, B. Education for sustainability in higher education institutions: A multi-perspective proposal with a focus on management education. J. Clean. Prod. 2022, 339, 130539. [Google Scholar] [CrossRef]
- Bosevska, J.; Kriewaldt, J. Fostering a whole-school approach to sustainability: Learning from one school’s journey towards sustainable education. Int. Res. Geogr. Environ. Educ. 2019, 29, 55–73. [Google Scholar] [CrossRef]
- Mogren, A.; Gericke, N.; Scherp, H.Å. Whole school approaches to education for sustainable development: A model that links to school improvement. Environ. Educ. Res. 2019, 25, 508–531. [Google Scholar] [CrossRef]
- Ministry of Education and Higher Education. Education Sector Strategic Plan 2017–2022; Ministry of Education and Higher Education: Doha, Qatar, 2017. [Google Scholar]
- MacKenzie, A.; Bower, C.; Owaineh, M. Barriers to Effective, Equitable and Quality Education. Int. J. Child. Rights 2020, 28, 805–832. [Google Scholar] [CrossRef]
- Abu Hamed, T.; Peric, K. The role of renewable energy resources in alleviating energy poverty in Palestine. Renew. Energy Focus 2020, 35, 97–107. [Google Scholar] [CrossRef]
- Said, N. An Overview of Green Buildings Potential in Palestine. Int. J. Sustain. Green Energy 2019, 8, 20. [Google Scholar] [CrossRef]
- Kahriman-Pamuk, D.; Uzun, N.B.; Yıldız, T.G.; Haktanır, G. Reliability of Indicators Measuring Early Childhood Education for Sustainability: A Study in Turkey Using Generalizability Theory. Int. J. Early Child. 2019, 51, 193–206. [Google Scholar] [CrossRef]
- Council, U.S.G.B. Reference Guide for Building Operations and Maintenance, 4th ed.; U.S. Green Building Council: Washington, DC, USA, 2019. [Google Scholar]
- Saraiva, T.; Almeida, M.G. Sustainability Assessment of High School Buildings in Portugal SAHSB PT; Editora Espaço Acadêmico: Goiânia, Brazil, 2020. [Google Scholar]
- Atanda, O.J.; Öztürk, A. Social criteria of sustainable development in relation to green building assessment tools. Environ. Dev. Sustain. 2020, 22, 61–87. [Google Scholar] [CrossRef]
- Illankoon, C.S.; Tam, V.W.Y.; Le, K.N. Environmental, economic, and social parameters in international green building rating tools. J. Prof. Issues Eng. Educ. Pract. 2017, 143, 05016010. [Google Scholar] [CrossRef]
- Alhilli, H.K.; Burhan, A.M. Developing a system for assessing the sustainability in school building projects in school building projects. Environ. Dev. Sustain. 2021, 23, 17483–17502. [Google Scholar] [CrossRef]
- Saraiva, T.; Almeida, M.G.; Bragança, L. Adaptation of the SBTool for Sustainability Assessment of High School Buildings in Portugal—SAHSBPT. Appl. Sci. 2020, 9, 2664. [Google Scholar] [CrossRef]
- Harb, S.; Elhaggar, S.M.; Sewilam, H. Developing sustainable school guidelines: The case of Egypt. In Proceedings of the 2018 6th International Conference on Environment Pollution and Prevention (ICEPP 2018), Brisbane, Australia, 6–8 December 2018; pp. 2–8. [Google Scholar] [CrossRef]
- Lu, X.; Lu, J.; Yang, X.; Chen, X. Assessment of Urban Mobility via a Pressure-State-Response (PSR) Model with the IVIF-AHP and FCE Methods: A Case Study of Beijing, China. Sustainability 2022, 14, 3112. [Google Scholar] [CrossRef]
- Wang, F.; Lu, Y.; Li, J.; Ni, J. Evaluating environmentally sustainable development based on the psr framework and variable weigh analytic hierarchy process. Int. J. Environ. Res. Public Health 2021, 18, 2836. [Google Scholar] [CrossRef] [PubMed]
- Kamaruzzaman, S.N.; Lou, E.C.W.; Zainon, N.; Mohamed Zaid, N.S.; Wong, P.F. Environmental assessment schemes for non-domestic building refurbishment in the Malaysian context. Ecol. Indic. 2016, 69, 548–558. [Google Scholar] [CrossRef]
- Antunes, L.N.; Ghisi, E. Water and energy consumption in schools: Case studies in Brazil. Environ. Dev. Sustain. 2020, 22, 4225–4249. [Google Scholar] [CrossRef]
- Carton, Q.; De Coninck, S.; Kolarik, J.; Breesch, H. Assessing the effect of a classroom IEQ on student satisfaction, engagement and performance. In Proceedings of the 11th International Conference on Indoor Air Quality, Ventilation & Energy Conservation in Buildings, Tokyo, Japan, 20–23 May 2023; Volume 396, p. 01052. [Google Scholar] [CrossRef]
- Vijapur, D.; Candido, C.; Göçer, Ö. A Ten-Year Review of Primary School Flexible Learning Environments: Interior Design and IEQ Performance. Build. Rev. 2021, 11, 183. [Google Scholar] [CrossRef]
- Kim, J.; Dear, R. De: Thermal comfort expectations and adaptive behavioural characteristics of primary and secondary school students. Build. Environ. 2018, 127, 13–22. [Google Scholar] [CrossRef]
- Shree, V.; Marwaha, B.M.; Awasthi, P. Indoor Air Quality Investigation at Primary Classrooms in Hamirpur, Himachal Pradesh, India. Hydro Nepal J. Water Energy Environ. 2019, 24, 45–48. [Google Scholar] [CrossRef]
- Baghdadi, R. The relationship between Green education and sustainable development in Palestinian educational institutions. J. Posit. Sch. Psychol. 2022, 6, 541–561. [Google Scholar]
- Department for Environment Food & Rural Affairs. Our Waste, Our Resources: A Strategy for England; Department for Environment Food & Rural Affairs: London, UK, 2018. [Google Scholar]
- Armenia, U. Economic and Social Council. In The Oxford Handbook on the United Nations; Oxford University Press: Oxford, UK, 2021. [Google Scholar] [CrossRef]
- Stender, M.; Walter, A. The role of social sustainability in building assessment. Build. Res. Inf. 2019, 47, 598–610. [Google Scholar] [CrossRef]
- Sierra, L.A.; Yepes, V.; Pellicer, E. A review of multi-criteria assessment of the social sustainability of infrastructures. J. Clean. Prod. 2018, 187, 496–513. [Google Scholar] [CrossRef]
- Jurado de los Santos, P.; Moreno-Guerrero, A.-J.; Marín-Marín, J.-A.; Soler Costa, R. The term equity in education: A literature review with scientific mapping in web of science. Int. J. Environ. Res. Public Health 2020, 17, 3526. [Google Scholar] [CrossRef] [PubMed]
- Ainscow, M. Promoting inclusion and equity in education: Lessons from international experiences. Nord. J. Stud. Educ. Policy 2020, 6, 7–16. [Google Scholar] [CrossRef]
- Amtu, O.; Makulua, K.; Matital, J.; Pattiruhu, C.M. Improving student learning outcomes through school culture, work motivation and teacher performance. Int. J. Instr. 2020, 13, 885–902. [Google Scholar] [CrossRef]
- Shahzad, S.; Yasin, A.; Luqman, M. Human Capital the Key to Economic Growth: Some New Evidence from Selected Developing Countries. J. Bus. Soc. Rev. Emerg. Econ. 2022, 8, 61–70. [Google Scholar] [CrossRef]
- Pekkolay, S. Relationship between Education and Economy. Int. J. Sci. Res. 2021, 10, SR21915013223. [Google Scholar]
- Darko, A.; Chan, A.P.C.; Ameyaw, E.E.; Owusu, E.K.; Pärn, E.; Edwards, D.J. Review of application of analytic hierarchy process (AHP) in construction. Int. J. Constr. Manag. 2019, 19, 436–452. [Google Scholar] [CrossRef]
- Levon, R. Hayrapetyan: Random Consistency Indices for Analytic Hierarchy Processes. Int. J.Bus. Mark. Decis. Sci. 2019, 12, 31–43. [Google Scholar]
- Ministry of Education and Higher Education. Education Sector Strategic Plan 2021–2023/Palestine; Ministry of Education and Higher Education: Doha, Qatar, 2021. [Google Scholar]
- Baba, A.; Shahrour, I.; Baba, M.; Sadek, M. Sustainability Assessment of Public Schools in the Palestinian Territory. In Innovations in Smart Cities Applications Volume 7, Proceedings of the 8th International Conference on Smart City Applications (SCA2023), Paris, France, 4–6 October 2023; Lecture Notes in Networks and Systems, Volume 906; Ben Ahmed, M., Boudhir, A.A., El Meouche, R., Karaș, İ.R., Eds.; Springer: Cham, Switzerland, 2024. [Google Scholar] [CrossRef]
Disclaimer/Publisher’s Note: The statements, opinions and data contained in all publications are solely those of the individual author(s) and contributor(s) and not of MDPI and/or the editor(s). MDPI and/or the editor(s) disclaim responsibility for any injury to people or property resulting from any ideas, methods, instructions or products referred to in the content. |
© 2024 by the authors. Licensee MDPI, Basel, Switzerland. This article is an open access article distributed under the terms and conditions of the Creative Commons Attribution (CC BY) license (https://creativecommons.org/licenses/by/4.0/).