Key Traits of Leading Sustainable Firms in the Semiconductor Industry


Abstract
1. Introduction
2. Literature Review
2.1. Trends in Research on Sustainability Performance
2.2. Trends in Sustainability within the Semiconductor Industry
2.3. Trends in Research on Sustainability Reporting
2.4. Trends in Sustainability Reporting within the Semiconductor Industry
3. Materials and Methods
3.1. Analysis Subject and Research Procedure
3.2. Data Collection
3.3. Data Preprocessing
3.4. First Network Analysis
3.5. Criteria Mapping
3.6. Second Network Analysis
4. Results
4.1. Centrality Analysis
4.2. Weighting Keywords
4.3. Keyword Mapping with the Sustainability Criteria
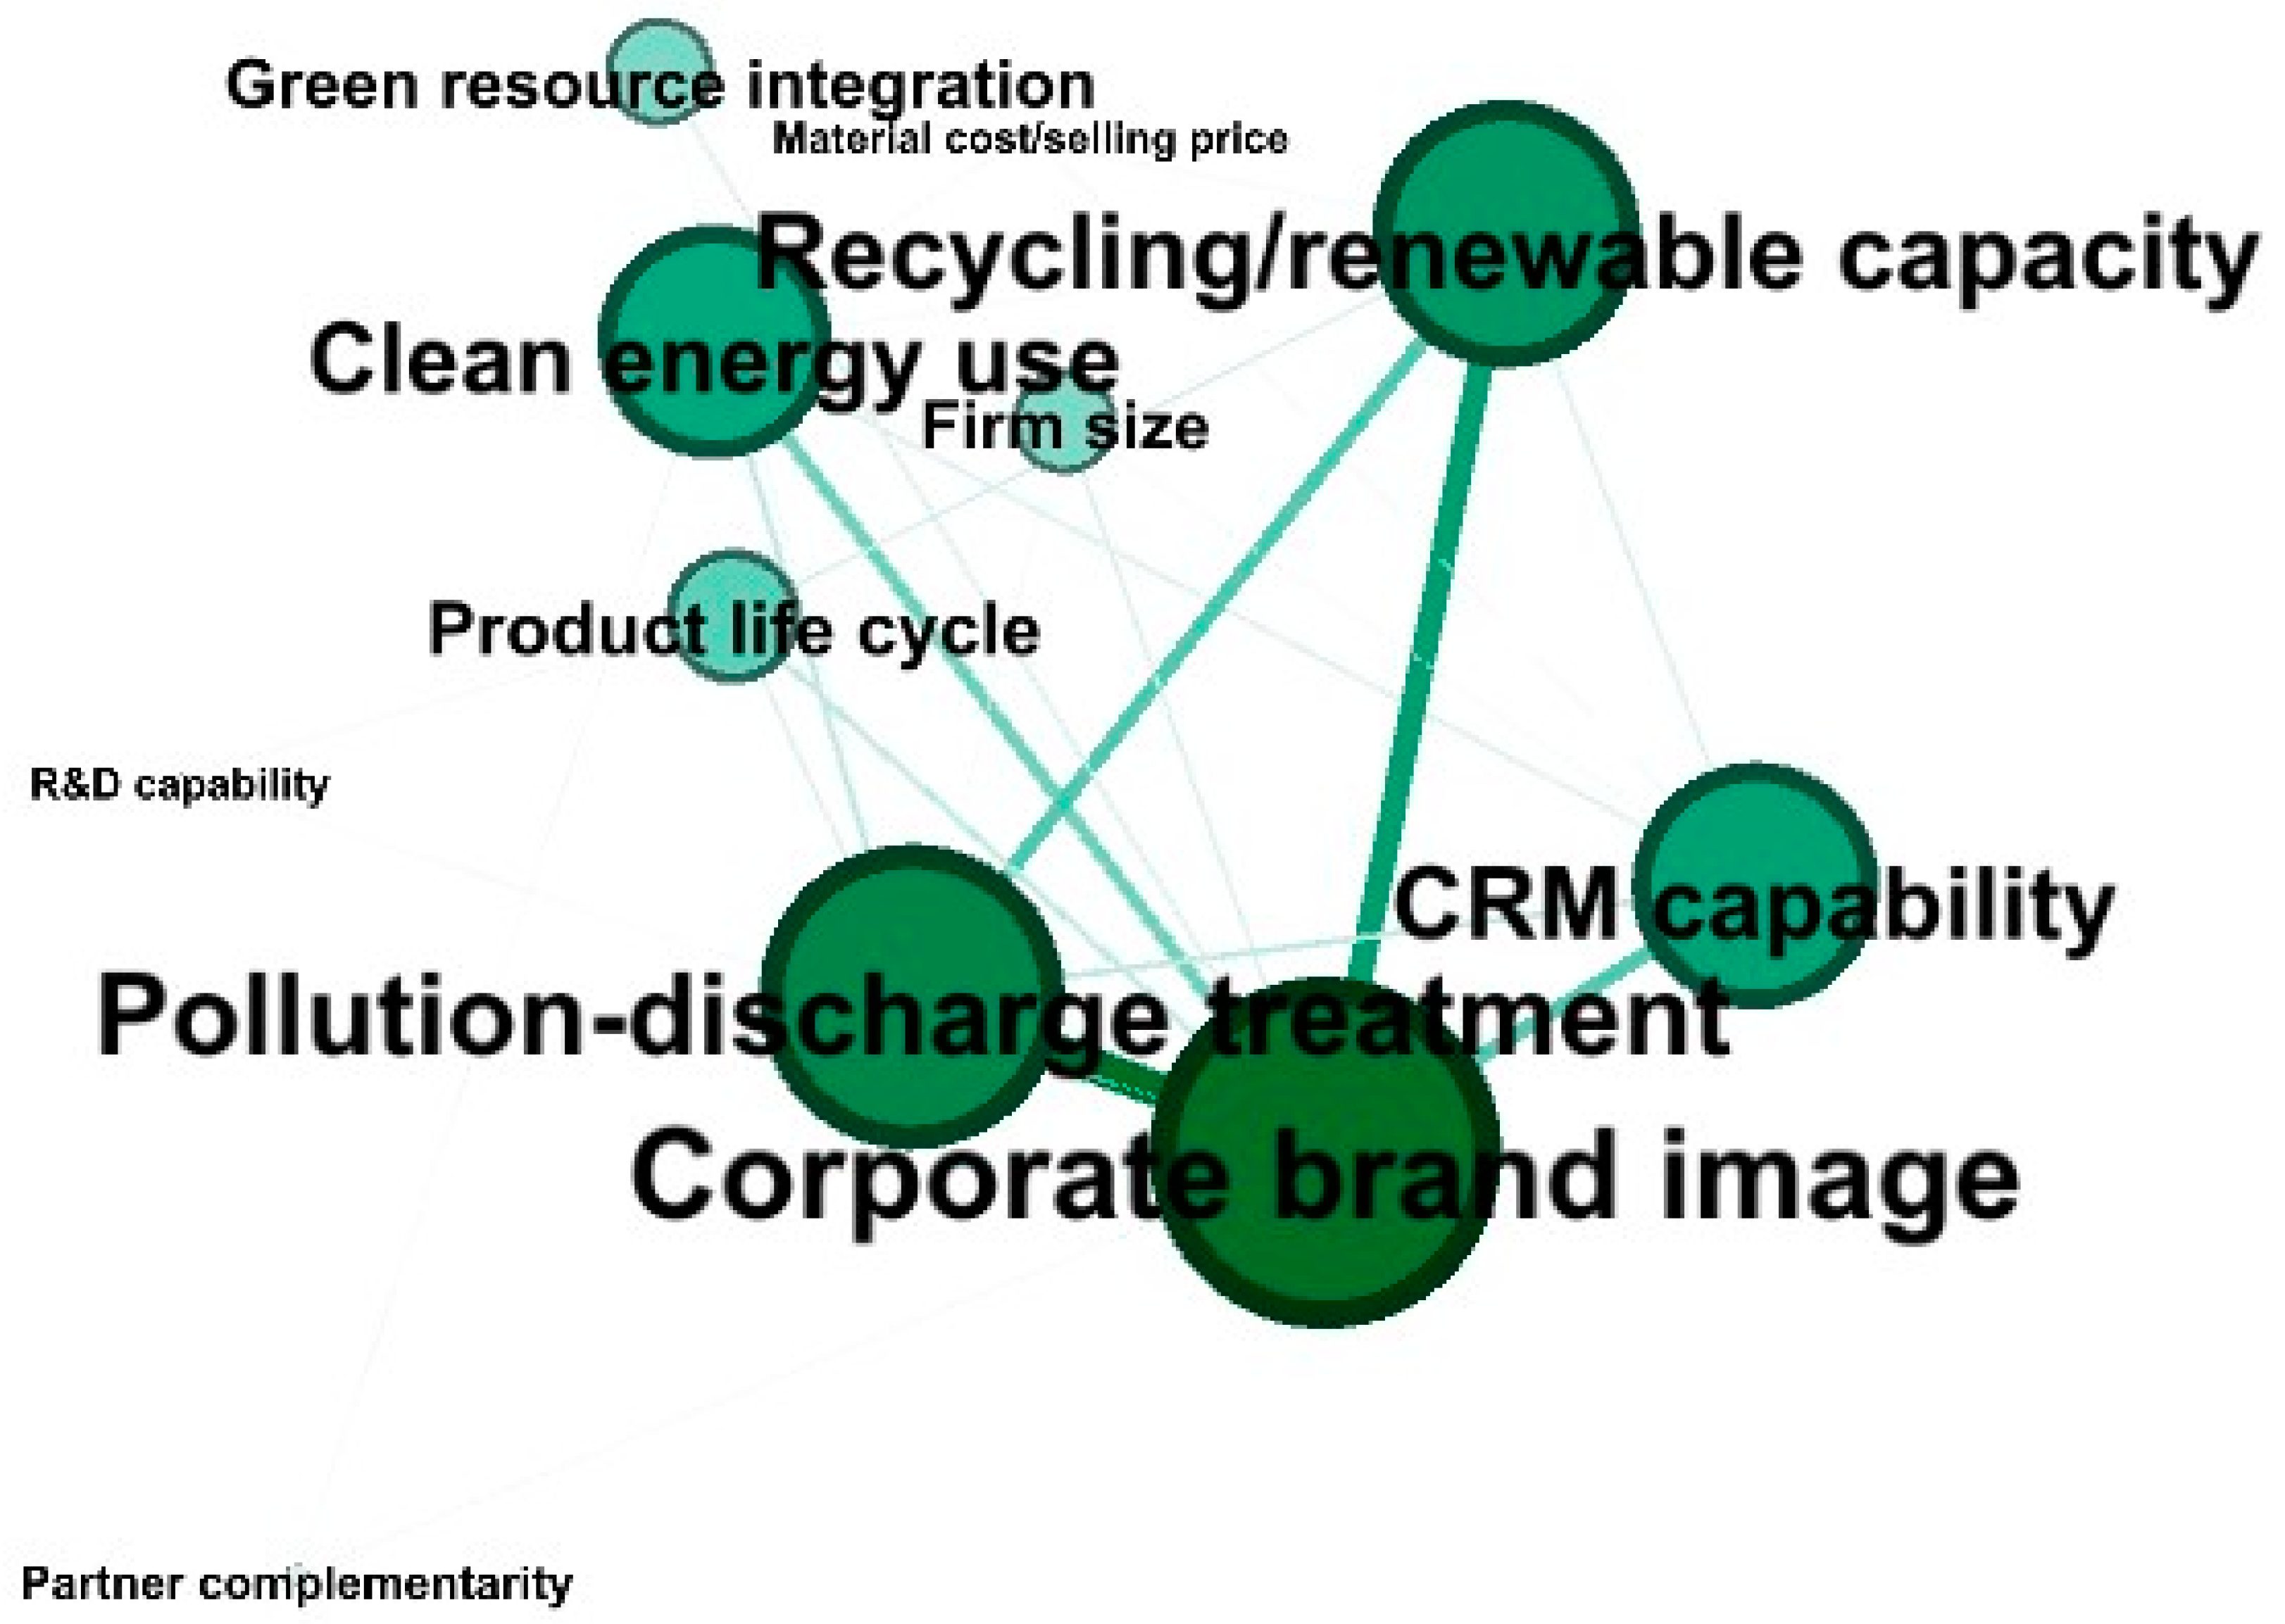
4.4. Criteria-Based Network Analysis and Visualization
5. Discussion
5.1. First Network Analysis Result
5.2. Second Network Analysis Result
6. Conclusions
6.1. Implications
6.2. Limitations and Future Research Directions
Author Contributions
Funding
Institutional Review Board Statement
Informed Consent Statement
Data Availability Statement
Conflicts of Interest
Appendix A

| No. | Company Name | HQ Location | ESG Risk |
|---|---|---|---|
| 1 | Applied Materials | Santa Clara, CA, USA | Low |
| 2 | Lam Research Corp. | Fremont, CA, USA | Low |
| 3 | NVIDIA Corp. | Santa Clara, CA, USA | Low |
| 4 | Semtech Corp. | Camarillo, CA, USA | Low |
| 5 | SÜSS MicroTec | Garching, Germany | Low |
| 6 | Topco Scientific Co. | Taipei, Taiwan | Low |
| 7 | Vitrox Corp. | Penang, Malaysia | Low |
| 8 | Kulicke & Soffa Industries | Singapore, Singapore | Low |
| 9 | Axcelis Technologies | Beverly, CA, USA | Low |
| 10 | Infineon Technologies | Neubiberg, Germany | Low |
| 11 | Taiwan Semiconductor Manufacturing Co., Ltd. | Hsinchu, Taiwan | Low |
| 12 | Advanced Micro Devices | Santa Clara, CA, USA | Low |
| 13 | GLOBALFOUNDRIES | Austin, TX, USA | Low |
| 14 | United Microelectronics Corp. | Hsinchu, Taiwan | Low |
| 15 | QUALCOMM | San Diego, CA, USA | Low |
| 16 | Array Technologies | Albuquerque, NM, USA | Low |
| 17 | Cirrus Logic | Austin, TX, USA | Low |
| 18 | Asmedia Technology Inc. | Taipei, Taiwan | Low |
| 19 | STMicroelectronics | Geneve, Switzerland | Low |
| 20 | Advantest Corp. | San Jose, CA, USA | Low |
| 21 | Ichor Holdings Ltd. | Fremont, CA, USA | Low |
| 22 | Tokyo Seimitsu Co., Ltd. | Tokyo, Japan | Low |
| 23 | ASPEED Technology | Hsinchu, Taiwan | Low |
| 24 | Global Unichip Corp. | Hsinchu, Taiwan | Low |
| 25 | Marvell Technology | Wilmington, DE, USA | Low |
| 26 | Siltronic | München, Germany | Low |
| 27 | Teradyne | North Reading, MA, USA | Low |
| 28 | First Solar | Tempe, AZ, USA | Low |
| 29 | Powertech Technology | Hsinchu, Taiwan | Low |
| 30 | KLA Corp. | San Diego, CA, USA | Low |
| 31 | Intel Corp. | Santa Clara, CA, USA | Low |
| 32 | AEM Holdings Ltd. | Singapore, Singapore | Low |
| 33 | Wafer Works Corp. | Taoyuan, Taiwan | Low |
| 34 | Silicon Laboratories | Austin, TX, USA | Low |
| 35 | LX Semicon Co., Ltd. | Daejeon, Republic of Korea | Low |
| 36 | Amkor Technology | Tempe, AZ, USA | Low |
| 37 | Advanced Energy Industries | Denver, CO, USA | Low |
| 38 | Nova Ltd. | Rehovot, Israel | Low |
| 39 | Novatek Microelectronics Corp. | Hsinchu, Taiwan | Low |
| 40 | Realtek Semiconductor Corp. | Hsinchu, Taiwan | Low |
| 41 | SK hynix | Icheon, Republic of Korea | Low |
| 42 | Nexperia B.V. | Nijmegen, The Netherlands | Low |
| 43 | AP Memory Technology Corp. | Hsinchu, Taiwan | Low |
| 44 | Nanya Technology Corp. | Taipei, Taiwan | Low |
| 45 | Monolithic Power Systems | Kirkland, WA, USA | Low |
| 46 | Parade Technologies | San Jose, CA, USA | Low |
| 47 | Veeco Instruments | Plainview, NY, USA | Low |
| 48 | Broadcom Inc. | Palo Alto, CA, USA | Low |
| 49 | Renesas Electronics Corp. | Tokyo, Japan | Low |
| 50 | Onto Innovation | Wilmington, DE, USA | Low |
| 51 | MediaTek | Hsinchu, Taiwan | Low |
| 52 | NXP Semiconductors | Eindhoven, The Netherlands | Low |
| 53 | ASE Technology Holding Co., Ltd. | Fremont, CA, USA | Low |
| 54 | Micron Technology | Boise, ID, USA | Low |
| 55 | Analog Devices | Wilmington, DE, USA | Low |
| No. | Company Name | HQ Location | ESG Risk |
|---|---|---|---|
| 1 | HANA MICRON | Asan, Republic of Korea | Severe |
| 2 | Episil-Precision | Hsinchu, Taiwan | Severe |
| 3 | Hana Materials Inc. | Cheonan, Republic of Korea | High |
| 4 | ADATA Technology Co., Ltd. | Taipei, Taiwan | High |
| 5 | Genesys Logic | Boston, MA, USA | High |
| 6 | Canadian Solar | Guelph, Canada | High |
| 7 | Taiwan Semiconductor Co., Ltd. | Hsinchu, Taiwan | High |
| 8 | indie Semiconductor | Aliso Viejo, CA, USA | High |
| 9 | Technoprobe | Cernusco Lombardone, Italy | High |
| 10 | United Renewable Energy Co., Ltd. | Hsinchu, Taiwan | High |
| 11 | NEPES Corp. | Seoul, Republic of Korea | High |
| 12 | RichWave Technology Corp. | Taipei, Taiwan | High |
| 13 | Sensirion Holding | Stäfa, Switzerland | High |
| 14 | TCL Zhonghuan Renewable Energy Technology Co., Ltd. | Tianjin, China | High |
| 15 | Semiconductor Manufacturing International Corp. | Shanghai, China | High |
| 16 | JCET Group Co., Ltd. | Jiangyin, China | High |
| 17 | Kinsus Interconnect Technology Corp. | Taoyuan, Taiwan | High |
| 18 | Shinko Electric Industries Co., Ltd. | Nagano, Japan | High |
| 19 | Episil Technologies | Hsinchu, Taiwan | High |
| 20 | Elite Semiconductor Microelectronics Tech | Hsinchu, Taiwan | High |
| 21 | Powerchip Semiconductor Manufacturing Corp. | Hsinchu, Taiwan | High |
| 22 | JinkoSolar Holding Co., Ltd. | Shangrao, China | High |
| 23 | SiTime Corp. | Santa Clara, CA, USA | High |
| 24 | Impinj | Seattle, DC, USA | High |
| 25 | King Yuan Electronics Co., Ltd. | Hsinchu, Taiwan | High |
| 26 | FocalTech Systems Co., Ltd. | Hsinchu, Taiwan | High |
| 27 | Lingsen Precision Industries Ltd. | Taichung, Taiwan | High |
| 28 | Risen Energy Co., Ltd. | Ningbo, China | High |
| 29 | Sanken Electric Co., Ltd. | Niiza, Japan | High |
| 30 | Trina Solar Co., Ltd. | Changzhou, China | High |
| 31 | Chang Wah Technology Co., Ltd. | Kaohsiung, Taiwan | High |
| 32 | u-blox Holding | Thalwil, Switzerland | High |
| 33 | Pan Jit International | Kaohsiung, Taiwan | High |
| 34 | JA Solar Technology Co., Ltd. | Beijing, China | High |
| 35 | Hoyuan Green Energy Co., Ltd. | Wuxi, China | High |
| 36 | LONGi Green Energy Technology Co., Ltd. | Xian, China | High |
| 37 | SUMCO Corp. | Tokyo, Japan | High |
References
- Kamal, K.Y. The Silicon Age: Trends in semiconductor devices industry. J. Eng. Sci. Technol. Rev. 2022, 15, 110–115. [Google Scholar] [CrossRef]
- Lin, Y.-S.; Chien, C.-F.; Chou, D. UNISON decision framework for hybrid optimization of wastewater treatment and recycle for Industry 3.5 and cleaner semiconductor manufacturing. Resour. Conserv. Recycl. 2022, 182, 106282. [Google Scholar] [CrossRef]
- Shen, S.-P.; Tsai, J.-F. Evaluating the sustainable development of the semiconductor industry using BWM and fuzzy TOPSIS. Sustainability 2022, 14, 10693. [Google Scholar] [CrossRef]
- Wang, J.-B.; Wang, G.-H.; Ou, C.-Y. The key factors for sustainability reporting adoption in the semiconductor industry using the hybrid FRST-PSO technique and fuzzy DEMATEL approach. Sustainability 2023, 15, 1929. [Google Scholar] [CrossRef]
- Feng, S.; Zhang, R.; Li, G. Environmental decentralization, digital finance and green technology innovation. Struct. Chang. Econ. Dyn. 2022, 61, 70–83. [Google Scholar] [CrossRef]
- Ebinger, F.; Omondi, B. Leveraging digital approaches for transparency in sustainable supply chains: A conceptual paper. Sustainability 2020, 12, 6129. [Google Scholar] [CrossRef]
- Mullen, E.; Morris, M.A. Green nanofabrication opportunities in the semiconductor industry: A life cycle perspective. Na-Nomaterials 2021, 11, 1085. [Google Scholar] [CrossRef]
- Goyal, P.; Rahman, Z.; Kazmi, A.A. Corporate sustainability performance and firm performance research: Literature review and future research agenda. Manag. Decis. 2013, 51, 361–379. [Google Scholar] [CrossRef]
- Neely, A.; Mills, J.; Platts, K.; Gregory, M.; Richards, H. Realizing strategy through measurement. Int. J. Oper. Prod. Manag. 1994, 14, 140–152. [Google Scholar] [CrossRef]
- Brundtland, G. Report of the World Commission on Environment and Development: Our Common Future; Oxford University Press: Oxford, UK, 1987; Available online: https://sustainabledevelopment.un.org/content/documents/5987our-common-future.pdf (accessed on 10 February 1987).
- Seuring, S.A.; Koplin, J.; Behrens, T.; Schneidewind, U. Sustainability assessment in the German detergent industry: From stakeholder involvement to sustainability indicators. Sustain. Dev. 2003, 11, 199–212. [Google Scholar] [CrossRef]
- Eklington, J. Cannibals with Forks: The Triple Bottom Line of the 21st Century; New Society Publishers: Stoney Creek, CT, USA, 1998. [Google Scholar]
- Labuschagne, C.; Brent, A.C.; Van Erck, R.P. Assessing the sustainability performances of industries. J. Clean. Prod. 2005, 13, 373–385. [Google Scholar] [CrossRef]
- Takala, T.; Pallab, P. Individual, collective and social responsibility of the firm. Bus. Ethics A Eur. Rev. 2000, 9, 109–118. [Google Scholar] [CrossRef]
- Wagner, M. The role of corporate sustainability performance for economic performance: A firm-level analysis of moderation effects. Ecol. Econ. 2010, 69, 1553–1560. [Google Scholar] [CrossRef]
- Halme, M.; Rintamäki, J.; Knudsen, J.S.; Lankoski, L.; Kuisma, M. When is there a sustainability case for CSR? Pathways to environmental and social performance improvements. Bus. Soc. 2020, 59, 1181–1227. [Google Scholar] [CrossRef]
- Khaled, R.; Ali, H.; Mohamed, E.K. The sustainable development goals and corporate sustainability performance: Map-ping, extent and determinants. J. Clean. Prod. 2021, 311, 127599. [Google Scholar] [CrossRef]
- Silva, S. Corporate contributions to the sustainable development goals: An empirical analysis informed by legitimacy theory. J. Clean. Prod. 2021, 292, 125962. [Google Scholar] [CrossRef]
- Dimson, E.; Marsh, P.; Staunton, M. Divergent ESG ratings. J. Portf. Manag. 2020, 47, 75–87. [Google Scholar] [CrossRef]
- Grundström, G.; Miedel, I. Sustainable Investing: On the Relation between Sustainability Rating and Greenhouse Gas Emissions. 2021. Available online: https://www.diva-portal.org/smash/record.jsf?pid=diva2%3A1573404&dswid=2649 (accessed on 21 May 2024).
- Anson, M.; Spalding, D.; Kwait, K.; Delano, J. The sustainability conundrum. J. Portf. Manag. 2020, 46, 124–138. [Google Scholar] [CrossRef]
- Ruberti, M. The chip manufacturing industry: Environmental impacts and eco-efficiency analysis. Sci. Total Environ. 2023, 858, 159873. [Google Scholar] [CrossRef]
- Pelcat, M. GHG Emissions of Semiconductor Manufacturing in 2021; Univ Rennes, INSA Rennes, CNRS, IETR–UMR 6164, F-35000 Rennes; HAL Open Science: Lyon, France, 2023. [Google Scholar]
- Raoux, S. Fluorinated greenhouse gas and net-zero emissions from the electronics industry: The proof is in the pudding. Carbon Manag. 2023, 14, 2179941. [Google Scholar] [CrossRef]
- Lee, H.; Kim, H.; Jeong, H. Approaches to sustainability in chemical mechanical polishing (CMP): A review. Int. J. Precis. Eng. Manuf. Green Technol. 2022, 9, 349–367. [Google Scholar] [CrossRef]
- Wang, Q.; Huang, N.; Cai, H.; Chen, X.; Wu, Y. Water strategies and practices for sustainable development in the semiconductor industry. Water Cycle 2023, 4, 12–16. [Google Scholar] [CrossRef]
- Nagapurkar, P.; Nandy, P.; Nimbalkar, S. Cleaner chips: Decarbonization in semiconductor manufacturing. Sustainability 2023, 16, 218. [Google Scholar] [CrossRef]
- Marek, A.; Kozak, M. Maintaining a sustainable workplace: Internal corporate social responsibility practices in dialog semiconductor during the COVID-19 pandemic. Przegląd Prawno-Ekon. 2021, 4, 75–96. [Google Scholar] [CrossRef]
- Fallah Shayan, N.; Mohabbati-Kalejahi, N.; Alavi, S.; Zahed, M.A. Sustainable development goals (SDGs) as a framework for corporate social responsibility (CSR). Sustainability 2022, 14, 1222. [Google Scholar] [CrossRef]
- Leal Filho, W.; Frankenberger, F.; Salvia, A.L.; Azeiteiro, U.; Alves, F.; Castro, P.; Will, M.; Platje, J.; Lovren, V.O.; Brandli, L. A framework for the implementation of the sustainable development Goals in university programmes. J. Clean. Prod. 2021, 299, 126915. [Google Scholar] [CrossRef]
- Busco, C.; Consolandi, C.; Eccles, R.G.; Sofra, E. A preliminary analysis of SASB reporting: Disclosure topics, financial rel-evance, and the financial intensity of ESG materiality. J. Appl. Corp. Financ. 2020, 32, 117–125. [Google Scholar] [CrossRef]
- Alsayegh, M.F.; Abdul Rahman, R.; Homayoun, S. Corporate economic, environmental, and social sustainability performance transformation through ESG disclosure. Sustainability 2020, 12, 3910. [Google Scholar] [CrossRef]
- Reid, J.; Rout, M. Developing sustainability indicators–The need for radical transparency. Ecol. Indic. 2020, 110, 105941. [Google Scholar] [CrossRef]
- Boiral, O.; Heras-Saizarbitoria, I. Sustainability reporting assurance: Creating stakeholder accountability through hyperreality? J. Clean. Prod. 2020, 243, 118596. [Google Scholar] [CrossRef]
- Christensen, H.B.; Hail, L.; Leuz, C. Mandatory CSR and sustainability reporting: Economic analysis and literature review. Rev. Account. Stud. 2021, 26, 1176–1248. [Google Scholar] [CrossRef]
- Stocker, F.; de Arruda, M.P.; de Mascena, K.M.; Boaventura, J.M. Stakeholder engagement in sustainability reporting: A classification model. Corp. Soc. Responsib. Environ. Manag. 2020, 27, 2071–2080. [Google Scholar] [CrossRef]
- Baumüller, J.; Sopp, K. Double materiality and the shift from non-financial to European sustainability reporting: Review, outlook and implications. J. Appl. Account. Res. 2021, 23, 8–28. [Google Scholar] [CrossRef]
- Tsalis, T.A.; Malamateniou, K.E.; Koulouriotis, D.; Nikolaou, I.E. New challenges for corporate sustainability reporting: United Nations’ 2030 Agenda for sustainable development and the sustainable development goals. Corp. Soc. Responsib. Environ. Manag. 2020, 27, 1617–1629. [Google Scholar] [CrossRef]
- Wang, X.; Yuen, K.F.; Wong, Y.D.; Li, K.X. How can the maritime industry meet Sustainable Development Goals? An analysis of sustainability reports from the social entrepreneurship perspective. Transp. Res. Part D Transp. Environ. 2020, 78, 102173. [Google Scholar] [CrossRef]
- Arvidsson, S. CEO talk of sustainability in CEO letters: Towards the inclusion of a sustainability embeddedness and val-ue-creation perspective. Sustain. Account. Manag. Policy J. 2023, 14, 26–61. [Google Scholar] [CrossRef]
- Na, H.J.; Lee, K.C.; Choi, S.U.; Kim, S.T. Exploring CEO messages in sustainability management reports: Applying sen-timent mining and sustainability balanced scorecard methods. Sustainability 2020, 12, 590. [Google Scholar] [CrossRef]
- Khan, M.; Sulaiman, R.B. On the linkage between CEOs’ statements and CSR reporting: An analysis of visuals and verbal texts. Corp. Gov. Int. J. Bus. Soc. 2021, 21, 515–535. [Google Scholar] [CrossRef]
- Wiengarten, F.; Lo, C.K.; Lam, J.Y. How does sustainability leadership affect firm performance? The choices associated with appointing a chief officer of corporate social responsibility. J. Bus. Ethics 2017, 140, 477–493. [Google Scholar] [CrossRef]
- Mäkelä, H.; Laine, M. A CEO with many messages: Comparing the ideological representations provided by different corporate reports. Account. Forum 2011, 35, 217–231. [Google Scholar] [CrossRef]
- Lin, F.; Lin, S.-W.; Lu, W.-M. Sustainability assessment of Taiwan’s semiconductor industry: A new hybrid model using combined analytic hierarchy process and two-stage additive network data envelopment analysis. Sustainability 2018, 10, 4070. [Google Scholar] [CrossRef]
- Bui, T.-D. Assessing sustainable supply chain transparency practices in Taiwan semiconductor Industry: A hierarchical interdependence approach. Int. J. Prod. Econ. 2024, 272, 109245. [Google Scholar] [CrossRef]
- Ahmad, R.A.R.; Palaniappan, T.; Azmi, N.A. Environmental, social, and governance(ESG) disclosure and firms financial indicators analysis of semiconductor industry. Insight J. 2023, 10. [Google Scholar]
- Higashi, S. Study on semiconductor production equipment companies’ ROESG management. In Sustainability Management and Network Management; World Scientific: Singapore, 2023; pp. 95–109. [Google Scholar]
- Hsu, C.-W.; Hu, A.H.; Chiou, C.-Y.; Chen, T.-C. Using the FDM and ANP to construct a sustainability balanced scorecard for the semiconductor industry. Expert Syst. Appl. 2011, 38, 12891–12899. [Google Scholar] [CrossRef]
- Garz, H.; Volk, C.; Morrow, D. The ESG risk ratings. In Moving up the Innovation Curve; White Paper; Sustainalytics: Amsterdam, The Netherlands, 2018; p. 1. [Google Scholar]
- Park, W.; Son, S.; Park, H.; Park, H. Recommendations for determining an appropriate sample size. Seoul J. Ind. Relat. 2010, 21, 51–85. [Google Scholar]
- Ferns, B.; Emelianova, O.; Sethi, S.P. In his own words: The effectiveness of CEO as spokesperson on CSR-sustainability issues–Analysis of data from the Sethi CSR Monitor©. Corp. Reput. Rev. 2008, 11, 116–129. [Google Scholar] [CrossRef]
- Rego, A.; Cunha, M.P.; Polónia, D. Corporate sustainability: A view from the top. J. Bus. Ethics 2017, 143, 133–157. [Google Scholar] [CrossRef]
- Choi, Y.G.; Cho, K.T. Analysis of safety management characteristics using network analysis of CEO messages in the construction industry. Sustainability 2020, 12, 5771. [Google Scholar] [CrossRef]
- Jung, G. A Study of Foresight Method Based on Text Mining and Complexity Network Analysis; KISTEP: Seoul, Republic of Korea, 2010. [Google Scholar]
- Vel, S.S. In Pre-processing techniques of text mining using computational linguistics and python libraries. In Proceedings of the 2021 international conference on artificial intelligence and smart systems (ICAIS), Coimbatore, India, 25–27 March 2021; IEEE: Piscataway, NJ, USA, 2021; pp. 879–884. [Google Scholar]
- Gunawan, T.S.; Abdullah, N.A.J.; Kartiwi, M.; Ihsanto, E. In social network analysis using python data mining. In Proceedings of the 2020 8th international conference on cyber and IT service management (CITSM), Pangkal, Indonesia, 23–24 October 2020; IEEE: Piscataway, NJ, USA, 2020; pp. 1–6. [Google Scholar]
- Fauziyyah, A.K. Analisis sentimen pandemi COVID-19 pada streaming Twitter dengan text mining Python. J. Ilm. SINUS 2020, 18, 31–42. [Google Scholar] [CrossRef]
- Hussain, S.; Muhammad, L.; Yakubu, A. Mining social media and DBpedia data using Gephi and R. J. Appl. Comput. Sci. Math. 2018, 12, 14–20. [Google Scholar] [CrossRef]
- Hong, Y.; Cho, K. Differences in CEO communication strategies between high-and low-performing firms in the global auto parts industry. Sustainability 2024, 16, 3100. [Google Scholar] [CrossRef]
- Landherr, A.; Friedl, B.; Heidemann, J. A critical review of centrality measures in social networks. Bus. Inf. Syst. Eng. 2010, 2, 371–385. [Google Scholar] [CrossRef]
- Bloch, F.; Jackson, M.O.; Tebaldi, P. Centrality measures in networks. Soc. Choice Welf. 2023, 61, 413–453. [Google Scholar] [CrossRef]
- Hong, J.-H.; Yun, H.-J. Presidential candidate’s speech based on network analysis: Mainly on the visibility of the words and the connectivity between the words. J. Korea Contents Assoc. 2014, 14, 24–44. [Google Scholar] [CrossRef]
- Choi, Y.; Cho, K.T. Analysis of environmental management characteristics using network analysis of CEO communication in the automotive industry. Sustainability 2021, 13, 11987. [Google Scholar] [CrossRef]
- Yu, K.; Cao, Q.; Xie, C.; Qu, N.; Zhou, L. Analysis of intervention strategies for coal miners’ unsafe behaviors based on analytic network process and system dynamics. Saf. Sci. 2019, 118, 145–157. [Google Scholar] [CrossRef]


| Rank | Word | Eigenvector Centrality | Word | Betweenness Centrality | Word | Closeness Centrality |
|---|---|---|---|---|---|---|
| 1 | sustainability | 0.1814 | sustainability | 0.0528 | sustainability | 0.4299 |
| 2 | company | 0.1693 | company | 0.0519 | company | 0.4260 |
| 3 | global | 0.1563 | employee | 0.0471 | global | 0.4253 |
| 4 | sustainable | 0.1529 | global | 0.0471 | technology | 0.4194 |
| 5 | product | 0.1469 | technology | 0.0450 | product | 0.4181 |
| 6 | technology | 0.1460 | product | 0.0438 | employee | 0.4173 |
| 7 | goal | 0.1357 | industry | 0.0389 | sustainable | 0.4152 |
| 8 | employee | 0.1351 | world | 0.0369 | customer | 0.4132 |
| 9 | development | 0.1319 | new | 0.0346 | development | 0.4118 |
| 10 | customer | 0.1316 | esg | 0.0321 | goal | 0.4111 |
| 11 | continue | 0.1233 | customer | 0.0285 | industry | 0.4096 |
| 12 | esg | 0.1231 | energy | 0.0271 | world | 0.4088 |
| 13 | industry | 0.1167 | sustainable | 0.0253 | new | 0.4059 |
| 14 | innovation | 0.1104 | continue | 0.0241 | continue | 0.4044 |
| 15 | world | 0.1100 | development | 0.0239 | business | 0.4042 |
| 16 | business | 0.1100 | goal | 0.0237 | esg | 0.4040 |
| 17 | environmental | 0.1093 | business | 0.0202 | innovation | 0.4025 |
| 18 | management | 0.1065 | management | 0.0194 | work | 0.4000 |
| 19 | work | 0.1050 | innovation | 0.0193 | management | 0.3997 |
| 20 | social | 0.1045 | environmental | 0.0192 | energy | 0.3996 |
| 21 | operation | 0.1037 | future | 0.0183 | operation | 0.3988 |
| 22 | future | 0.1029 | work | 0.0180 | future | 0.3983 |
| 23 | new | 0.1024 | operation | 0.0176 | growth | 0.3978 |
| 24 | governance | 0.1020 | growth | 0.0175 | environmental | 0.3976 |
| 25 | energy | 0.0928 | effort | 0.0156 | social | 0.3958 |
| 26 | progress | 0.0915 | environment | 0.0152 | governance | 0.3924 |
| 27 | growth | 0.0907 | manufacturing | 0.0151 | impact | 0.3923 |
| 28 | environment | 0.0901 | commitment | 0.0150 | initiative | 0.3899 |
| 29 | value | 0.0854 | social | 0.0147 | environment | 0.3897 |
| 30 | impact | 0.0848 | impact | 0.0145 | progress | 0.3893 |
| Rank | Word | Eigenvector Centrality | Word | Betweenness Centrality | Word | Closeness Centrality |
|---|---|---|---|---|---|---|
| 1 | development | 0.2276 | company | 0.0971 | company | 0.4283 |
| 2 | company | 0.2268 | development | 0.0734 | development | 0.4275 |
| 3 | energy | 0.1735 | employee | 0.0566 | energy | 0.4125 |
| 4 | employee | 0.1637 | energy | 0.0507 | employee | 0.4065 |
| 5 | sustainable | 0.1625 | product | 0.0465 | management | 0.4013 |
| 6 | business | 0.1411 | business | 0.0437 | sustainable | 0.3991 |
| 7 | management | 0.1406 | management | 0.0408 | business | 0.3987 |
| 8 | esg | 0.1385 | esg | 0.0322 | product | 0.3955 |
| 9 | environment | 0.1296 | global | 0.0319 | esg | 0.3933 |
| 10 | product | 0.1252 | industry | 0.0318 | global | 0.3928 |
| 11 | global | 0.1203 | technology | 0.0317 | environment | 0.3920 |
| 12 | sustainability | 0.1128 | sustainable | 0.0306 | future | 0.3894 |
| 13 | future | 0.1127 | environment | 0.0283 | customer | 0.3892 |
| 14 | value | 0.1099 | sustainability | 0.0280 | industry | 0.3853 |
| 15 | customer | 0.1087 | customer | 0.0276 | value | 0.3848 |
| 16 | environmental | 0.1053 | future | 0.0271 | sustainability | 0.3828 |
| 17 | industry | 0.1031 | new | 0.0259 | technology | 0.3815 |
| 18 | green | 0.1022 | market | 0.0243 | market | 0.3815 |
| 19 | continue | 0.0990 | power | 0.0234 | new | 0.3813 |
| 20 | society | 0.0975 | environmental | 0.0221 | environmental | 0.3812 |
| 21 | governance | 0.0953 | value | 0.0218 | society | 0.3791 |
| 22 | technology | 0.0922 | social | 0.0199 | operation | 0.3786 |
| 23 | operation | 0.0918 | world | 0.0156 | power | 0.3771 |
| 24 | goal | 0.0902 | continue | 0.0154 | green | 0.3768 |
| 25 | effort | 0.0897 | governance | 0.0151 | continue | 0.3765 |
| 26 | new | 0.0888 | impact | 0.0151 | goal | 0.3764 |
| 27 | social | 0.0883 | goal | 0.0147 | world | 0.3758 |
| 28 | market | 0.0854 | operation | 0.0146 | governance | 0.3756 |
| 29 | world | 0.0835 | stakeholder | 0.0146 | effort | 0.3749 |
| 30 | focus | 0.0833 | system | 0.0145 | social | 0.3732 |
| Weight | HPG Words |
|---|---|
| 3 (27 words) | sustainability, company, global, sustainable, product, technology, goal, employee, development, customer, continue, esg, industry, innovation, world, business, environmental, management, work, social, operation, future, new, energy, growth, environment, impact |
| 2 (2 words) | governance, progress |
| 1 (5 words) | value, effort, manufacturing, commitment, initiative |
| Weight | LPG Words |
|---|---|
| 3 (26 words) | development, company, energy, employee, sustainable, business, management, esg, environment, product, global, sustainability, future, value, customer, environmental, industry, continue, governance, technology, operation, goal, new, social, market, world |
| 2 (4 words) | green, society, effort, power |
| 1 (4 words) | focus, impact, stakeholder, system |
| No. | HPG Words | Clean Energy Use | Recycling/Renewable Capacity | Green Resource Integration | Pollution-Discharge Treatment | Firm Size | Financial Strength | Material Cost/Selling Price | Partner Complementarity | Corporate Brand Image | CRM Capability | Core Technical Patent | Product Life Cycle | R&D Capability |
|---|---|---|---|---|---|---|---|---|---|---|---|---|---|---|
| 1 | sustainability | O | O | O | ||||||||||
| 2 | company | O | O | O | ||||||||||
| 3 | global | O | O | O | ||||||||||
| 4 | sustainable | O | O | O | ||||||||||
| 5 | product | O | O | O | ||||||||||
| 6 | technology | O | O | O | ||||||||||
| 7 | goal | O | O | O | ||||||||||
| 8 | employee | O | O | O | ||||||||||
| 9 | development | O | O | O | ||||||||||
| 10 | customer | O | O | O | ||||||||||
| 11 | continue | O | O | O | ||||||||||
| 12 | esg | O | O | O | ||||||||||
| 13 | industry | O | O | O | ||||||||||
| 14 | innovation | O | O | O | ||||||||||
| 15 | world | O | O | O | ||||||||||
| 16 | business | O | O | O | ||||||||||
| 17 | environmental | O | O | O | ||||||||||
| 18 | management | O | O | O | ||||||||||
| 19 | work | O | O | O | ||||||||||
| 20 | social | O | O | O | ||||||||||
| 21 | operation | O | O | O | ||||||||||
| 22 | future | O | O | O | ||||||||||
| 23 | new | O | O | O | ||||||||||
| 24 | energy | O | O | O | ||||||||||
| 25 | growth | O | O | O | ||||||||||
| 26 | environment | O | O | O | ||||||||||
| 27 | impact | O | O | O |
| No. | LPG Words | Clean Energy Use | Recycling/Renewable Capacity | Green Resource Integration | Pollution-Discharge Treatment | Firm Size | Financial Strength | Material Cost/Selling Price | Partner Complementarity | Corporate Brand Image | CRM Capability | Core Technical Patent | Product Life Cycle | R&D Capability |
|---|---|---|---|---|---|---|---|---|---|---|---|---|---|---|
| 1 | development | O | O | O | ||||||||||
| 2 | company | O | O | O | ||||||||||
| 3 | energy | O | O | O | ||||||||||
| 4 | employee | O | O | O | ||||||||||
| 5 | sustainable | O | O | O | ||||||||||
| 6 | business | O | O | O | ||||||||||
| 7 | management | O | O | O | ||||||||||
| 8 | esg | O | O | O | ||||||||||
| 9 | environment | O | O | O | ||||||||||
| 10 | product | O | O | O | ||||||||||
| 11 | global | O | O | O | ||||||||||
| 12 | sustainability | O | O | O | ||||||||||
| 13 | future | O | O | O | ||||||||||
| 14 | value | O | O | O | ||||||||||
| 15 | customer | O | O | O | ||||||||||
| 16 | environmental | O | O | O | ||||||||||
| 17 | industry | O | O | O | ||||||||||
| 18 | continue | O | O | O | ||||||||||
| 19 | governance | O | O | O | ||||||||||
| 20 | technology | O | O | O | ||||||||||
| 21 | operation | O | O | O | ||||||||||
| 22 | goal | O | O | O | ||||||||||
| 23 | new | O | O | O | ||||||||||
| 24 | social | O | O | O | ||||||||||
| 25 | market | O | O | O | ||||||||||
| 26 | world | O | O | O |
| HPG Matrix | Clean Energy Use | Recycling/Renewable Capacity | Green Resource Integration | Pollution-Discharge Treatment | Firm Size | Financial Strength | Material Cost/Selling Price | Partner Complementarity | Corporate Brand Image | CRM Capability | Core Technical Patent | Product Life Cycle | R&D Capability |
|---|---|---|---|---|---|---|---|---|---|---|---|---|---|
| Clean energy use | 0 | 2 | 3 | 1 | 1 | 0 | 0 | 3 | 0 | 0 | 0 | 0 | 2 |
| Recycling/renewable capacity | 2 | 0 | 6 | 2 | 0 | 0 | 0 | 2 | 0 | 1 | 0 | 1 | 2 |
| Green resource integration | 3 | 6 | 0 | 4 | 1 | 0 | 0 | 11 | 4 | 6 | 0 | 1 | 4 |
| Pollution-discharge treatment | 1 | 2 | 4 | 0 | 0 | 0 | 0 | 2 | 1 | 0 | 0 | 0 | 2 |
| Firm size | 1 | 0 | 1 | 0 | 0 | 0 | 0 | 0 | 0 | 0 | 0 | 0 | 2 |
| Financial strength | 0 | 0 | 0 | 0 | 0 | 0 | 0 | 0 | 0 | 0 | 0 | 0 | 0 |
| Material cost/selling price | 0 | 0 | 0 | 0 | 0 | 0 | 0 | 0 | 0 | 0 | 0 | 0 | 0 |
| Partner complementarity | 3 | 2 | 11 | 2 | 0 | 0 | 0 | 0 | 3 | 3 | 0 | 1 | 3 |
| Corporate brand image | 0 | 0 | 4 | 1 | 0 | 0 | 0 | 3 | 0 | 1 | 0 | 0 | 1 |
| CRM capability | 0 | 1 | 6 | 0 | 0 | 0 | 0 | 3 | 1 | 0 | 0 | 1 | 2 |
| Core technical patent | 0 | 0 | 0 | 0 | 0 | 0 | 0 | 0 | 0 | 0 | 0 | 0 | 0 |
| Product life cycle | 0 | 1 | 1 | 0 | 0 | 0 | 0 | 1 | 0 | 1 | 0 | 0 | 2 |
| R&D capability | 2 | 2 | 4 | 2 | 2 | 0 | 0 | 3 | 1 | 2 | 0 | 2 | 0 |
| LPG Matrix | Clean Energy Use | Recycling/Renewable Capacity | Green Resource Integration | Pollution-Discharge Treatment | Firm Size | Financial Strength | Material Cost/Selling Price | Partner Complementarity | Corporate Brand Image | CRM Capability | Core Technical Patent | Product Life Cycle | R&D Capability |
|---|---|---|---|---|---|---|---|---|---|---|---|---|---|
| Clean energy use | 0 | 1 | 0 | 3 | 0 | 0 | 1 | 1 | 6 | 2 | 0 | 0 | 0 |
| Recycling/renewable capacity | 1 | 0 | 1 | 7 | 0 | 0 | 0 | 0 | 11 | 2 | 0 | 2 | 0 |
| Green resource integration | 0 | 1 | 0 | 1 | 0 | 0 | 0 | 0 | 2 | 0 | 0 | 0 | 0 |
| Pollution-discharge treatment | 3 | 7 | 1 | 0 | 1 | 0 | 0 | 0 | 15 | 3 | 0 | 2 | 0 |
| Firm size | 0 | 0 | 0 | 1 | 0 | 0 | 0 | 0 | 2 | 1 | 0 | 0 | 0 |
| Financial strength | 0 | 0 | 0 | 0 | 0 | 0 | 0 | 0 | 0 | 0 | 0 | 0 | 0 |
| Material cost/selling price | 1 | 0 | 0 | 0 | 0 | 0 | 0 | 0 | 0 | 1 | 0 | 0 | 0 |
| Partner complementarity | 1 | 0 | 0 | 0 | 0 | 0 | 0 | 0 | 1 | 0 | 0 | 0 | 0 |
| Corporate brand image | 6 | 11 | 2 | 15 | 2 | 0 | 0 | 1 | 0 | 7 | 0 | 3 | 1 |
| CRM capability | 2 | 2 | 0 | 3 | 1 | 0 | 1 | 0 | 7 | 0 | 0 | 0 | 0 |
| Core technical patent | 0 | 0 | 0 | 0 | 0 | 0 | 0 | 0 | 0 | 0 | 0 | 0 | 0 |
| Product life cycle | 0 | 2 | 0 | 2 | 0 | 0 | 0 | 0 | 3 | 0 | 0 | 0 | 1 |
| R&D capability | 0 | 0 | 0 | 0 | 0 | 0 | 0 | 0 | 1 | 0 | 0 | 1 | 0 |
Disclaimer/Publisher’s Note: The statements, opinions and data contained in all publications are solely those of the individual author(s) and contributor(s) and not of MDPI and/or the editor(s). MDPI and/or the editor(s) disclaim responsibility for any injury to people or property resulting from any ideas, methods, instructions or products referred to in the content. |
© 2024 by the authors. Licensee MDPI, Basel, Switzerland. This article is an open access article distributed under the terms and conditions of the Creative Commons Attribution (CC BY) license (https://creativecommons.org/licenses/by/4.0/).
Share and Cite
Yoo, Y.; Cho, K. Key Traits of Leading Sustainable Firms in the Semiconductor Industry. Sustainability 2024, 16, 4563. https://doi.org/10.3390/su16114563
Yoo Y, Cho K. Key Traits of Leading Sustainable Firms in the Semiconductor Industry. Sustainability. 2024; 16(11):4563. https://doi.org/10.3390/su16114563
Chicago/Turabian StyleYoo, Young, and Keuntae Cho. 2024. "Key Traits of Leading Sustainable Firms in the Semiconductor Industry" Sustainability 16, no. 11: 4563. https://doi.org/10.3390/su16114563
APA StyleYoo, Y., & Cho, K. (2024). Key Traits of Leading Sustainable Firms in the Semiconductor Industry. Sustainability, 16(11), 4563. https://doi.org/10.3390/su16114563