


Spatial Heterogeneity and Driving Mechanisms of Cultivated Land Intensive Utilization in the Beibu Gulf Urban Agglomeration, China


Abstract
1. Introduction
2. Materials and Methods
2.1. Study Area
2.2. Data Sources
2.3. Construction of the Evaluation System
2.3.1. Construction of a Comprehensive Evaluation System
2.3.2. Construction of the Driver System
2.4. Research Methods
2.4.1. Fuzzy Comprehensive
2.4.2. Dagum Gini Coefficient
2.4.3. Principal Component Analysis
2.4.4. Geographic Detectors
2.4.5. Geographically Weighted Regression (GWR) Model
- (1)
- Spatial Autocorrelation Analysis
- (2)
- GWR
3. Results
3.1. Characteristics of Spatial Distribution Pattern of CLIU
3.2. Analysis of Spatial Imbalance in Cultivated Land Intensive Utilization
3.3. Analysis of Spatial Nonstationarity in Cultivated Land Intensive Utilization
3.3.1. Geographical Exploration Results and Analysis
- (1)
- Driver Detection
- (2)
- Geodetector Results and Analysis
3.3.2. Geographical Weighted Regression Results and Analysis
- (1)
- Model Regression Coefficient Results
- (2)
- Analysis of Spatial Differences Among Various Factors
4. Discussion
4.1. The Interactive Relationship between Urban Agglomeration Development and CLIU
4.2. Comprehensive Driving Mechanism of Multiple Factors
4.3. Impact of Socio-Economic Factors on CLIU
4.4. Policy Implications
- (1)
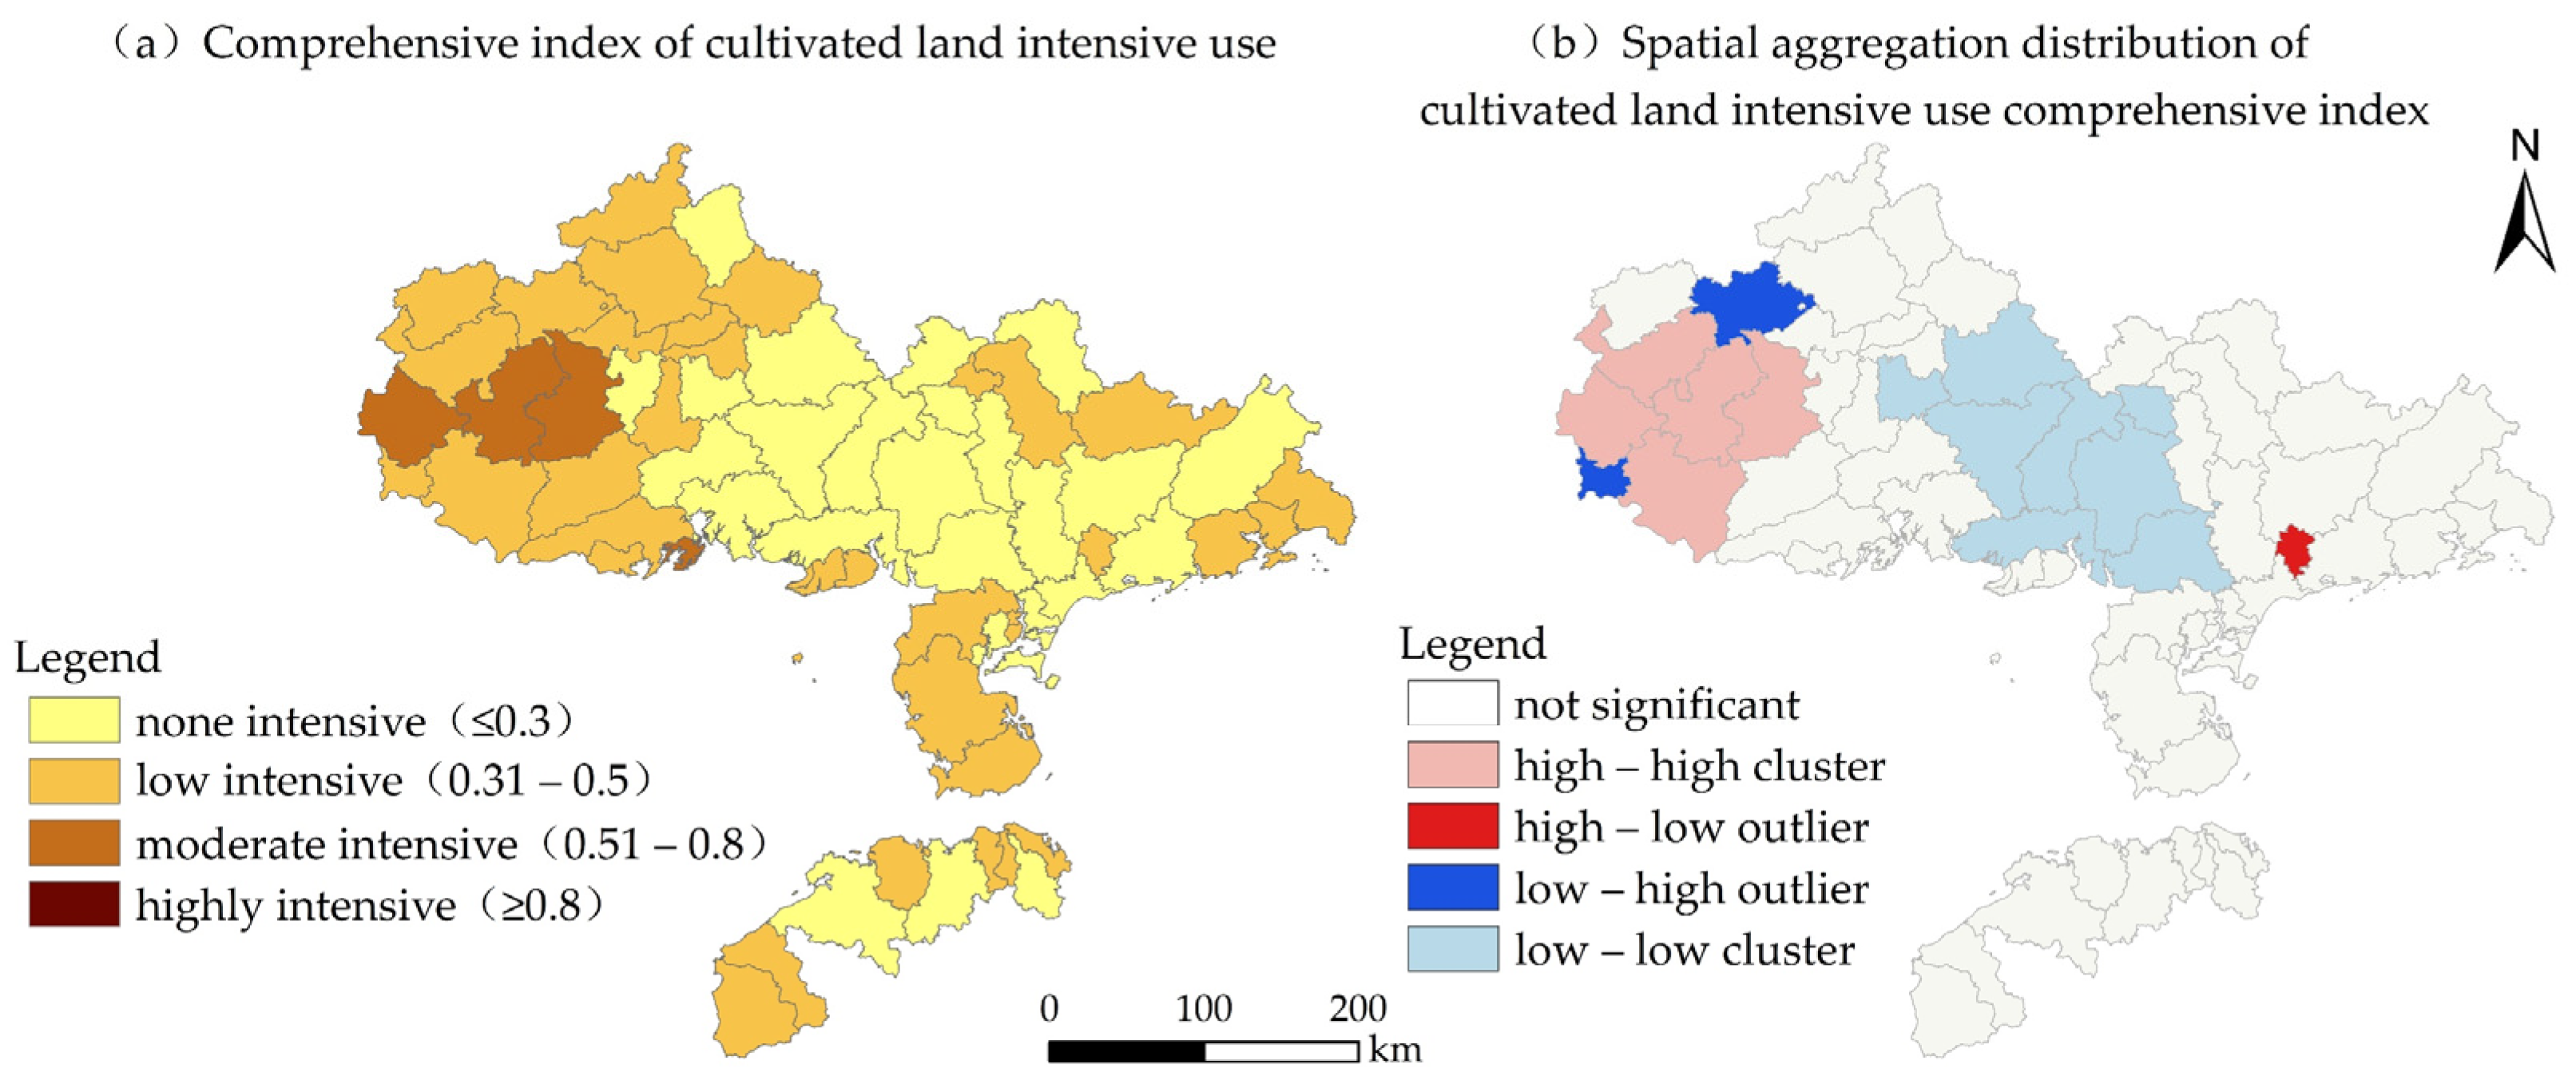
- Based on the spatial patterns of CLIU, measures for regional differentiation should be taken to delineate areas of control for CLIU. The research results again showed that the level of CLIU in counties and districts under the jurisdiction of Chongzuo and Nanning city in Guangxi was higher than that in other regions (Figure 2). Nanning is part of the Guizhong Plain area, Chongzuo is a large city with farming activities, and Long’an County in Nanning city is the birthplace of Na culture. These areas are dominated by the rice cultivation civilization, which has a profound impact on the development and utilization of arable land resources and agricultural production in the foothills of the Daming Mountains, Zuojiang-Youjiang River Basin, and Yongjiang River valley. The basic agricultural conditions in the region are relatively solid, but the cultivated fields are small and scattered; therefore, the counties and districts in Chongzuo and Nanning in Guangxi should accelerate the process of farmland transfer, implement large-scale management, and create highly intensive demonstration areas. Yulin city in Guangxi and Maoming city in Guangdong have moderate CLIU levels. Yulin is rich in arable land resources, as digital agriculture developed early. Maoming has promoted the construction of agricultural industry clusters and the development of characteristic agriculture. Therefore, these cities should implement comprehensive land consolidation, promote agricultural mechanization and digital control, and then create a smart farmland demonstration zone. The counties and districts of Qinzhou, Beihai, Fangchenggang, Zhanjiang, and Haikou should strictly control the scale of cultivated land occupied by construction resulting from economic development in the Bay Area, vigorously treat salinized and hardened cultivated land in coastal areas, develop salt-tolerant varieties of rice and sea rice planting techniques, and create coastal high-standard farmland demonstration areas (Figure 10).
- (2)
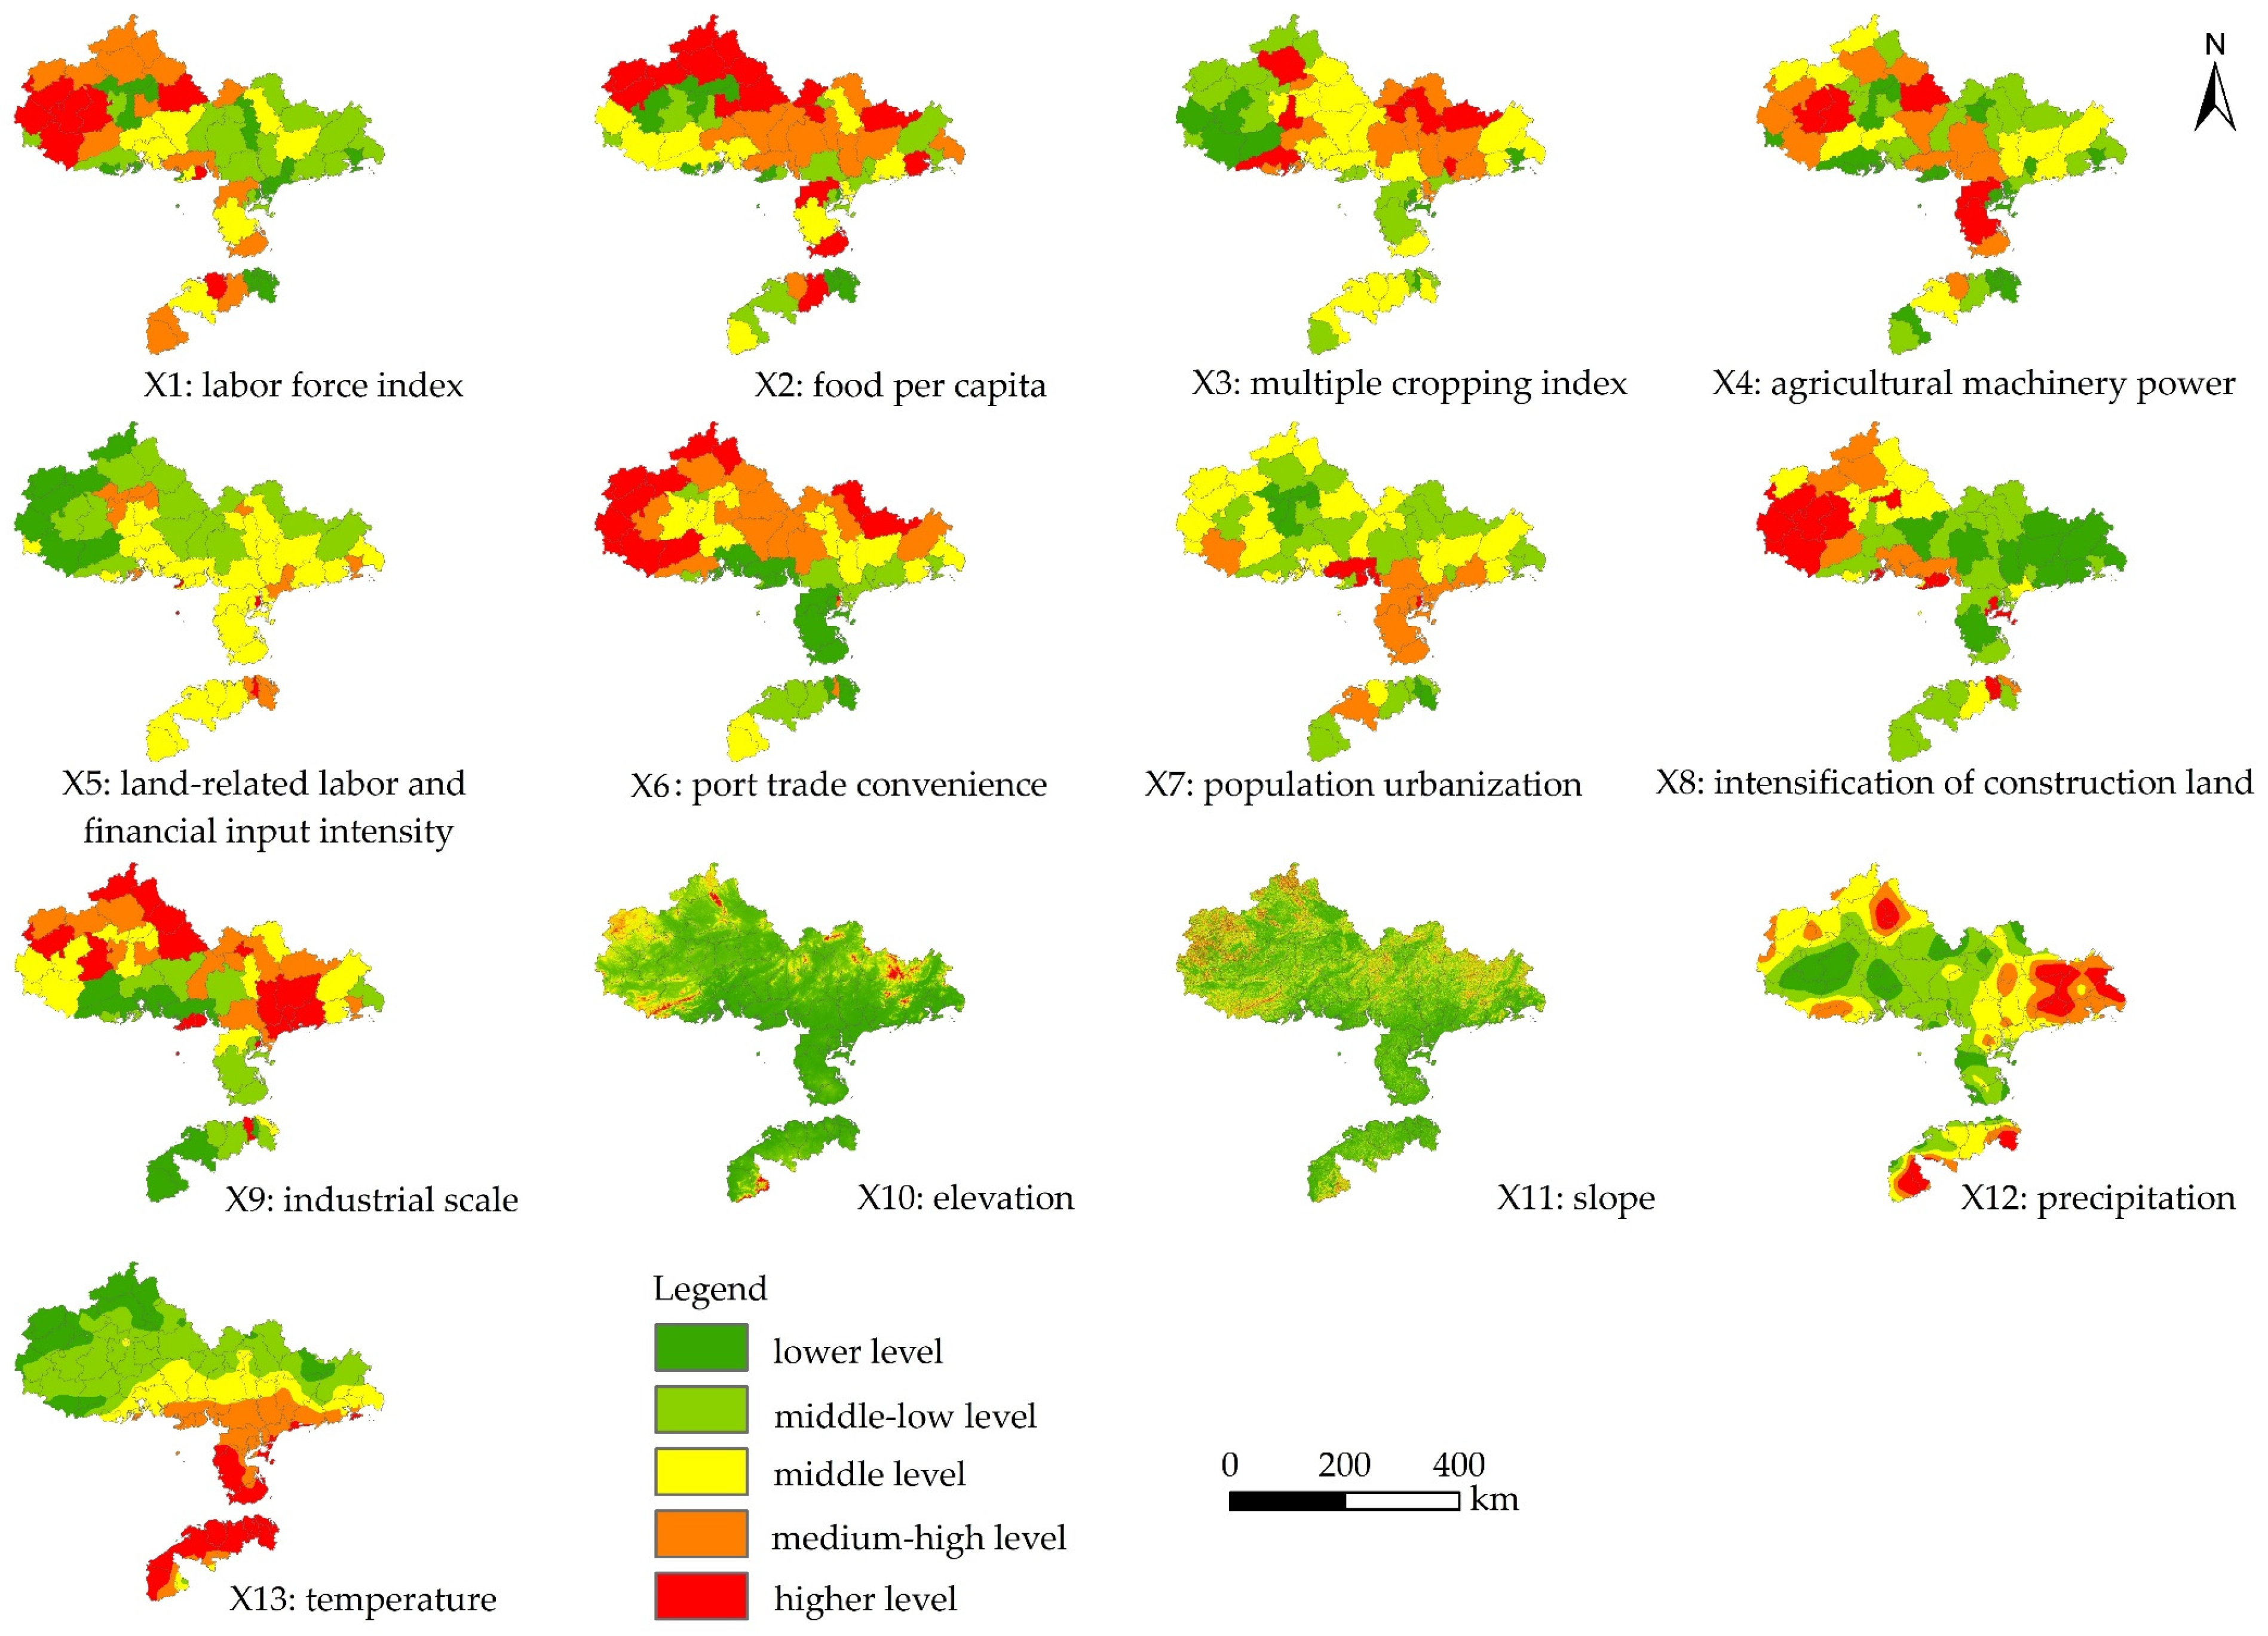
- Identifying the spatial heterogeneity of key factors for different counties enables the implementation of measures to control key indicators. The results showed that factors such as the degree of construction land intensification and population urbanization can have positive or negative effects on CLIU (Table 6 and Figure 5). Therefore, government agencies can indirectly promote the level of CLIU by improving the degree of construction land intensification and enhancing the vitality of the rural population and other measures. To manage the protection of farmland, farmland resources in districts and counties should be zoned based on the criteria of natural conditions such as temperature and terrain slope and habitat quality assessment to achieve a balance of cultivated land at different administrative levels. The replanting index should be included as the primary indicator in the farmland protection system for performance management. The law on compensation of arable land should be applied, and a map of the current status of compensation of arable land and a distribution map of potential upgrading at the community level should be established. Subsequently, a differentiated production function for arable land should be established to improve the input and output efficiency of arable land.
- (3)
- The spatial nonequilibrium pattern of CLIU in the Beibu Gulf urban agglomeration reflects differences in resource allocation and input-output status during the process of arable land utilization. To promote the coordinated development of CLIU between counties, it is essential to strengthen the integrated control of arable land and encourage cooperation between neighboring counties to increase the sharing of agricultural resources, technology, and equipment. A bay area large tillage system should be established to quantify the land remuneration of cultivated land in each county and district, clarify the coordinated relationship between the intensive margin of cultivated land use and the intensive margin of nonagricultural land use, and reduce intergroup overlap in the degree of CLIU between counties.
4.5. Limitations
5. Conclusions
Author Contributions
Funding
Institutional Review Board Statement
Informed Consent Statement
Data Availability Statement
Acknowledgments
Conflicts of Interest
References
- Wang, J.; Su, D.; Wu, Q.; Li, G.; Cao, Y. Study on eco-efficiency of cultivated land utilization based on the improvement of ecosystem services and emergy analysis. Sci. Total Environ. 2023, 882, 163489. [Google Scholar] [CrossRef]
- Xie, H.; Jin, S. Evolutionary game analysis of fallow farmland behaviors of different types of farmers and local governments. Land Use Policy 2019, 88, 104122. [Google Scholar] [CrossRef]
- Rosegrant, M.W.; Cline, S.A. Global food security: Challenges and policies. Science 2003, 302, 1917–1919. [Google Scholar] [CrossRef]
- Song, X.; Huang, Y.; Wu, Z.; Ouyang, Z. Does cultivated land function transition occur in China? J. Geogr. Sci. 2015, 25, 817–835. [Google Scholar] [CrossRef]
- Jiang, G.; Wang, M.; Qu, Y.; Zhou, D.; Ma, W. Towards cultivated land multifunction assessment in China: Applying the “influencing factors-functions products-demands” integrated framework. Land Use Policy 2020, 99, 104982. [Google Scholar] [CrossRef]
- Wang, X.; Wang, D.; Wu, S.; Yan, Z.; Han, J. Cultivated land multifunctionality in undeveloped peri-urban agricul ture areas in China: Implications for sustainable land management. J. Environ. Manag. 2023, 325, 116500. [Google Scholar] [CrossRef] [PubMed]
- Cheng, P.; Tang, H.; Lin, F.; Kong, X. Bibliometrics of the nexus between food security and carbon emissions: Hotspots and trends. Environ. Sci. Pollut. Res. 2023, 30, 25981–25998. [Google Scholar] [CrossRef]
- Li, W.; Wang, D.; Liu, S.; Zhu, Y. Measuring urbanization-occupation and internal conversion of peri-urban cultivated land to determine changes in the peri-urban agriculture of the black soil region. Ecol. Indic. 2019, 102, 328–337. [Google Scholar] [CrossRef]
- Bai, X.; Shi, P.; Liu, Y. Society: Realizing China’s urban dream. Nature 2014, 7499, 158–160. [Google Scholar] [CrossRef] [PubMed]
- Trewavas, A. Malthus foiled again and again. Nature 2002, 418, 668–670. [Google Scholar] [CrossRef]
- Naylor, R.L. Energy and resource constraints on intensive agricultural production. Annu. Rev. Energy Environ. 1996, 21, 99–123. [Google Scholar] [CrossRef]
- O’Kelly, M.; Bryan, D. Agricultural location theory: Von thunen’s contribution to economic geography. Prog. Hum. Geogr. 1996, 20, 457–475. [Google Scholar] [CrossRef]
- Sen, A. On the labour theory of value: Some methodological issues. Camb. J. Econ. 1978, 2, 175–190. [Google Scholar] [CrossRef]
- Czyżewski, B.; Matuszczak, A. A new land rent theory for sustainable agriculture. Land Use Policy 2016, 55, 222–229. [Google Scholar] [CrossRef]
- Yang, J.; Lin, Y. Spatiotemporal evolution and driving factors of fertilizer reduction control in Zhejiang province. Sci. Total Environ. 2019, 660, 650–659. [Google Scholar] [CrossRef] [PubMed]
- Shen, Y.; Zhang, Z.; Xue, Y. Study on the new dynamics and driving factors of soil pH in the red soil, hilly region of south China. Environ. Monit. Assess. 2021, 193, 304. [Google Scholar] [CrossRef]
- Ye, S.; Song, C.; Shen, S.; Gao, P.; Cheng, C.; Cheng, F.; Wan, C.; Zhu, D. Spatial Pattern of Arable Land-Use Intensity in China. Land Use Policy 2020, 99, 104845. [Google Scholar] [CrossRef]
- Darilek, J.L.; Huang, B.; Wang, Z.G.; Qi, Y.B.; Zhao, Y.C.; Sun, W.X.; Gu, Z.Q.; Shi, X.Z. Changes in soil fertility parameters and the environmental effects in a rapidly developing region of China. Agric. Ecosyst. Environ. 2009, 129, 286–292. [Google Scholar] [CrossRef]
- Brar, B.S.; Singh, K.; Dheri, G.S.; Balwinder, K. Carbon sequestration and soil carbon pools in a rice-wheat cropping system: Effect of long-term use of inorganic fertilizers and organic manure. Soil Tillage Res. 2013, 128, 30–36. [Google Scholar] [CrossRef]
- Liu, G.; Wang, H.; Cheng, Y.; Zheng, B.; Lu, Z. The impact of rural out-migration on arable land use intensity: Evidence from mountain areas in Guangdong, China. Land Use Policy 2016, 59, 569–579. [Google Scholar] [CrossRef]
- Xie, H.; Chen, Q.; Wang, W.; He, Y. Analyzing the green efficiency of arable land use in China. Technol. Forecast. Soc. Chang. 2018, 133, 15–28. [Google Scholar] [CrossRef]
- Westerink, J.; Pérez-Soba, M.; van Doorn, A. Social learning and land lease to stimulate the delivery of ecosystem services in intensive arable farming. Ecosyst. Serv. 2020, 44, 101149. [Google Scholar] [CrossRef]
- Liu, C.; Song, C.; Ye, S.; Cheng, F.; Zhang, L.; Li, C. Estimate provincial-level effectiveness of the arable land requisition-compensation balance policy in mainland China in the last 20 years. Land Use Policy 2023, 131, 106733. [Google Scholar] [CrossRef]
- Wang, J.; Zhang, Z.; Liu, Y. Spatial shifts in grain production increases in China and implications for food security. Land Use Policy 2018, 74, 204–213. [Google Scholar] [CrossRef]
- Li, X.; Wu, K.; Yang, Q.; Hao, S.; Feng, Z.; Ma, J. Quantitative assessment of cultivated land use intensity in Heilongjiang province, China, 2001–2015. Land Use Policy 2023, 125, 106505. [Google Scholar] [CrossRef]
- Kuang, B.; Han, J.; Lu, X.; Zhang, X.; Fan, X. Quantitative evaluation of China’s cultivated land protection policies based on the PMC-index model. Land Use Policy 2020, 99, 105062. [Google Scholar] [CrossRef]
- Garnett, T.; Appleby, M.C.; Balmford, A.; Bateman, I.J.; Benton, T.G.; Bloomer, P.; Burlingame, B.; Dawkins, M.; Dolan, L.; Fraser, D.; et al. Sustainable intensification in agriculture: Premises and policies. Science 2013, 341, 33–34. [Google Scholar] [CrossRef]
- Areal, F.J.; Jones, P.J.; Mortimer, S.R.; Wilson, P. Measuring sustainable intensification: Combining composite indicators and efficiency analysis to account for positive externalities in cereal production. Land Use Policy 2018, 75, 314–326. [Google Scholar] [CrossRef]
- Xie, H.; Huang, Y.; Choi, Y.; Shi, J. Evaluating the sustainable intensification of cultivated land use based on emergy analysis. Technol. Forecast. Soc. Chang. 2021, 165, 120449. [Google Scholar] [CrossRef]
- Wang, G.; Liu, Y.; Li, Y.; Chen, Y. Dynamic trends and driving forces of land use intensification of cultivated land in China. J. Geogr. Sci. 2015, 25, 45–57. [Google Scholar] [CrossRef]
- Lyu, X.; Peng, W.; Niu, S.; Qu, Y.; Xin, Z. Evaluation of sustainable intensification of cultivated land use according to farming households’ livelihood types. Ecol. Indic. 2022, 138, 108848. [Google Scholar] [CrossRef]
- Niu, S.; Lyu, X.; Gu, G.; Zhou, X.; Peng, W. Sustainable intensification of cultivated land use and its influencing factors at the farming household scale: A case study of Shandong province, China. Chin. Geogr. Sci. 2021, 31, 109–125. [Google Scholar] [CrossRef]
- Hou, X.; Liu, J.; Zhang, D.; Zhao, M.; Xia, C. Impact of urbanization on the eco-efficiency of cultivated land utilization: A case study on the Yangtze River economic belt, China. J. Clean. Prod. 2019, 238, 117916. [Google Scholar] [CrossRef]
- Hou, X.; Yin, Y.; Zhou, X.; Zhao, M.; Yao, L.; Zhang, D.; Wang, X.; Xia, C. Does economic agglomeration affect the sustainable intensification of cultivated land use? Evidence from China. Ecol. Indic. 2023, 154, 110808. [Google Scholar] [CrossRef]
- Liu, Z.; Yang, P.; Wu, W.; You, L. Spatiotemporal changes of cropping structure in China during 1980–2011. J. Geogr. Sci. 2018, 28, 1659–1671. [Google Scholar] [CrossRef]
- Cheng, X.; Tao, Y.; Huang, C.; Yi, J.; Yi, D.; Wang, F.; Tao, Q.; Xi, H.; Ou, W. Unraveling the causal mechanisms for non-grain production of cultivated land: An analysis framework applied in Liyang, China. Land 2022, 11, 1888. [Google Scholar] [CrossRef]
- Wu, Y.; Yuan, C.; Liu, Z.; Wu, H.; Wei, X. Decoupling relationship between the non-grain production and intensification of cultivated land in China based on Tapio decoupling model. J. Clean. Prod. 2023, 424, 138800. [Google Scholar] [CrossRef]
- Liang, J.; Pan, S.; Chen, W.; Li, J.; Zhou, T. Cultivated land fragmentation and its influencing factors detection: A case study in Huaihe river basin, China. Int. J. Environ. Res. Public Health 2022, 19, 138. [Google Scholar] [CrossRef]
- Erenstein, O. Intensification or extensification? factors affecting technology use in peri-urban lowlands along an agro-ecological gradient in West Africa. Agric. Syst. 2006, 90, 132–158. [Google Scholar] [CrossRef]
- Rasmussen, L.V.; Coolsaet, B.; Martin, A.; Mertz, O.; Pascual, U.; Corbera, E.; Dawson, N.; Fisher, J.A.; Franks, P.; Ryan, C.M. Social-ecological Outcomes of Agricultural Intensification. Nat. Sustain. 2018, 1, 275–282. [Google Scholar] [CrossRef]
- Gurr, G.M.; Lu, Z.X.; Zheng, X.S.; Xu, H.X.; Zhu, P.Y.; Chen, G.H.; Yao, X.M.; Cheng, J.; Zhu, Z.R.; Catindig, J.L.; et al. Multi-country evidence that crop diversification promotes ecological intensification of agriculture. Nat. Plants 2016, 2, 16014. [Google Scholar] [CrossRef] [PubMed]
- Pretty, J. Intensification for redesigned and sustainable agricultural systems. Science 2018, 362, 0294. [Google Scholar] [CrossRef] [PubMed]
- Liang, X.; Jin, X.; Sun, R.; Han, B.; Liu, J.; Zhou, Y. A typical phenomenon of cultivated land use in China’s economically developed areas: Anti-intensification in Jiangsu Province. Land Use Policy 2021, 102, 105223. [Google Scholar] [CrossRef]
- Ringler, C.; Bhaduri, A.; Lawford, R. The nexus across water, energy, land and food (WELF): Potential for improved resource use efficiency? Curr. Opin. Environ. Sustain. 2013, 5, 617–624. [Google Scholar] [CrossRef]
- Chen, A.; Hao, Z.; Wang, R.; Zhao, H.; Hao, J.; Xu, R.; Duan, H. Cultivated land sustainable use evaluation from the perspective of the water–Land–Energy–Food nexus: A case study of the major grain-producing regions in Quzhou, China. Agronomy 2023, 13, 2362. [Google Scholar] [CrossRef]
- Liu, J.; Xu, W.; Zhou, Y. Influence mechanism of cultivated land fragmentation on sustainable intensification and its governance framework. Acta Geogr. Sin. 2022, 77, 2703–2720. [Google Scholar] [CrossRef]
- Petersen, B.; Snapp, S. What is sustainable intensification? views from experts. Land Use Policy 2015, 46, 1–10. [Google Scholar] [CrossRef]
- Lai, Z.; Chen, M.; Liu, T. Changes in and prospects for cultivated land use since the reform and opening up in China. Land Use Policy 2020, 97, 104781. [Google Scholar] [CrossRef]
- Gao, Y.; Li, H.; Song, Y. Interaction relationship between urbanization and land use multifunctionality: Evidence from Han River basin, China. Land 2021, 10, 938. [Google Scholar] [CrossRef]
- Dadashpoor, H.; Azizi, P.; Moghadasi, M. Land use change, urbanization, and change in landscape pattern in a Metropolitan Area. Sci. Total Environ. 2019, 655, 707–719. [Google Scholar] [CrossRef]
- Wang, L.; Zhang, S.; Xiong, Q.; Liu, Y.; Liu, Y.; Liu, Y. Spatiotemporal dynamics of cropland expansion and its driving factors in the Yangtze River economic belt: A nuanced analysis at the county scale. Land Use Policy 2022, 119, 106168. [Google Scholar] [CrossRef]
- Geng, B.; Zheng, X.; Fu, M. Scenario analysis of sustainable intensive land use based on SD Model. Sustain. Cities Soc. 2017, 29, 193–202. [Google Scholar] [CrossRef]
- Dagum, C. A new approach to the decomposition of the Gini income inequality ratio. Empir. Econ. 1997, 22, 515–531. [Google Scholar] [CrossRef]
- Mishra, S.P.; Sarkar, U.; Taraphder, S.; Datta, S.; Swain, D.P.; Saikhom, R.; Panda, S.; Laishram, M. Multivariate statistical data analysis-principal component analysis (PCA). Int. J. Livest. Res. 2017, 7, 60–78. [Google Scholar] [CrossRef]
- Xu, D.; Zhang, K.; Cao, L.; Guan, X.; Zhang, H. Driving forces and prediction of urban land use change based on the Geodetector and CA-Markov model: A case study of Zhengzhou, China. Int. J. Digit. Earth 2022, 15, 2246–2267. [Google Scholar] [CrossRef]
- Moran, P.A.P. Notes on continuous stochastic phenomena. Biometrika 1950, 37, 17–23. [Google Scholar] [CrossRef] [PubMed]
- Charlton, M.E.; Brunsdon, C.F.; Fotheringham, A.S. Geographically weighted regression-modelling spatial non-stationarity. J. R. Stat. Soc. 1998, 47, 431–443. [Google Scholar] [CrossRef]
- Punzo, G.; Castellano, R.; Bruno, E. Using geographically weighted regressions to explore spatial heterogeneity of land use influencing factors in Campania (Southern Italy). Land Use Policy 2022, 112, 105853. [Google Scholar] [CrossRef]
- Alipbeki, O.; Alipbekova, C.; Sterenharz, A.; Toleubekova, Z.; Aliyev, M.; Mineyev, N.; Amangaliyev, K. A Spatiotemporal assessment of land use and land cover changes in Peri-Urban areas: A case study of Arshaly District, Kazakhstan. Sustainability 2020, 12, 1556. [Google Scholar] [CrossRef]
- Guo, S.; Wang, Y.; Wang, Y.; Wang, M.; He, P.; Feng, L. Inequality and collaboration in north China urban agglomeration: Evidence from embodied cultivated land in Jing-Jin-Ji’s interregional trade. J. Environ. Manag. 2020, 275, 111050. [Google Scholar] [CrossRef]
- Lu, X.; Zhang, Y.; Li, J.; Duan, K. Measuring the urban land use efficiency of three urban agglomerations in China under carbon emissions. Environ. Sci. Pollut. Res. 2022, 29, 36443–36474. [Google Scholar] [CrossRef] [PubMed]
- Dong, Y.; Zhou, Y.; Zhang, L.; Gu, Y.; Sutrisno, D. Intensive land-use is associated with development status in port cities of Southeast Asia. Environ. Res. Lett. 2023, 18, 044006. [Google Scholar] [CrossRef]
- Xiong, Y.; Chen, Y.; Peng, F.; Li, J.; Yan, X. Analog simulation of urban construction land supply and demand in Chang-Zhu-Tan Urban agglomeration based on land intensive use. J. Geogr. Sci. 2019, 29, 1346–1362. [Google Scholar] [CrossRef]
- Li, Q.; Wang, L.; Zhu, Y.; Mu, B.; Ahmad, N. Fostering land use sustainability through construction land reduction in China: An analysis of key success factors using fuzzy-AHP and DEMATEL. Environ. Sci. Pollut. Res. 2022, 29, 18755–18777. [Google Scholar] [CrossRef] [PubMed]
- Liu, X.; Zhao, C.; Song, W. Review of the evolution of cultivated land protection policies in the period following China’s reform and liberalization. Land Use Policy 2017, 67, 660–669. [Google Scholar] [CrossRef]
- Niu, S.; Lyu, X.; Gu, G. What is the operation logic of cultivated land protection policies in China? A grounded theory analysis. Sustainability 2022, 14, 8887. [Google Scholar] [CrossRef]
- Morales, C.; Pauw, K. Synergies and trade-offs between agricultural export promotion and food security: Evidence from African economies. World Dev. 2023, 172, 106368. [Google Scholar] [CrossRef]
- Guo, A.; Yue, W.; Yang, J.; Xue, B.; Xiao, W.; Li, M.; He, T.; Zhang, M.; Jin, X.; Zhou, Q. Cropland abandonment in China: Patterns, drivers, and implications for food security. J. Clean. Prod. 2023, 418, 138154. [Google Scholar] [CrossRef]
- Zhang, D.; Yang, W.; Kang, D.; Zhang, H. Spatial-temporal characteristics and policy implication for non-grain production of cultivated land in Guanzhong region. Land Use Policy 2023, 125, 106466. [Google Scholar] [CrossRef]


| Criterion | Indicator | Weight |
|---|---|---|
| Investment intensity | Agricultural machinery power (kW/hm2) | 0.079 |
| Proportion of effective irrigation area (%) | 0.076 | |
| Labor input index (person/104 hm2) | 0.07 | |
| Number of agricultural employees per capita (person/hm2) | 0.06 | |
| Utilization level | Multiple cropping index | 0.08 |
| Coefficient of cultivated land | 0.07 | |
| Cropland balance index | 0.056 | |
| Output benefits | Per capita grain (kg/person) | 0.083 |
| Agricultural supply index (104 CNY/person) | 0.073 | |
| Average output value of labor (104 CNY/person) | 0.071 | |
| The primary industry output value per square meter (CNY/m2) | 0.055 | |
| Continuous condition | Labor force index | 0.084 |
| Per capita cropland area (hm2/person) | 0.078 | |
| Population density (person/km2) | 0.065 |
| Target | Criterion | Factors | Description and Formulation |
|---|---|---|---|
| Driving Factors for CLIU | Natural factors | Elevation (m) | Digital elevation data acquisition |
| Slope (°) | Digital elevation data acquisition | ||
| Average annual precipitation (mm) | ERA5 meteorological data acquisition | ||
| Average annual temperature (°C) | ERA5 meteorological data acquisition | ||
| Humanistic factors | Labor force index | Number of employees in agriculture, forestry, animal husbandry, fishery/total population | |
| Food per capita (kg/person) | Grain yield/total population | ||
| Multiple cropping index | Total sown area of crops/cultivated land area | ||
| Agricultural machinery power (kw/hm2) | Total power of agricultural machinery | ||
| Average fixed assets investment (104 CNY/km2) | Fixed assets investment/administrative area | ||
| Number of industrial enterprises on average scale (units/km2) | Number of large-scale industrial enterprises/administrative area | ||
| Land average financial expenditure (104 CNY/km2) | Financial expenditure/administrative area | ||
| Land average labor force (person/km2) | Labor force/administrative area | ||
| Agricultural land per capita (hm2/person) | Agricultural land area/total population | ||
| Construction land per capita (m2/person) | Construction land area/total population | ||
| Road area proportion (%) | Rural road area/administrative area | ||
| Per capita dwelling area (m2/person) | Statistical data | ||
| GDP per km2 (CNY/km2) | GDP/Administrative area | ||
| Local average fiscal revenue (CNY/m2) | Fiscal revenue/administrative area | ||
| Retail sales of consumer goods per land (CNY/km2) | Retail sales of social consumer goods/administrative area | ||
| Average import and export volume (104 CNY/km2) | Import and export trade volume/administrative area | ||
| Number of medical and health beds per land (sheet/km2) | Number of medical and health beds/administrative area | ||
| Average number of students per land (person/km2) | Number of primary and middle school students/administrative area | ||
| College degree or above proportion (%) | Population with a college degree or above/total population | ||
| Urban population proportion (%) | Urban population/total population | ||
| Land average of loan amount (104 CNY/km2) | Loan amount/administrative area | ||
| Forest and grass coverage rate (%) | Forest and grassland area/administrative area | ||
| Scale of natural wetland protection (hm2) | Statistical data | ||
| Straight-line distance from the nearest port (km) | Baidu map distance measurement |
| Illustration | Expression | Types |
|---|---|---|
 | Nonlinear attenuation | |
 | Single-factor nonlinear attenuation | |
 | Double factor enhancement | |
 | Mutual independence | |
 | Nonlinear enhancement |
 represents ,
  represents ,
  represents ,
  represents .
| Drivers | Five Extracted Principal Component Representatives | ||||
|---|---|---|---|---|---|
| X1 | X2 | X3 | X4 | X5 | |
| Average fixed assets investment | 0.798 | −0.002 | −0.05 | 0.297 | 0.068 |
| Number of industrial enterprises on average scale | 0.637 | 0.038 | 0.186 | −0.125 | 0.44 |
| Land average fiscal expenditure | 0.924 | 0.155 | 0.185 | −0.108 | 0.095 |
| Land average labor force | 0.96 | 0.14 | 0.124 | −0.074 | 0.094 |
| Per capita agricultural land | −0.542 | 0.549 | 0.107 | 0.316 | −0.192 |
| Per capita construction land | −0.53 | −0.018 | 0.397 | 0.658 | −0.098 |
| Road area proportion | 0.443 | −0.568 | −0.084 | 0.42 | 0.451 |
| Per capita dwelling area | −0.51 | 0.352 | 0.309 | 0.147 | 0.463 |
| GDP per km2 | 0.914 | 0.162 | 0.311 | 0.008 | 0.015 |
| Local average fiscal revenue | 0.831 | −0.071 | −0.287 | 0.119 | −0.031 |
| Retail sales of consumer goods per land | 0.912 | 0.277 | 0.148 | 0.026 | −0.157 |
| Average import and export trade volume | 0.694 | 0.293 | 0.197 | 0.245 | −0.175 |
| Number of medical and health beds per land | 0.917 | 0.232 | 0.13 | −0.083 | 0.038 |
| Average number of students per land | 0.858 | 0.27 | 0.259 | −0.113 | −0.125 |
| College degree or above proportion | 0.653 | −0.152 | −0.514 | 0.316 | −0.07 |
| Urban population proportion | 0.747 | −0.108 | −0.496 | 0.079 | −0.078 |
| Land average of loan amount | 0.887 | 0.227 | −0.096 | 0.131 | −0.181 |
| Forest and grass coverage rate | −0.564 | 0.642 | −0.266 | 0.004 | −0.095 |
| Scale of natural wetland protection | −0.061 | −0.656 | 0.458 | 0.097 | −0.31 |
| Straight-line distance from the nearest port | −0.408 | 0.663 | −0.255 | 0.187 | 0.222 |
| Accumulated contribution rate | 52.62% | 65.03 | 72.77 | 78.34 | 83.11 |
| C = A ∩ B | A + B/Max (A, B) | Result | Interaction Type |
|---|---|---|---|
| Labor force index ∩ multiple cropping index = 0.859 | Max (labor force index, multiple cropping index) = 0.570 | C > max (A, B) | Dual factor enhancement |
| Labor force index ∩ agricultural machinery power = 0.837 | Labor force index + agricultural machinery power = 0.738 | C > A + B | Nonlinear enhancement |
| Labor force index ∩ industrial scale = 0.841 | Labor force index + industrial scale = 0.649 | C > A + B | Nonlinear enhancement |
| Multiple cropping index ∩ agricultural machinery power = 0.808 | Max (multiple cropping index, agricultural machinery power) = 0.570 | C > max (A, B) | Dual factor enhancement |
| Multiple cropping index ∩ construction land intensity = 0.842 | Max (multiple cropping index, construction land intensity) = 0.570 | C > max (A, B) | Dual factor enhancement |
| Multiple cropping index ∩ industrial scale = 0.837 | Multiple cropping index + industrial scale = 0.731 | C > A + B | Nonlinear enhancement |
| Multiple cropping index ∩ temperature = 0.765 | Max (multiple cropping index, temperature) = 0.570 | C > max (A, B) | Dual factor enhancement |
| Variant | Average | Standard Deviation | Minimum Value | Median | Maximum Values |
|---|---|---|---|---|---|
| Labor force index | 0.209 | 0.002 | 0.206 | 0.209 | 0.212 |
| Food per capita | 0.117 | 0.000 | 0.117 | 0.117 | 0.117 |
| Multiple cropping index | 0.211 | 0.001 | 0.210 | 0.211 | 0.213 |
| Agricultural machinery power | 0.110 | 0.003 | 0.104 | 0.109 | 0.116 |
| Land-related labor and financial input intensity | 0.009 | 0.001 | 0.006 | 0.009 | 0.010 |
| Port trade convenience | −0.003 | 0.000 | −0.004 | −0.003 | −0.003 |
| Population urbanization level | −0.039 | 0.002 | −0.041 | −0.039 | −0.036 |
| Intensification of construction land | 0.072 | 0.001 | 0.068 | 0.071 | 0.074 |
| Industrial scale | −0.023 | 0.000 | −0.025 | −0.023 | −0.023 |
| Elevation | 0.083 | 0.003 | 0.078 | 0.083 | 0.089 |
| Slope | −0.100 | 0.002 | −0.105 | −0.099 | −0.096 |
| Precipitation | −0.087 | 0.001 | −0.089 | −0.087 | −0.084 |
| Temperature | 0.332 | 0.002 | 0.328 | 0.332 | 0.337 |
Disclaimer/Publisher’s Note: The statements, opinions and data contained in all publications are solely those of the individual author(s) and contributor(s) and not of MDPI and/or the editor(s). MDPI and/or the editor(s) disclaim responsibility for any injury to people or property resulting from any ideas, methods, instructions or products referred to in the content. |
© 2024 by the authors. Licensee MDPI, Basel, Switzerland. This article is an open access article distributed under the terms and conditions of the Creative Commons Attribution (CC BY) license (https://creativecommons.org/licenses/by/4.0/).
Share and Cite
Zhang, Z.; Zhang, Y.; Zhang, X. Spatial Heterogeneity and Driving Mechanisms of Cultivated Land Intensive Utilization in the Beibu Gulf Urban Agglomeration, China. Sustainability 2024, 16, 4565. https://doi.org/10.3390/su16114565
Zhang Z, Zhang Y, Zhang X. Spatial Heterogeneity and Driving Mechanisms of Cultivated Land Intensive Utilization in the Beibu Gulf Urban Agglomeration, China. Sustainability. 2024; 16(11):4565. https://doi.org/10.3390/su16114565
Chicago/Turabian StyleZhang, Zhongqiu, Yufeng Zhang, and Xiang Zhang. 2024. "Spatial Heterogeneity and Driving Mechanisms of Cultivated Land Intensive Utilization in the Beibu Gulf Urban Agglomeration, China" Sustainability 16, no. 11: 4565. https://doi.org/10.3390/su16114565
APA StyleZhang, Z., Zhang, Y., & Zhang, X. (2024). Spatial Heterogeneity and Driving Mechanisms of Cultivated Land Intensive Utilization in the Beibu Gulf Urban Agglomeration, China. Sustainability, 16(11), 4565. https://doi.org/10.3390/su16114565