1. Introduction
Urban regeneration and sustainable development are two key and intertwined issues on the policy agenda as well as in planning practices and research. To “make cities inclusive, safe, resilient, and sustainable”, the Sustainable Development Goal (SDG) of the United Nations’ Agenda 2030 No. 11 focuses on the urban environment, and the New Urban Agenda supports this objective by promoting urban planning as an influential instrument for sustainable development [
1,
2].
Nevertheless, pursuing those objectives in developed countries means activating and prioritizing extensive regeneration processes in the existing city. It seems particularly crucial in Europe, where policies to curb land-take attempt to foster new inward development through regeneration, infill, or redevelopment [
3].
Urban regeneration involves a systematic and comprehensive set of actions to address ever-changing urban challenges and improve degraded urban areas from physical, environmental, social, and economic perspectives. Urban regeneration, which aims to solve physical urban problems, employs criteria, methodologies, and techniques. It aims at a comprehensive, long-term, and holistic renewal and redevelopment of obsolete infrastructures or built-up areas, resulting from changing accessibility and sustainability requirements, urban planning, and building regulations, or simply from the ineluctable cycle of building and infrastructure deterioration [
4,
5,
6,
7,
8].
Hence, urban regeneration interventions occur in the pre-existing city, typically by recovering and replacing large disused areas (e.g., former industrial or infrastructure sites abandoned or relocated) or obsolete building stock. The first approach, as a large-scale intervention, usually requires an effective urban planning and design phase and significant investments from the public sector and/or large development corporations. The second approach is generally property-led, through public or private regeneration interventions relying on planning and building regulations. In the past, a neighborhood-scale approach has been used to replace obsolete homes in urban residential areas (e.g., the Oldham and Rochdale Pathfinder Partnership in the UK), necessitating considerable institutional capacity and the use of Compulsory Purchase Orders, thus having little success [
9].
However, there is now a need to carefully plan the regeneration of the residential urban fabric in widespread terms, as available data on the energy performance of obsolete residential building stock in many European countries could be more encouraging. According to data from the European Union on Energy [
10], the residential sector still consumes much energy (primarily for space heating) and emits much CO
2. The EU Building Stock Observatory [
11] reports that the majority of buildings in Europe are used for residential purposes; this is especially true for Italy, where about 90% of the gross floor area is residential. Furthermore, a considerable portion of residential buildings (more than 50%) were built before the 1970s, i.e., before buildings’ energy efficiency regulations. Even in other European countries such as Germany, Estonia, Slovenia, and the UK, this share exceeds 50%. A relevant additional issue involves the structural safety of obsolete buildings, often built before earthquake-proof safety regulations.
Considering the regeneration of obsolete residential areas as a systematic replacement action implies a careful urban planning effort to define the constraints, the perimeter and size of the regeneration areas, the degree of their transformability, the priority of intervention, as well as the urban planning parameters that will guide the redevelopment. The scientific literature on urban regeneration is expansive, and there is significant consolidated experience and research concerning the redevelopment of abandoned areas. On the other hand, a shared and transferable approach to replacing parts of the city that are still functional and in use is elusive due to local-based or place-based approaches that consider a tradition of city-making and different national or regional urban regulations. Concerning urban planning, however, even just the identification of flexible criteria for selecting feasible and priority urban areas for redevelopment and regeneration within the “inhabited” city is particularly interesting for research and practice.
Within this framework, the paper proposes a possible methodological approach to identify urban residential areas and building stock that are obsolete and inadequate in terms of functionality (for new families, for different types of aggregation and work), performance (e.g., seismic adjustment and energy efficiency), and infrastructure (i.e., public facilities and spaces). Interventions in these areas range from projects for the recovery and unitary redevelopment of existing buildings to the full or partial replacement of building fabric, densification, and improvement of public facilities and open spaces. The size of the urban block or a small cluster of blocks is considered the preferential urban scale for this type of intervention to pursue a structured reorganization of the urban fabric, with the possibility of keeping more or less coherence with the pre-existing street pattern.
The paper proposes a simplified two-step approach to defining these priority areas within the urban planning tool. It is based on an urban-scale analysis (within municipal administrative limits) of several factors, including uses, date and state of building conservation, housing density, the endowment of public facilities and spaces, and the levels of accessibility through sustainable mobility systems. The method is then tested in the medium-sized city of Parma (Italy).
The findings could help public administrations rationalize and prioritize sites for urban regeneration and implement the framework in urban planning procedures. In particular, the method is designed for small and medium-sized cities where private ownership is highly fragmented, as is the case in Italy, where public administration capacity (i.e., economic and social resources) is potentially weaker, and where access to large volumes of urban data is generally more difficult.
The paper is structured as follows:
Section 2 provides some literature references to frame assessment methods and criteria for widespread urban regeneration selection;
Section 3 describes the framework;
Section 4 specifies some materials about analysis and application to the case study;
Section 5 illustrates the application to the Parma case study;
Section 6 briefly discusses the results and relates them to the state-of-the-art and concludes the paper by highlighting original contributions, limitations, and further developments.
2. State of the Art
The topic of urban regeneration is broad and discussed, fostered by several strategies, initiatives, and agendas at different levels. The aforementioned UN Sustainable Development Goals and the New Urban Agenda [
1,
2], as well as major European strategies like the EU Green Deal [
12] and the related New European Bauhaus initiative [
13], cannot avoid declining their objectives from an urban regeneration perspective. Specific EU programs focused on urban regeneration and area assessment and implication through systematic reading of case studies with an emphasis on, e.g., historic areas (CETRINNO, T-Factor, ARCH projects [
14]), a posteriori adequacy (URBAN-IMPACTS [
15]), and relationship to smart cities (REMOURBAN [
16])]. In 2019, the C40 Cities Climate Leadership Group launched the Reinventing Cities initiative [
17] to enhance underutilized sites through sustainable projects to drive decarbonized and resilient urban regeneration. And in Italy, several national and regional initiatives fund urban regeneration interventions at different scales: in 2016, the national Bando Periferie financed several regeneration and redevelopment projects in the outskirts of metropolitan cities and provincial capital municipalities [
18], and Regions also offered several opportunities to fund regeneration projects through specific calls (see, i.e., [
19,
20]).
However, urban regeneration interventions developed within those strategies and competitive calls often consist of interventions on specific, very critical, and predefined sites (by administrations or operators) rather than widespread strategies for the consolidated city. Moreover, looking at the scientific literature from a methodological point of view, not many studies have deepened specific criteria and parameters for the preliminary identification of high-priority areas within the “inhabited city” yet. Most studies adopted a retrospective approach to assessing urban regeneration through ex post case analysis [
21,
22,
23]. Concurrently, many studies focused on methods that faced the issue of building scale. It was concerned with conservation, historical and cultural heritage issues [
24,
25,
26], or technological issues of energy efficiency [
27,
28,
29,
30].
Differently, more circumscribed urban studies focused on assessment methods. They vary depending on the scale of analysis, focus, and parameters involved. For instance, Ruá et al. [
31] developed a simplified model to assess vulnerable city areas for urban regeneration. The method was applied to developing the new Land-Use Plan of Castellón (Spain), and the results revealed priorities for potential urban interventions. The authors selected 29 factors by correlating building vulnerability in terms of sustainability (urban, building, socio-economic, and socio-demographic) and verifying spatial data with GIS. Therefore, they engaged experts and citizens in participatory processes. Next, the same authors refined the proposed methodology [
32] by incorporating a SWOT analysis. This highlighted three levels of urban vulnerability factors: the city scale, the neighborhood scale, and the building scale. At the city level, the model encompassed parameters like historical, technical, and social features, the urban development and regulatory framework, as well as the presence of social housing and the characterization of urban areas in terms of typology and construction period. The model identified vulnerable areas at the neighborhood level through a comprehensive view of urban, building, and social features. The building scale involved building features like energy performance and accessibility. Finally, the CAME methodology completed the study by correcting weaknesses, adapting to threats, maintaining existing strengths, and exploring identified opportunities.
Tiboni et al. [
33] assessed the ex-ante situation and ex-post effects of urban regeneration interventions by using simple indicators such as population distribution, service distribution, green spaces, cycle and pedestrian paths, building consistency, and housing prices, as well as composite indicators derived from the previous ones. Sütçüoğlu and Önaç [
34] considered geological status, distance to primary schools, green areas and natural gas lines, crime rate, number of suicides and suicide attempts, building date, and density in their site selection model for sustainable urban regeneration. Martì et al. [
35] applied location-based social networks (LBSNs) as a complementary source for prioritizing urban regeneration areas. The approach considers a dual perspective: people-based and place-based. The first considered users’ preferences, use, and activities collected from social media (i.e., Foursquare, Twitter, Google Places, and Airbnb). The second is based on morphological features, i.e., mapping urban activity models derived from social media within the neighborhood. Therefore, the selection considered the vivacity over time of activities at the neighborhood scale due to the affective relationship between people and places. Interesting issues concern the capability of mapping informal public spaces facing intangible aspects of regeneration [
36]. Finally, Mercader-Moyano et al. [
37] proposed an interdisciplinary index method to support decision-making in quantifying the vulnerability of existing neighborhoods and implementing appropriate regeneration strategies. The ponderate method examined four basic criteria—i.e., building, urban, environmental, and social—broken down into 32 quantitative and qualitative parameters. Moreover, the authors linked priority values from technical inspection schedules to residents’ demands and needs derived from surveys. Capolongo et al. [
38] focused on the decision-making process, but for the selection of the most suitable scenario for a specific urban regeneration project through a multi-methodological approach that considers stakeholder analysis, multi-criteria analysis, and discounted cash flow analysis. Morano et al. [
39] applied an econometric technique to investigate the influence of possible location factors on selling prices.
Generally, previous literature has focused on the multidisciplinary assessment of the built environment or the combination of technical and social variables collected through direct inspections, participatory processes, or (indirectly) open data collection. The criteria were always tied to sustainability issues, and the assessment methods prioritized economic, environmental, and social degradation. Furthermore, the methods are often applied at the neighborhood scale due to the complexity of the parameters to be considered. Finally, recent research showed that applying a methodological framework to support decision-making in urban regeneration interventions is a timely and primary concern.
2.1. Why the Medium-Sized Italian Case?
Studies on urban regeneration have primarily focused on metropolises or large cities, probably due to advanced urban governance tools, competitiveness, and economic resources. However, small and medium-sized cities in Europe are relatively typical of the urban system [
40,
41]. However, they are also distinguished by (mostly economic) vulnerabilities and constraints and by the coexistence of several, often contradictory, urban traits [
42,
43]. The changes and persistence of social, economic, and environmental environments lead to situations and outcomes that emphasize clear and deep constitutive distinctions between metropolitan conurbations, medium-sized cities, and smaller centers. In terms of plans, strategies, and transformative methods toward resilient, sustainable models, medium-sized cities have received less attention than their metropolitan surroundings. It is a symptom of obvious functional constraints related to minor capacities in economic (amounts and types of investments, environmental uncertainty), institutional (time and budget for multi-criteria decision-making, less developed data infrastructures), and technical (skills and staff size) capacities in dealing with these complex processes of urban transformation [
44]. Despite these constraints, medium-sized cities have unique opportunities [
45]. It is no coincidence that several of the previously reported studies [
29,
30,
31,
33,
35] are applied to cases of medium-sized cities, probably due to an implicit need to define tools to support urban policies. Consequently, developing viable methodological frameworks for such contexts can be a lens for many European cities.
This research focuses on a case study of the Italian scenario, representing a small and medium-sized territorial structure. Italy has a large building stock of about 13.5 million, of which more than 12 million are residential. More than 70% (8.5 million) were built before 1980 and more than 50% before 1970 [
46]. These percentages suggest that more than half of residential buildings in Italy have poor energy efficiency, as they were built before Italian energy performance legislation (No. 373/1976). Furthermore, about 41% of the 12 million residential buildings were built by forms of self-promotion (even abusive) or professional figures such as site managers or master builders (probably the historical ones); surveyors designed 40%, and only 19% can be attributable to architects and engineers [
47]. Consequently, these conditions suggest an urgency for new approaches to the widespread urban regeneration of the existing city.
2.2. Motivation and Originality
Previous studies developed methods and approaches that required accurate data, long-term data collection, and associated technical costs. Therefore, the literature review has shown the need for more simplified and rapid methods to solve and adapt to the difficulties characterizing small and medium-sized cities. Consequently, the originality of the paper consists of a simplified methodological framework to prioritize urban regeneration areas in residential areas and contributes to:
Focus on widespread urban regeneration processes, taking an interest in the urban fabric with settled functions, not just in derelict sites;
Implement urban-scale analysis to select fine urban portions on which to plan urban regeneration interventions or deepen the analysis at the building-scale by technical inspection and participatory processes;
Define a rapid analysis from readily available parameters that is replicable in different contexts, addressing multiple issues related to costs and times required by technical and participatory surveys;
Support public administration in decision-making and urban policymaking.
In the Italian city of Parma, located in the Emilia-Romagna region, the regional urban planning law (L.R. Emilia-Romagna No. 24/2017) has an interesting application. The law introduced some relevant innovations for land containment and urban regeneration, in line with the most recent European guidelines. According to the law, the local planning tool, i.e., the municipal General Urban Plan (PUG—Piano Urbanistico Generale), should largely regulate and encourage urbanized land reuse and regeneration processes. The plan specifies broad localization requirements for extensive urban reuse, densification, and regeneration initiatives using an ideogrammatic cartographic depiction. In essence, the plan identifies the perimeter of the urbanized area where regeneration interventions are allowed. On the other hand, the specific delimitation of the intervention areas is the unique competence of the implementation tools defined in the operating agreements (i.e., accordi operativi), according to a sui generis “deferred time” zoning. One of the main innovations in the law is, indeed, this operational agreement between the developer and the local government. The agreement defines the exact location and perimeter of the regeneration area, as well as the urban planning regulations and the allocation of building rights, through explicit negotiations with the local government.
3. Methodological Framework
The methodological framework to locate potential regeneration sites within the existing city is divided into two sequential steps, illustrated in the following sections. Each step proposes criteria for a progressive selection of areas potentially eligible for a feasibility check within the framework of diffuse urban regeneration plans and programs. The ideal minimum spatial unit considered appropriate for the analysis is a city block or small cluster of blocks. Indeed, the urban block, in its various forms, is “the city’s constitutive element” [
48], whose shape reflects the design of the urban layout. It is both an implicit datum inherited from the historical city and a compulsory element (more or less explicit) in the city design [
49]. Moreover, this spatial unit is large enough to provide for an overall regeneration plan/program that goes beyond the replacement of individual buildings; at the same time, it is small enough to accurately outline all the criteria set out in the methodological framework.
3.1. Step 1: Preliminary Assessment
The first step pre-selects city blocks that can be subjected to subsequent in-depth analysis. The pre-selection is based on three criteria that define the urban fabric’s potential degree of transformability quantitatively. This set of criteria (
Table 1) derives from the preconditions of the study, which focuses on obsolete residential areas of medium-sized cities with an average urban density.
Land use is the first criterion for identifying city blocks with a predominant residential function. The residential function has been defined as a prerequisite for our study because, firstly, the sector still consumes a lot of energy and produces a lot of CO2 emissions in the European context where it involves the majority of buildings; secondly, a high proportion of residential function could be an indicator of mono-functionality, which is a negative factor and could therefore suggest the need for functional regeneration towards mixité.
The second criterion uses building dating to define the performance of the urban residential fabric and its propensity to deterioration. It provides a subset of spatial units with an absolute majority of buildings constructed between the 1940s and 1970s, i.e., a building stock with poor structural (anti-seismic) and energy performance, as highlighted in the state of the art. Finally, the third criterion concerns urban density. It includes two main conditions: the identification of a suitable threshold of population density potentially prone to further densification and the prevalence of higher-density building types (e.g., multi-family houses, apartment blocks of three or more stories), which could be more easily prone to partial or total replacement than single-family houses, ensuring that the regeneration intervention is consistent with the existing building types. The regeneration goal is to balance built and open space, possibly saving infrastructural resources and maximizing economic and financial sustainability.
3.2. Step 2: Selection of Regeneration Areas
The second step identifies priority areas. Unlike the previous one, the Step assesses quantitatively and qualitatively the propensity degree to regeneration. Criteria were defined as factors enhancing regeneration, i.e., according to their capability to simplify the process (economic and administrative) and to induce positive synergies in the regeneration areas. Therefore, the objective of the Step is double: to detect the most degraded areas where regeneration can be fostered, facilitate the regeneration process, and increase the appeal of the regenerated area. Consequently, the research on positive synergies aims to secure an acceptable minimum level of attraction from residents’ perspectives (e.g., proximity to facilities or sustainable mobility infrastructures).
Five main criteria were derived from the literature review (
Table 2).
The first criterion is spatial availability, i.e., the share of empty housing units within the city block. A high percentage of disused dwellings decreases the urban load that may potentially burden the city due to inhabitants’ relocation in cases of demolition and reconstruction. Furthermore, empty or rented housing units imply a lower effort for property acquisition, favoring economic and financial feasibility by increasing the degree of low-cost transformability or reducing the number of private owners to deal with.
The second criterion is economic feasibility, i.e., the cost-effectiveness of the regeneration process for the developer. This results in two separate issues. The first issue concerns real estate devaluation, e.g., the reduction of property values in the purchase, sale, or rental costs. This phenomenon may not refer to punctual situations (individual buildings) but also to the general condition of an urban sector due to direct or indirect effects of urban decay (e.g., situations of physical isolation, social distress, or severe environmental pollution). The second issue concerns the economic sustainability of property acquisition according to greater purchasing power by the developer (private, public, private/public). It results in procedural and temporal simplification.
The third criterion aims to determine the degree of socio-economic degradation, i.e., it describes variables related to the urban poverty concept as a multi-variable hardship. Therefore, it constitutes a relevant criterion for identifying priority areas to regenerate [
50,
51]. Specifically, it describes “symptoms” of economic-income poverty dictated by, e.g., low education levels and temporary or stable absent-income conditions. Furthermore, it verifies migratory vulnerabilities and spatial confluences as “signals” of ethnic-cultural segregation.
The fourth criterion is proximity to facilities and services, i.e., the degree of accessibility (understood as walking distances) to existing catalyzing elements of opportunity on a neighborhood scale positively affecting attractiveness for potential new inhabitants, e.g., shops for first and second necessities and neighborhood public facilities and spaces [
52]. The beneficial effect of these functions is well known: they can attract and vitalize urban space and routes, preventing them from becoming empty, inhospitable, and desolate environments [
53]. However, the compatibility of the considered services must refer to the main land uses subject to urban transformation.
Finally, the fifth criterion (sustainable mobility) studies travel opportunities by looking at infrastructure services for sustainable and slow mobility [
54]. This criterion introduces two positive synergic elements to regeneration. Similarly to the previous one, it concerns proximity, intended as the degree of accessibility to nodes and networks [
55]. For instance, the presence of pedestrian and cycling infrastructure determines a potential interaction with surrounding functions (schools, trade of first and second necessities) [
56]. This potential expands in scale when considering collective public transportation stops. Secondly, this criterion affects the sustainability of the transformation, i.e., the mobility of future residents, involving a significant element of modal change on the neighborhood micro-scale (pedestrian, cycle paths) and the urban macro-scale (public transport). Last, the slow mobility network also influences the real estate process, positively performing in highly passable and accessible areas intended for offices and residences [
57,
58].
For each condition identified in the previous two steps, the methodology assigns parameters and threshold values to define the presence/absence of the given condition in the chosen minimum urban unit.
4. Data and Materials: The Case Study of Parma’s Inner Area
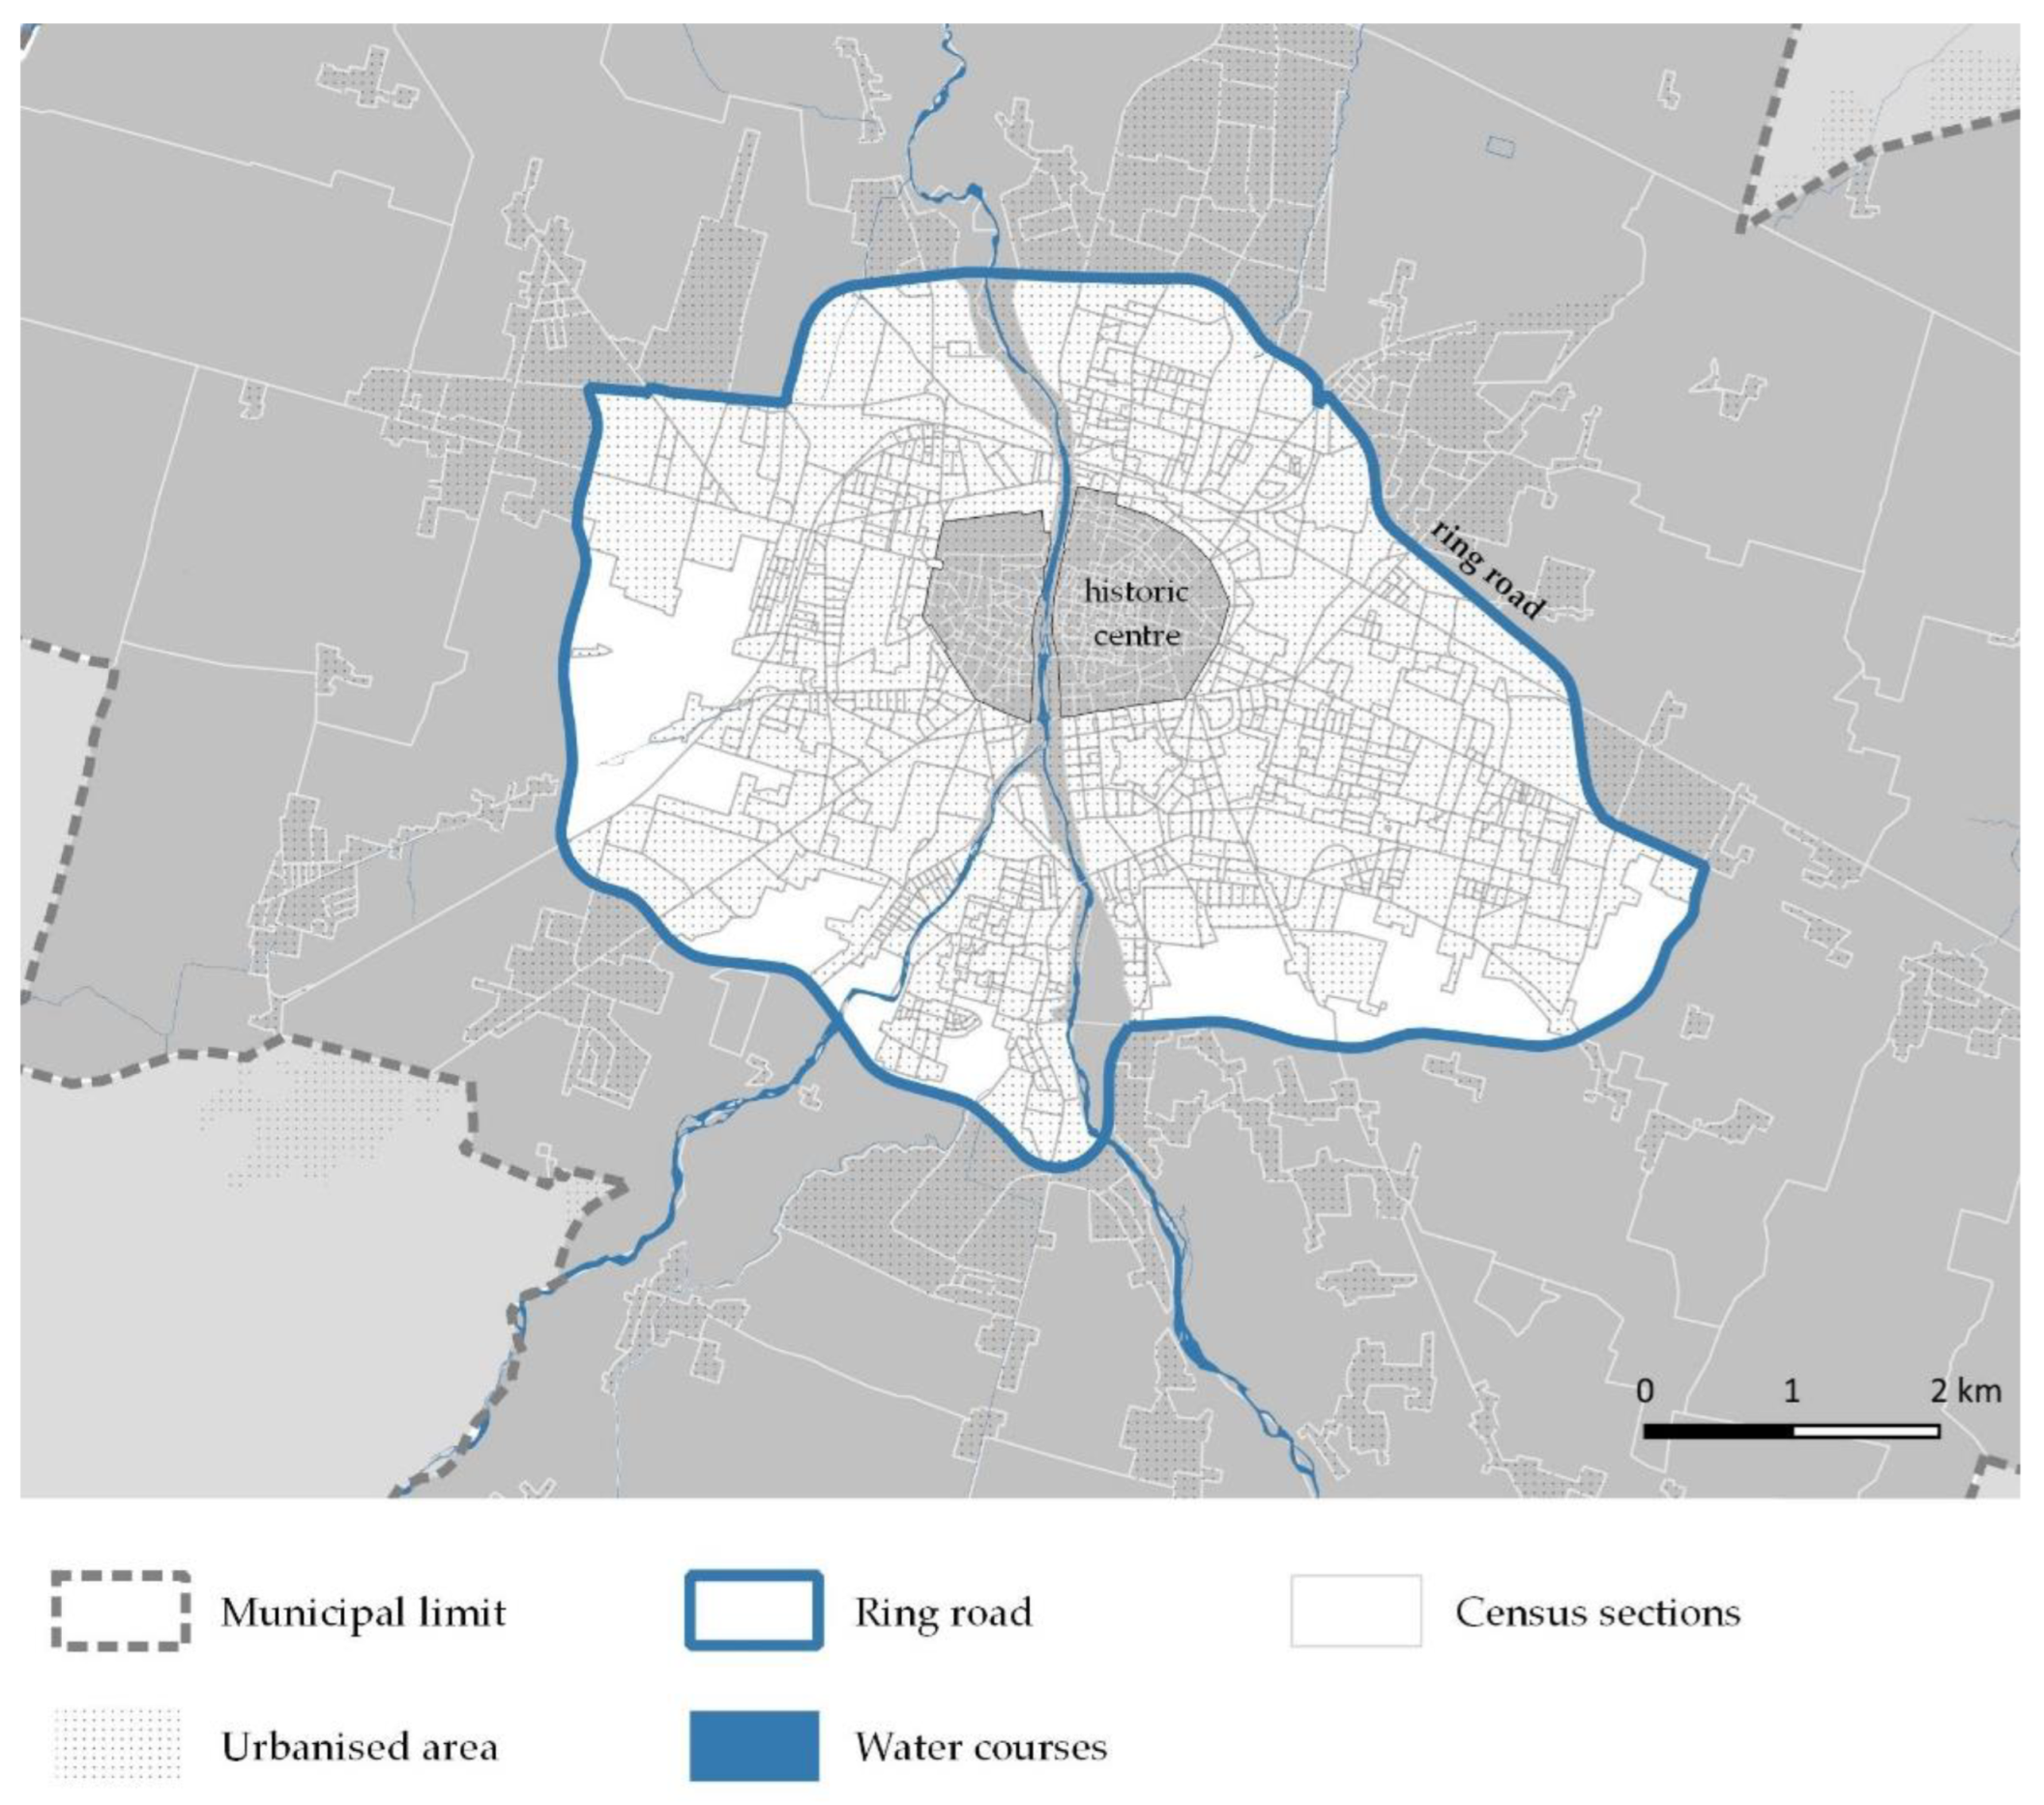
The methodological framework is then applied to the case study of Parma. Parma is a medium-sized city with a population of 196,981 inhabitants, located in the western part of the Emilia-Romagna region in Northern Italy, approx. 100 km from Bologna, the regional capital.
The city is developing a General Urban Plan (PUG) compliant with the Emilia-Romagna regional planning law No. 24/2017. Within this legislative framework, the process for the new PUG places great emphasis on the attractiveness and liveability of the city and urban regeneration policies. The first documents released synthesize the outcomes of the participatory process of the plan and define its overall strategy and vision. In particular, the Parma 2050 PUG vision foresees a polycentric city through the regeneration and redevelopment of urban parts. It envisions a regeneration capable of both redevelopment interventions and the replacement and reconstruction of obsolete building stock, allowing the configuration of a city that performs better, both in terms of life quality for those who live there and in terms of appeal to those who would like to come to live there in the future [
59].
The paper focuses on the urban area inside Parma’s ring road (freeway) but outside the historic center, which is the more densely urbanized area built after the Second World War. More precisely, after 1945, the demand for housing led to the expansion of the city outside the historic center. Until the 1960s, the saturation of the peripheral areas occurred almost homogeneously, leaving little space for public facilities and green areas. The phenomenon is then contrasted by the large public housing areas of the 1960s, whose compositional morphology is organized in an alternation of public spaces and densely built-up areas [
60].
Figure 1 shows the study area.
Therefore, the analysis did not consider the peri-urban fringes characterized by recent buildings (post-90s urban expansion). Moreover, the core of the historical center was excluded due to the overlapping of complex issues (mainly historical and landscape constraints) and the implementation of specific renewal programs.
Data helpful in analyzing the criteria and conditions described in
Section 3 is elaborated in several layers and represented in a GIS environment (software Quantum GIS Desktop 3.28 LTR). GIS software is relevant for managing many types of data and representing and interpreting the results. Data collected and elaborated from the various layers are then traced back to the minimum urban units, i.e., Parma’s census sections, through the GIS functions of data aggregation and spatial analysis. Census sections are the minimum census unit covering Italy. Within cities’ inner areas, census sections cover approximately the extension of single or multiple urban blocks, making them particularly suitable for study purposes. The census sections analyzed are 991. The main data sources are:
The National Institute of Statistics (ISTAT) for the acquisition of the census sections shapefile and census variables (alphanumeric tables) relating to demographic and housing consistency;
The Italian Real Estate Market Observatory (Osservatorio Mercato Immobiliare—OMI) for the acquisition of OMI zones and relative real estate values;
Open data from Open Street Maps (OSM) for public facility distribution, mobility nodes, and services;
Open data from the Municipality’s Spatial Information System, mainly for building data (height) and slow mobility networks.
Parameters are defined in line with data availability and threshold values based on the characteristics of the case study. The types of spatial analysis applied to parameters are statistical correlation and Euclidean distances. Finally, the results of each parameter are normalized. The priority areas’ locations and sizes are determined by using the suitability map.
5. Results
5.1. Step 1: Preliminary Assessment
Criteria representing the propensity to transformability (according to Step 1 of the methodological framework) are specified in
Table 3. One or more parameters are identified for each criterion (second column), reporting suitable threshold values based on territorial specificities (third column). The last column of
Table 3 shows the data source.
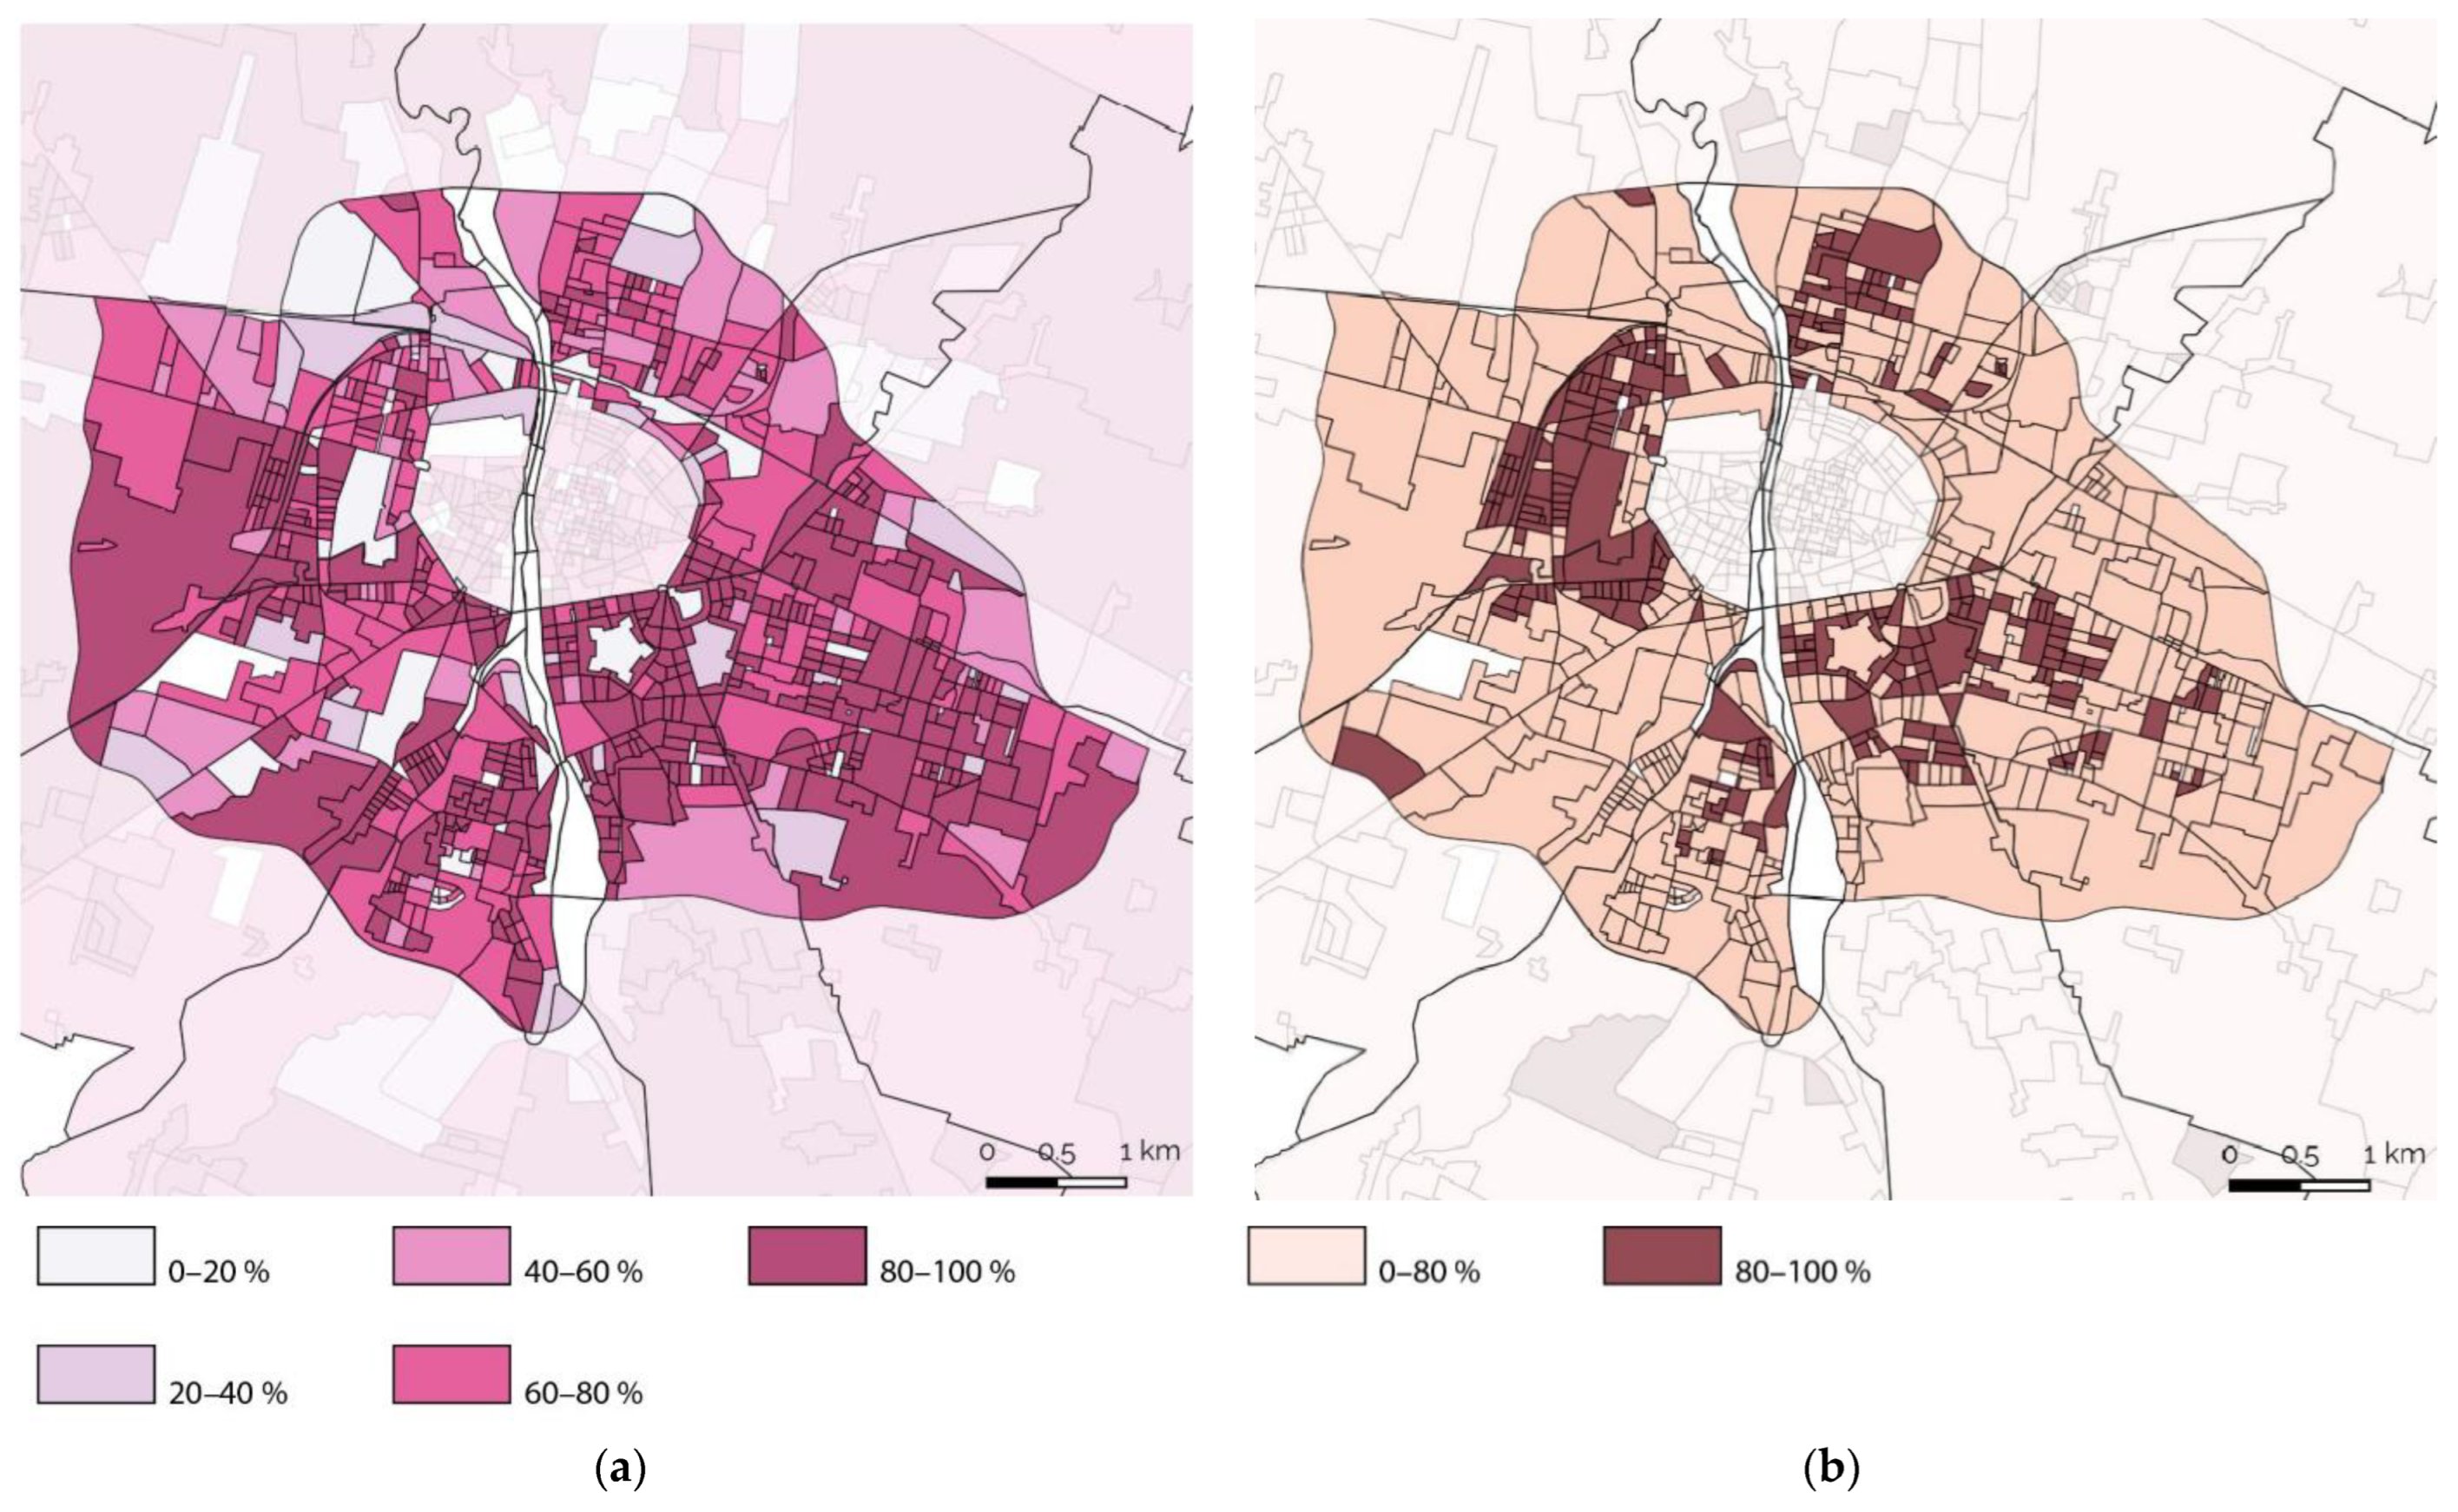
The first criterion (Land use) aims to bring out portions of the urban fabric with a predominance of residential buildings. A minimum share of 80% of residential buildings within each analyzed parcel (census section) is set as a threshold value.
Figure 2a shows that residential buildings are numerous and evenly distributed throughout the analyzed urban area. Most census sections that comply with the limit value are located in the south, east, and west areas of the city. In contrast to those areas, the northern area was characterized by a minimum functional prevalence and a non-homogeneous distribution.
The second criterion concerns the dating of buildings. The selected parameter is the share of buildings constructed in the 1940s–1970s, considering as a threshold value a percentage of buildings constructed in this timeframe equal to or greater than 80%. This period was characterized by post-war reconstruction and a substantial expansion of the first suburbs to meet housing needs in Italy. The building boom led to the development of new residential districts, saturating undeveloped areas. However, this period is generally associated with inadequate construction techniques for structural safety and earthquake-proofing requirements. Therefore, it suggests a high propensity for static deterioration of the structures and greater vulnerability in the event of a seismic event. As already mentioned, another critical issue is energy efficiency and the obsolete internal functional distribution, given the changed family structure and needs.
Figure 2b shows that most areas that meet this condition are concentrated in the immediate proximity of the city wall. They are mainly concentrated in the north, west, and southeast of the city.
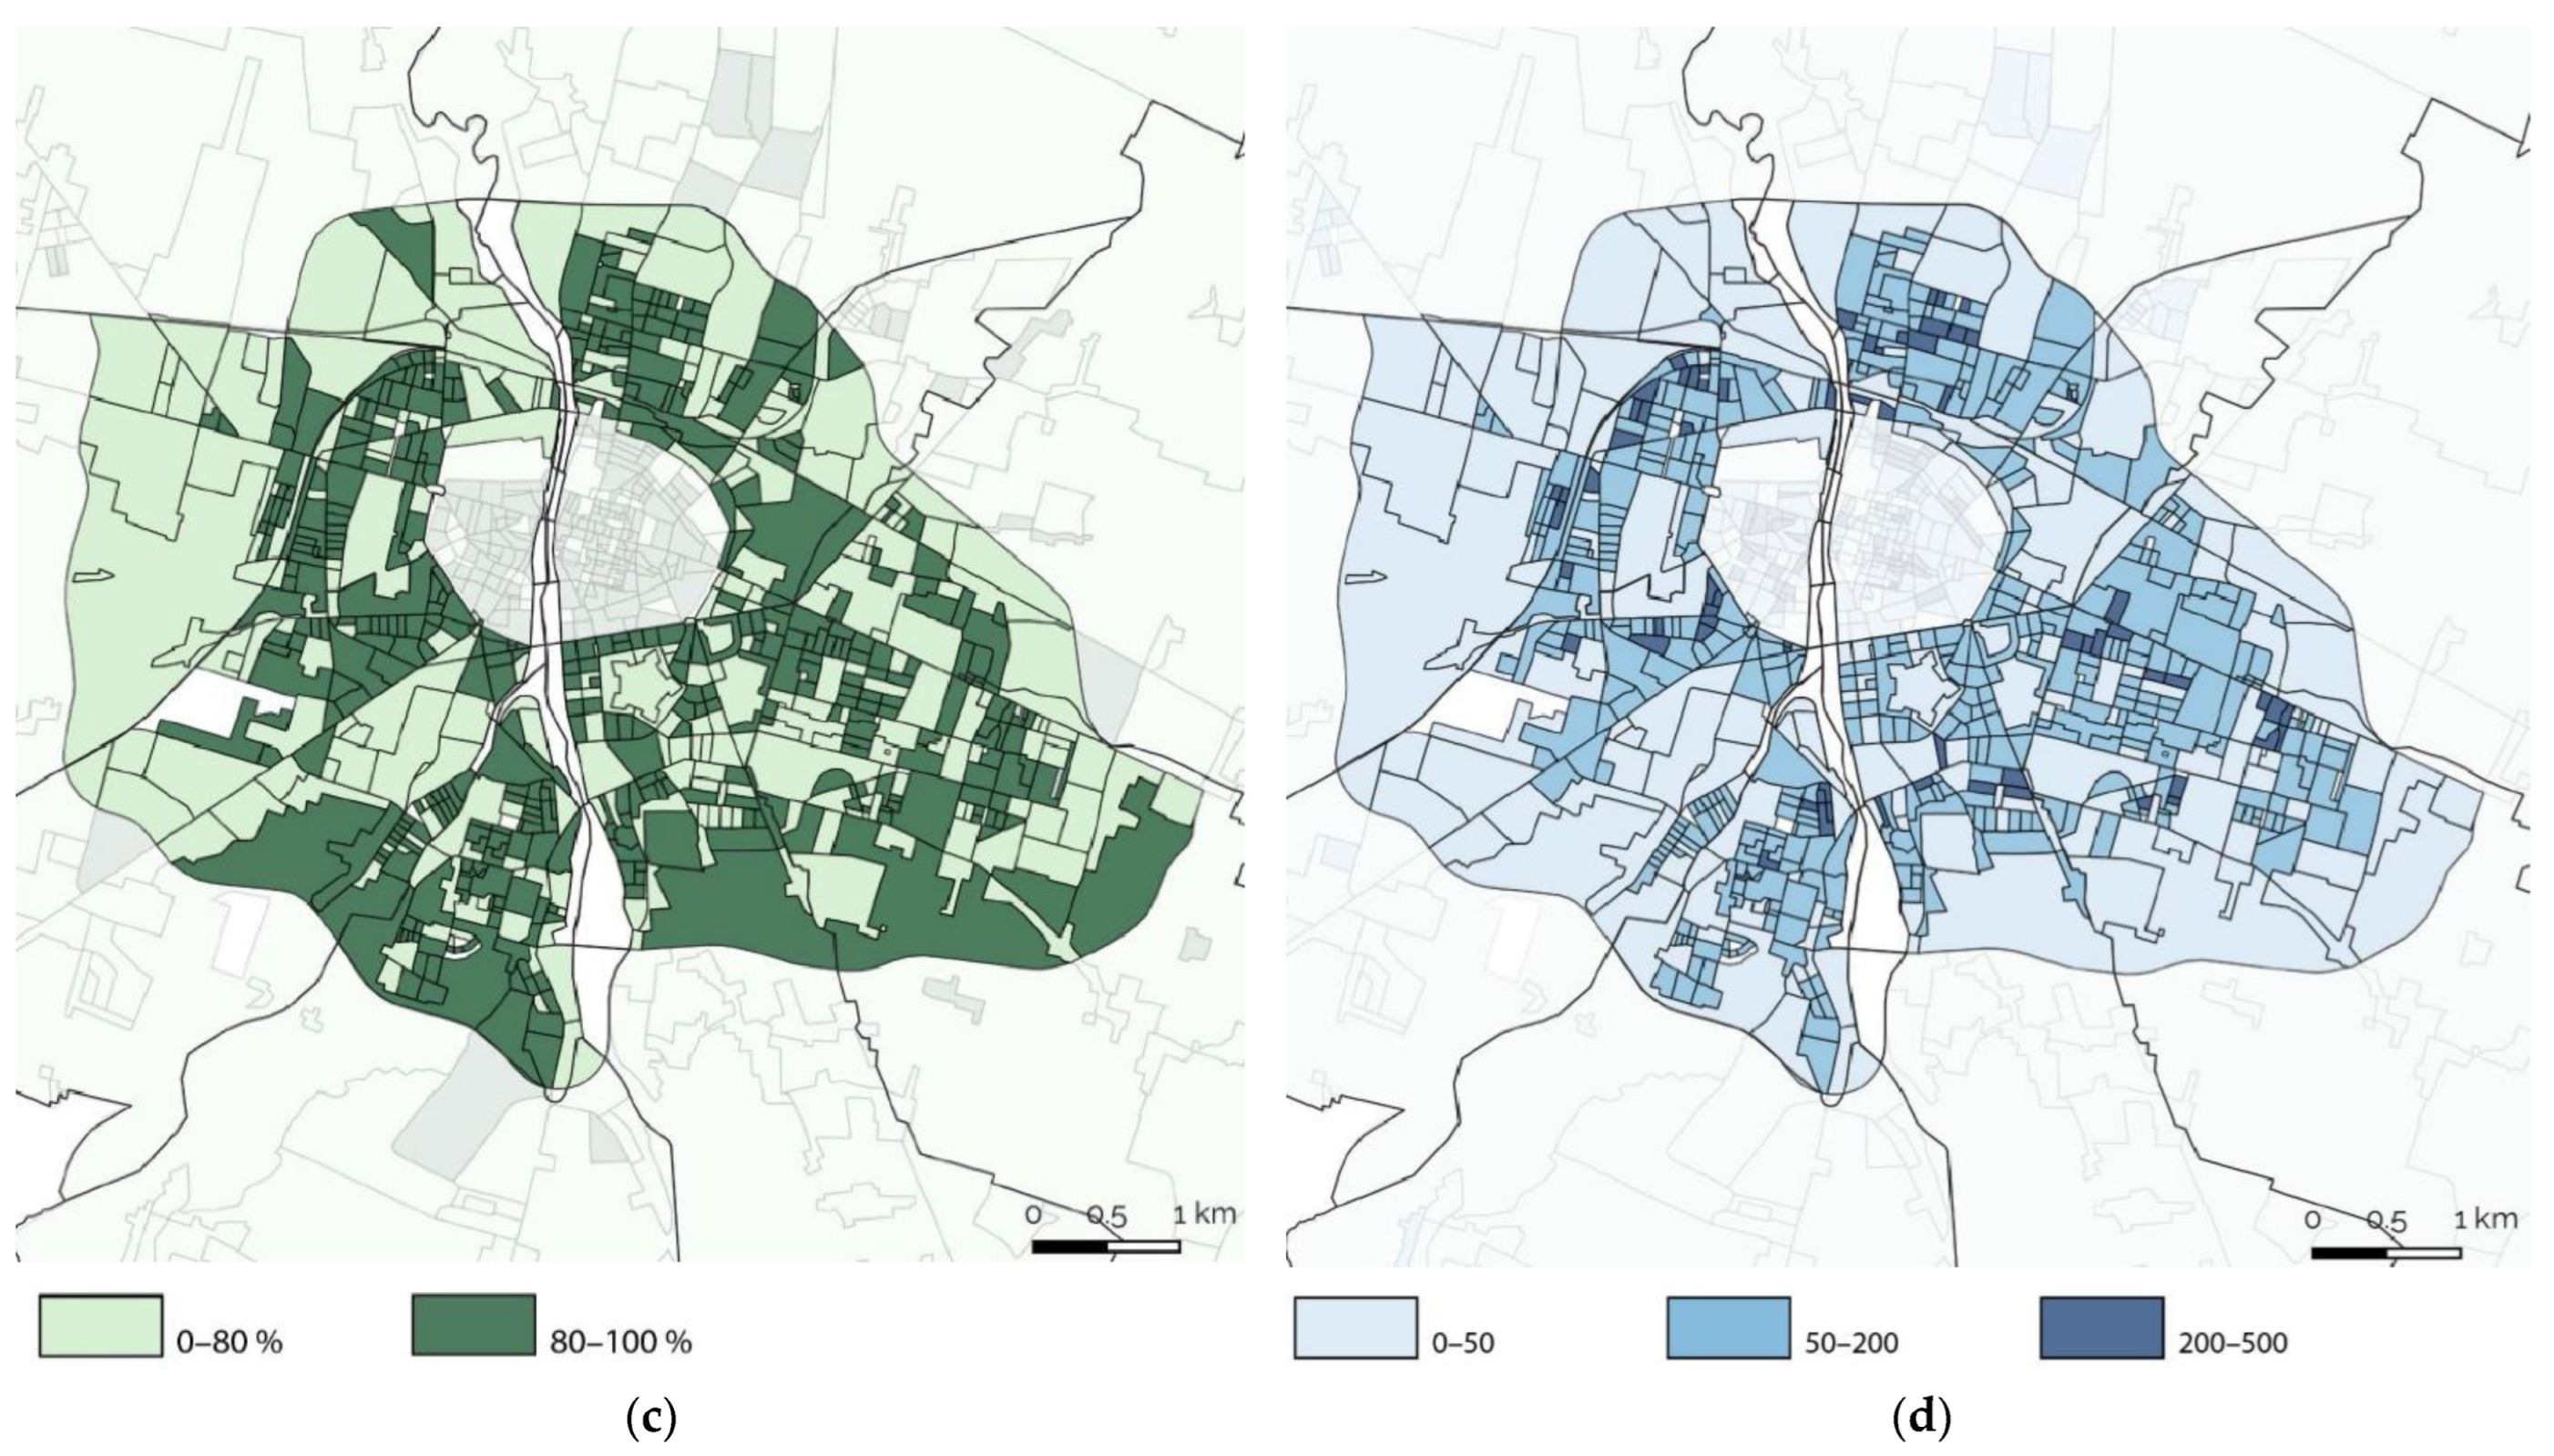
The building typology that most characterize the post-war years was the multi-family type. Therefore, the third criterion evaluates the parameter of the percentage of buildings with three or more floors above ground in each census section. Similarly to the previous one, the limit value is equal to or greater than 80%.
Figure 2c shows that most census sections of Parma have a percentage of buildings with at least three floors equally distributed over the whole city.
Finally, the population density is analyzed at the macro level. The limit values consider a range between 50 and 200 people/ha. Low-density values can activate densification processes through new buildings and the improvement or revitalization of existing ones by increasing services and accessibility, with consequent increased transport efficiency and urban quality. High density values correspond to soil saturation, such as maintaining suitable proportions between built and open spaces. This density range is the most widespread and homogeneously distributed throughout the city.
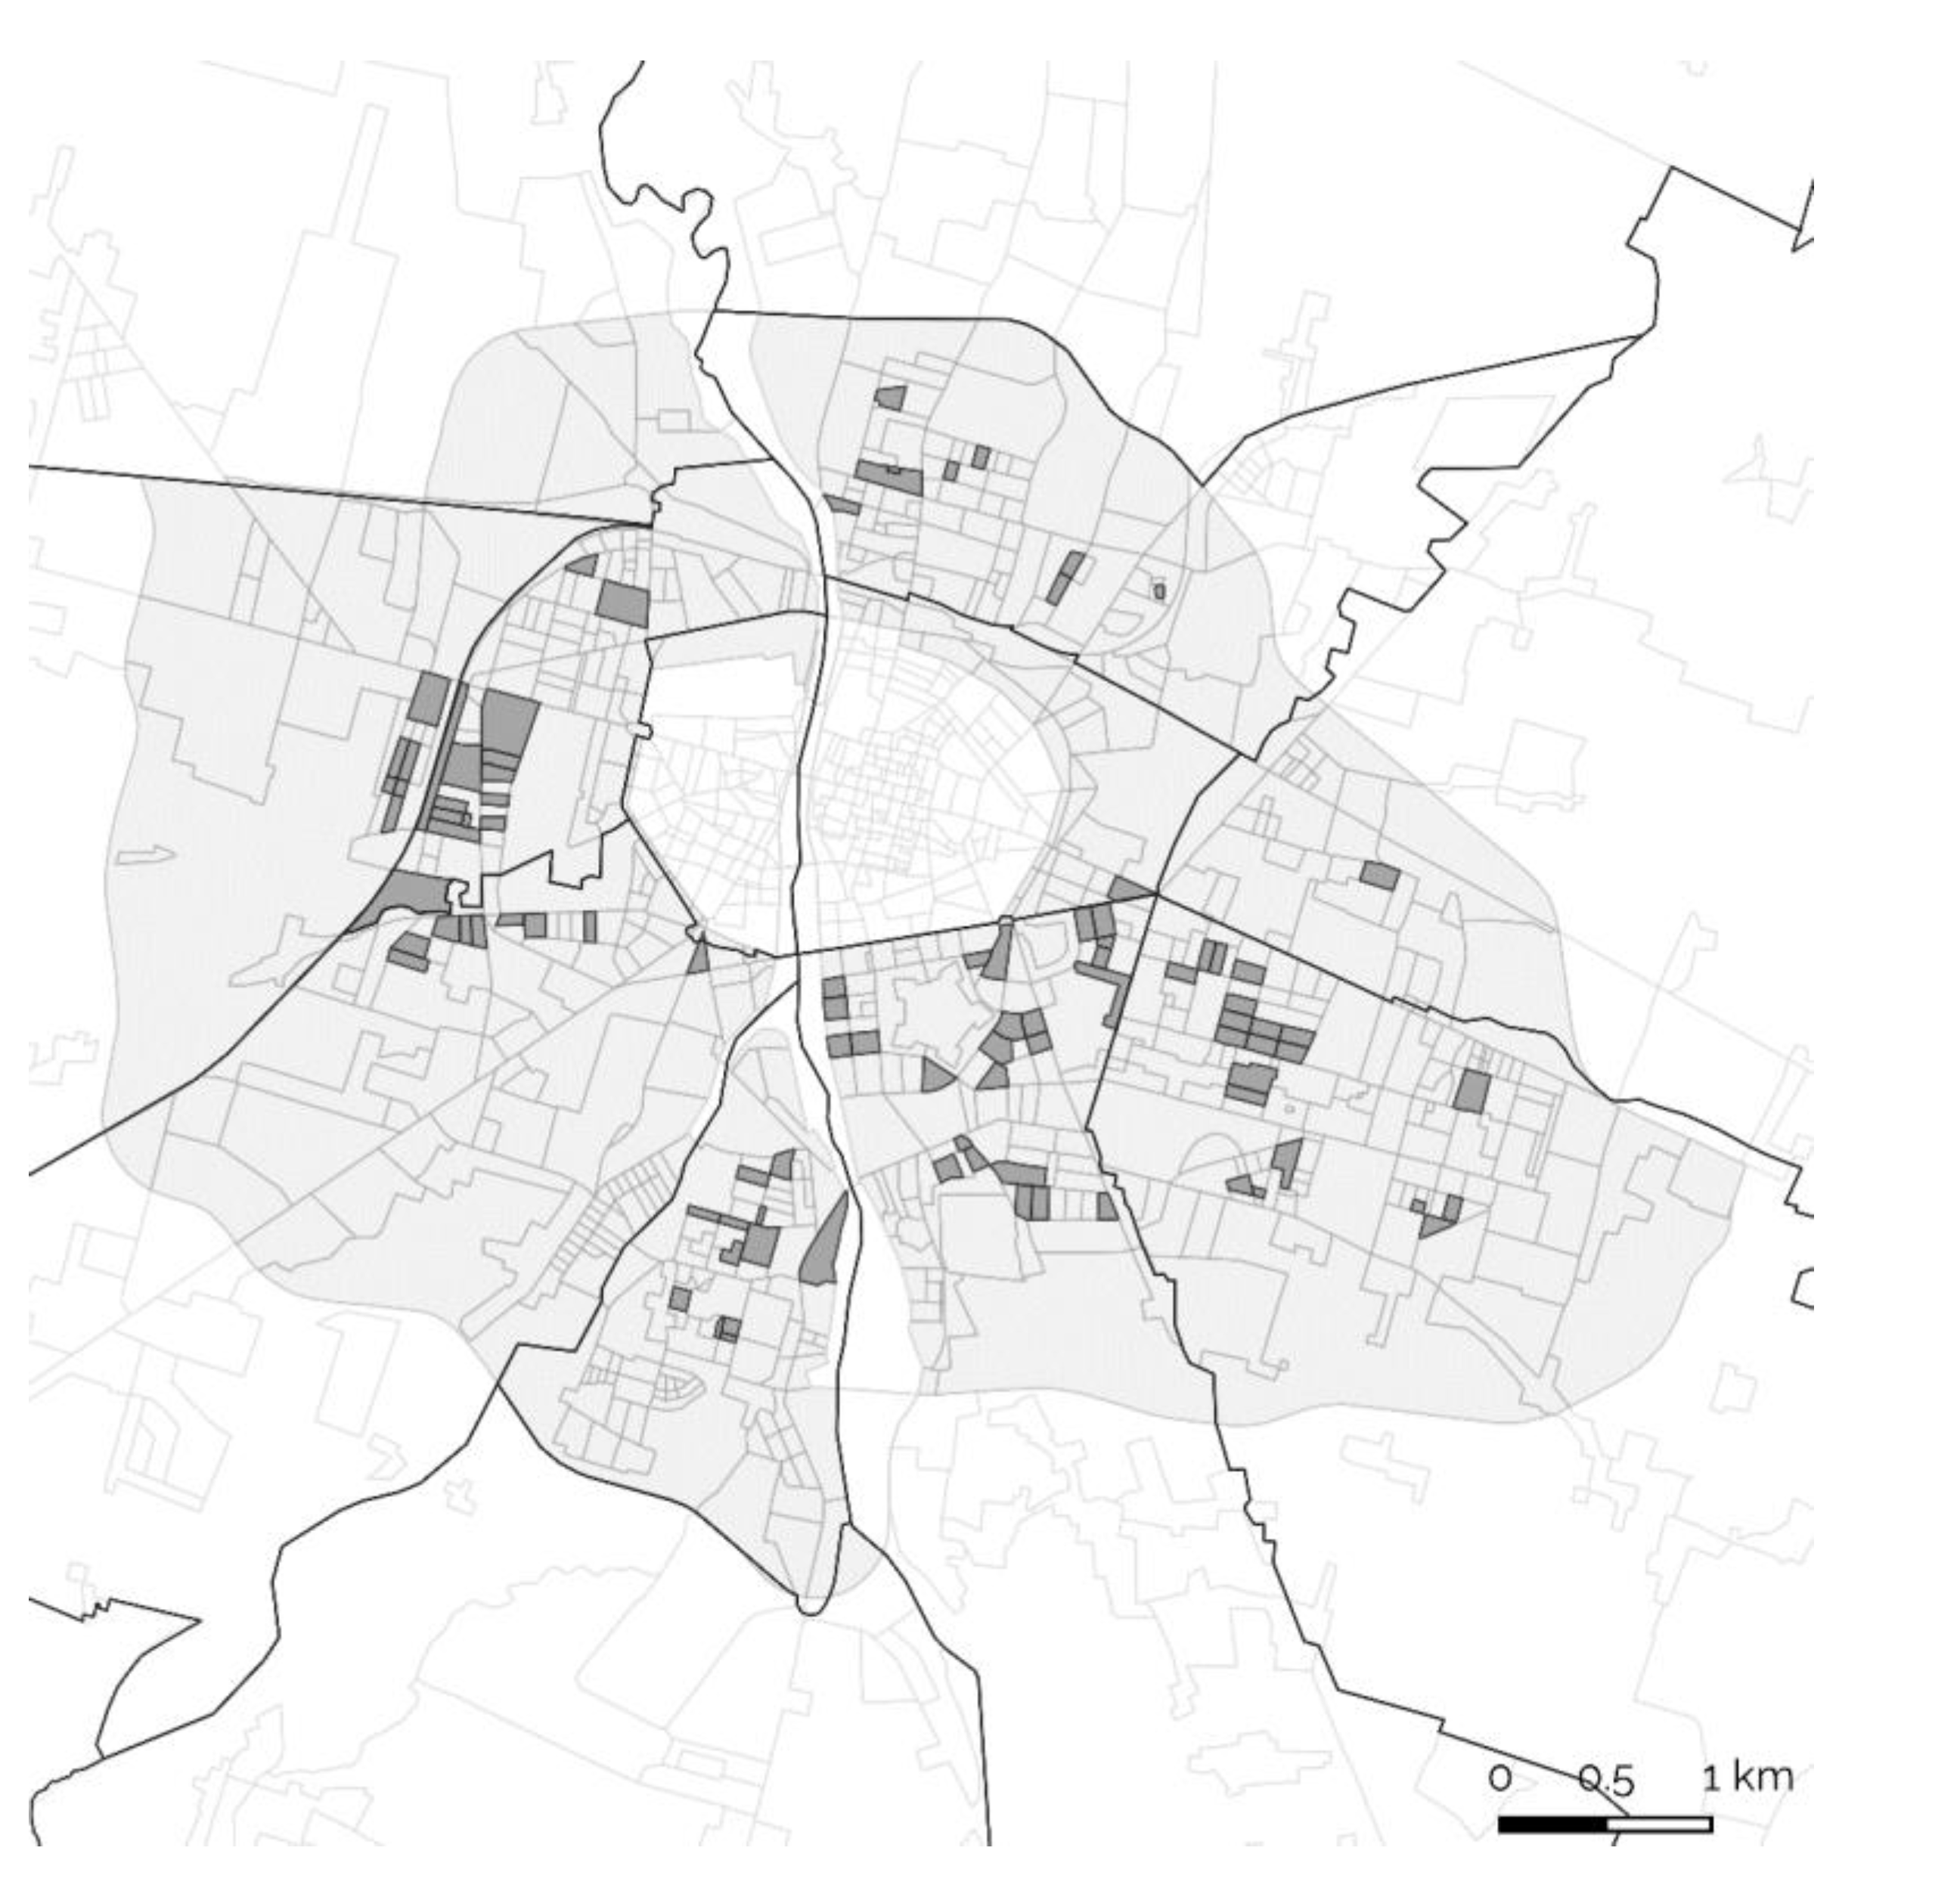
Consistent with the previous assessment, the potential critical census sections identified are 96 (
Figure 3). These are located in the first urban periphery, mainly in the western area, where the highlighted census sections are squeezed between the Parma La-Spezia railway and the hospital complex. Other critical areas are located in the southern area, just outside the historic center, in correspondence with social housing districts. In quantitative terms, the census sections cover a total area of approximately 7000 hectares, of which 2500 hectares are exclusively residential.
5.2. Step 2: Selection of Regeneration Areas
Step 2 specifies the criteria representing the impulse to transformability and threshold values, as shown in
Table 4. Therefore, the 96 census sections resulting from the previous step are evaluated in quantitative and qualitative terms in this second step.
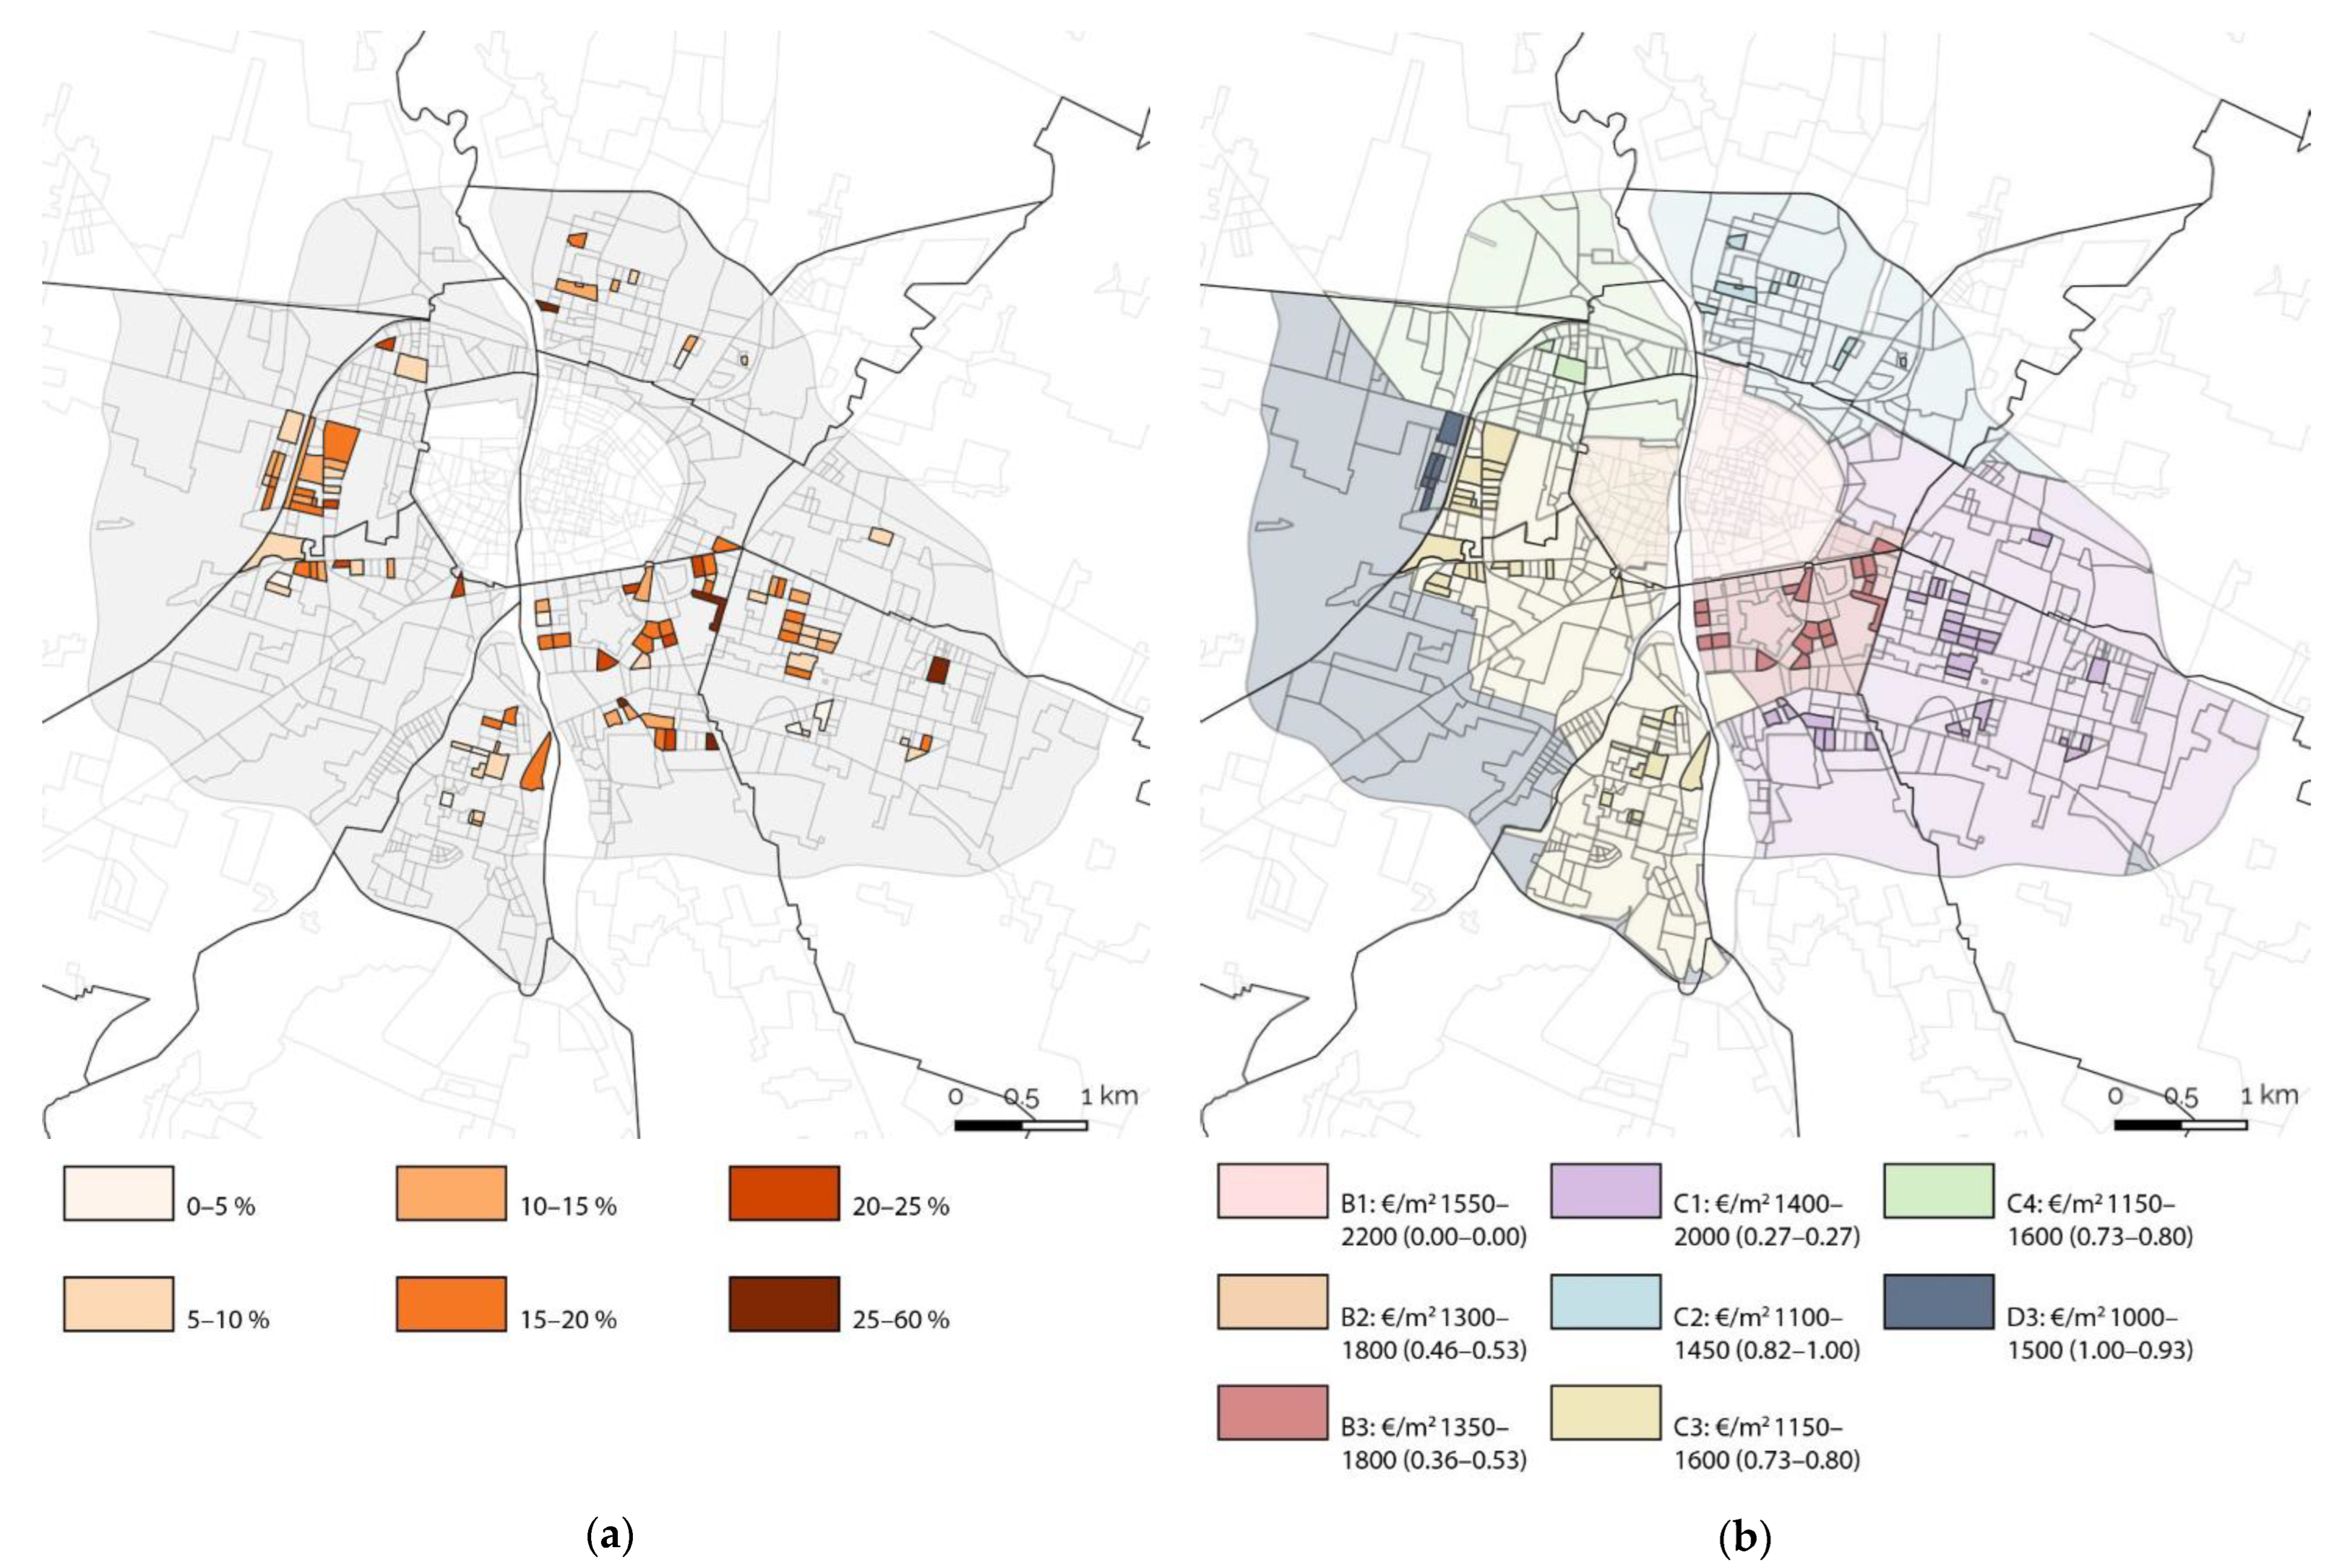
The first criterion for evaluating available spaces concerns the evaluation of empty houses. This indicator is essential for a more realistic approach during the implementation phase. Generally, residential districts located in the first periphery of medium-sized cities rarely contain a high percentage of abandoned buildings; at most, there may be variations in the percentage of empty dwellings, but even this parameter usually does not reach high values. Preliminary results of the case study show a prevalence of census sections with values ranging from 5 to 20%. However, the cutoff percentage values are set at 15% or higher to make the parameter meaningful. The elaboration results show a homogeneous picture, with few peaks of up to 60% and a significant amount located in the south and west of the city (
Figure 4a).
The evaluation of the second criterion considers the real estate market prices, i.e., ranges of minimum market real estate values retrieved from the Italian Real Estate Market Observatory (OMI). In particular, the chosen values, calculated in euros per square meter, refer to civil dwellings for sale in an intermediate state of conservation. Threshold values are set on the lowest minimum market quotations, i.e., below EUR 1200/m
2, corresponding to lease values equal to or below EUR 5.5/m
2.
Figure 4b shows that the central districts of the historic center have the highest values (the effect of the recovery plans of the historical centers in the 1990s), followed by the parcels located to the south and southeast. The minimum values occur in the north and northwest areas, probably due to the high number of production sites.
The third criterion of socio-economic degradation is calculated as the normalized sum of four variables. The first variable is the rate of low schooling as defined by economic-income poverty, which considers the population aged over 6 with an educational qualification equal to or lower than the secondary school diploma. The second and third variables are the rate of active (i.e., a temporary condition) and passive (i.e., a stable condition) unemployment. Both variables consider the resident population aged 15 or over, the labor force, and the employed and unemployed population looking for a new job. The fourth variable is the fragile migration rate, i.e., the percentage of the foreign population coming from continents characterized by conditions of economic vulnerability (Africa, Asia, and South America). Threshold values are set higher than 0.149, i.e., corresponding to at least two degradation variables for over 70% of the resident population considered.
Figure 4c shows that the areas subject to urban poverty in Parma are mainly the north, the west, and the southwest, with relevant socio-economic degradation. In the remaining ones, the high rates are dispersed.
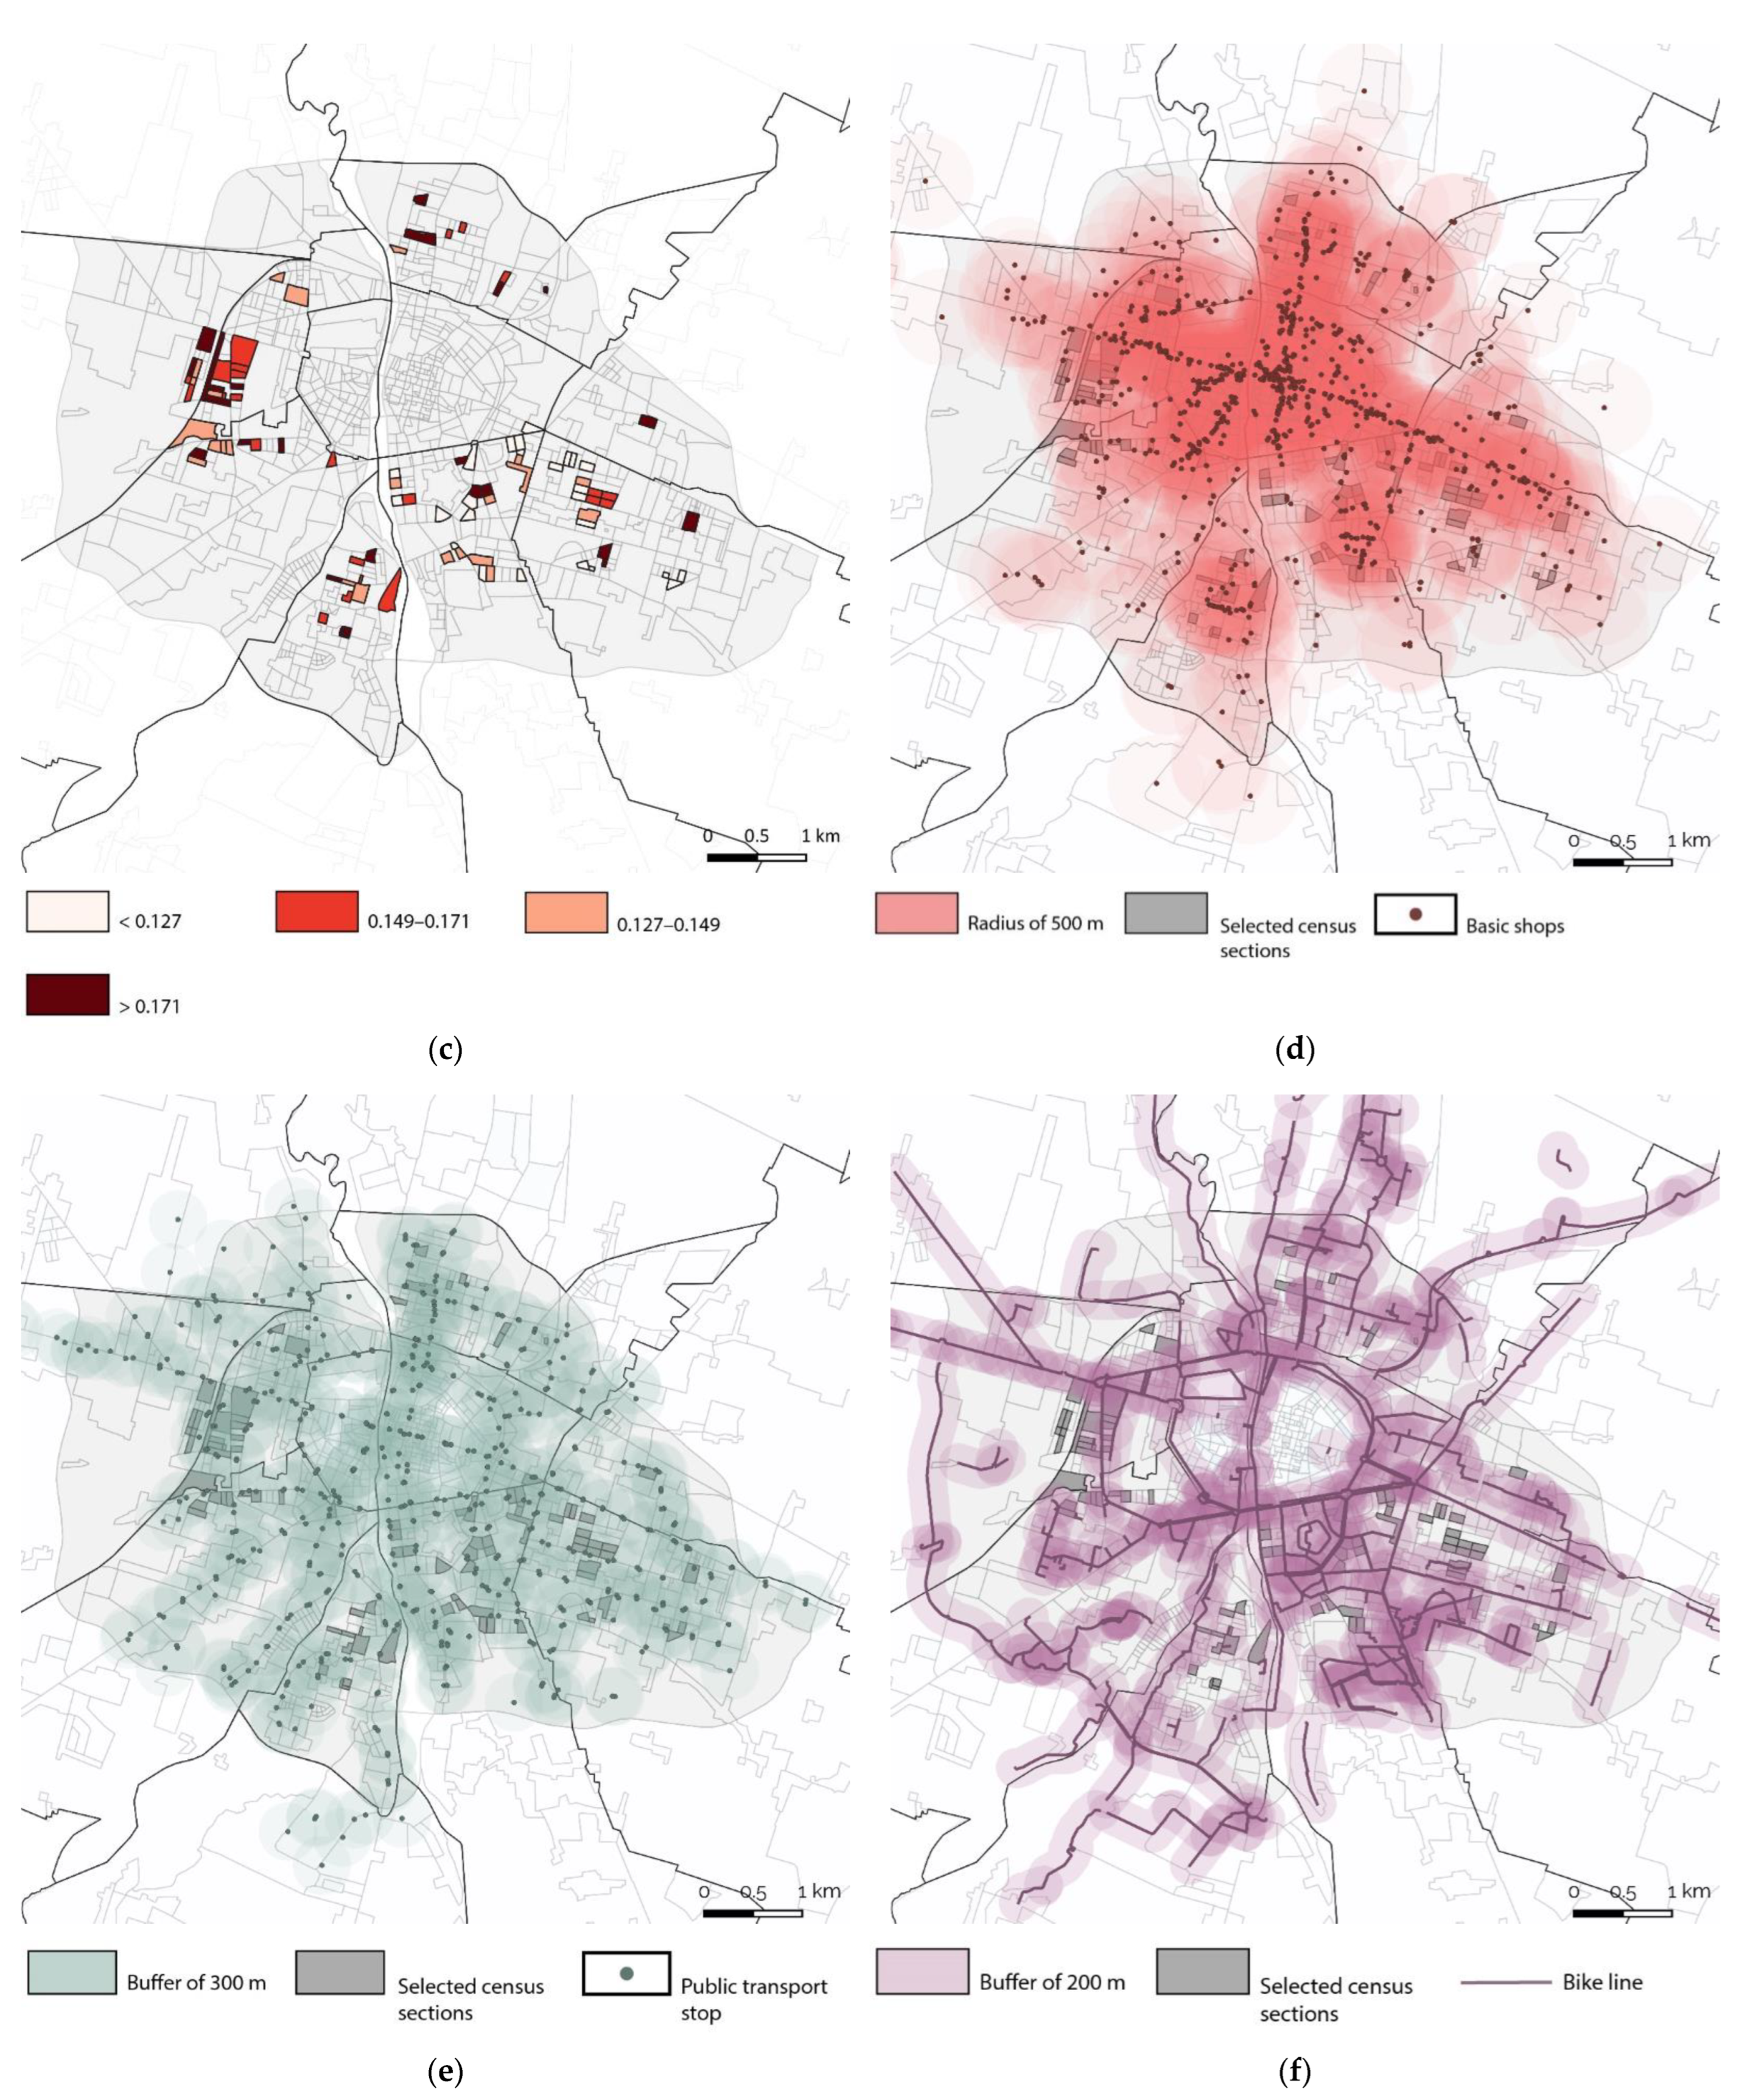
The fourth criterion of proximity to services considers commercial activities for basic needs. Facilities of public interest are excluded from the assessment as it is assumed that they are foreseen in the design phase within the regeneration areas. The threshold value considers the accessibility of the census section to at least one shop for every 100 inhabitants. Accessibility to primary and secondary commercial services is assessed as a radial isochron. The limit value equals a catchment area (buffer) of 500 m, i.e., considering an average pedestrian speed of 3 km/h (compatible for children) and a 10-min walking distance. Evaluation results show a significant concentration of commercial services along the city’s main arterial roads. Nevertheless, the whole study area is adequately served (
Figure 4d).
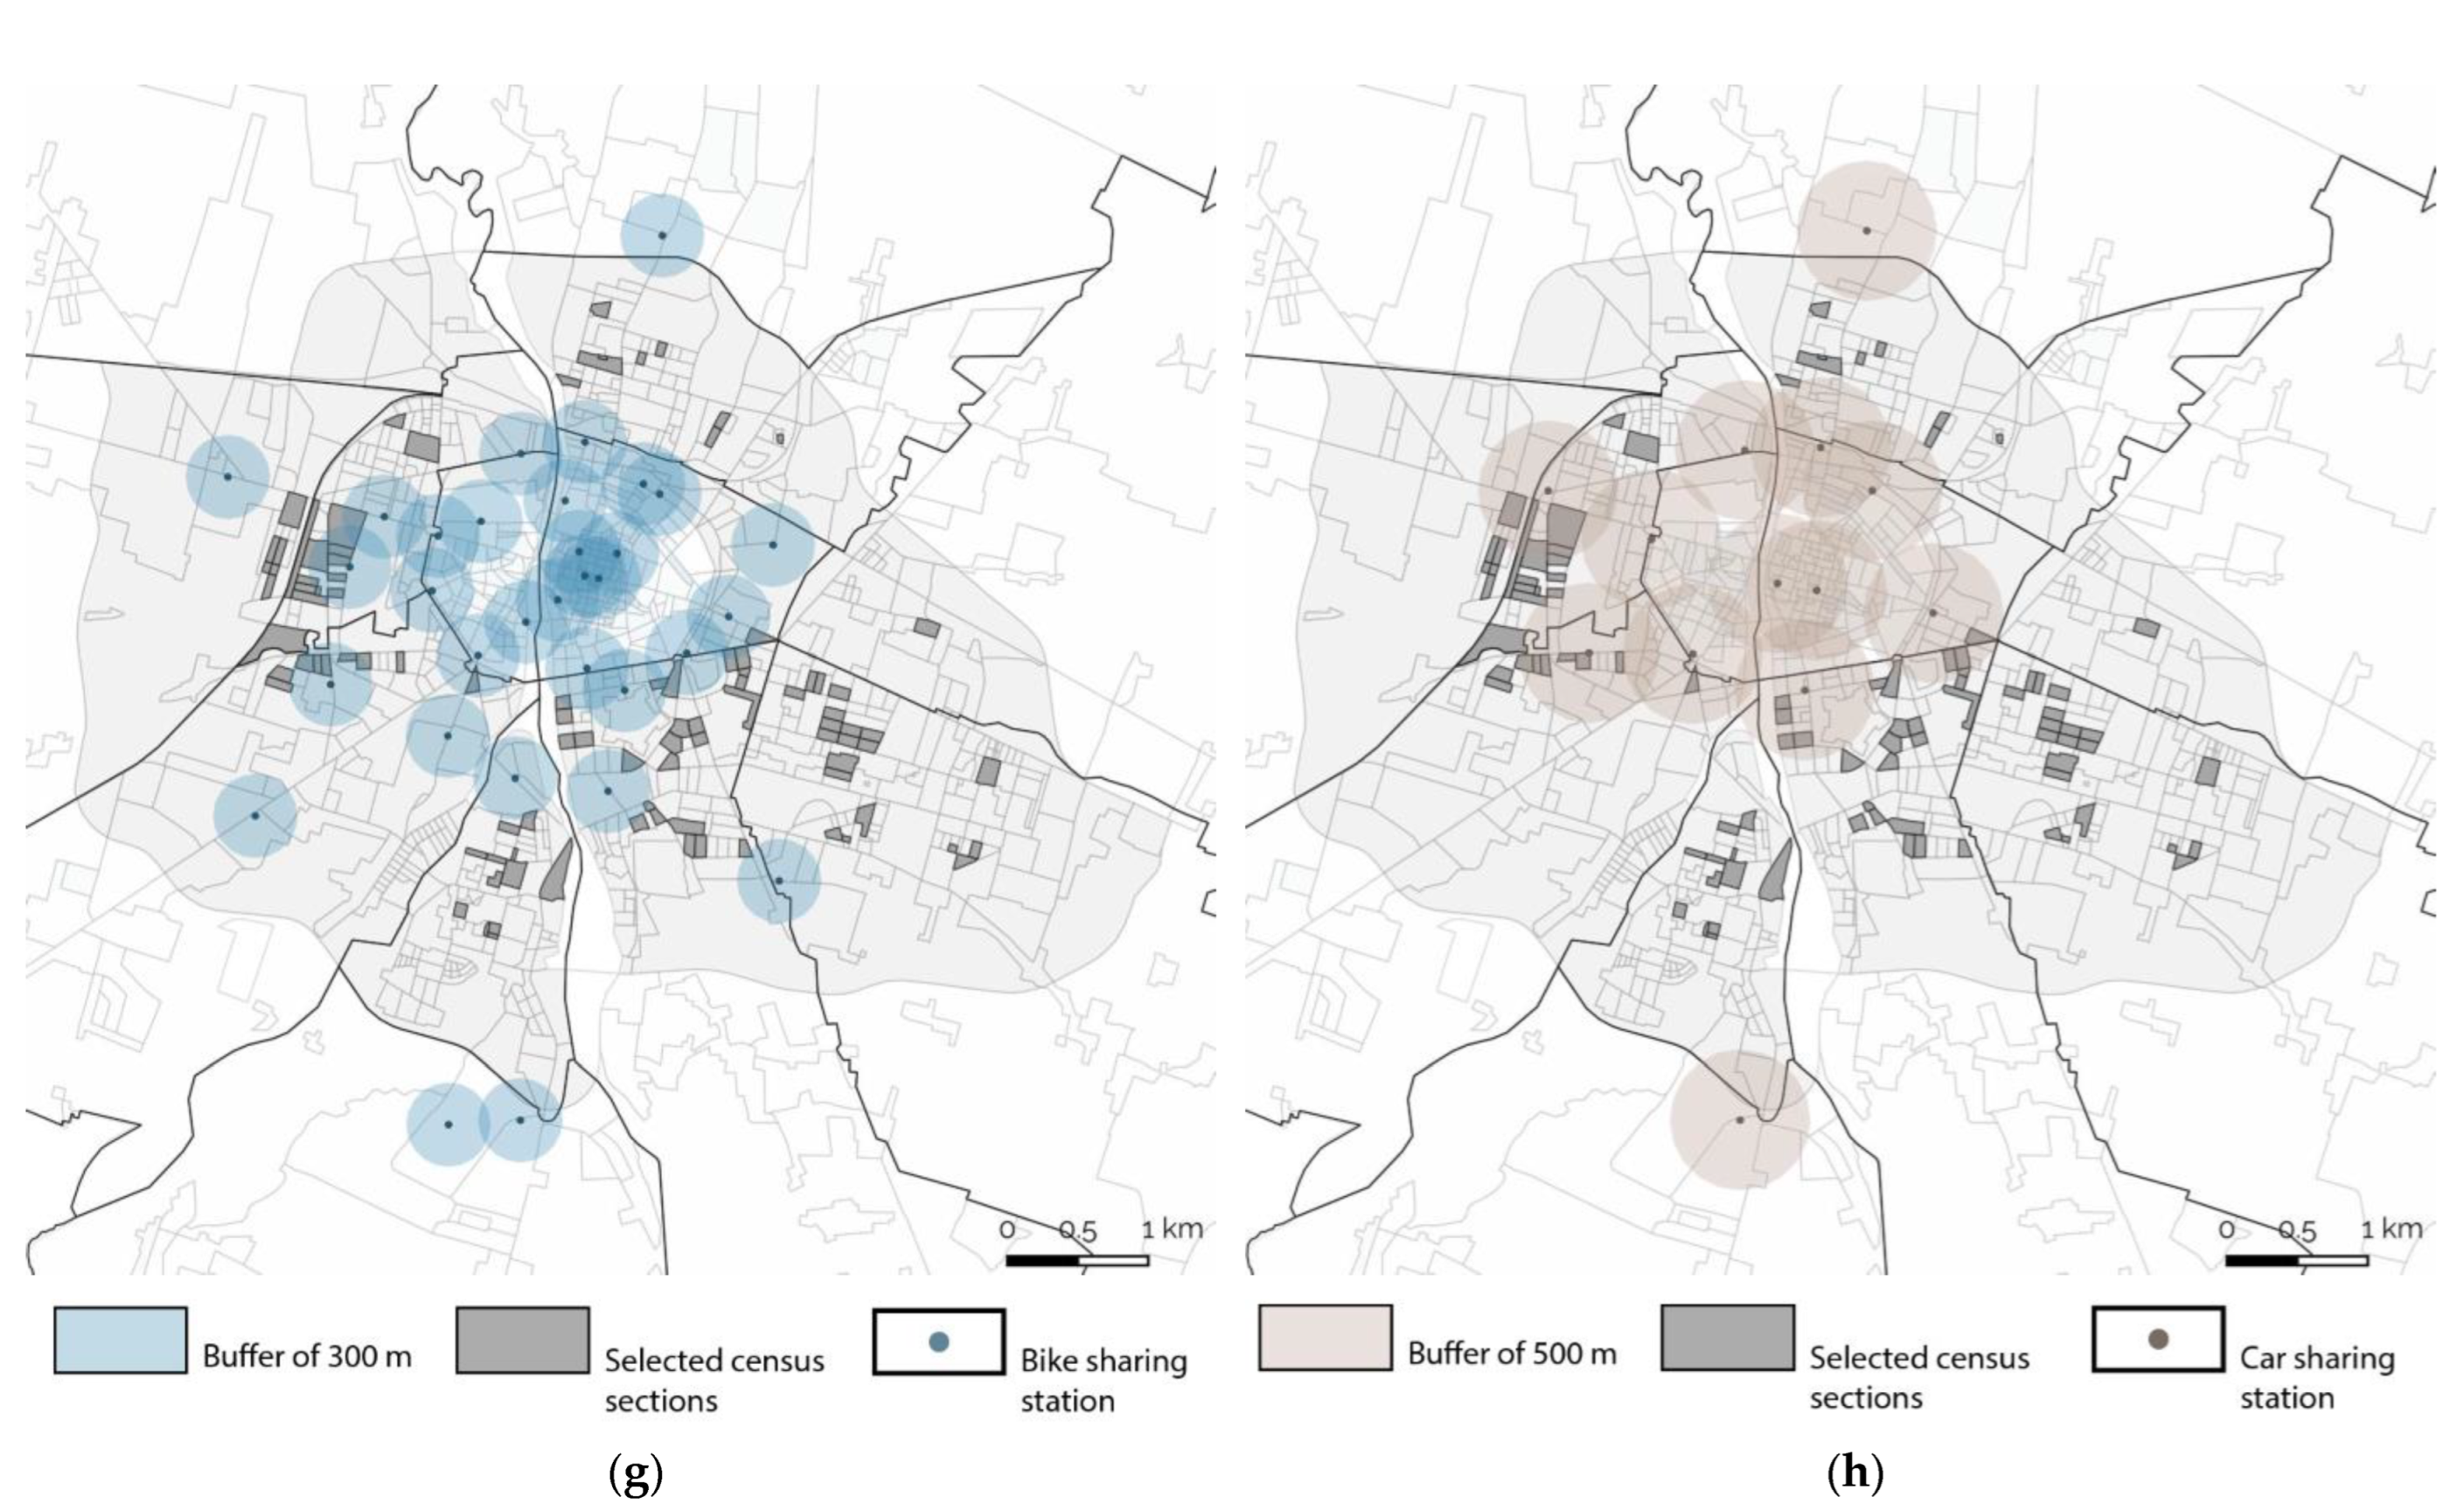
The fifth criterion of sustainable mobility considers the accessibility of different mobility nodes and networks according to variable catchment areas. As in the previous criterion, radial isochrones (buffer areas) are evaluated for three categories of mobility nodes or networks: cycle paths, bike-sharing stations, public transport stops, and car-sharing stations. Data are collected from Open Street Maps and implemented through urban planning documentation and other sources (e.g., Parma’s Infomobility platform). The considered public transport stops are only urban and not regional. The threshold value considered is at least one public transport stop within a catchment area of 300 m, i.e., assuming an average pedestrian speed of 4 km/h and a 5-min walking distance. The results show a branched service on the main and secondary roads (
Figure 4e). It guarantees good efficiency in each sector of the study area. Therefore, the condition is satisfied for the 96 census sections analyzed.
Otherwise, the accessibility of the cycle mobility networks is evaluated according to a buffer area of 200 m. This parameter considers a distance that ensures an adequate connection of residential areas with existing cycle routes.
Figure 4f shows a good cycle service, as the cycle routes provide almost complete city coverage. Nevertheless, there are isolated cases of urban parcels that are not perfectly connected to the cycle network. This result is a confirmation of most of the census sections (85 out of 96).
The same threshold value as for public transport is adopted for bike-sharing stations. However, unlike the accessibility of the cycle networks, most of the stations are located within the historic center. Therefore, the service turns out to be more rare. In particular, the southern and western areas are sufficiently served, while the northern and southeastern areas need to be served (
Figure 4g).
Finally, the accessibility assessment for car-sharing stations considers a radial isochrone of 500 m. The station number is small, and the limited possibility of parking once the vehicle has been used and the high costs do not incentivize using the service. However, the parameter is being considered because of an expected decrease in costs and a modal shift towards other, more sustainable, and less energy-intensive types of mobility. Stations are concentrated in the central area, leaving many previously selected areas unserved. In particular, the south and southeast areas are almost totally devoid of them, unlike the western ones (
Figure 4h).
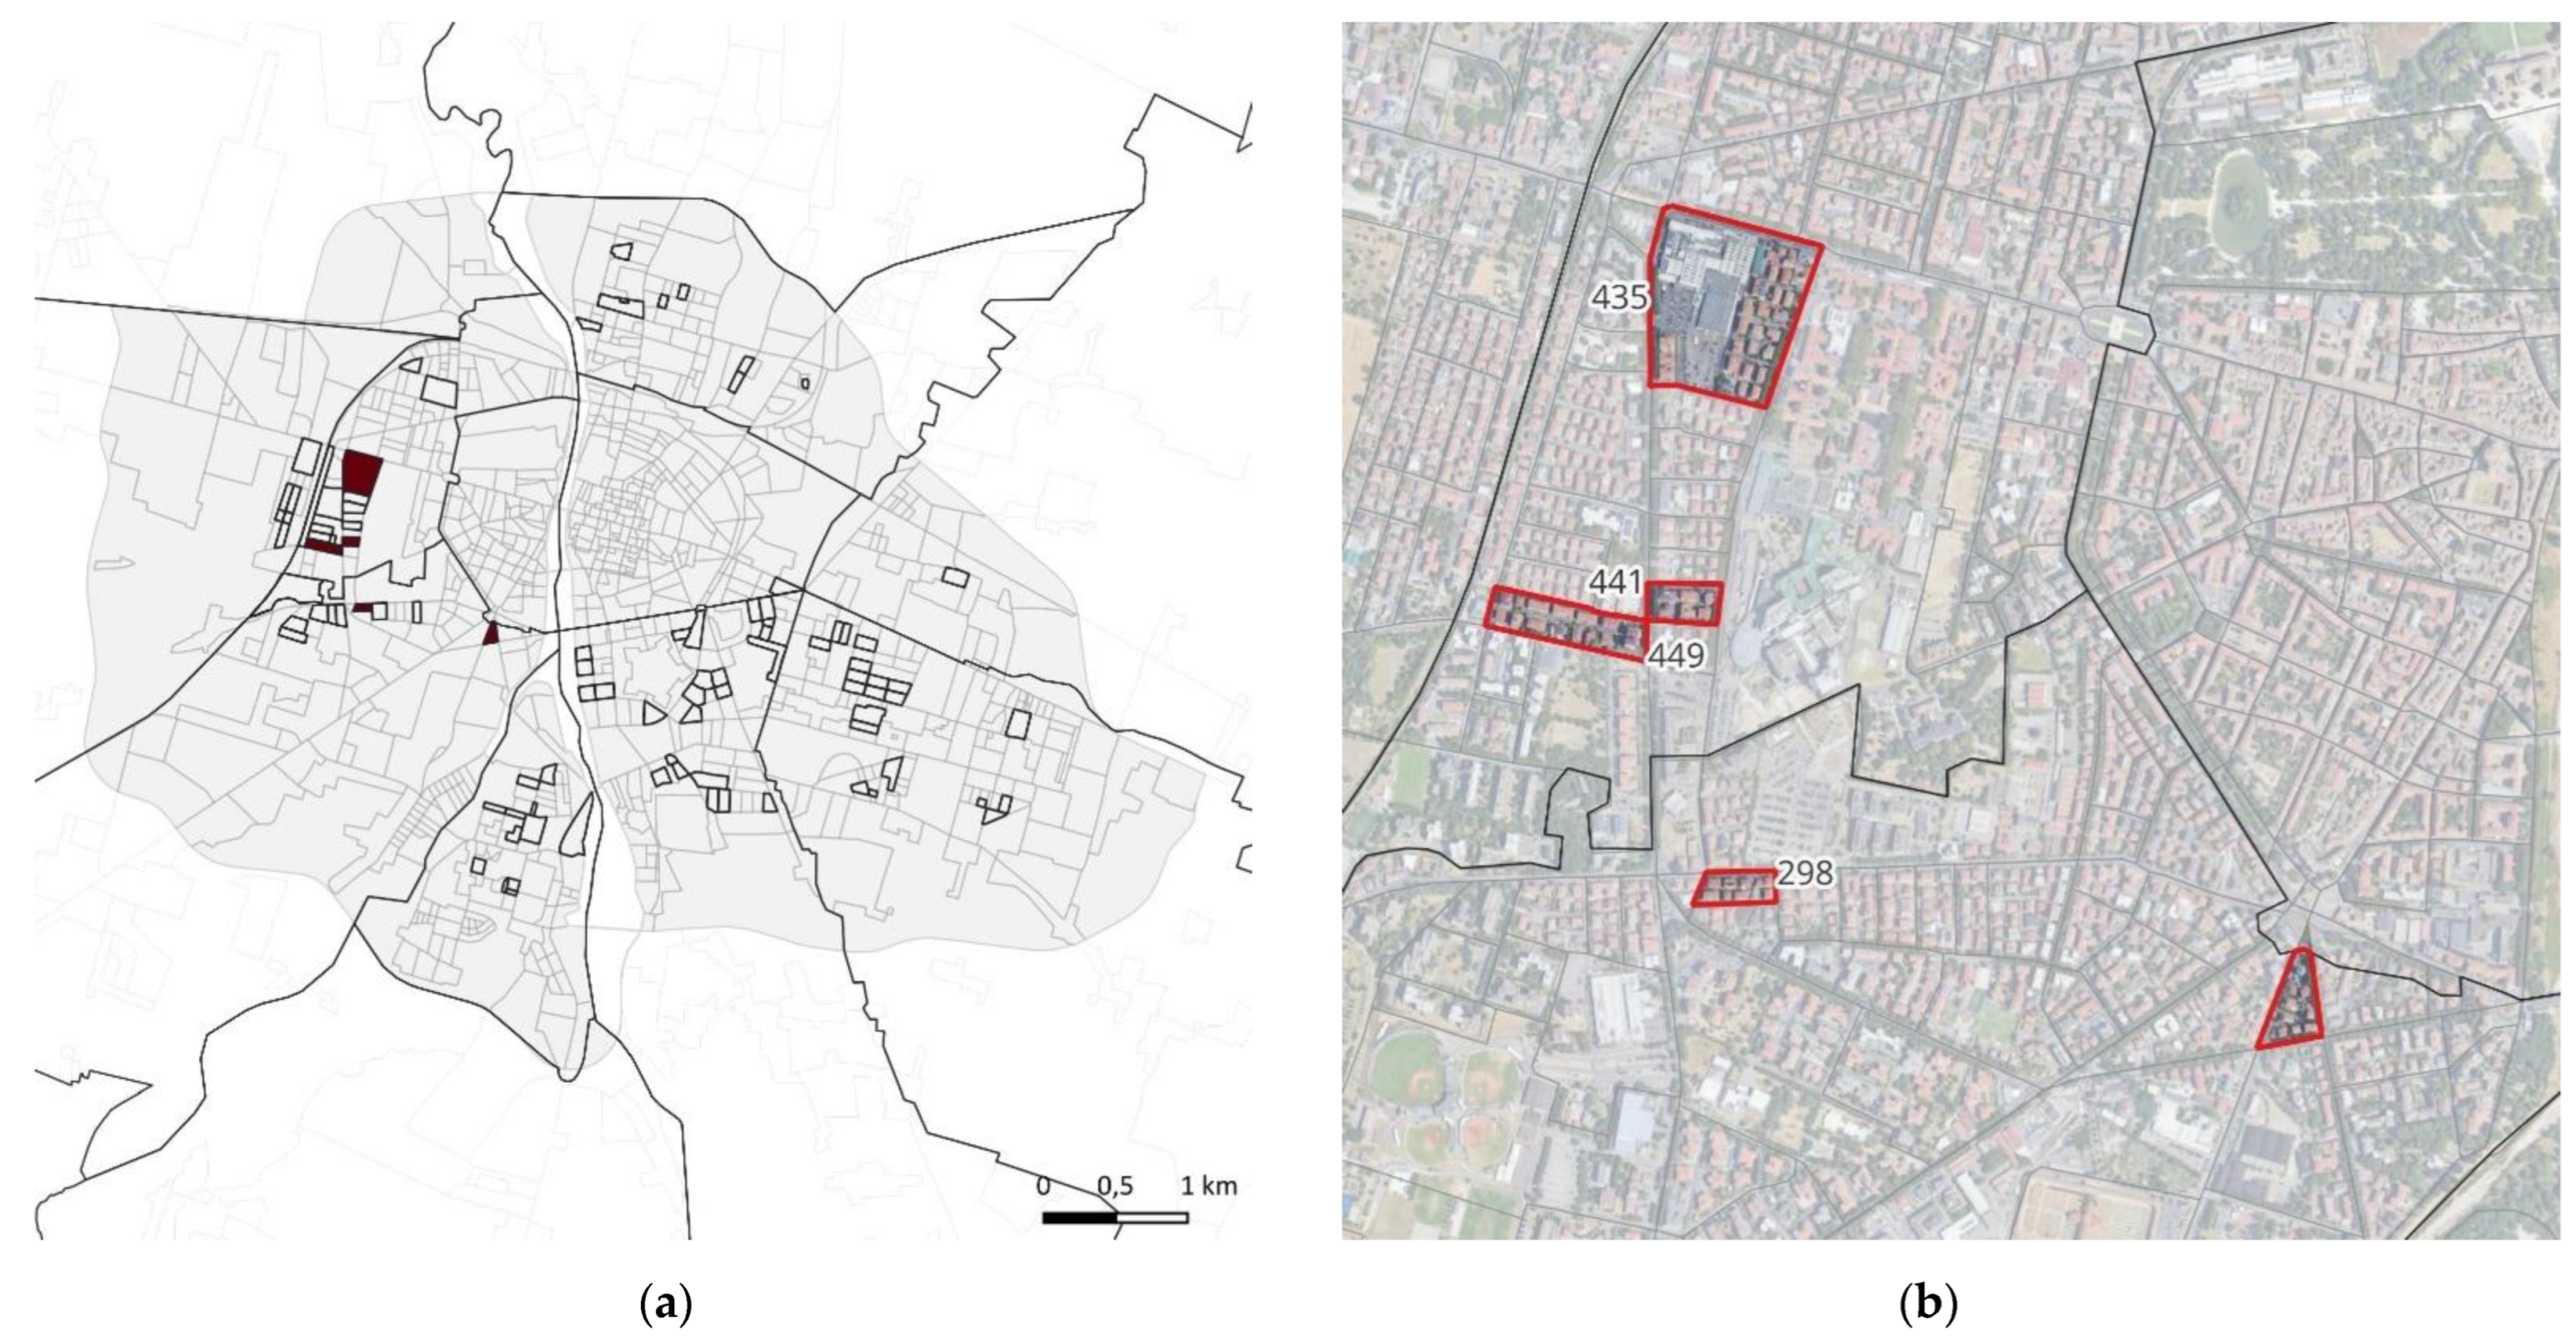
The second selection step identifies five priority census sections for urban regeneration (
Figure 5). These are located in the western area of the city, near the historic center, and are part of the Pablo and Molinetto districts. Census sections of the northern and southern areas are excluded from the selection for two overall checks: in the north because of poor synergies with bike and car sharing nodes; in the south, for similar reasons to the northern area with the addition of lower economic feasibility due to higher real estate values. The results show that the selected urban blocks are very close to each other, and in one case, sections are even bordering. The specific characteristics of the output are verified in the following chapter.
5.3. Result Analysis
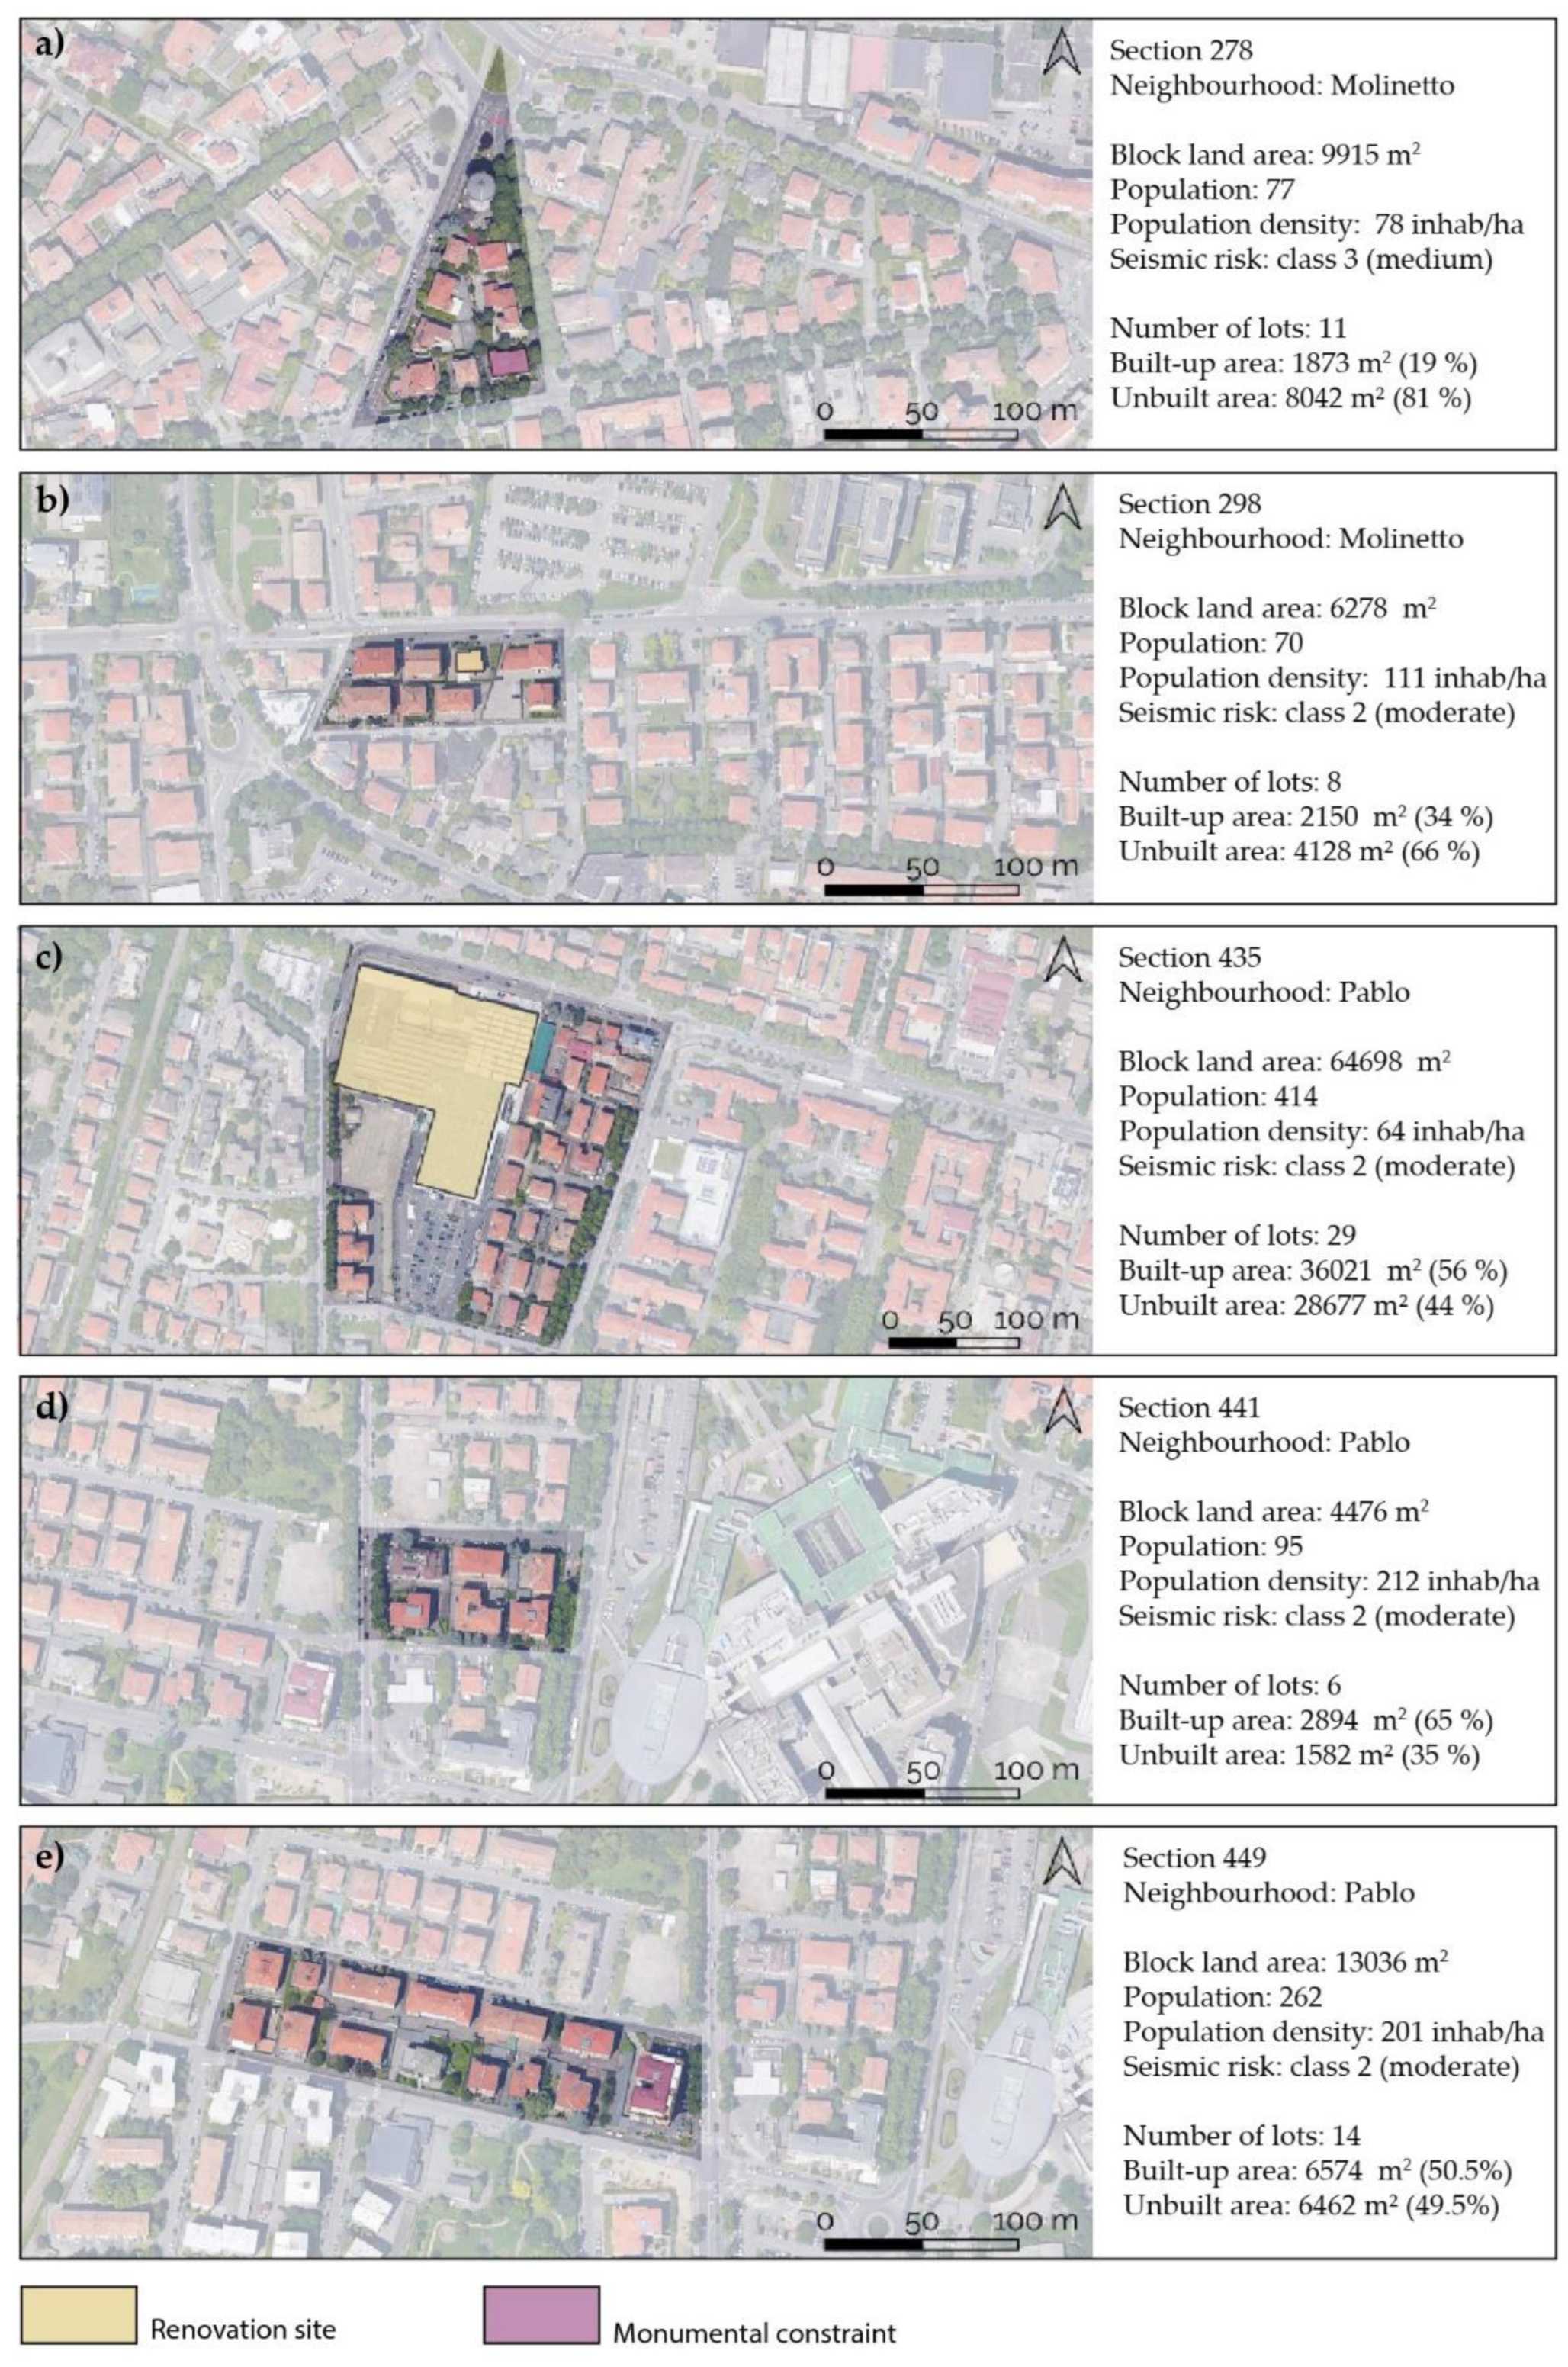
The five blocks resulting from step 2 were subjected to a more in-depth analysis, investigating their extension, resident population, density, land uses, built surface area, building types, and the actual state of conservation of the buildings (
Figure 6).
Block 278 (
Figure 6a) has a population density of 78 people/hectare and is predominantly residential, with a technological artifact (a water tower) at the northern end. It has no recent renovations or construction; however, a listed building is in the southeast corner. The building types are predominantly multi-family buildings of three or four stories.
Block 298 (
Figure 6b) is a residential block with a population density of 111 people/hectare. On the north side of the block, though, ground-floor shops face the street. It is particularly small and has one renovated two-story building that underwent a refurbishment of the façade and solar panel installation. The other buildings are all multi-family houses, mainly of three or four stories.
Block number 435 (
Figure 6c), on the other hand, is rather large and is conspicuously divided into two parts: on the east side, dense residences mainly consisting of three- to six-story multi-family buildings; on the west side, a large, recently renovated complex of buildings with an attached car park occupying about half of the total extension. The complex houses commercial and office functions. The overall density is 64 people/hectare.
Residential block number 441 (
Figure 6d) has a density of 131 inhabitants/hectare, and the percentage of covered area exceeds 64%. In fact, despite its modest size, it contains six four-story multifamily buildings. All of these buildings are still being renovated. The block is in a particularly favorable location as several public spaces and services are nearby, such as the hospital, a religious center, a state comprehensive school, and a shopping center.
Finally, block 449 (
Figure 6e) has a long rectangular shape and 162 people/hectare density. It is divided into fourteen lots, with buildings mostly four stories above ground level and a single building on the west side with six stories. The block is residential, but the building on the east side has ground-floor retail. The built-up area accounts for 50.4%. This block also has no recently renovated buildings and is located near spaces and facilities of public interest.
All the blocks selected are shown to possess the characteristics of physical obsolescence sought in Step 1. Specifically, all residential buildings date back to the years 1946–1970; an exception is a building in census section 298 that was recently renovated. Furthermore, some of these blocks, in particular numbers 278 and 435, are not exclusively residential: in block 278, there is a water tower, while in block 435, a large commercial and office area covers almost half of the block, constraining a possible total demolition and reconstruction.
6. Discussions and Conclusions
The proposed methodological framework for urban regeneration considers different components of the existing city, and the results stress particular attention to the residential settlements built after World War II and located between the historical center and the more recent urban suburbs. Anyway, the result does not assume that only these sections are suitable as regeneration sites, but that the obsolete condition of the built space, together with the observed good conditions of attractiveness and accessibility, can potentially make the regeneration and densification process more sustainable and effective. In any case, an in-depth analysis of the 96 blocks resulting from phase 1 should be carried out to establish a priority for intervention based on the actual state of degradation of the built environment.
The suggested framework’s promise resides in the opportunity to put ‘on the table’ a likely vast availability of possible urban regeneration areas within the existing city, at least wider than traditional regeneration interventions mostly focused on brownfields and abandoned sites. Real estate operators may therefore discover more options to stimulate the transformation process and initiate integrated and hopefully virtuous regeneration efforts. The chosen case study is a representative sample of common scenarios in Italian—and many other European—medium-sized cities. Therefore, the proposed method may be valid, replicable, and even partially transferable to different contexts. Moreover, threshold values for parameters could be recalibrated depending on the specific characteristics of the city or the objectives and priorities of the public administration.
A few issues are worth noting among the framework’s potential flaws and weaknesses. First, at least in Italy, the most updated data on buildings homogeneously available for the entire country refers to the 2011 Census of the National Institute of Statistics (ISTAT). Further and more updated data may be made available shortly. When employing Census sections for data collection, the limitation is that the border does not have to coincide with a homogeneous area. However, census sections are typically fairly small in the first periphery of Italian medium-sized cities, generally equal to a single urban block or small aggregations of blocks. Second, the selection method may be subject to different parameters and weights that political or planning guidelines can influence. In Step 1, the threshold values for population density may vary according to the specific urban context. Moreover, building energy efficiency could be further explored by considering the energy class of buildings or by pointing out cases of energy upgrading within the obsolete building stock. The methodology only considered the criterion cursorily, associating poor energy performance with the buildings’ construction period before specific regulations (due to a lack of data available). In Step 2, the impact of urban policies and planning regulations may be stronger since determinants and propensities for regeneration may influence prioritization. For instance, in French cities, where public ownership is very strong, factors related to vacant housing are less relevant than in the Italian context. However, case-by-case weighting or participation methodologies (e.g., the Analytic Hierarchy Process) could support defining parameters and thresholds in future applications.
Furthermore, parameters like squatting phenomena, criminality, and a lack of safety and security could be added to the methodology, especially in cities with diffuse and severe conditions of marginality. They still need to be included since the aim was not to detect punctual regeneration sites characterized by very high fragility but to propose a widespread urban regeneration framework for the existing city in an equilibrium between the degree of degradation and the sustainability of the intervention. Moreover, those phenomena are also not so significant for medium-sized cities like Parma; therefore, the urban poverty parameter was applied to foster a more comprehensive approach.
But the crucial and still-most-critical question concerns the implementation methods for these widespread urban regeneration interventions. How can we pursue the implementation of the selected potential urban areas?
First, in highly fragmented and pluralist situations, urban redevelopment projects can face criticism from locally based groups [
61]. Therefore, to implement the regeneration actions of the existing residential fabric, there is a need to enter the negotiation process with a plethora of actors and stakeholders potentially involved. Conflicts are unavoidable in areas of predominantly private residential construction and high ownership fragmentation, such as Italy. Therefore, could the regeneration of the obsolete residential heritage be a matter of “public interest” to design integrated policies pushed by a collaboration of public and private stakeholders?
Developing specific urban regeneration plans and programs for the chosen regeneration areas is possible. These plans should investigate various urban, morphological, and design configurations for regenerating degraded urban areas and identify the most appropriate regeneration solutions. By overcoming the simplified identification of abandoned sites, the urban regeneration framework of this study recalls the critical synergy between the plan and the project and between the planning process and the action. The urban regeneration framework aims to promote urban renovation projects, which may entail demolition and reconstruction, with the goal of:
- −
Increasing the area’s attractiveness to the residents;
- −
Curbing energy consumption (by focusing on building performance and renewable sources);
- −
Making buildings safer from a structural standpoint;
- −
Improving the quality of public spaces as social places;
- −
Environmental remediation and the reduction of impermeable areas;
- −
Improving sustainable mobility by better integrating walking and cycling with public transport, sharing, and micro-mobility options.
Therefore, intervention and implementation assessment methods should not be limited to the benefits of meeting the minimum requirements (e.g., public facilities) but should include parameters to ensure the overall quality of living (housing buildings and urban spaces) by including social and environmental sustainability parameters. The considered alternatives, as well as the urban configuration of the intervention, should duly evaluate possible measures and benefits of urban comfort and social relations with the settled population (e.g., relationships between buildings and empty spaces, presence of green spaces, proximity services), ensuring interventions that are distinguished by high building quality and urban design.
Finally, large-scale implementation of diffuse urban regeneration interventions in the city requires specific regulatory and legislative frameworks. The development of an organic regulatory proposal is required to undertake widespread urban reuse and regeneration of the existing building heritage. Transforming the current city fabric demands specific planning and programming strategies different from those employed to limit urban expansion and land consumption. The legislative solution will need to consider some problematic knots, such as the urban public interest—as they aim to urbanize the urban fabric—and the protection of the interests of private real estate owners interested in the plans/programs. Lastly, economic sustainability will assess how urbanization and construction costs of urban regeneration initiatives can be modified based on the intervention’s priority levels.


