Article

Effect of Moisture Content on the Permanent Strain of Yellow River Alluvial Silt under Long-Term Cyclic Loading

School of Civil Engineering, Zhengzhou University, Zhengzhou 450001, China
*
Author to whom correspondence should be addressed.
Sustainability 2023, 15(17), 13155; https://doi.org/10.3390/su151713155
Submission received: 9 August 2023 / Revised: 28 August 2023 / Accepted: 30 August 2023 / Published: 1 September 2023

Abstract

:
The Yellow River alluvial silt has unique engineering properties and is unstable when encountering moisture. The mechanical properties of silt subgrade can be impaired by the increase in moisture content due to rainwater infiltration, which has a negative effect on traffic safety. To further reveal the influence of moisture content on the deformation characteristics of silt, a series of monotonic and cyclic triaxial tests were conducted on the alluvial silt with different moisture contents. The development law of cyclic accumulative permanent strain and the effects of moisture content, cyclic deviator stress and confining pressure on the axial permanent strain of silt were explored. The study shows that the static strength of silt decreases with the increase in moisture content, and the attenuation of static strength is mainly caused by the decrease in cohesion due to the reduction in matric suction. The permanent strain rises linearly with the increase in moisture content and cyclic deviator stress, and decreases with the increase in confining pressure. An empirical model for predicting the permanent strain of silt under long-term cyclic loading considering the effect of moisture content was established. Compared with the test data and other existing models, the established model has easier obtained parameters, higher prediction accuracy and better applicability.

1. Introduction

Affected by the environment, geographical conditions and construction costs, many expressways across the Yellow River Basin are built on silt subgrade. Accurate prediction of permanent deformation of silt subgrade under long-term cyclic loading is of great significance to the sustainable development of expressway engineering, which runs through the design, construction and operation of expressway engineering. The flooding of the Yellow River and long-distance transportation of sediment have led to the formation of alluvial plain silt with high particle roundness and high porosity, which makes this silt hard to be compacted and sensitive to the variations in moisture content [1,2,3]. Due to the strong water retention capacity of silt, the moisture content of silt subgrade gradually increases from the optimal moisture content to the equilibrium moisture content during the construction process due to the influence of climate and groundwater level [4,5]. Under the combined effect of the increase in humidity and cyclic loading, subgrade undergoes accumulative permanent deformation. This results in a large number of subgrade problems, such as road boiling, excessive subsidence, and wheel rutting, which seriously affect the stability and normal operation of the road. However, the adverse effects of cyclic loading are not fully considered in the design and numerical analysis of most subgrade engineering. If the permanent deformation of silt subgrade under long-term cyclic loading can be accurately predicted, the bearing capacity of the road can be improved on the basis of controlling the construction cost of the road section in the design stage, and the overdue settlement during the operation period can be avoided. In the operation stage, scientific and effective heavy vehicle tonnage restrictions on road sections are conducive to the sustainable development of highway engineering. Therefore, it is of great theoretical significance and practical value to study the permanent deformation characteristics of the Yellow River alluvial silt under long-term cyclic loading and accurately predict the permanent deformation of the silt.
In order to clarify the complex deformation mechanism of soil under long-term cyclic loading, many scholars have carried out a large number of indoor and field tests [6,7,8,9,10,11]. Various methods have been utilized for calculating the permanent deformation of soil [12], such as constitutive modelling [13,14,15], the machine learning method [16], and empirical model [17,18,19,20,21,22]. Constitutive modelling usually simulates the cyclic deformation of soil using the small-step integration method, which leads to high computational costs and rapid error accumulation [23,24]. The machine learning method uses various predicting models, such as artificial neural networks [25], grey prediction model [26] and ant colony algorithm [27], and trains the model based on laboratory testing results or field data, which can accurately predict the development of subgrade settlement. Empirical models do not consider the complex stress–strain relationship of soil under cyclic loading and can directly reflect the impact of key factors on permanent strain. However, most of the empirical model models of soil permanent deformation are empirical formulas obtained by fitting a large number of experimental data. The model parameters are complex and lack physical meaning.
Figure 1 illustrates the three typical dynamic responses of subgrade under traffic cyclic loading: plastic shakedown, plastic creep, and incremental collapse [28,29,30]. The subgrade will not fail in the plastic shakedown state [31]. Thus, for practical engineering, the design should ensure that the dynamic response of subgrade maintains at this state during operation. Existing studies [21,32] have shown that power-law prediction models have been successfully applied to predict the plastic shakedown behavior of soil. Monismith et al. [17] carried out a series of undrained cyclic triaxial tests on silty clay, indicating that cyclic deviator stress is the primary factor affecting permanent strain. A simple power-law function model ( ε p = a N b ) was proposed based on the test results, which did not take into account the effects of stress conditions (confining pressure, cyclic stress level, etc.) and physical conditions (degree of compaction, moisture content, etc.) on permanent strain. The parameter values of the model have a high degree of dispersion and this limits its applications in practice. Li and Selig [18] introduced cyclic deviator stress and static strength parameters of soil into this model, which solved the shortcomings of a large range of model parameter values. Chai and Muira [19] further considered the effect of anisotropic consolidation of soil on permanent strain by introducing a parameter of initial static deviator stress. However, most of the aforementioned studies only considered the influence of stress state and neglected the impact of soil physical conditions. Additionally, these studies mainly focused on saturated clay. Regarding silt, Elliott et al. [33] conducted extensive cyclic triaxial tests to study the effects of moisture content and cyclic deviator stress on the deformation characteristics of subgrade soils in Arkansas. The results show that a relatively small increase in moisture content leads to a sharp increase in plastic deformation. A mechanical–empirical model considering the stress ratio parameter was also proposed. Puppala et al. [34] used octahedral normal stress and shear stress in the empirical model to consider the influence of stress state on the permanent deformation of silt, indicating that the soil is prone to permanent deformation under cyclic loading in a humid state. However, this model cannot directly consider the influence of moisture content and requires parameter regression analyses for soils with different moisture contents separately. Xiao et al. [35] studied the dynamic strength and deformation characteristics of the Yellow River alluvial silt, and proposed a prediction model including the static strength of the soil. Jamali et al. [21] studied the long-term dynamic behavior of Coode Island Silt (CIS), and showed that the increase in the cyclic stress ratio (CSR) and sand content would cause a decrease in the elastic modulus, which would affect the permanent deformation characteristics of CIS. The existing literature [33,34,35] shows that moisture content has a significant effect on the permanent deformation of silt. However, the establishment of these prediction models only uses static strength to indirectly reflect the influence of moisture content on permanent deformation. Therefore, it is necessary to establish an empirical model of permanent deformation of silt that can consider the influence of moisture content and has a simple calculation and wide applicability.
In order to study the influence of moisture content and stress level on the permanent deformation characteristics of Yellow River alluvial silt, silt specimens with three moisture contents were prepared in this paper. Through a series of monotonic and cyclic loading triaxial tests, the influence of moisture content on the mechanical properties of silt was discussed. The development law of permanent deformation of Yellow River alluvial silt under different moisture contents, cyclic deviator stresses and confining pressures was analyzed. An empirical model considering the effects of moisture content, cyclic deviator stress and loading cycles was established and compared with the existing models. The parameters of the established model are easy to obtain with higher prediction accuracy and better applicability, which is conducive to the promotion and application of this model.

2. Experimental Methods

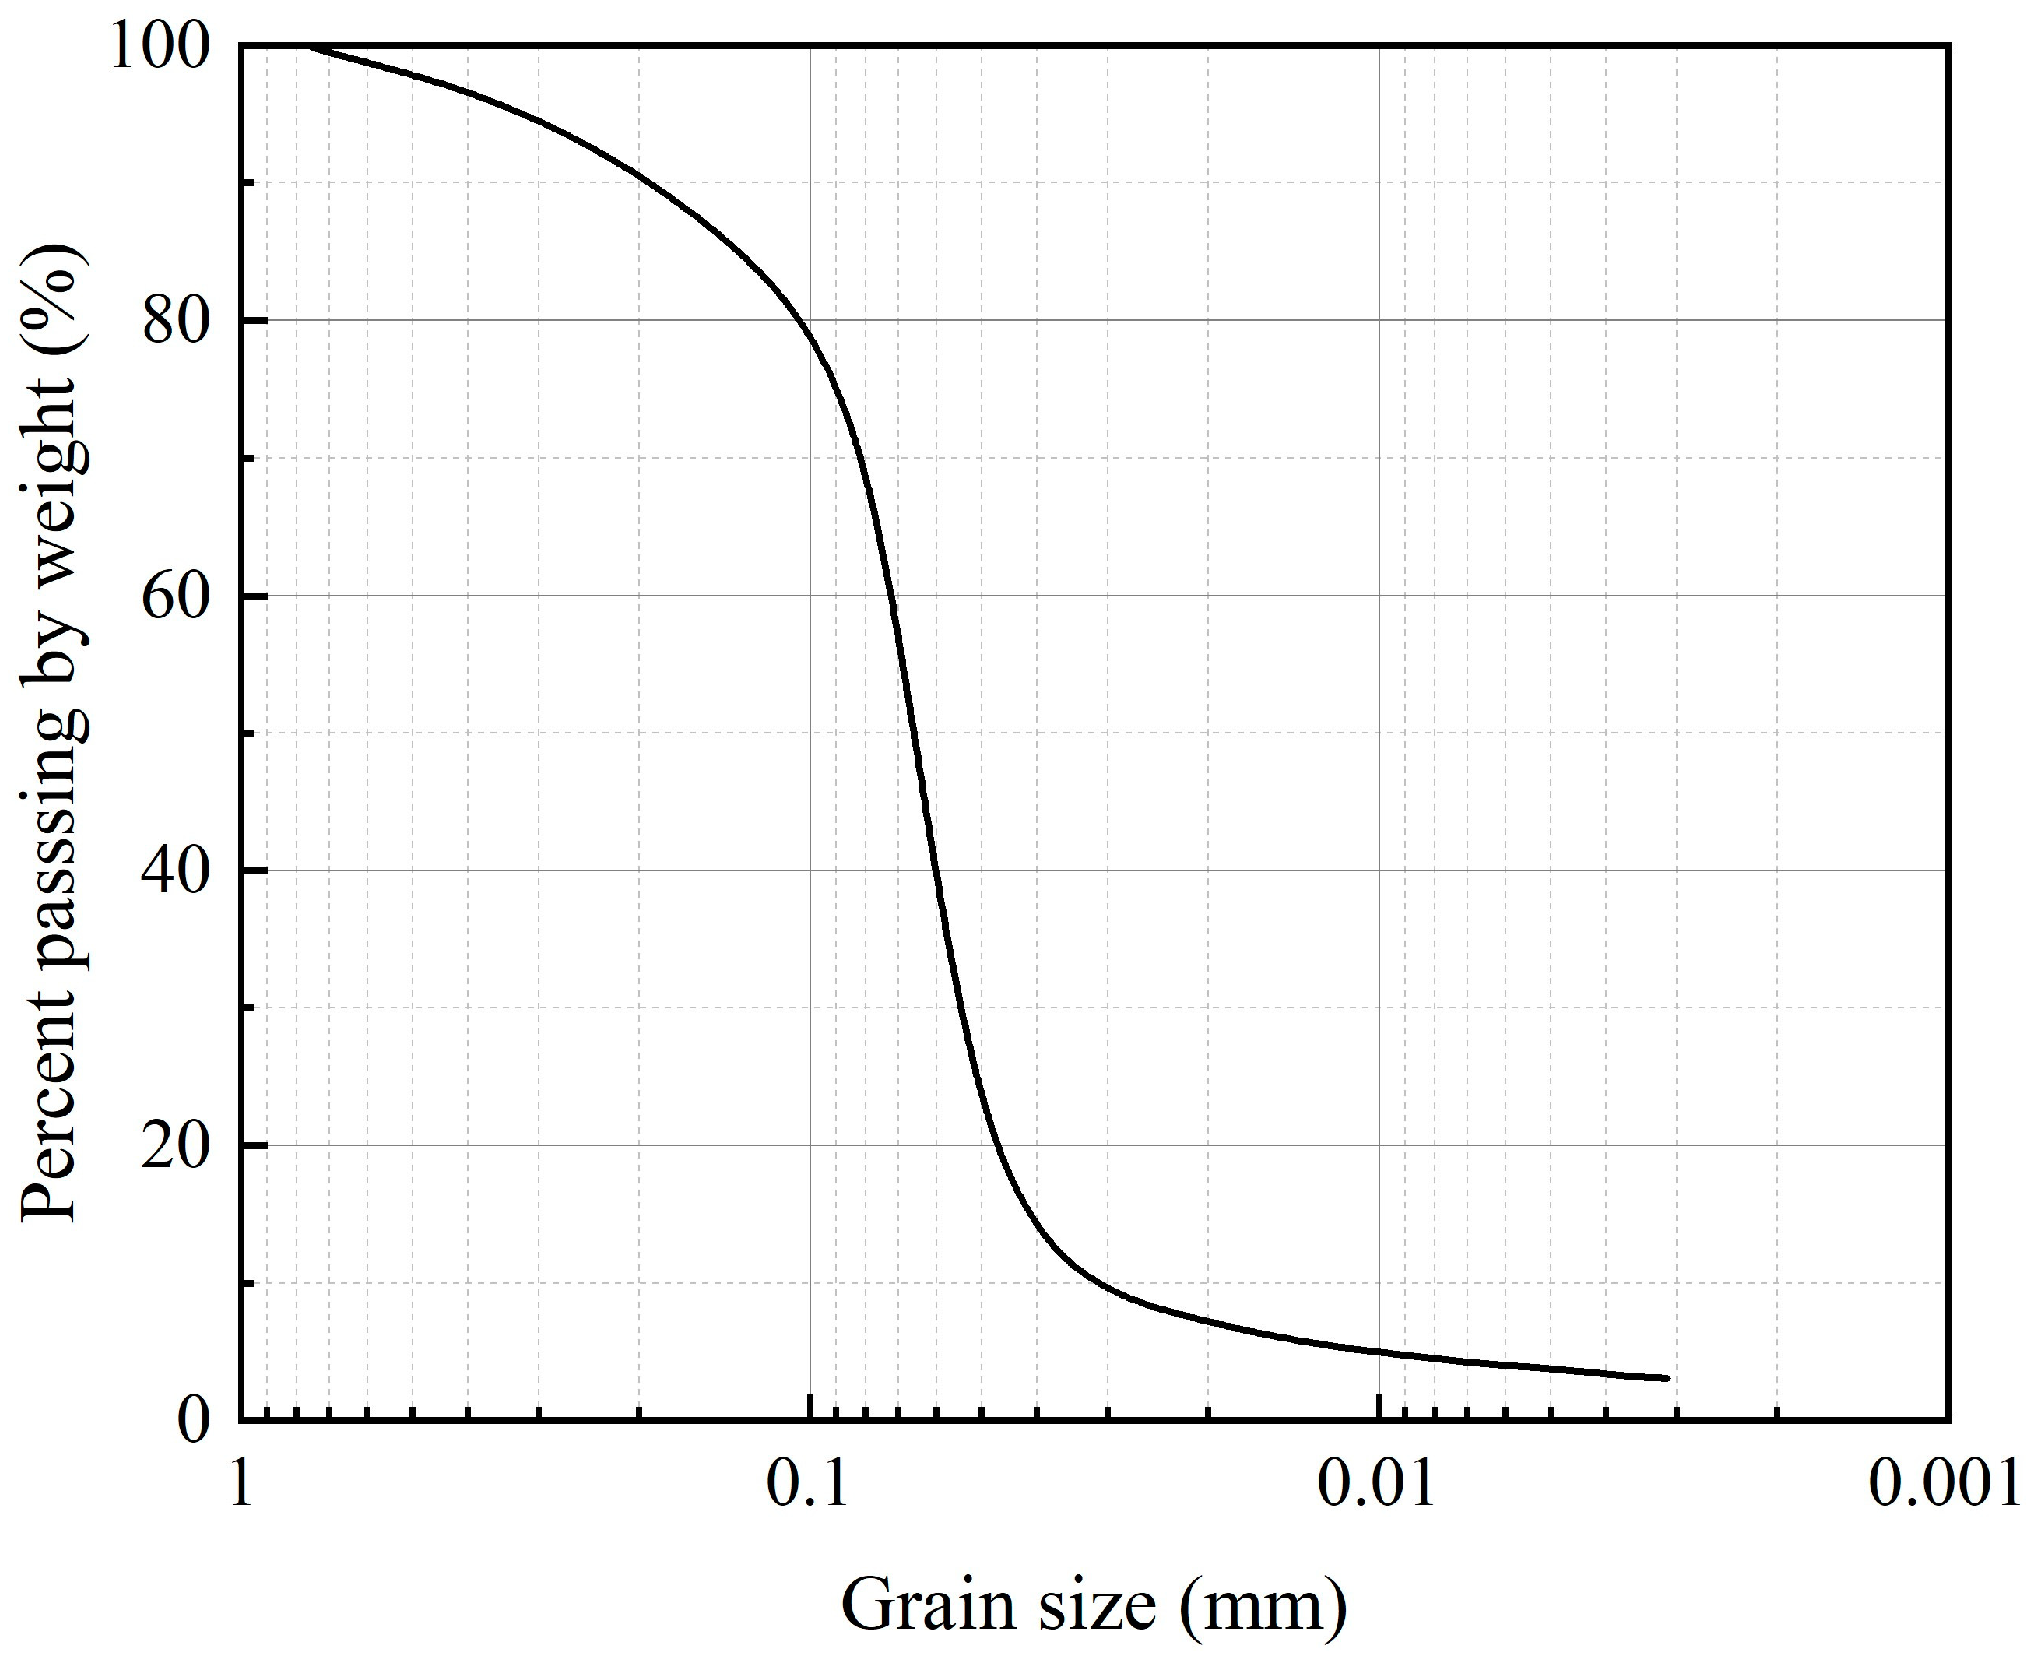
2.1. Test Material and Specimen Preparation
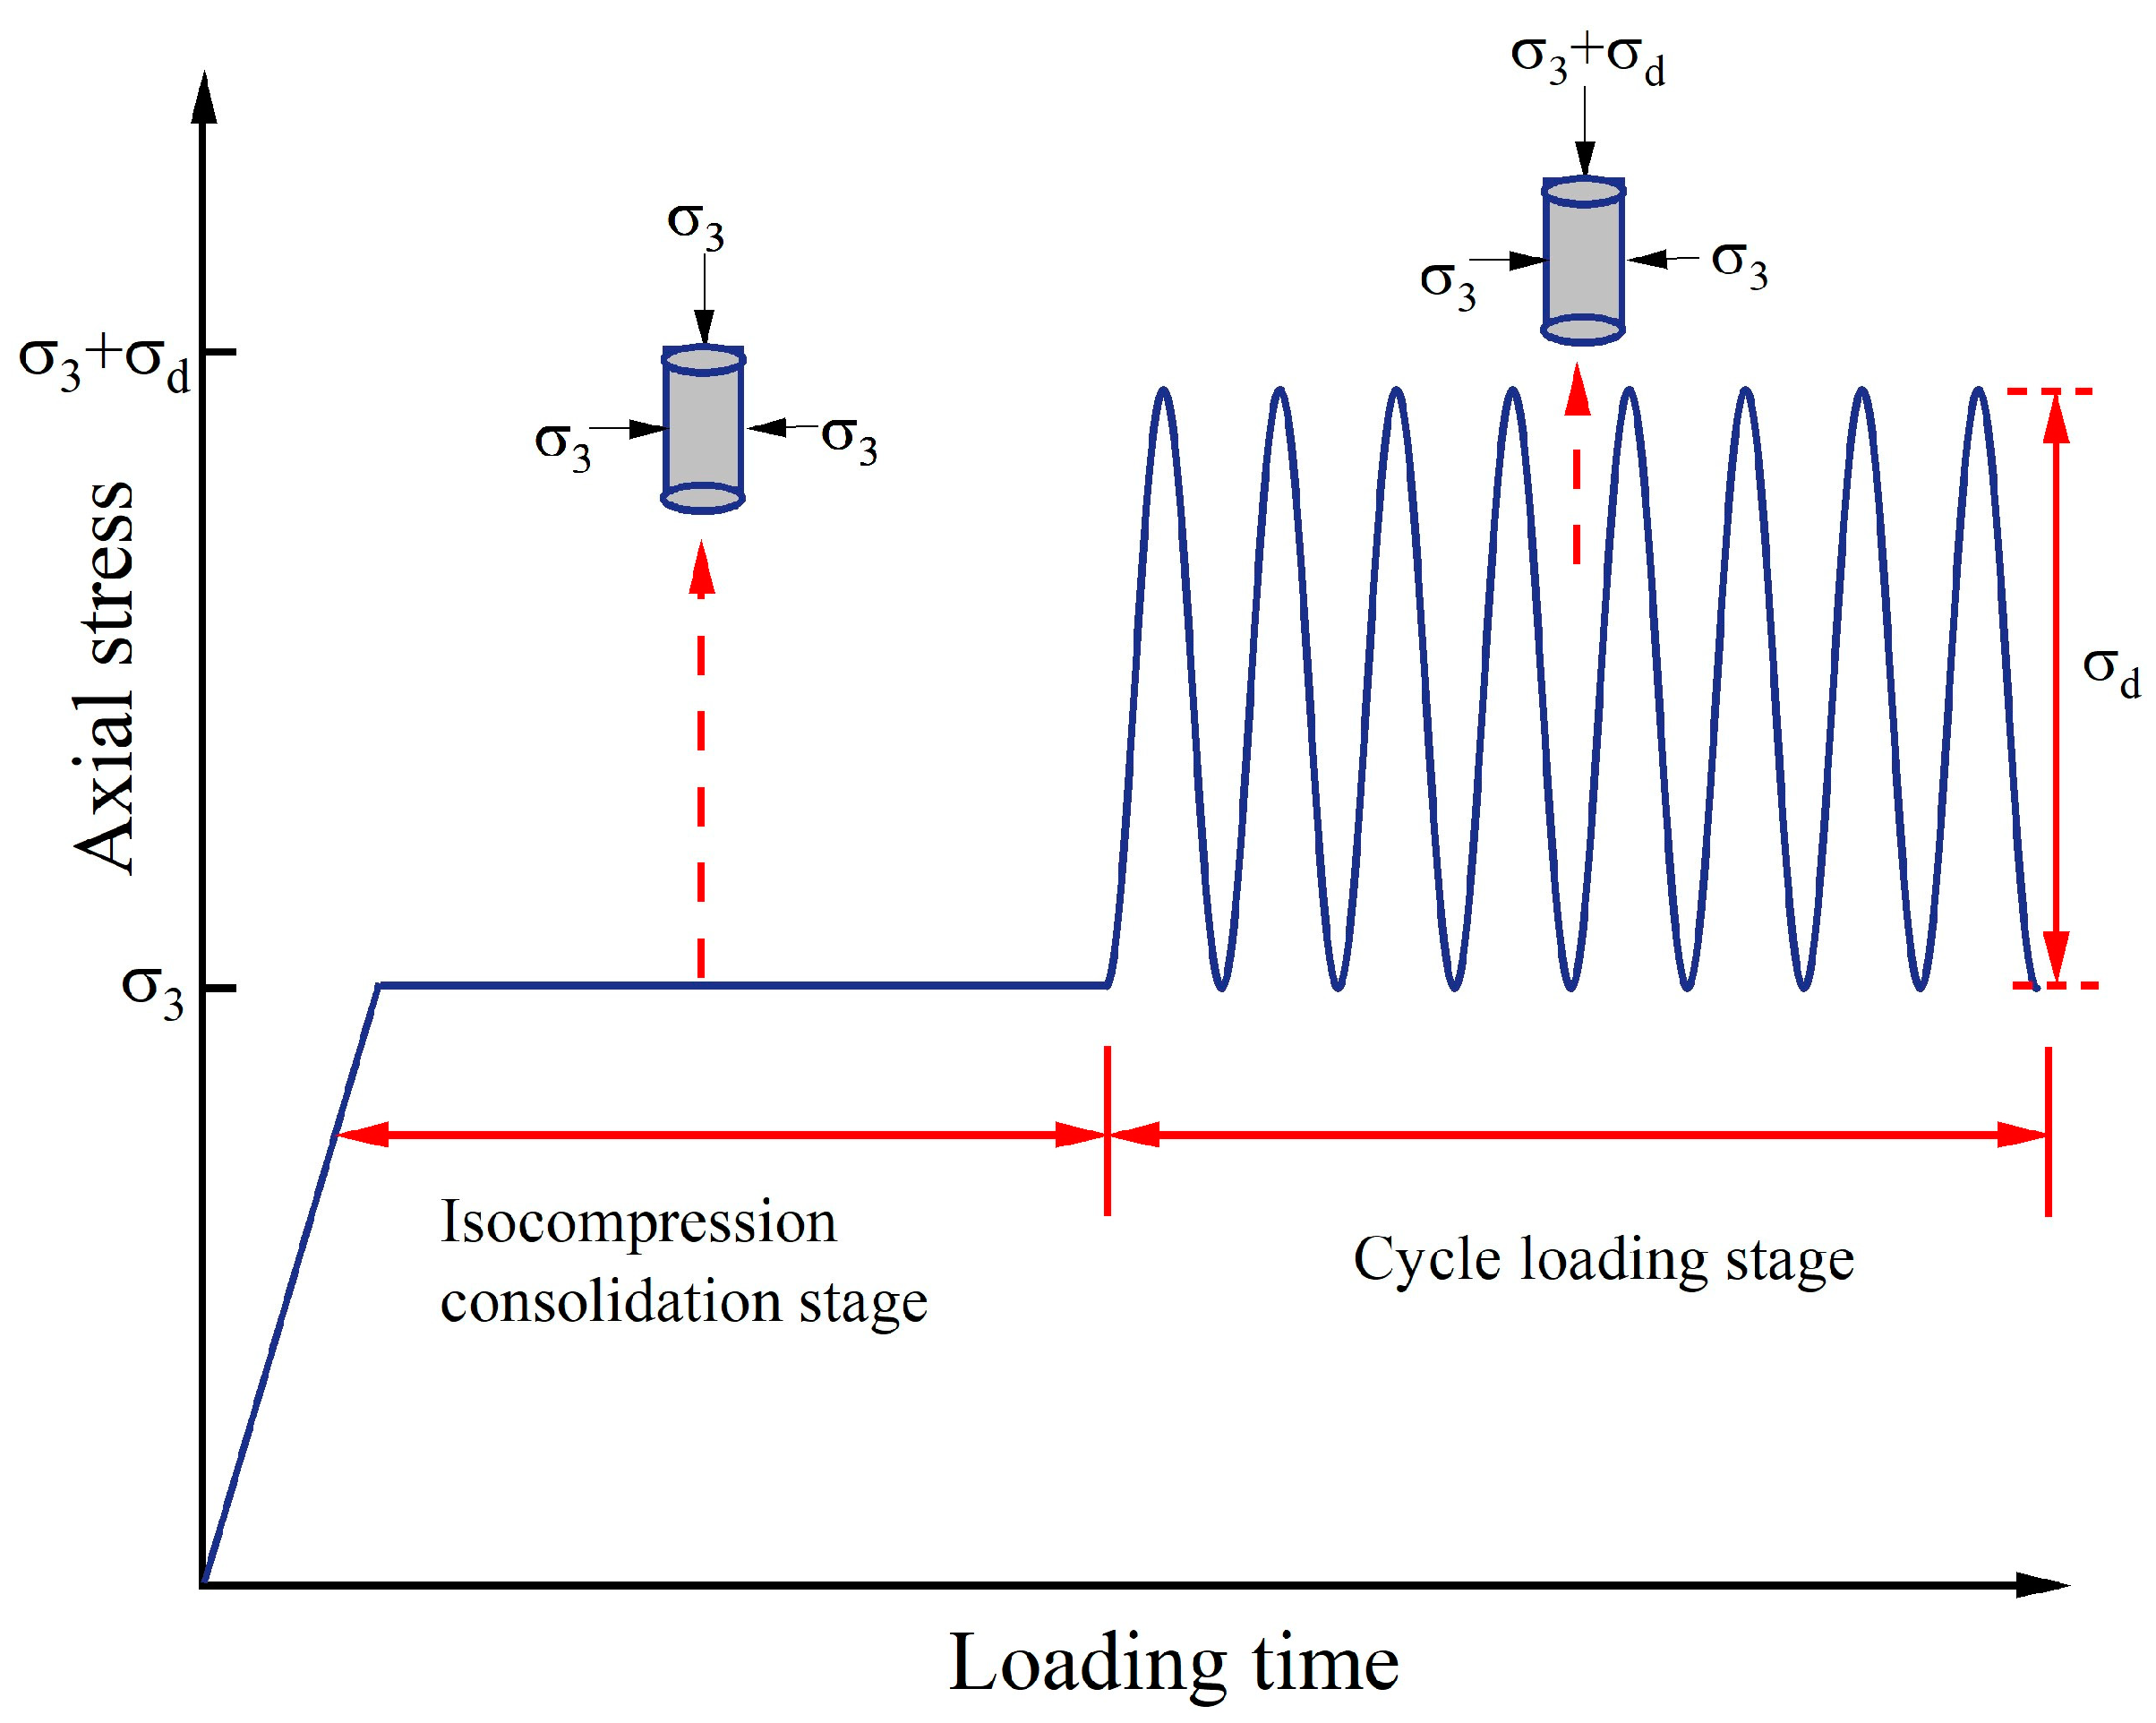
The silt used in the test is taken from a construction site in Zhengzhou City, Henan Province, which is a typical alluvial silt of the Yellow River. The particle size distribution curve of the silt is shown in Figure 2, obtained using a parallel sieve and hydrometer analyses. According to ASTM D854-14 [36], D4318-10 [37], D422-63 [38] and D698-12 [39], the properties of all indexes of silt are summarized in Table 1. It can be seen that the total mass of particles larger than 0.075 mm is below 15%, and the plasticity index (PI) is 9.6, which is located above the A line in the plasticity diagram. Therefore, according to ASTM D2487-17 [40], the soil tested can be termed as Lean Clay (CL): PI > 7. All the tests were performed with remolded soil as the influence of initial soil structure was not considered in this study. The silt was crushed, dried and sieved after collecting from the site. The soil specimen was prepared by the compaction method in a mold with 39.1 mm in diameter and 80 mm in height. After compaction, the mold was removed and the specimen was sealed in cling film [41,42,43].

2.2. Test Procedure

The triaxial tests under monotonic and cyclic loading were performed using the advanced Dynamic Triaxial Test System (DYNTTS) produced by GDS. The system has high control and measurement accuracy, strong real-time data acquisition function, and can carry out long-term cyclic loading tests at different loading frequencies [22,24].
The test conditions and results of cyclic triaxial test are shown in Table 2. The half-sine wave with a constant amplitude controlled by stress is selected to simulate the dynamic characteristics of the traffic load. Due to the poor drainage condition of the actual subgrade, the tests were conducted under undrained conditions. According to the requirements of ASTM D5311-11 [44] for dynamic triaxial tests, the loading frequency of 1 Hz and the number of loading cycles of 10,000 were selected. The investigation of Uzan et al. [45] for the Israeli subgrade found that the moisture content finally came into an equilibrium, which was 1.2 to 1.3 times the optimum moisture content. Hence, in this study, soil specimens with 1.1, 1.25 and 1.35 times the optimum moisture content (OMC) were prepared. The results of many cyclic triaxial tests show that the axial permanent deformation and its accumulation rule are directly related to the magnitude of the cyclic deviator stress [33,34,35]. The stress on the top of the subgrade has been calculated using the BISAR program and it is less than 69 kPa. Therefore, the cyclic deviator stress in this test is simulated at three stress levels of 28, 48 and 69 kPa. The height of the subgrade studied in this paper is generally within 0.5 m to 1.5 m, and the confining pressure of the subgrade is within the range of 10 to 30 kPa when the bulk density of the fill is 20 kN/m3. Therefore, 28 kPa confining pressure was used in this test to simulate the actual confining stress state of subgrade soil. In order to study the effect of confining pressure on permanent deformation, cyclic tests with confining pressures of 14 and 56 kPa were also carried out. The dry density of the specimens was controlled to be 1.67 g/cm3. The changes in axial stress during the test are shown in Figure 3. The cyclic stress ratio (CSR) is used to study the effect of stress level on permanent strain, which is defined as Equation (1) [46].
C S R = σ d 2 σ 3

3. Test Results and Discussion

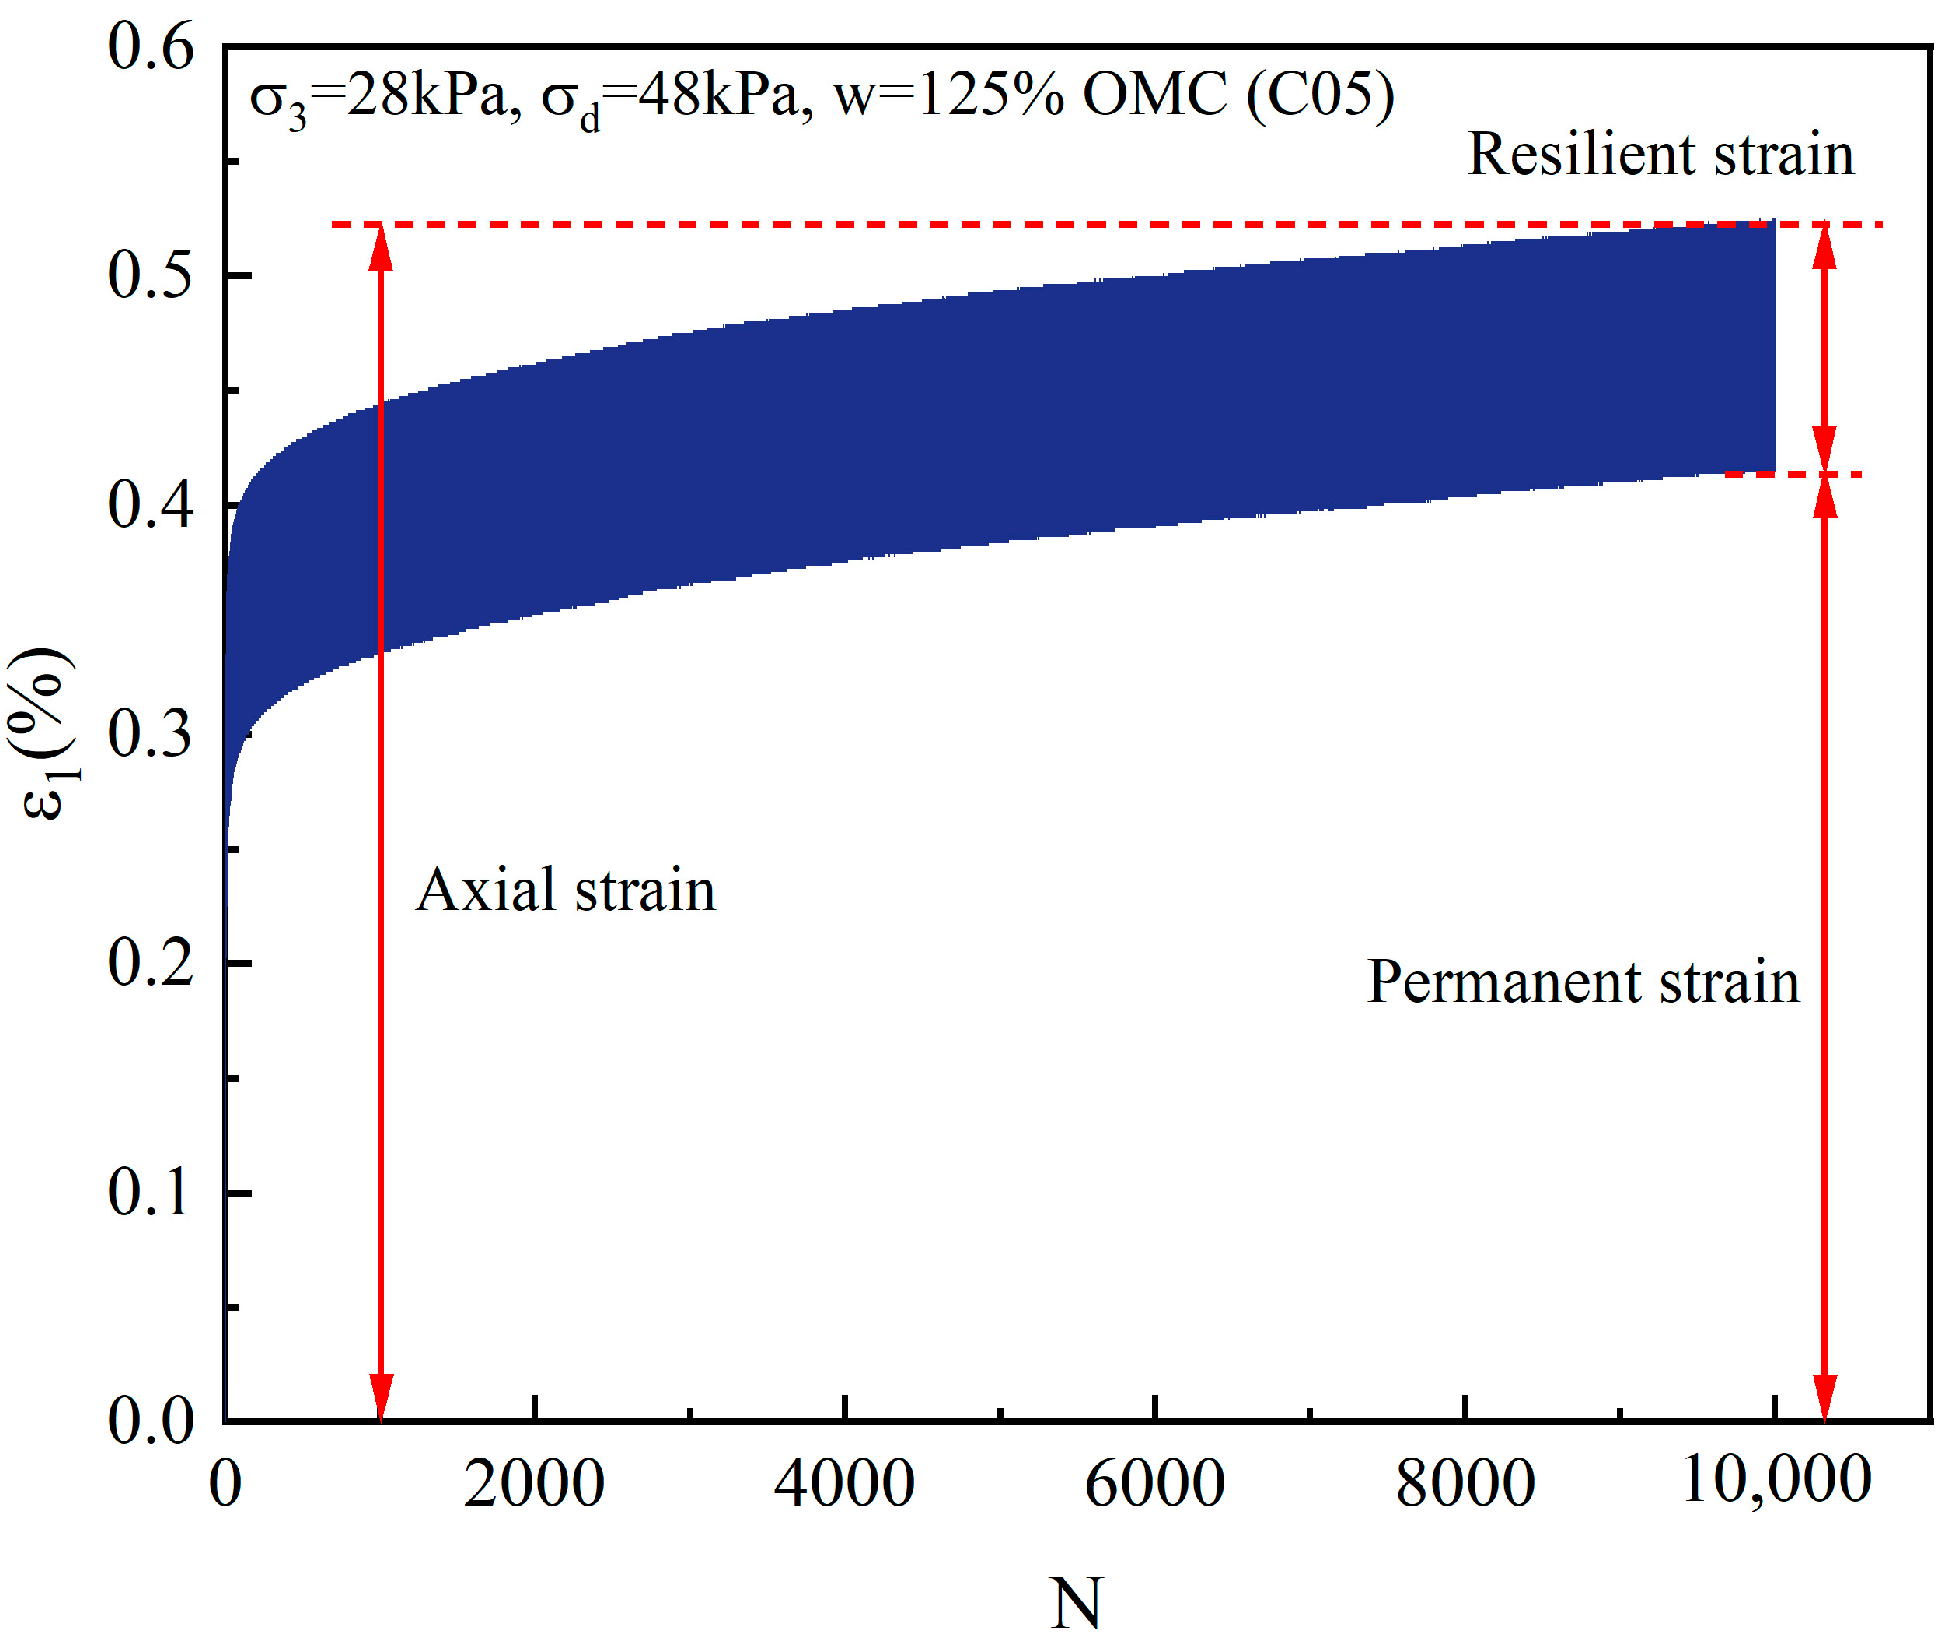
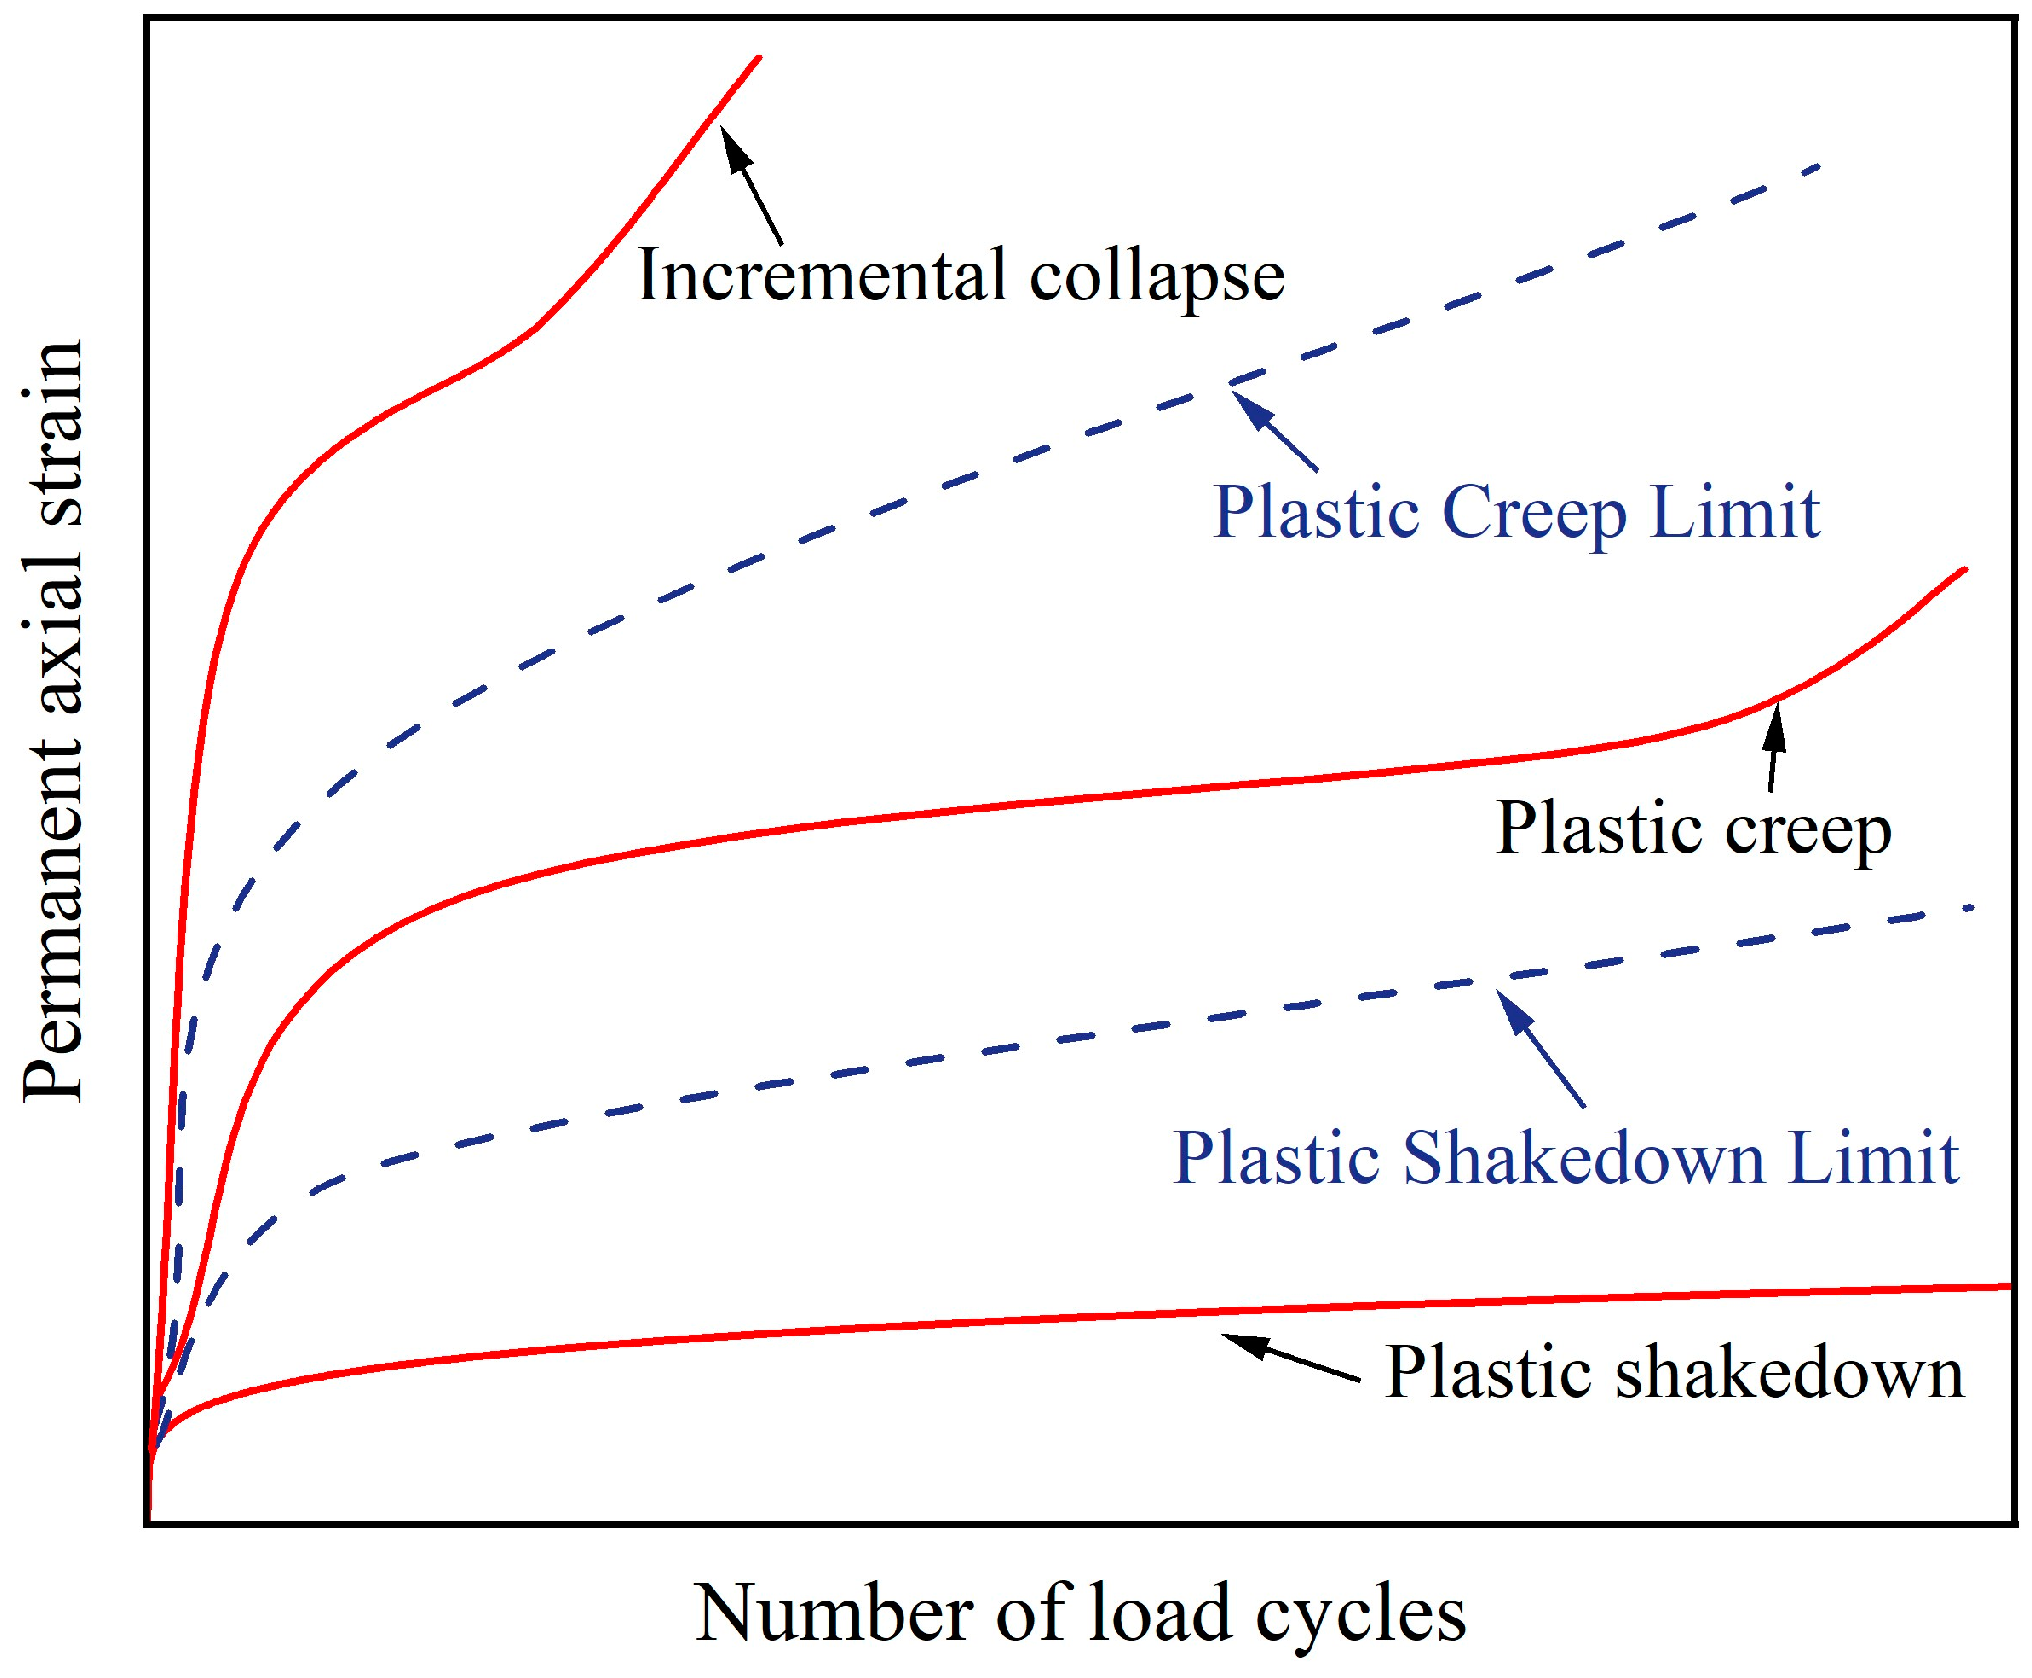
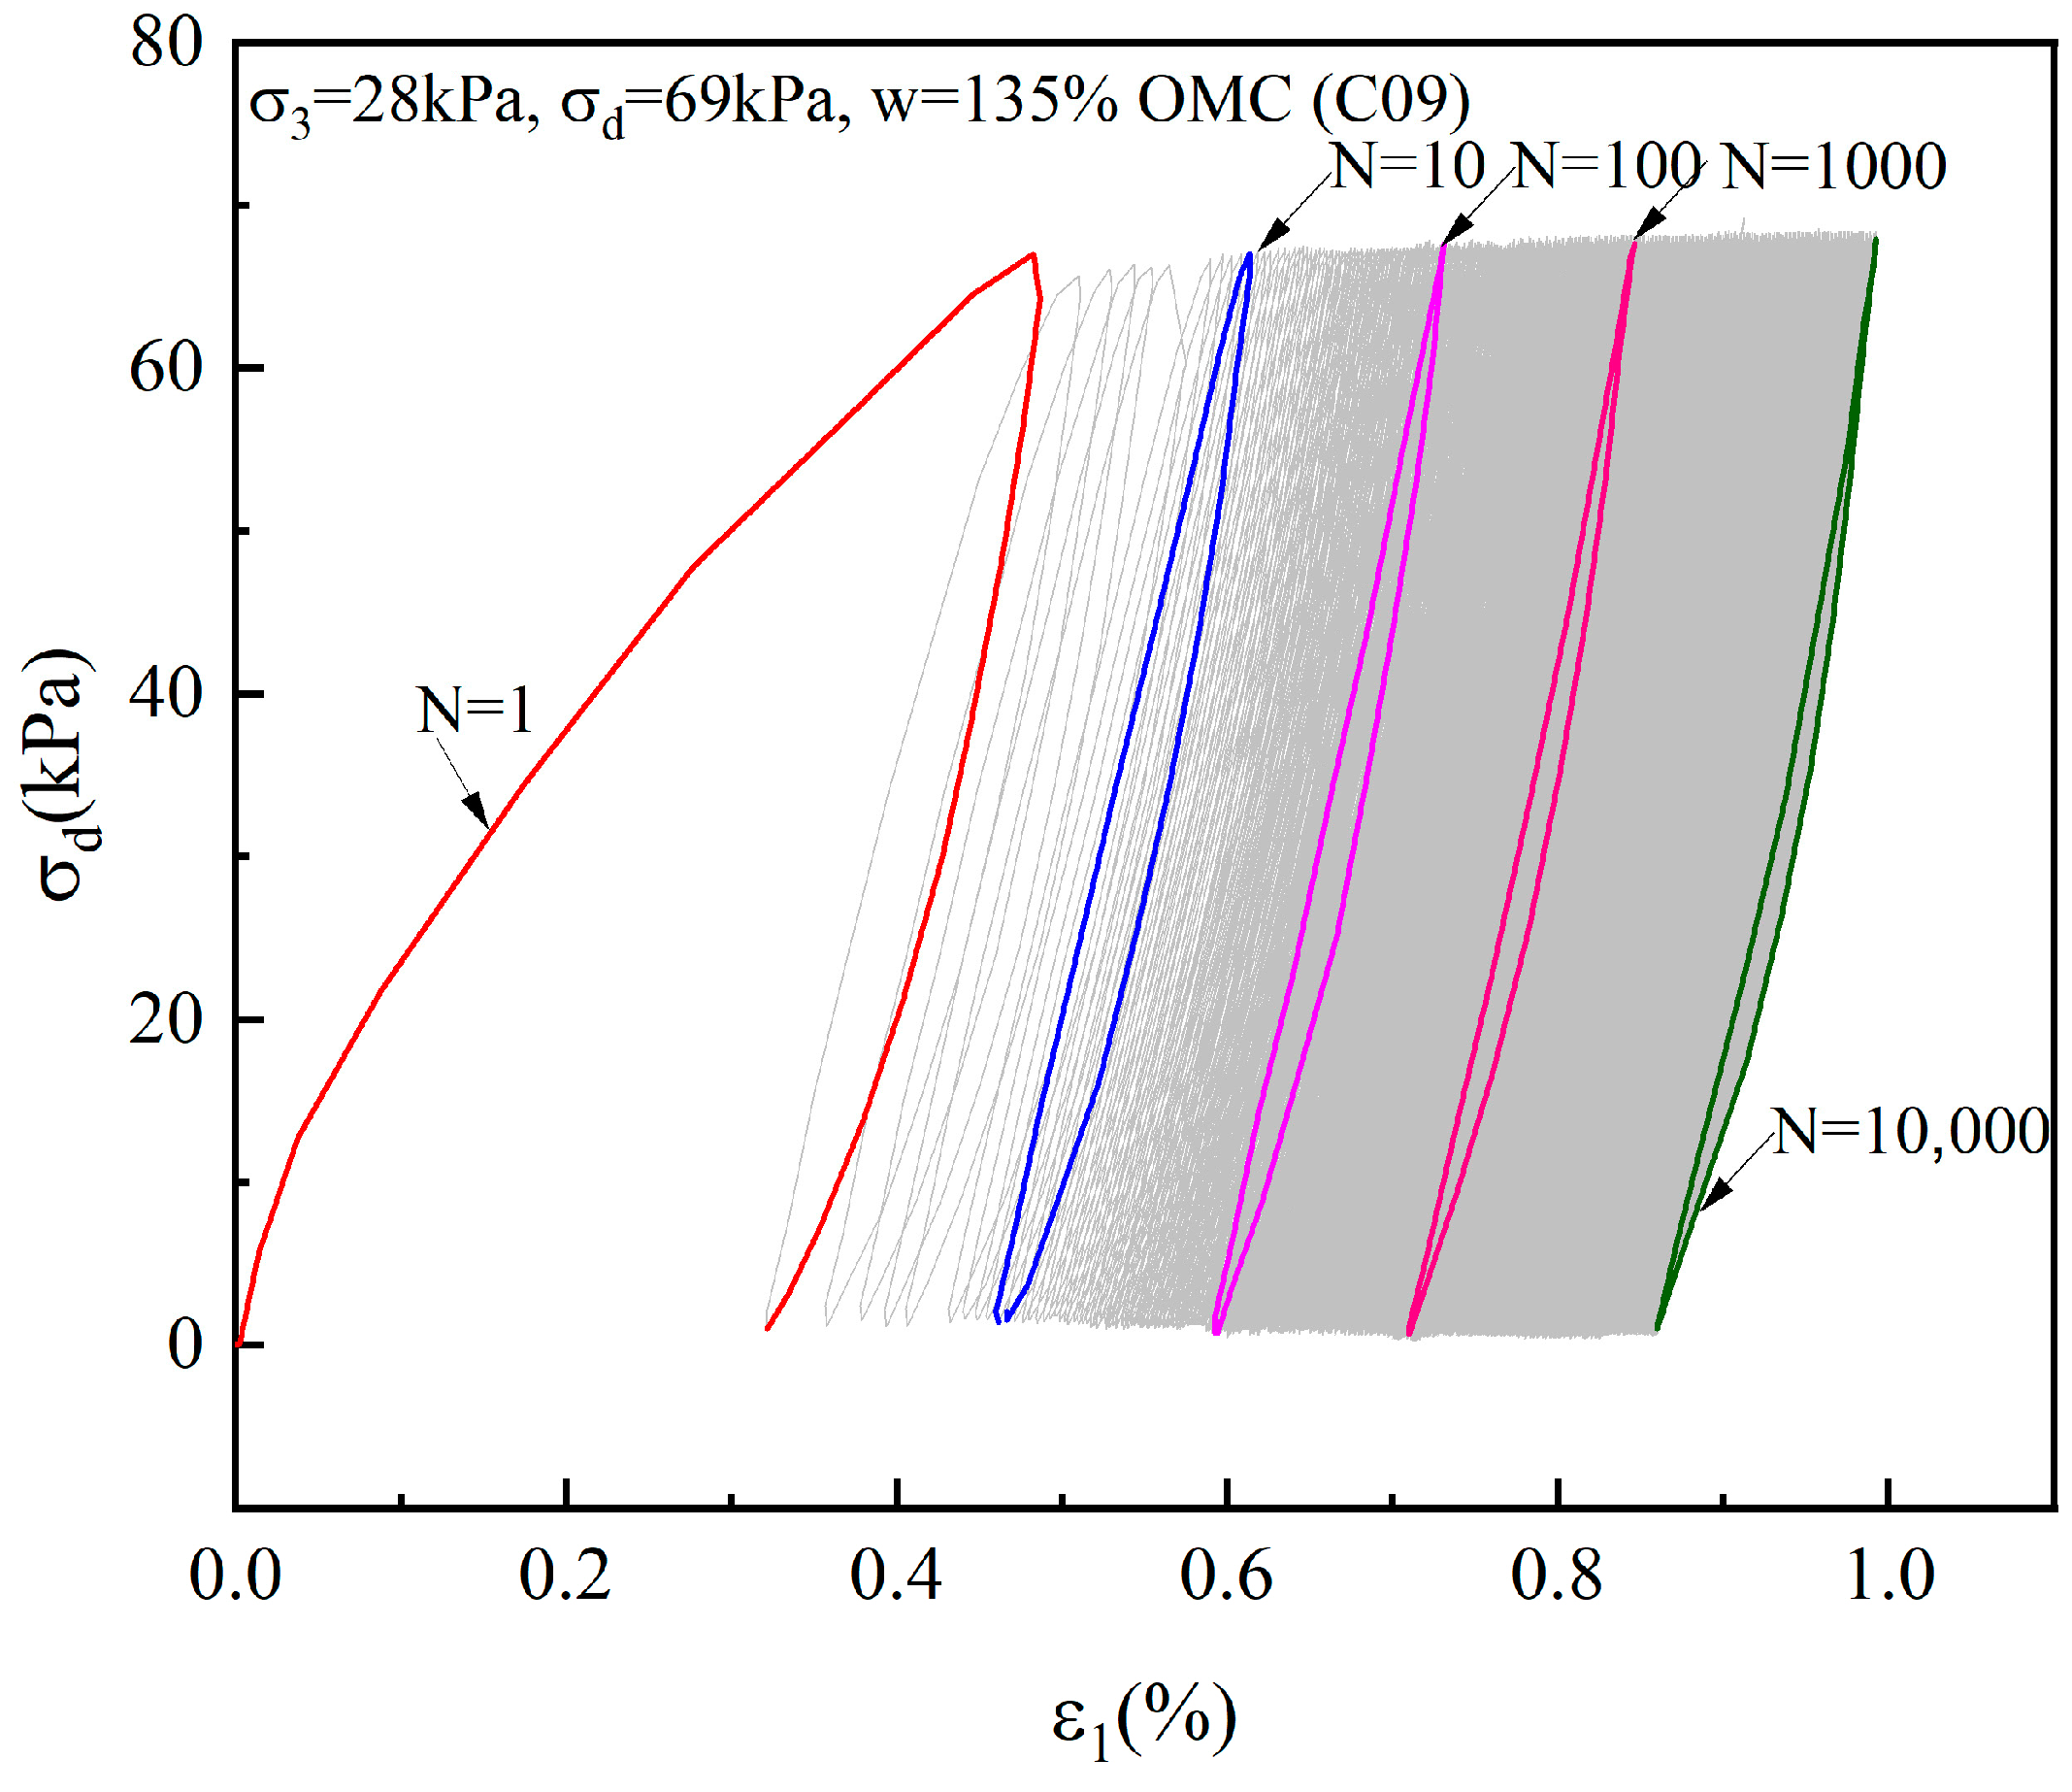
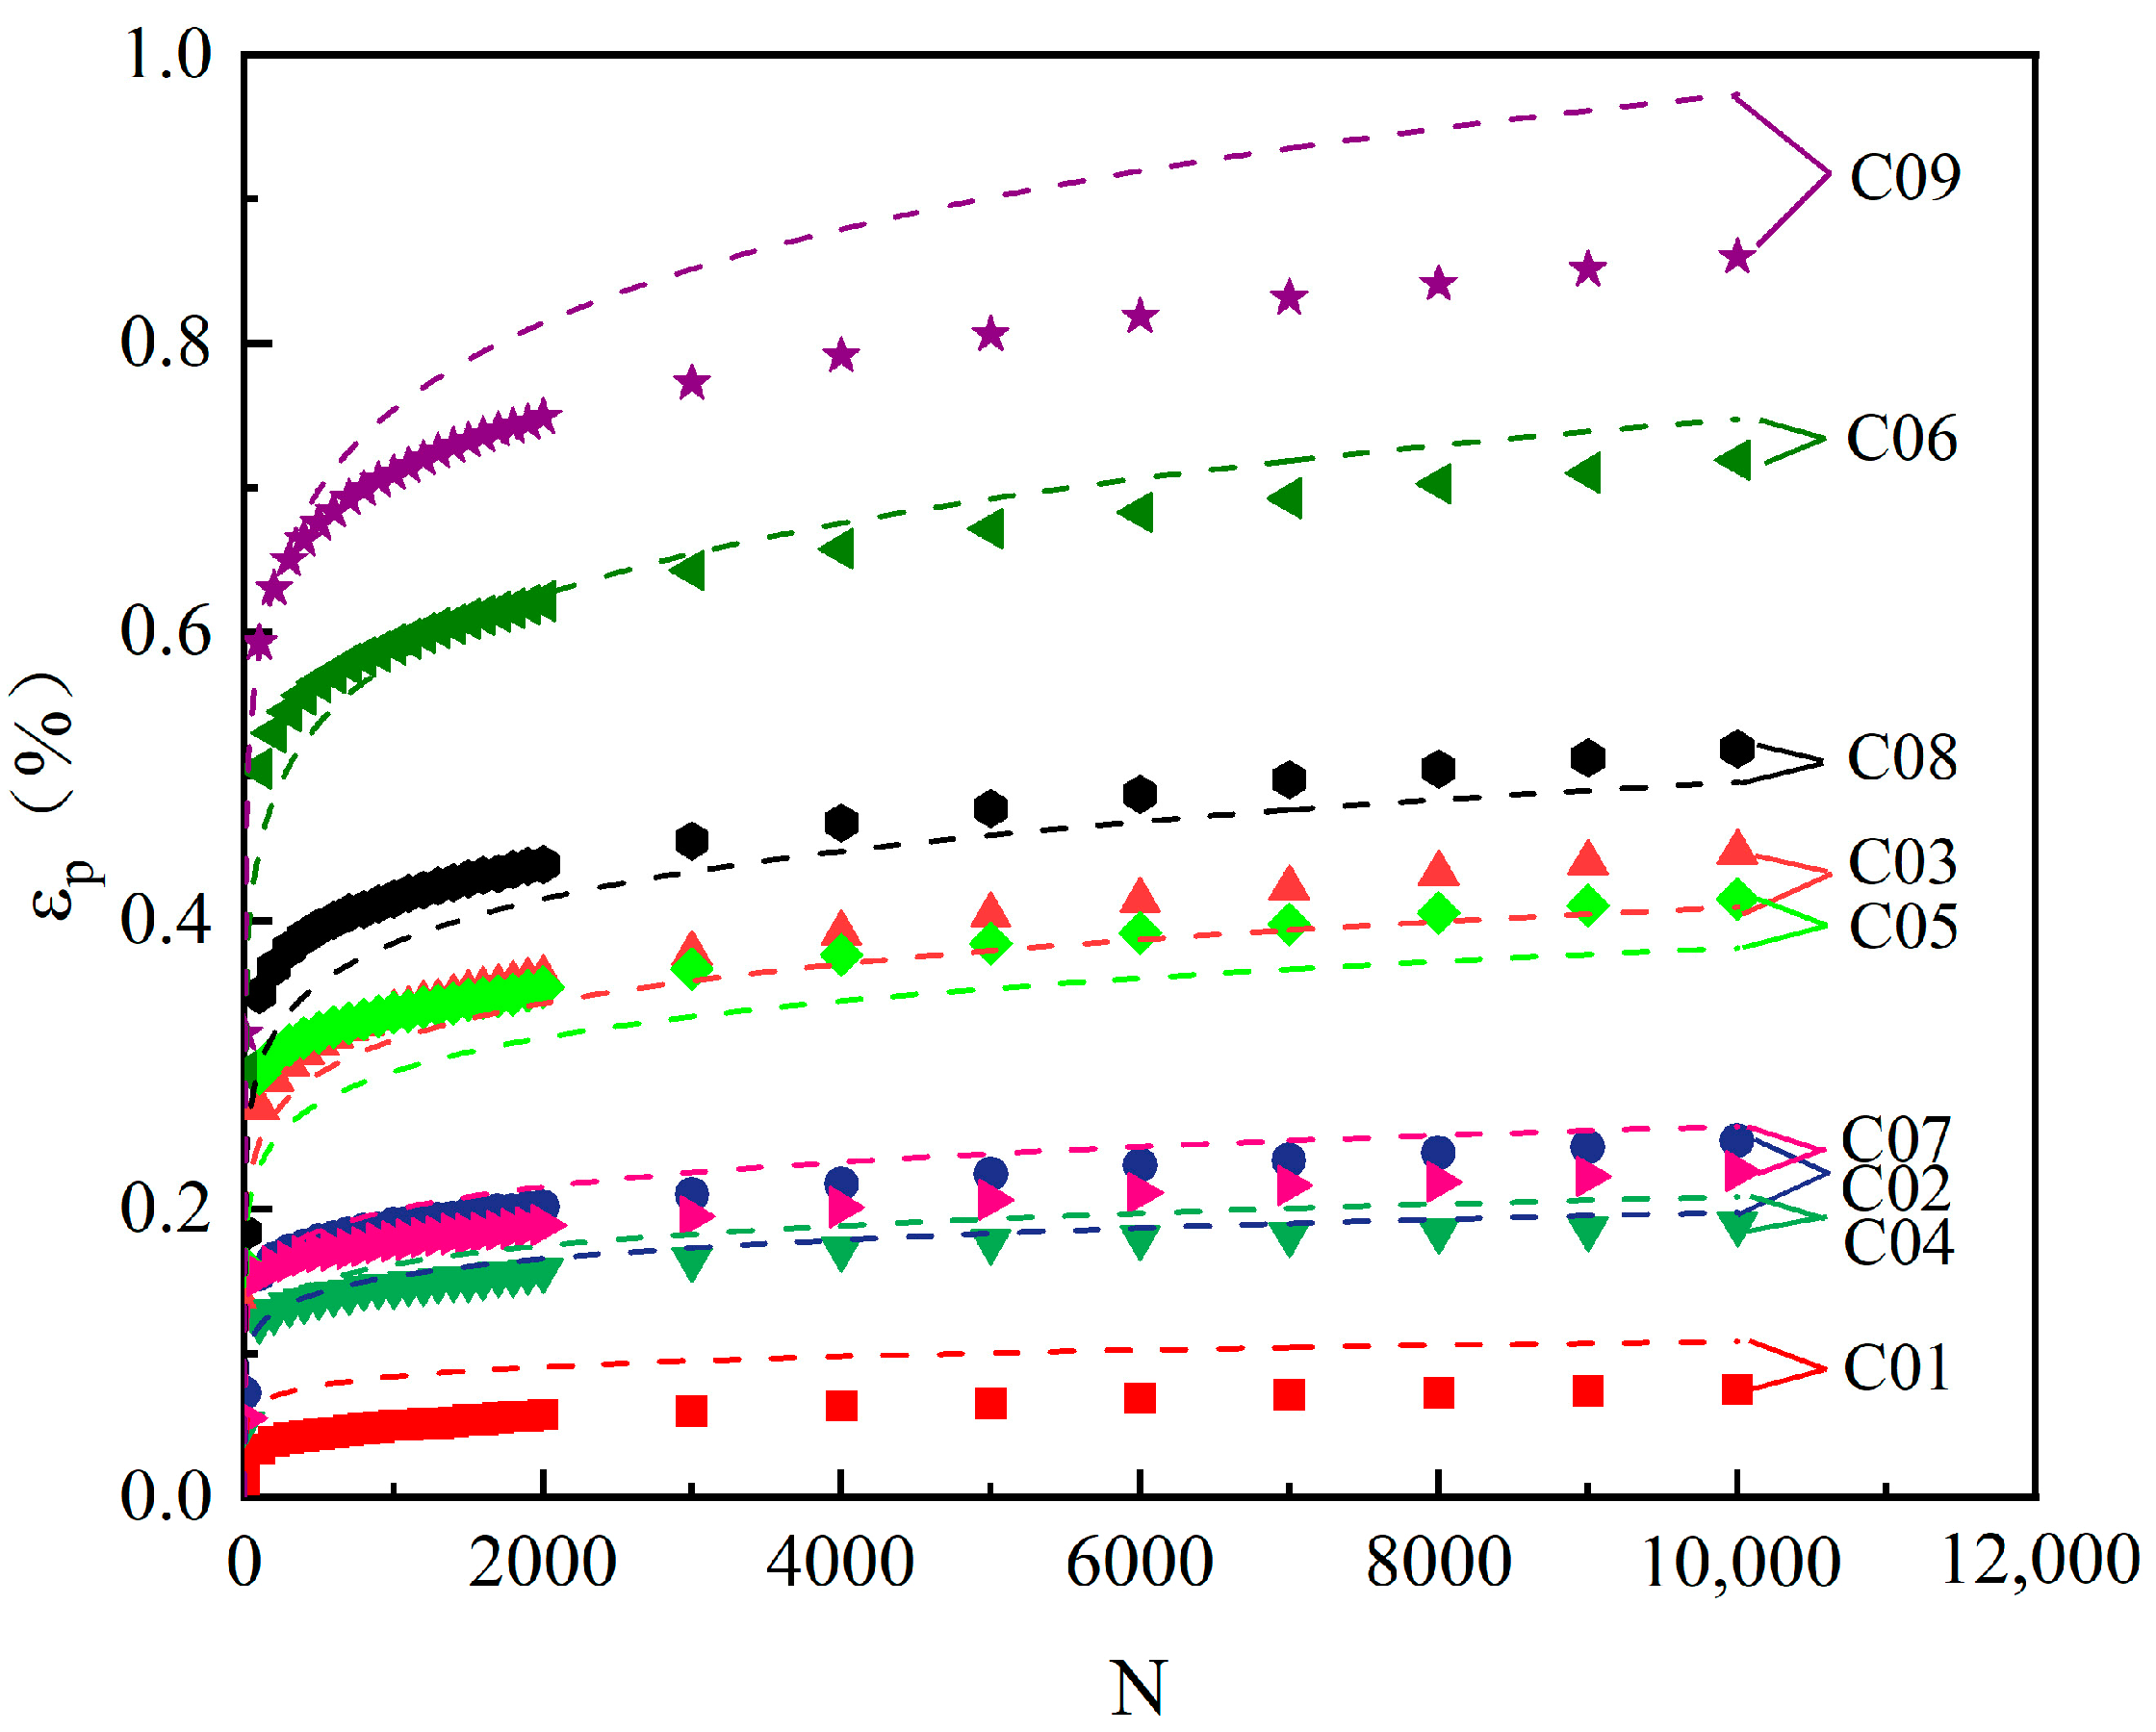
3.1. Typical Deformation Behavior of Silt under Long-Term Cyclic Loading

Under cyclic loading, not only elastic deformation was produced, which recovered immediately after unloading, but also plastic deformation occurred, which was unrecoverable. When the load amplitude is small, the subgrade soil generally exhibits elastic characteristics. When the loading amplitude is large, soil starts yielding and residual strain begins to generate. The hysteresis loop of stress–strain curve is no longer closed due to the strain accumulation, which causes the permanent settlement of subgrade soil. Figure 4 plots a typical curve of the changes in axial strain ( ε 1 ) with the number of cycles ( N ) of the silt under cyclic loading. It can be seen that the 1st cyclic loading produces the largest axial permanent strain, accounting for 39% of the total permanent strain for 10,000 cycles. The axial permanent strain accumulates rapidly before 1000 cycles. After that, the accumulation of permanent strain slows down and enters into a loading stable state, which means that the development of permanent strain comes into the plastic shakedown state. This is consistent with the conclusions obtained by Chen et al. [47]. The permanent strain generated at 1000 cycles accounts for more than 75% of the total permanent strain at 10,000 cycles. Therefore, the first 1000 cycles of the loading process have a significant effect on the overall permanent strain.
Figure 5 illustrates the cyclic deviator stress ( σ d ) –axial strain ( ε 1 ) curves of C09 under N = 1, 10, 100, 1000, and 10,000 cyclic loads. It can be found that the tilt angle of the hysteresis loop increases significantly from N = 1 to N = 1000, while it changes slightly from N = 1000 to N = 10,000. The area of hysteresis loop is larger at the early cyclic stage. With the increase in loading cycles, the tilt angle of the hysteresis loop increases and the area decreases, indicating the reducing accumulating rate of permanent strain. The reason is that in the early stage of cyclic loading, the silt particles are rearranged and the pores are compressed, resulting in a large permanent strain. As the loading proceeds, the specimen is compacted and the tiny fissures within the soil are basically closed, resulting in the obstruction of particle movement. At this time, the deformation mainly comes from the shear deformation between the soil particles. Thus, the development rate of permanent strain gradually becomes slow.

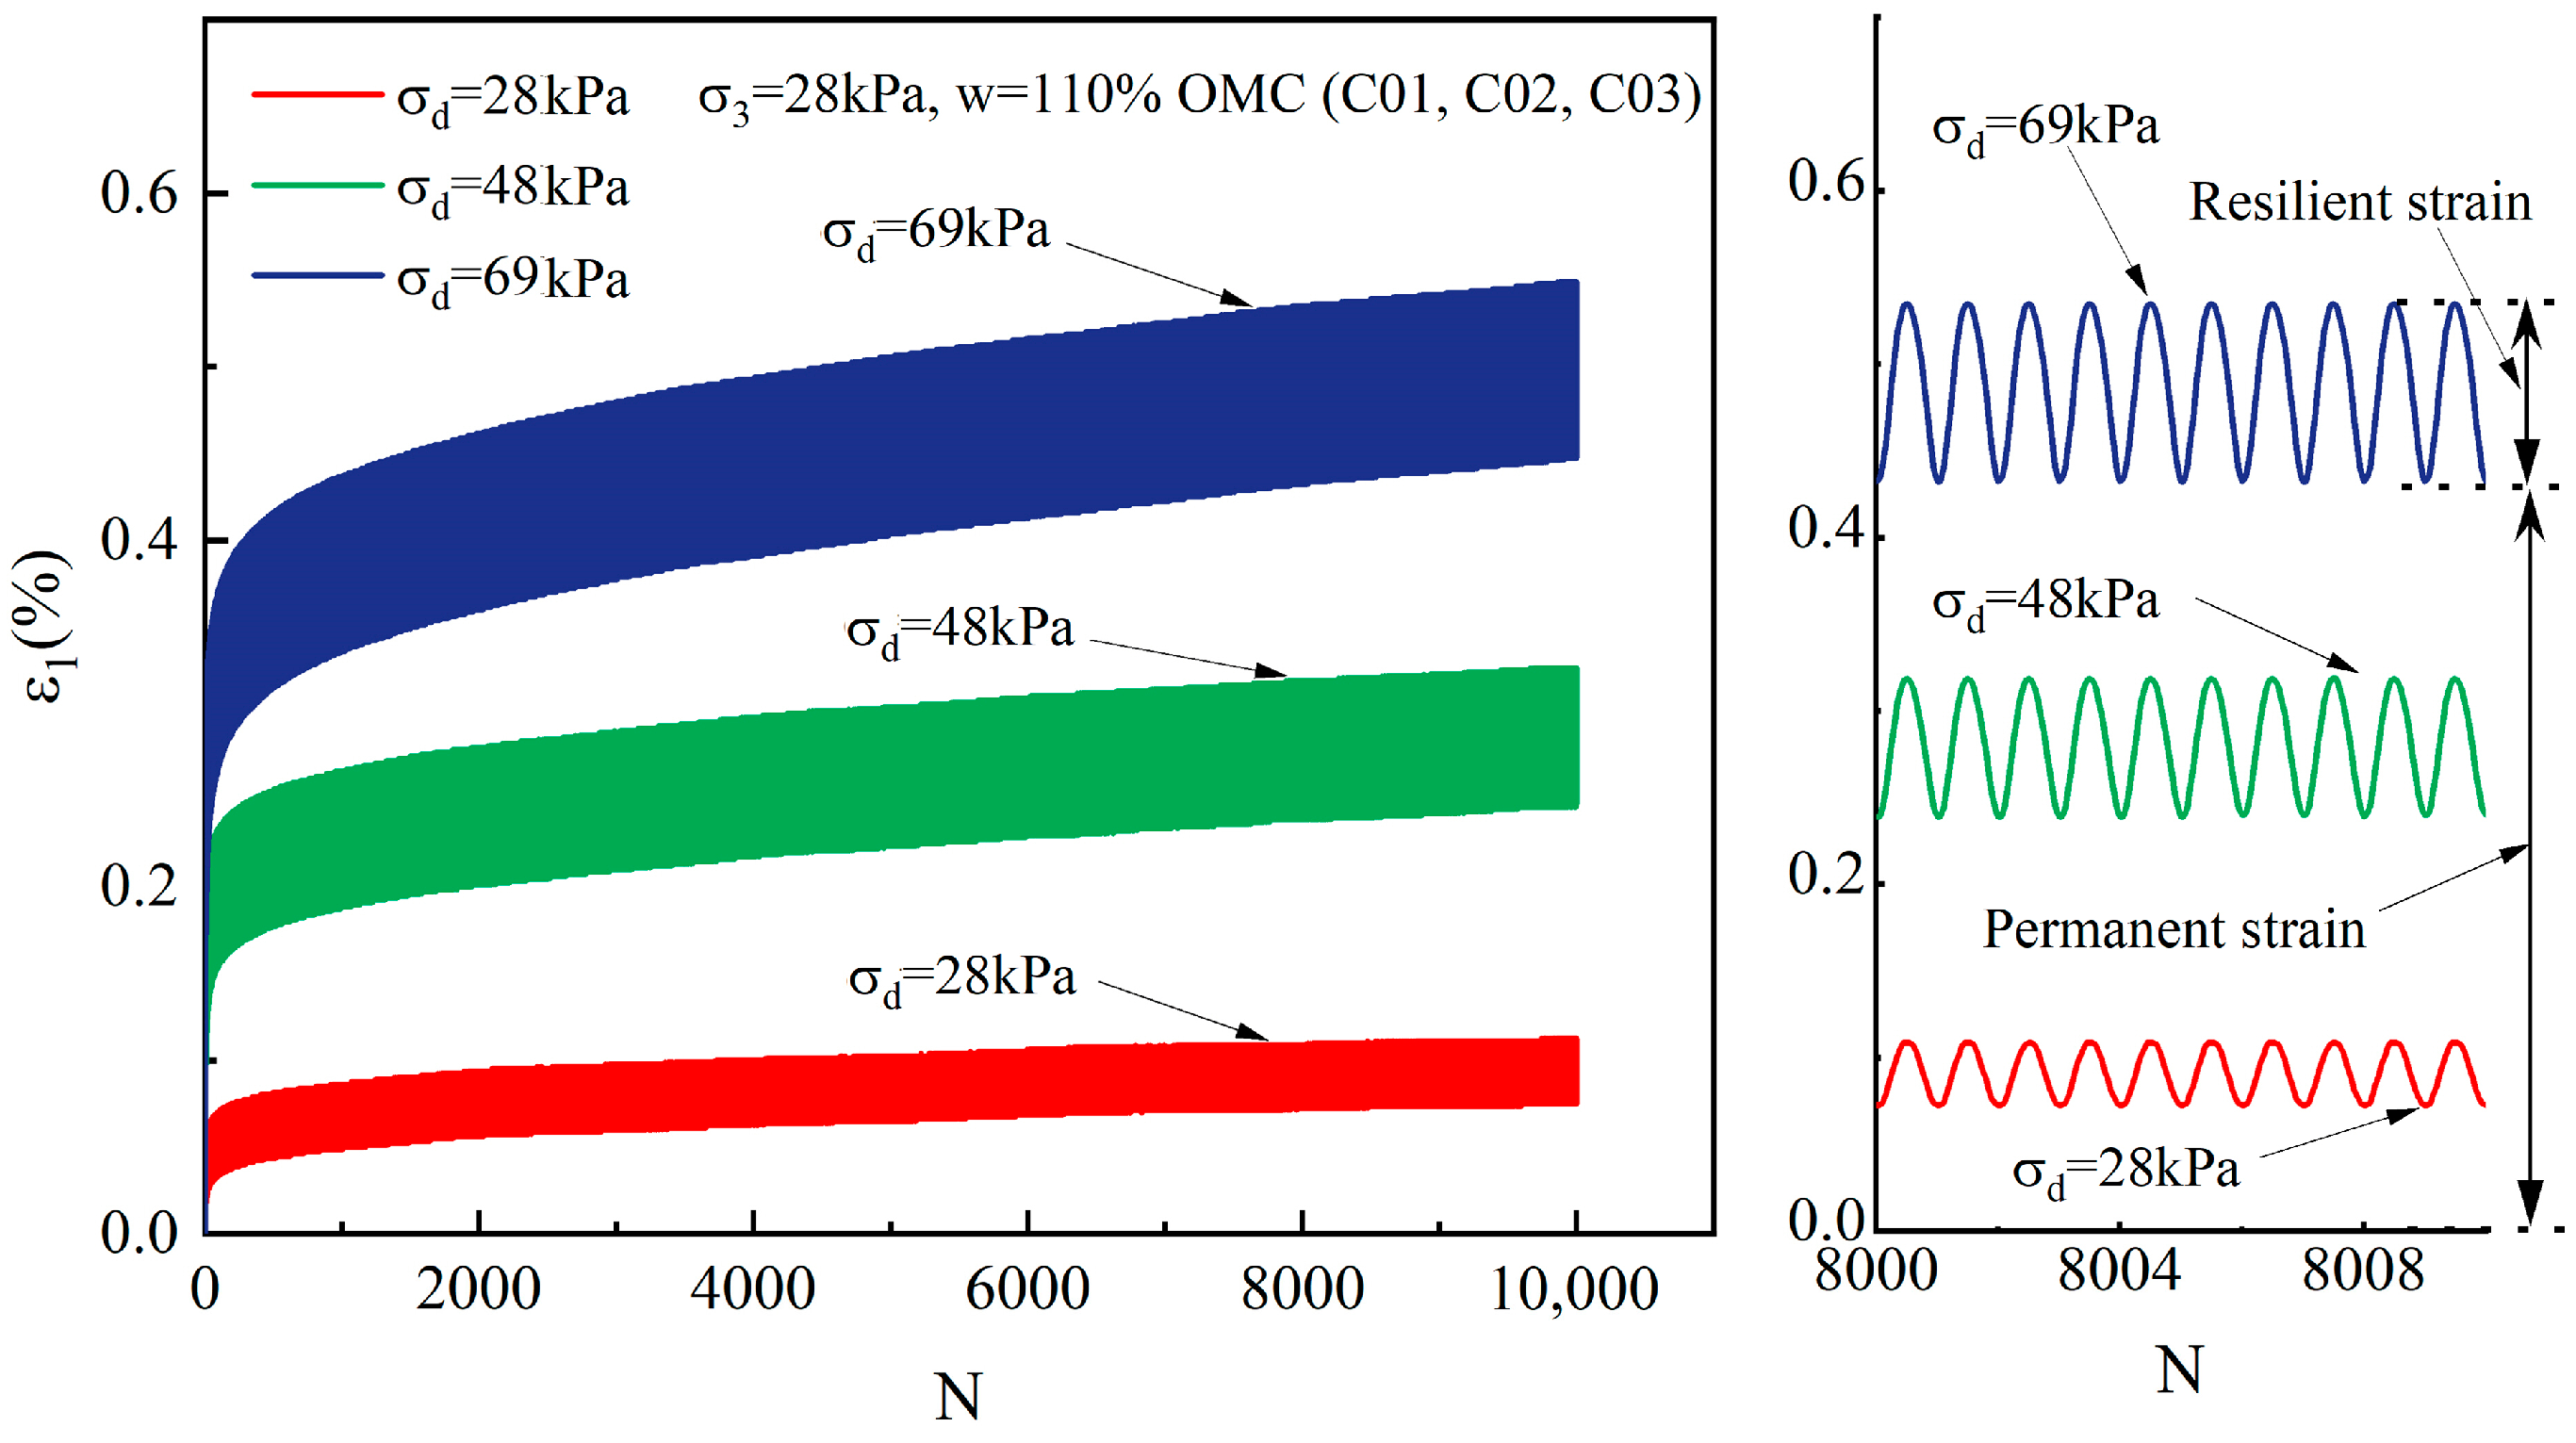
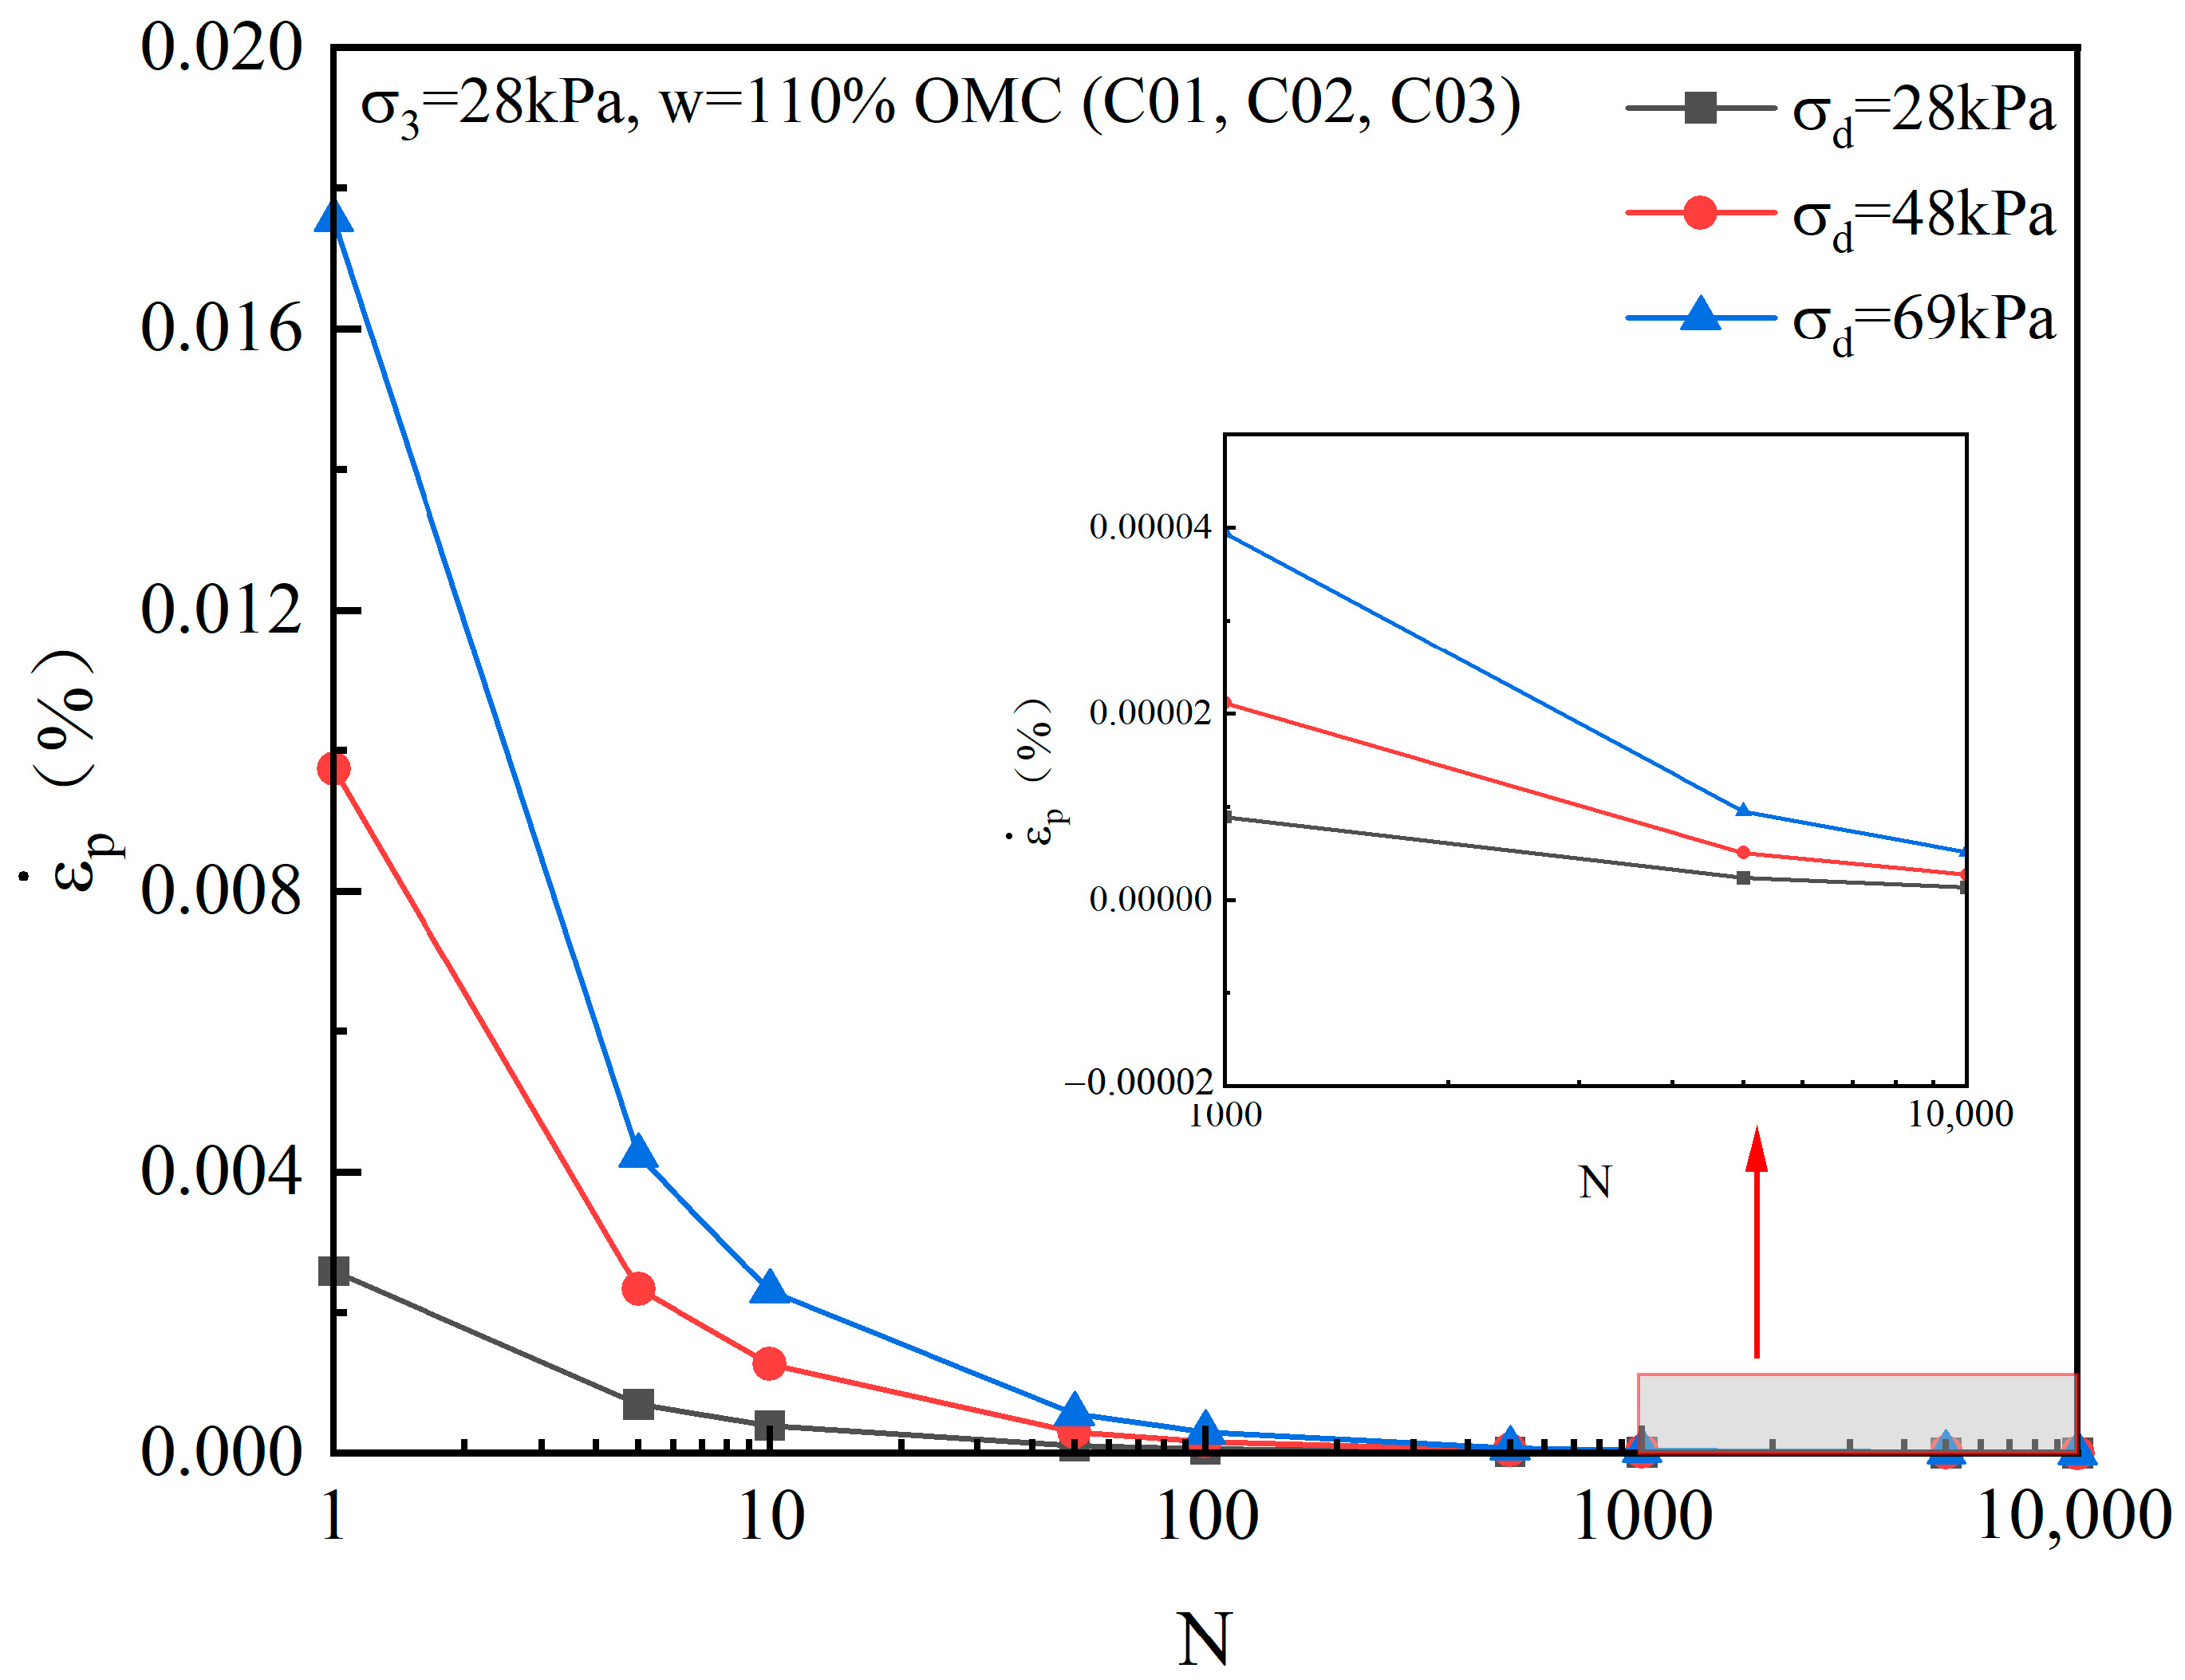
3.2. Effect of Cyclic Deviator Stress

The changes in the axial strain with the number of cycles under different cyclic deviator stresses for specimens with the same moisture content of 110% OMC (C01, C02, C03) are taken as an example to discuss the effect of cyclic deviator stress as shown in Figure 6. As can be seen in Figure 6, the axial permanent strain of the specimen increases, the increasing rate of the permanent strain gradually becomes slower and the dynamic response shows plastic shakedown with the growth of loading cycles under different cyclic deviator stresses. When the cyclic deviator stress becomes larger, the peak stress point of the cyclic stress path becomes closer to the failure point (as shown in Figure 7). Larger plastic strain will be developed during each loading cycle as more soil structure is disrupted and more soil particles are rearranged. This will result in a faster accumulation rate of permanent strain and larger accumulative permanent strain at the same number of cycles. For example, when the cyclic deviator stress increases from 28 kPa to 48 kPa and 69 kPa, the permanent strain after 10,000 cycles increases from 0.0750% to 0.2475% and 0.4475%, respectively, as shown in Table 2. The accumulating rate ( ε p ˙ , which is the change in permanent strain per unit time) of permanent strain increases with the increase in cyclic deviator stress (as shown in Figure 8). The increase in permanent strain shows a linear relationship with the increase in cyclic deviator stress (as shown in Figure 9).

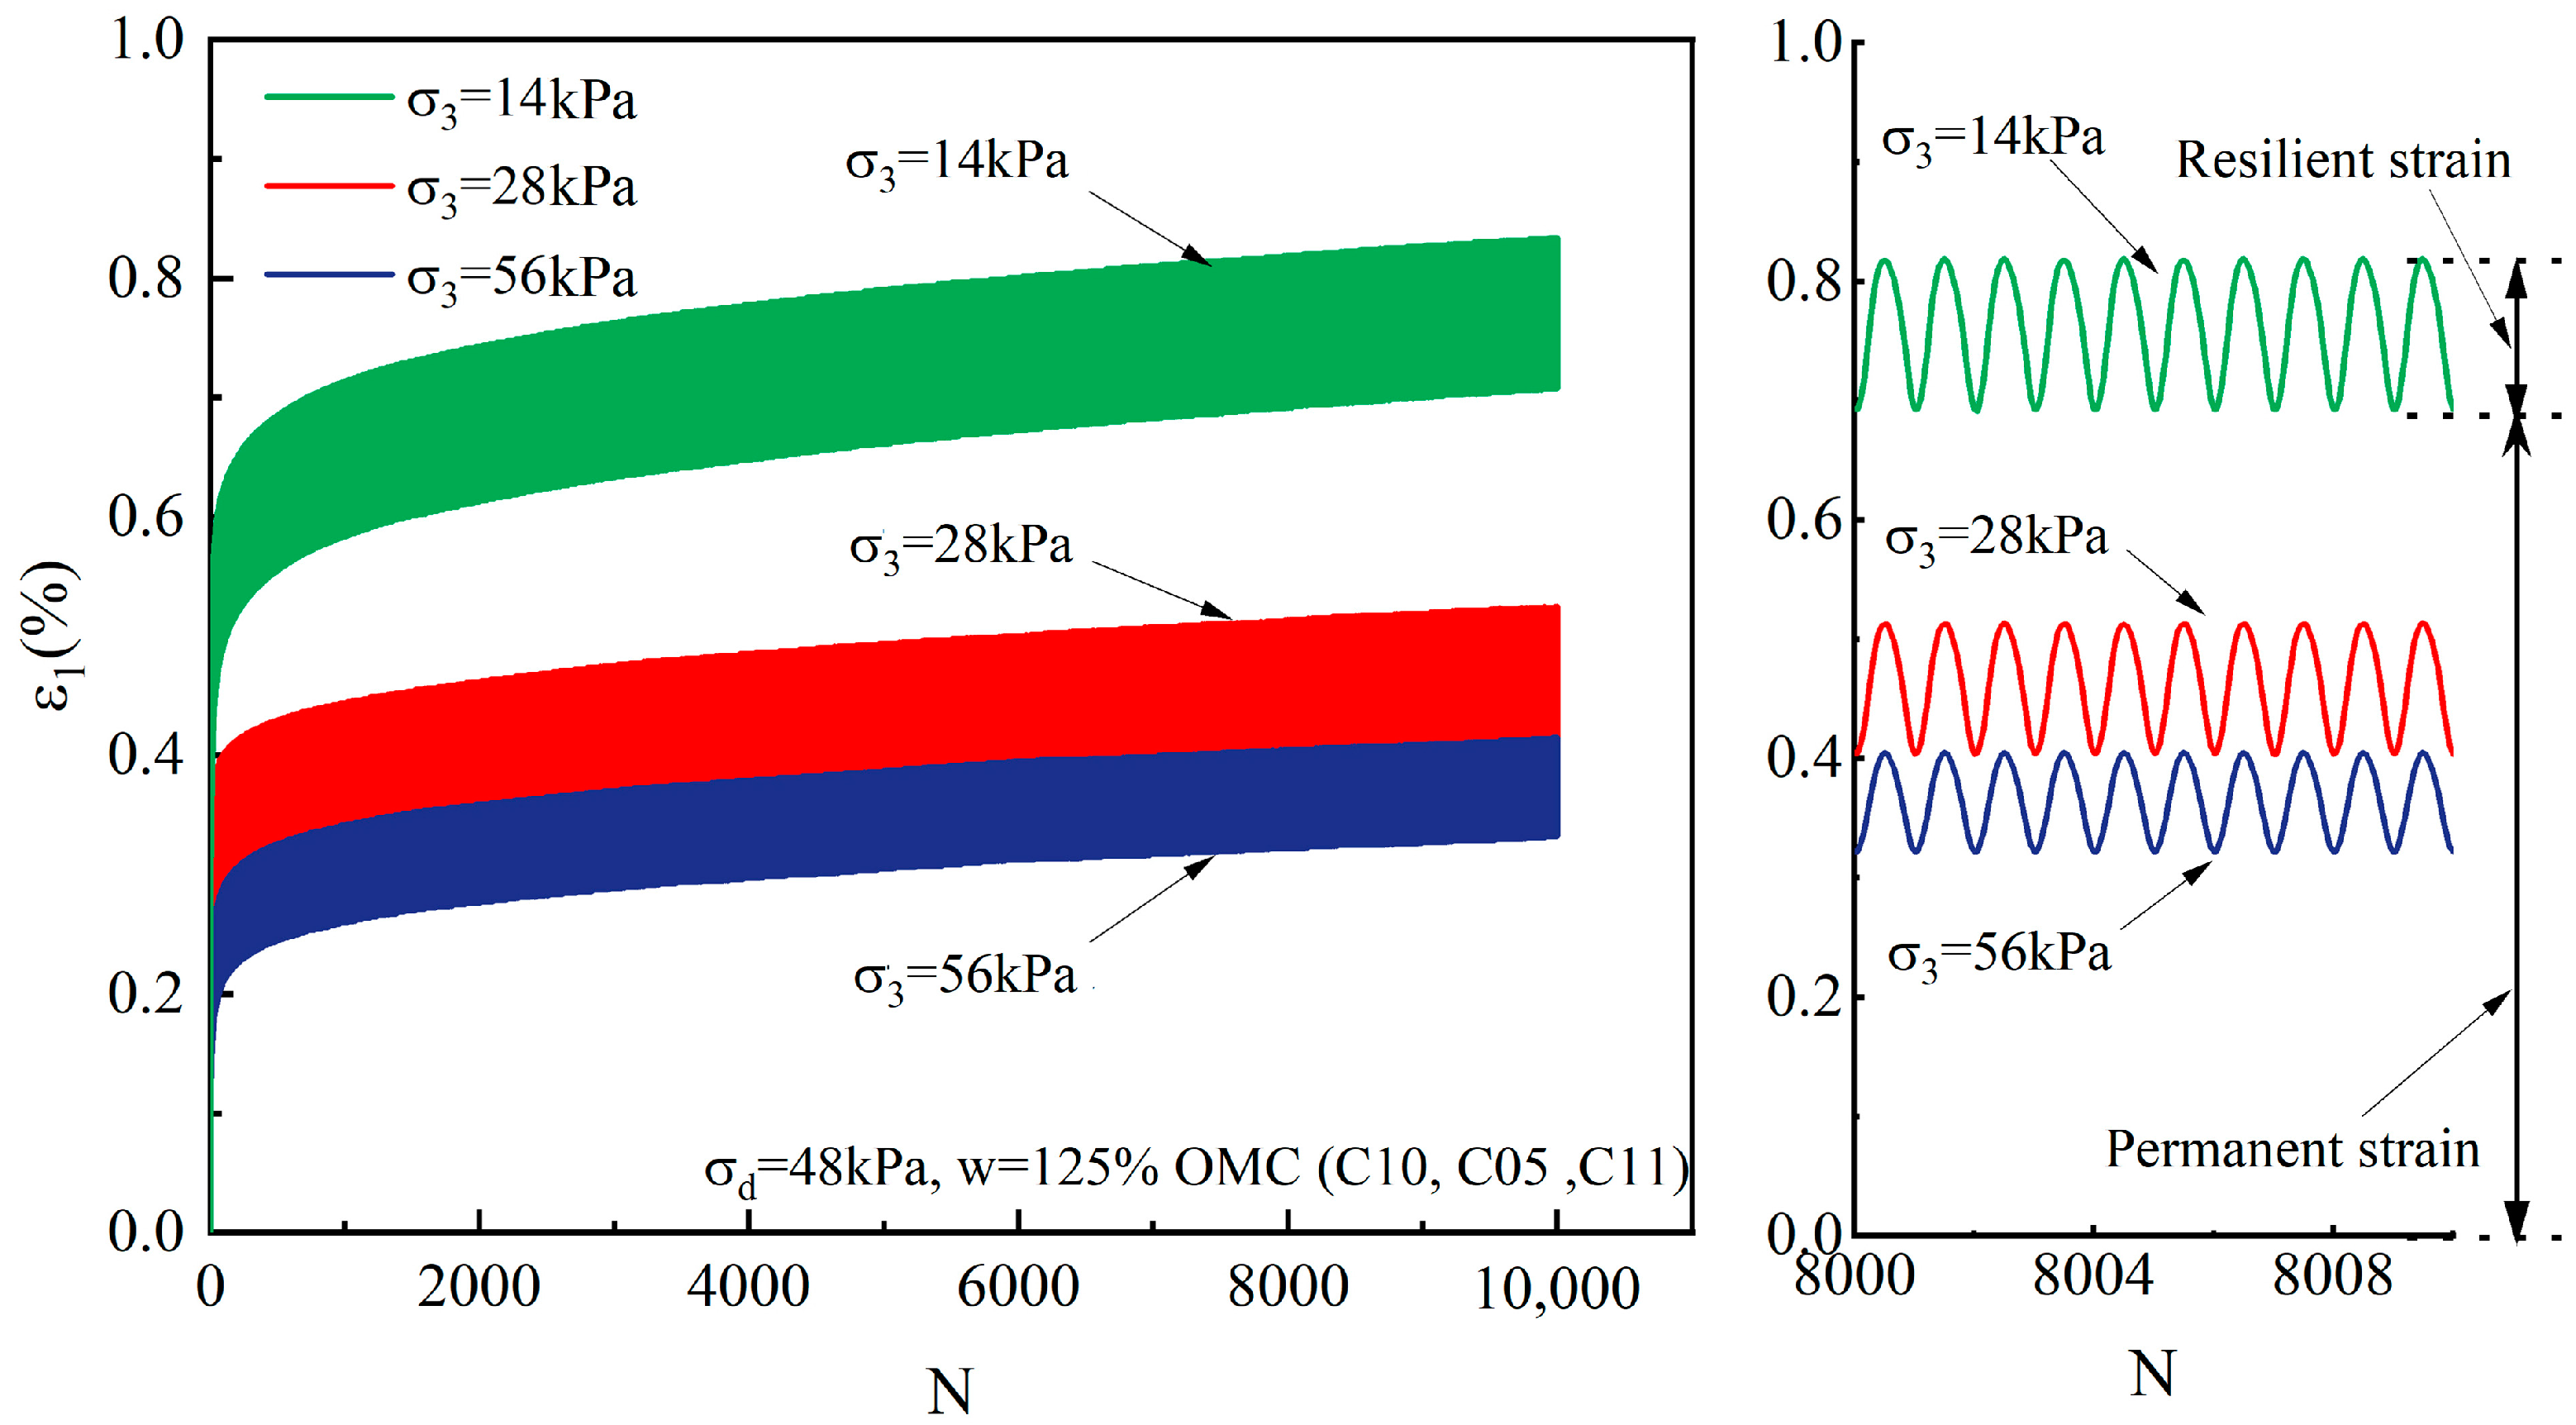
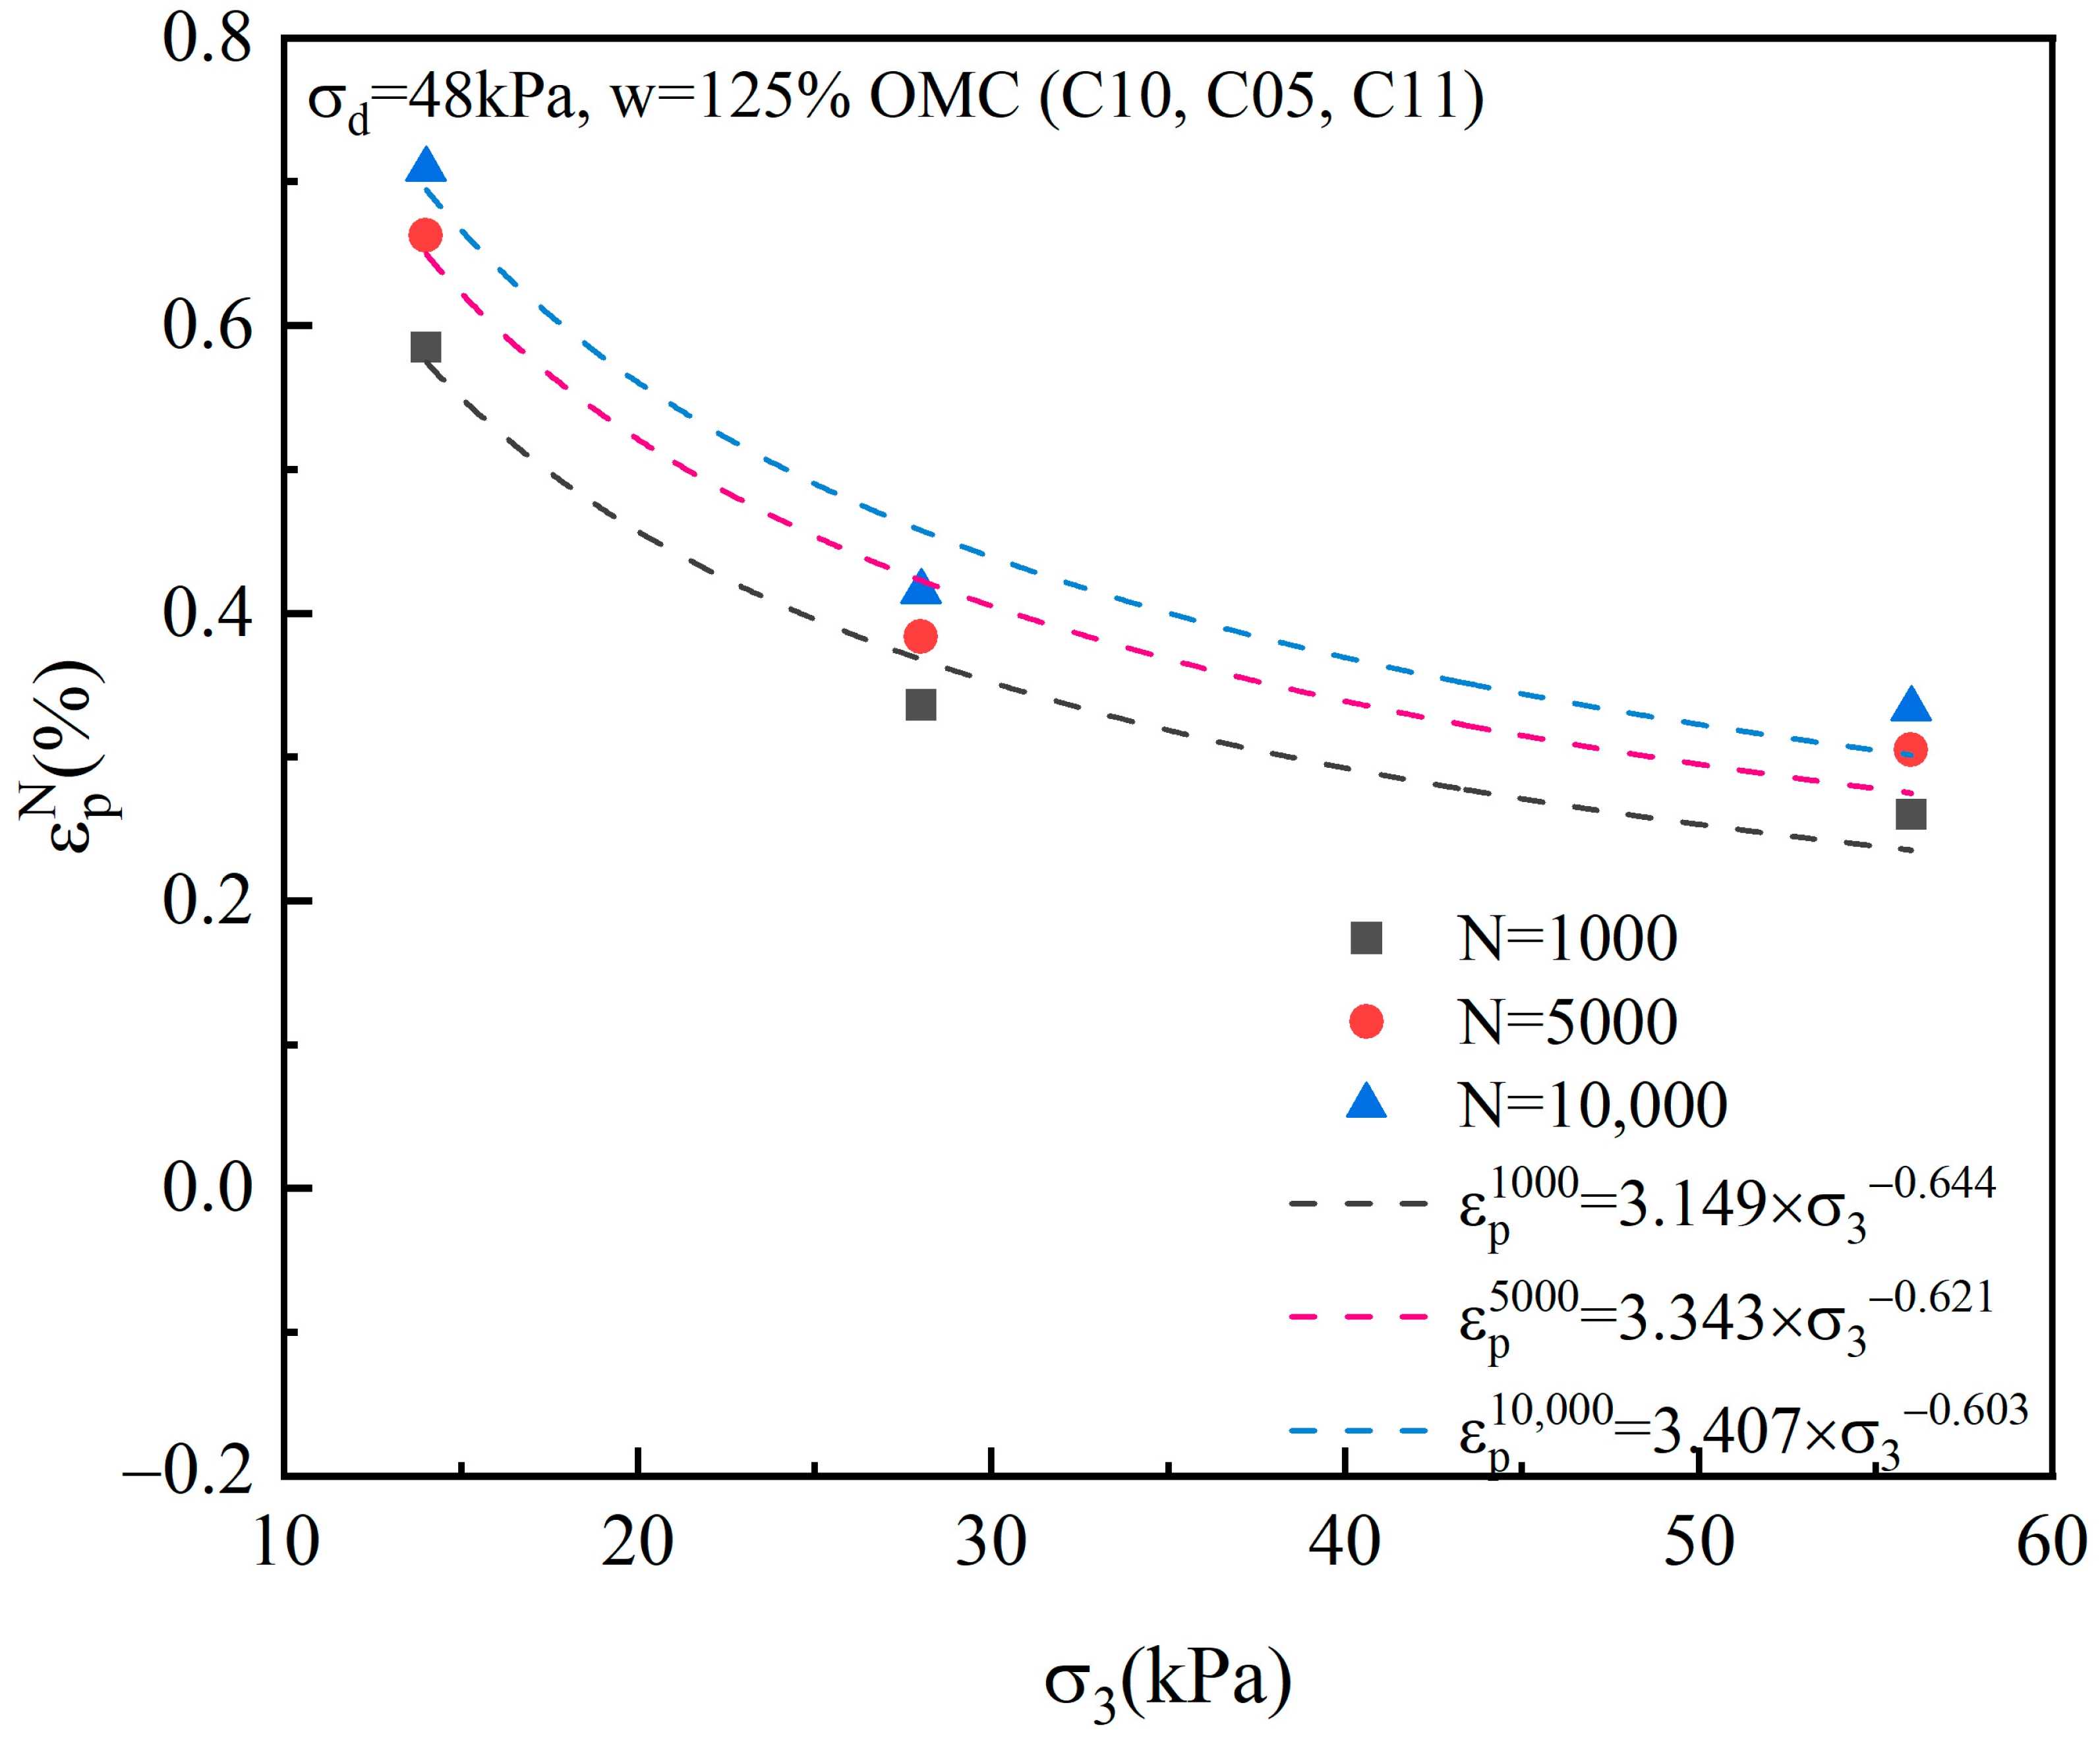
3.3. Effect of Confining Pressure

The influence of confining pressure on the changes in axial strain during cyclic loading is displayed in Figure 10. The test results of C05, C10 and C11 ( w = 125% OMC, σ 3 = 28, 14 and 56 kPa) are taken as an example to discuss. The axial strain of the specimens decreases significantly with the increase in confining pressure as observed in Figure 10. As confining pressure reduces, the distance between the peak point of cyclic stress and the failure envelope becomes closer (as shown in Figure 11) and the specimen fails more easily. Hence, larger plastic strain is formed and accumulated at low confining pressure under the same cyclic deviator stress, as the permanent strain under σ 3 = 14 kPa is 0.7088% at the 10,000th cycle (C10), while the permanent strain increases to 0.3337% under σ 3 = 56 kPa. The accumulating rate of the permanent strain decreases with the increase in confining pressure (as shown in Figure 12). The relationship between the permanent strain and the confining pressure follows a power function (as shown in Figure 13).

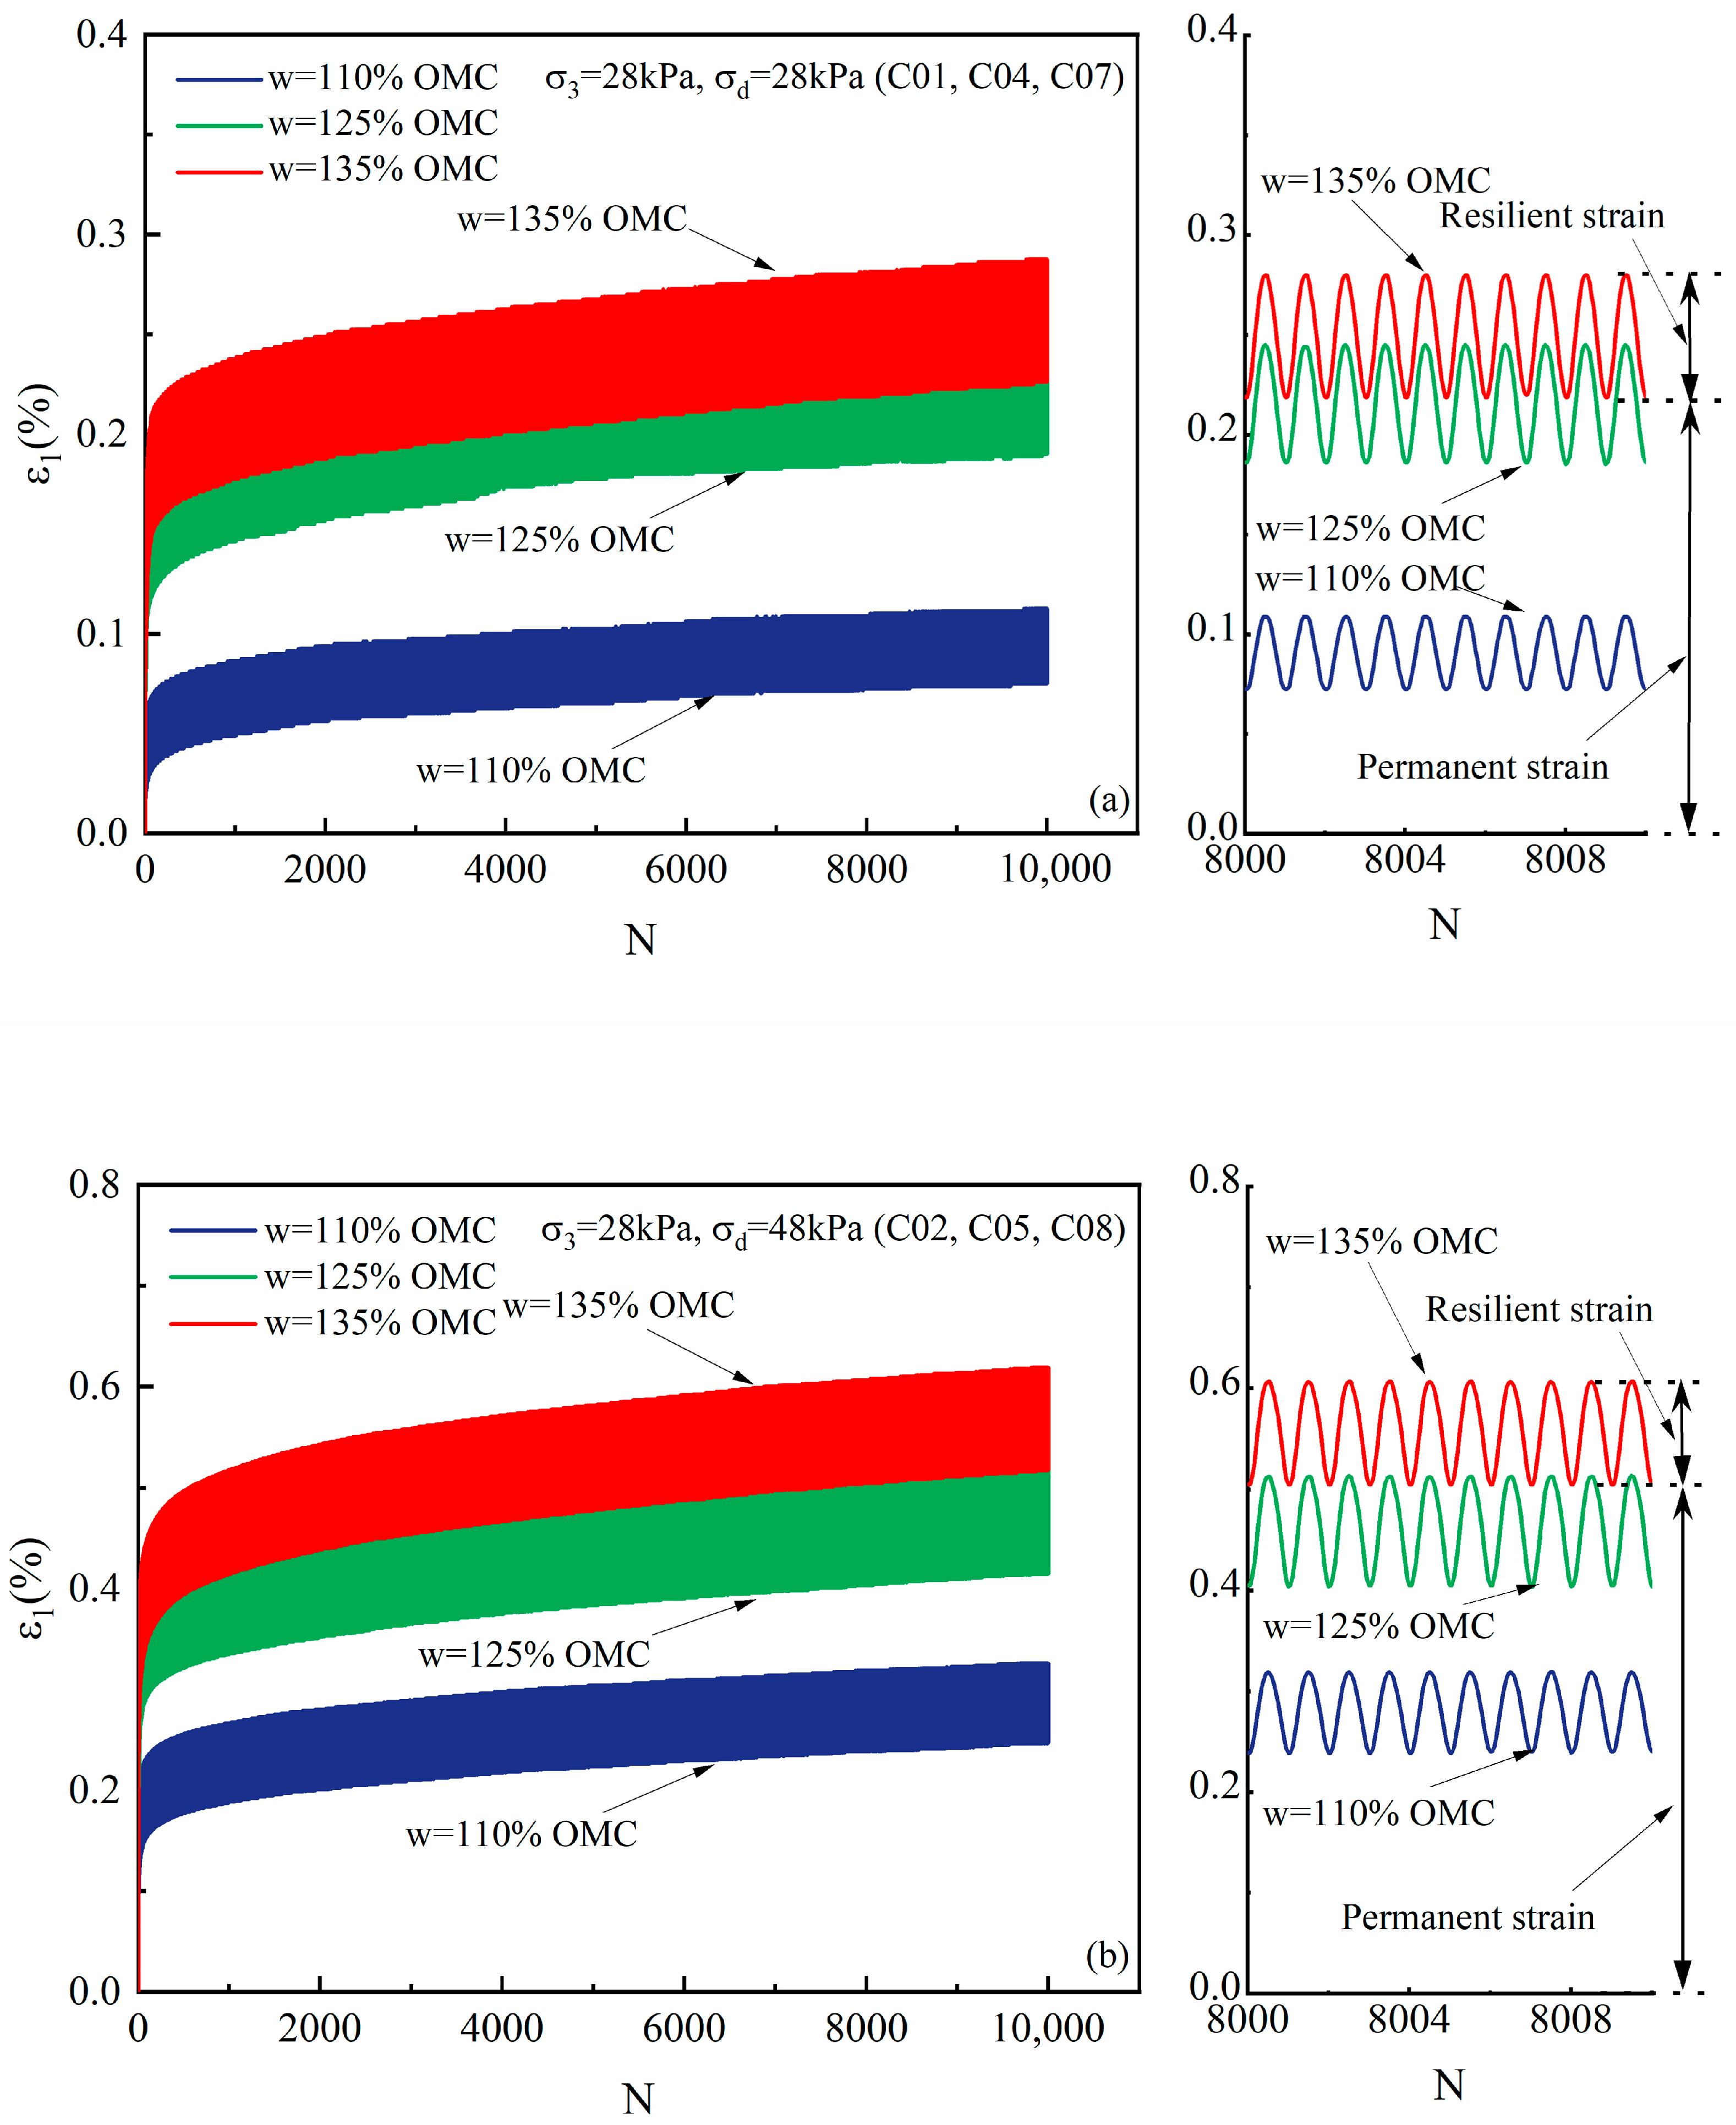
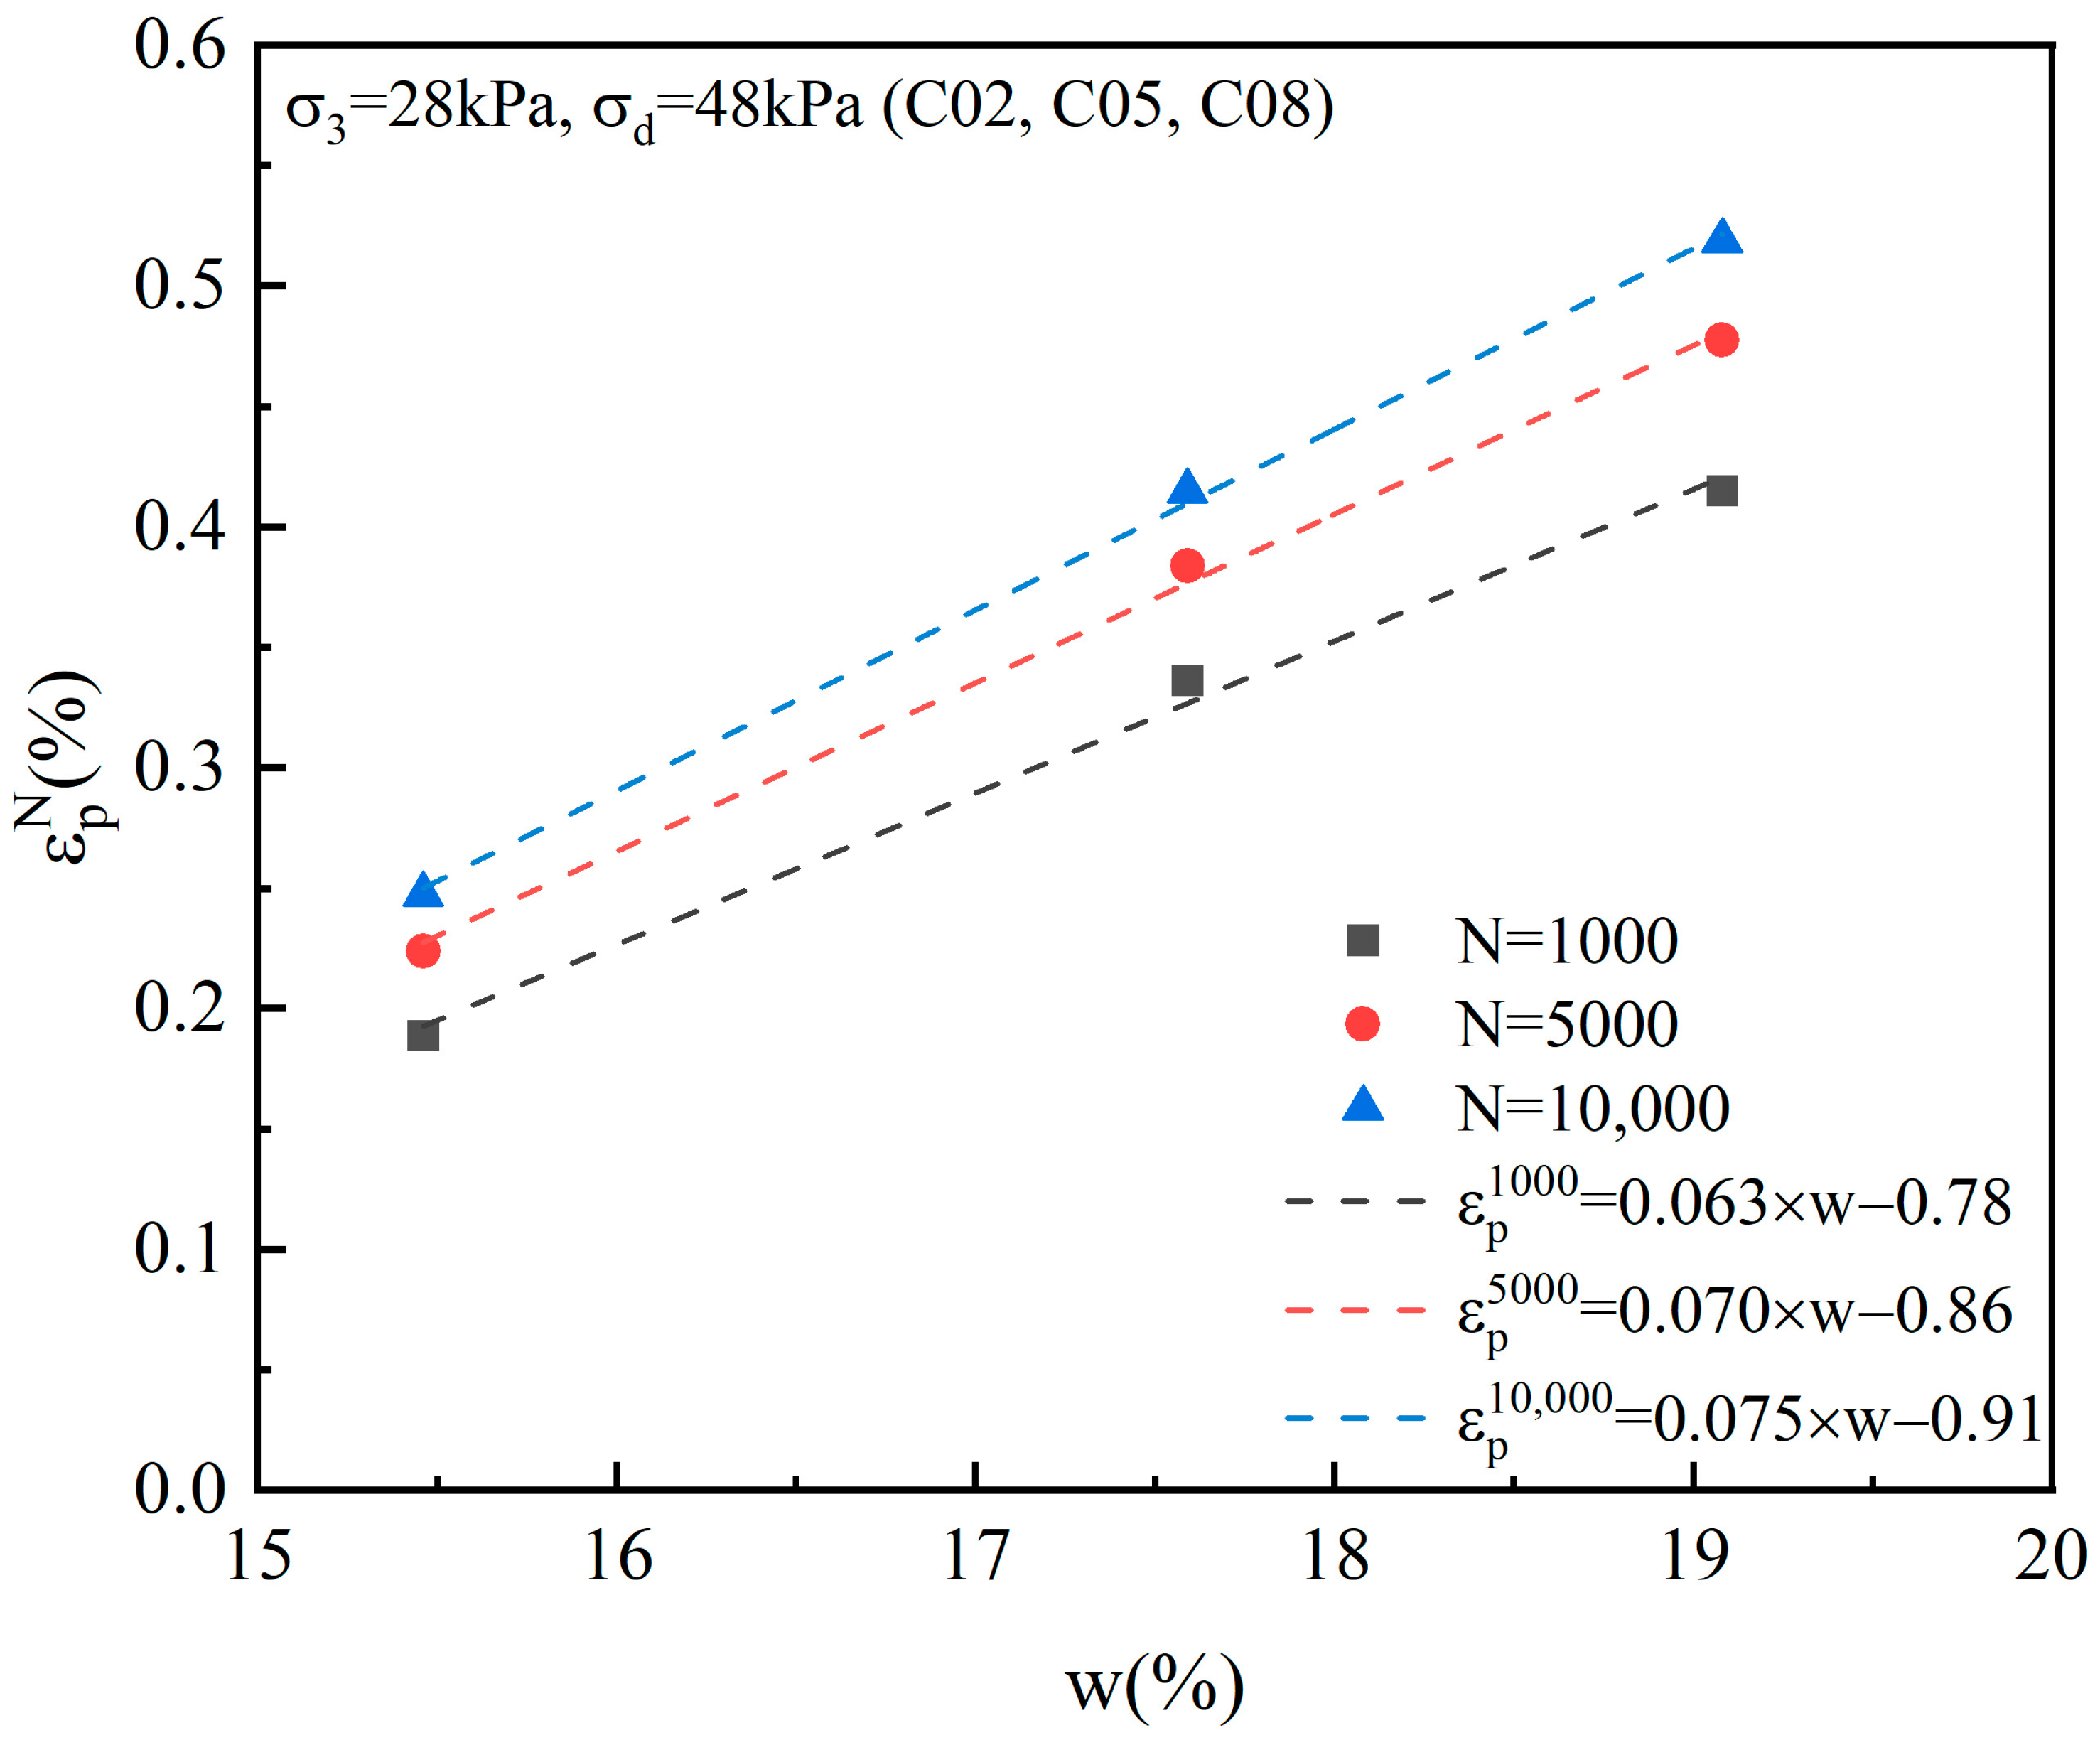
3.4. Effect of Moisture Content

The moisture content has a significant effect on the permanent strain of silt subgrade soil, which increases significantly with the increase in moisture content (as shown in Figure 14a–c). The values of the permanent axial strain at the end of cyclic loading ( N = 10,000) are also shown in Table 2. For example, for samples C01, C04 and C07, when the moisture content increased from 110% OMC to 125% OMC and 135% OMC, the permanent strain after 10,000 cycles of loading rose from 0.0750% to 0.1900% and 0.2262%, respectively. The accumulative rate in permanent strain increases with moisture content as well, as shown in Figure 15. The increase in permanent strain is roughly linearly related to the increase in moisture content (as shown in Figure 16).
The reason that the increasing moisture content leads to a higher accumulative permanent strain can be explained by Figure 17 and Figure 18. The soil–water characteristic curve (SWCC) of alluvial silt obtained by the volumetric pressure plate test is plotted in Figure 17. SWCC defined the relationship between the initial moisture content and the matric suction. In Figure 18, the cyclic stress paths of C02, C05 and C08 are plotted together with the static strength envelope for the specimens with the corresponding moisture contents obtained from monotonic triaxial tests in the p q plane. Table 3 summarizes the results of the monotone triaxial test and SWCC test. As shown in Figure 18, the slope of the static strength of silt is not affected by moisture content, while the intercept of the static strength envelope decreases with the increase in moisture content. This indicates that the decline in static strength is mainly caused by the reduction in cohesion, which can also be seen in Table 3. The cohesion of silt is mainly contributed by matrix suction, which is sensitive to the change in moisture content. When the moisture content increases from 110% OMC to 135% OMC, the matrix suction decreases from 14.11 kPa to 2.36 kPa, which is reduced by 83.3%. The decrease in the cohesion of silt in the p q space is reflected by the decrease in the intercept of the static strength envelope, which makes the distance between the peak point of the cyclic stress path and the strength envelope decrease with the increase in moisture content, and the permanent strain generated by each cyclic loading increases with the increase in moisture content.

4. An Empirical Model for Permanent Axial Strain Prediction

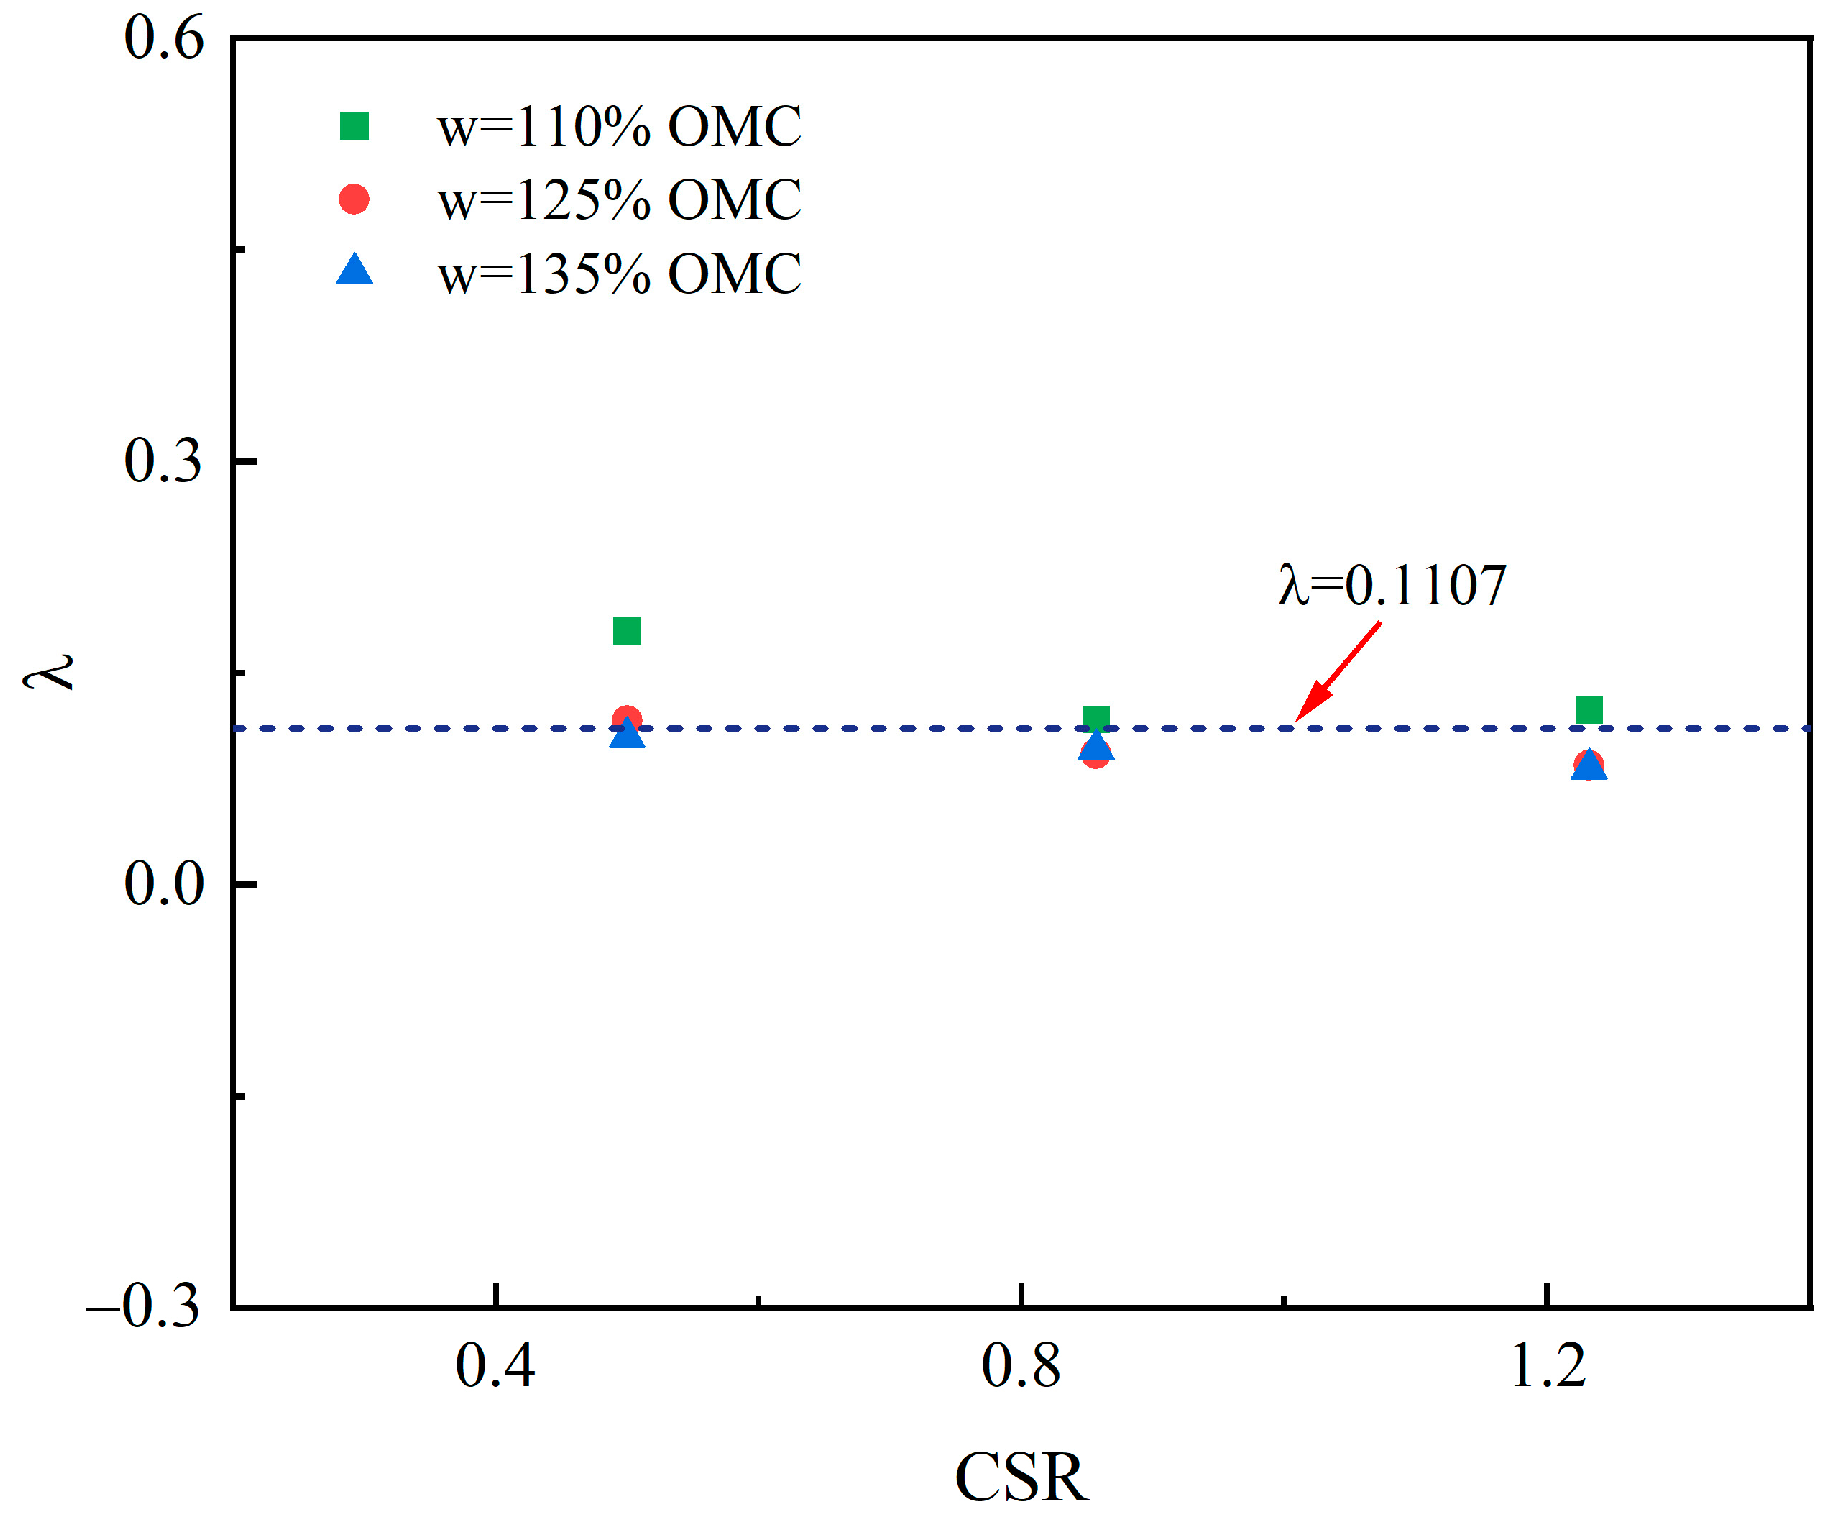
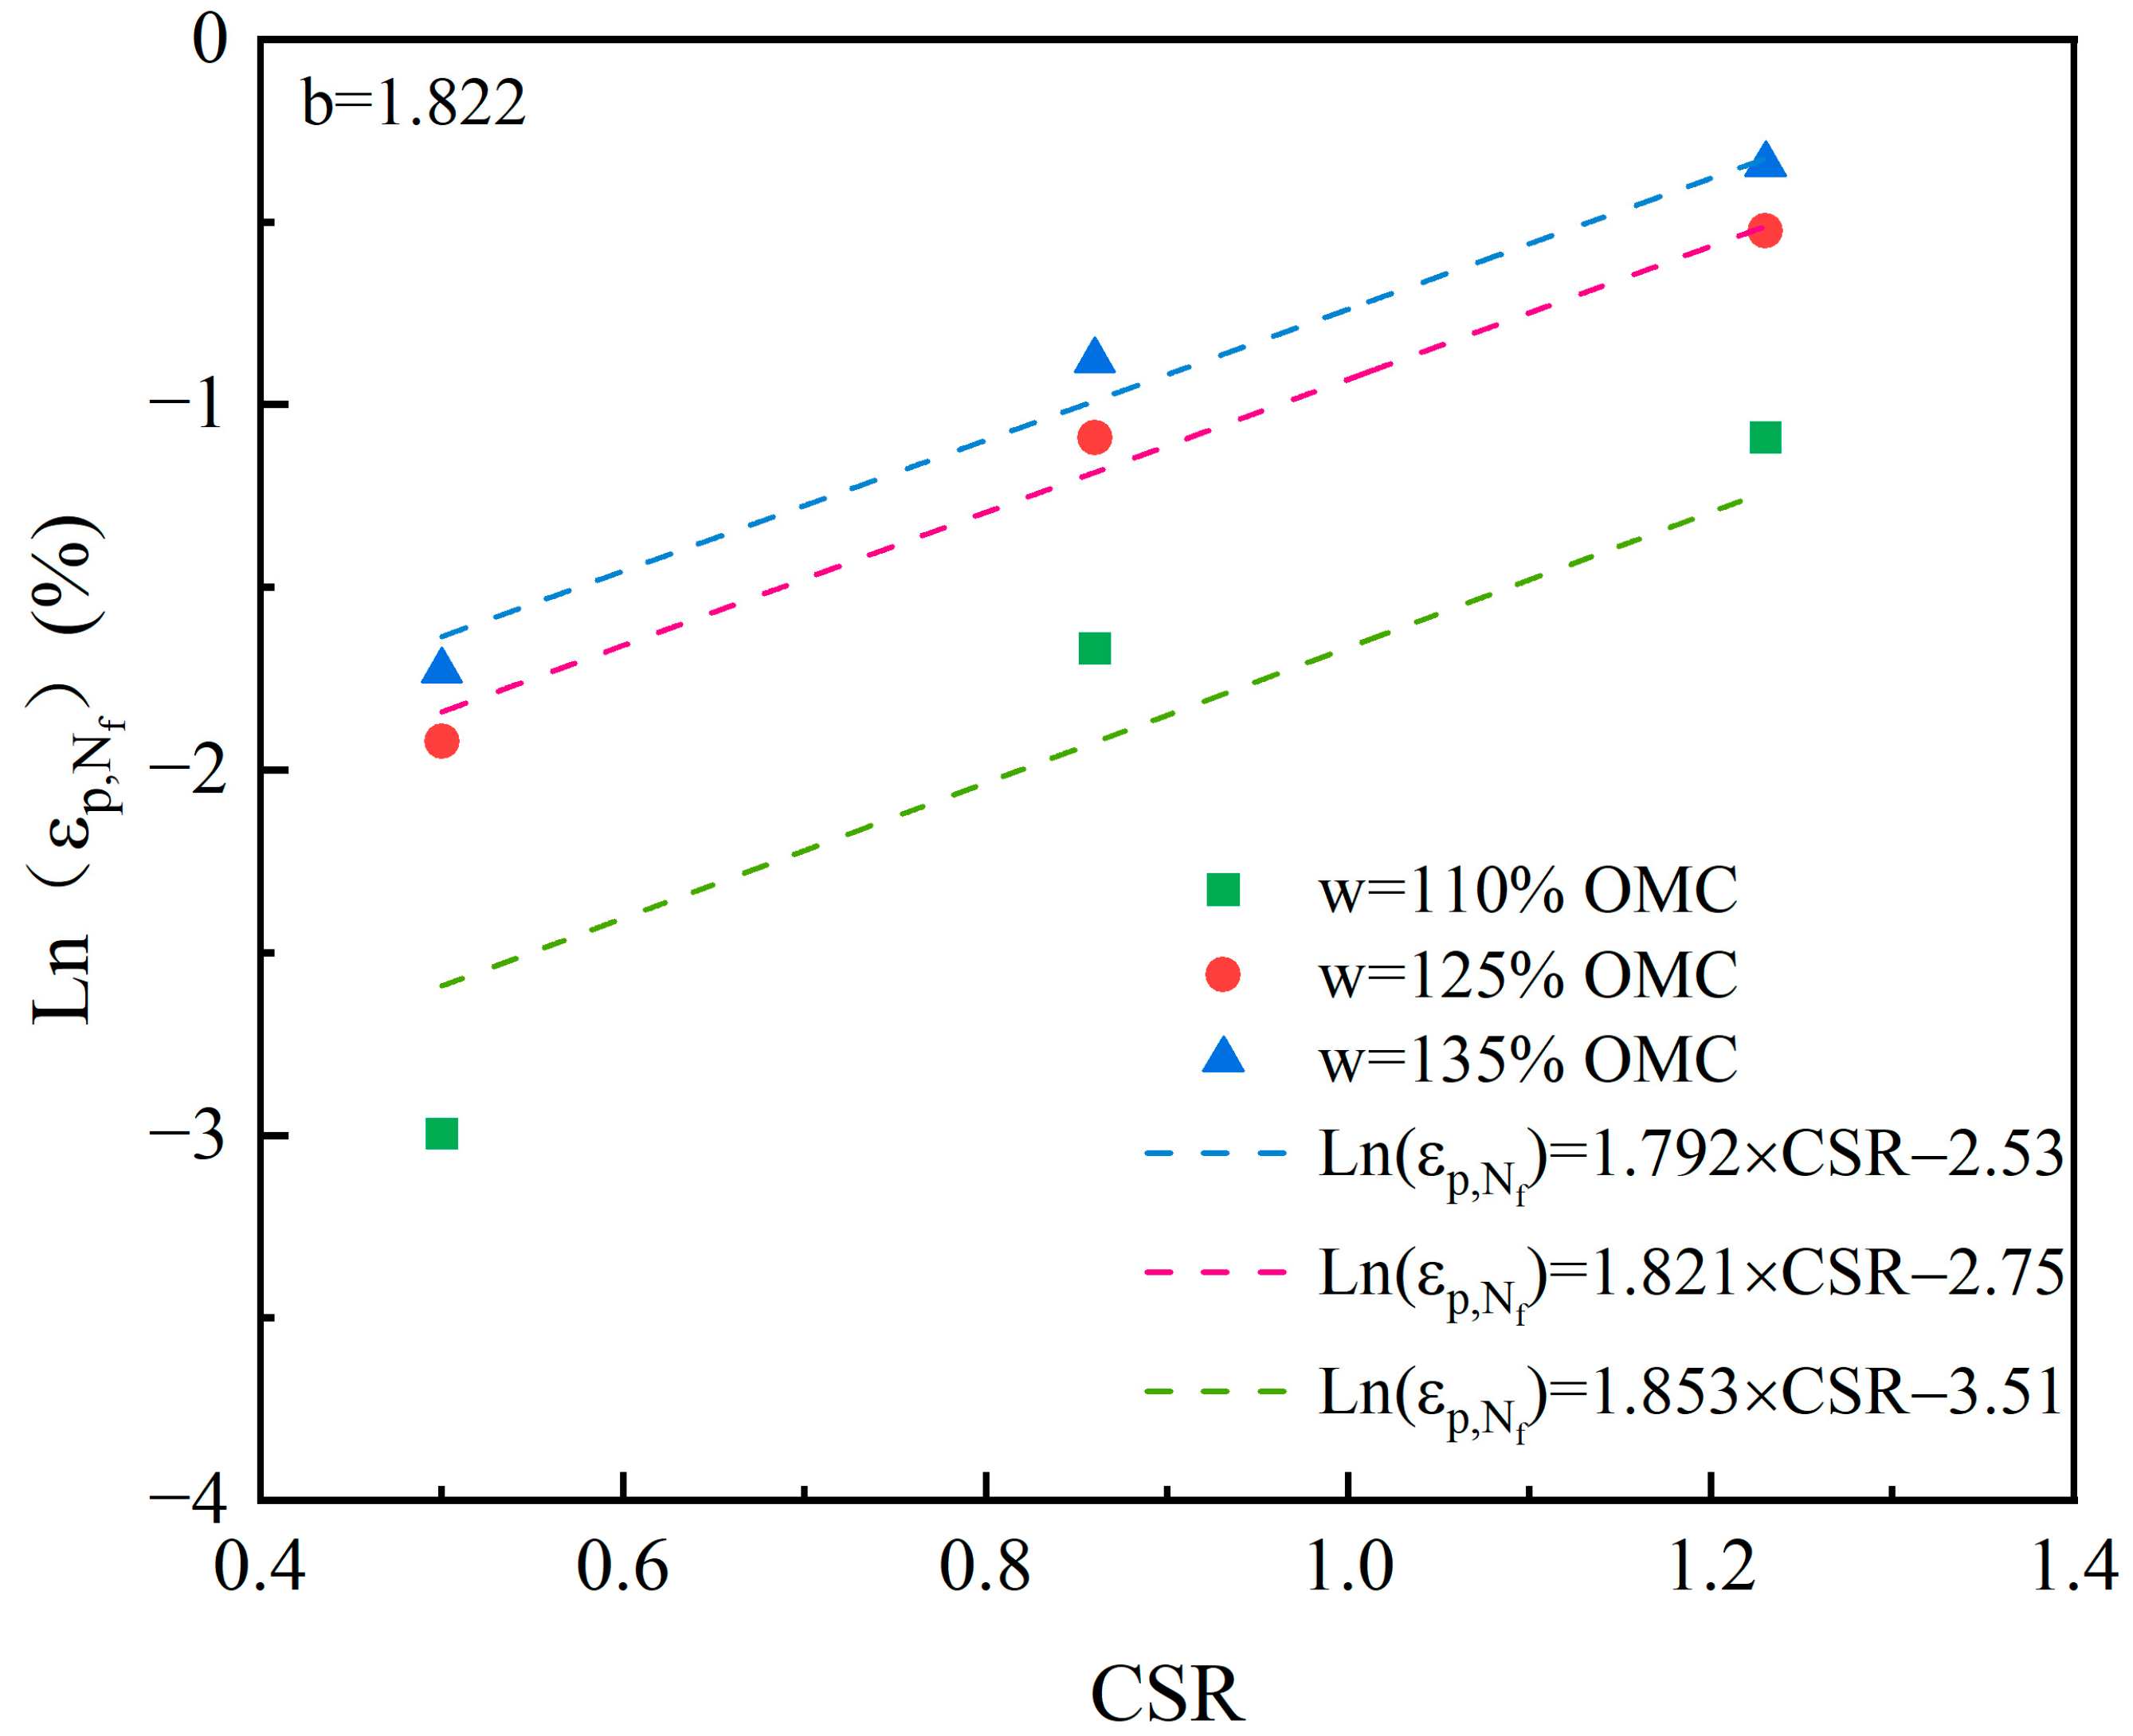
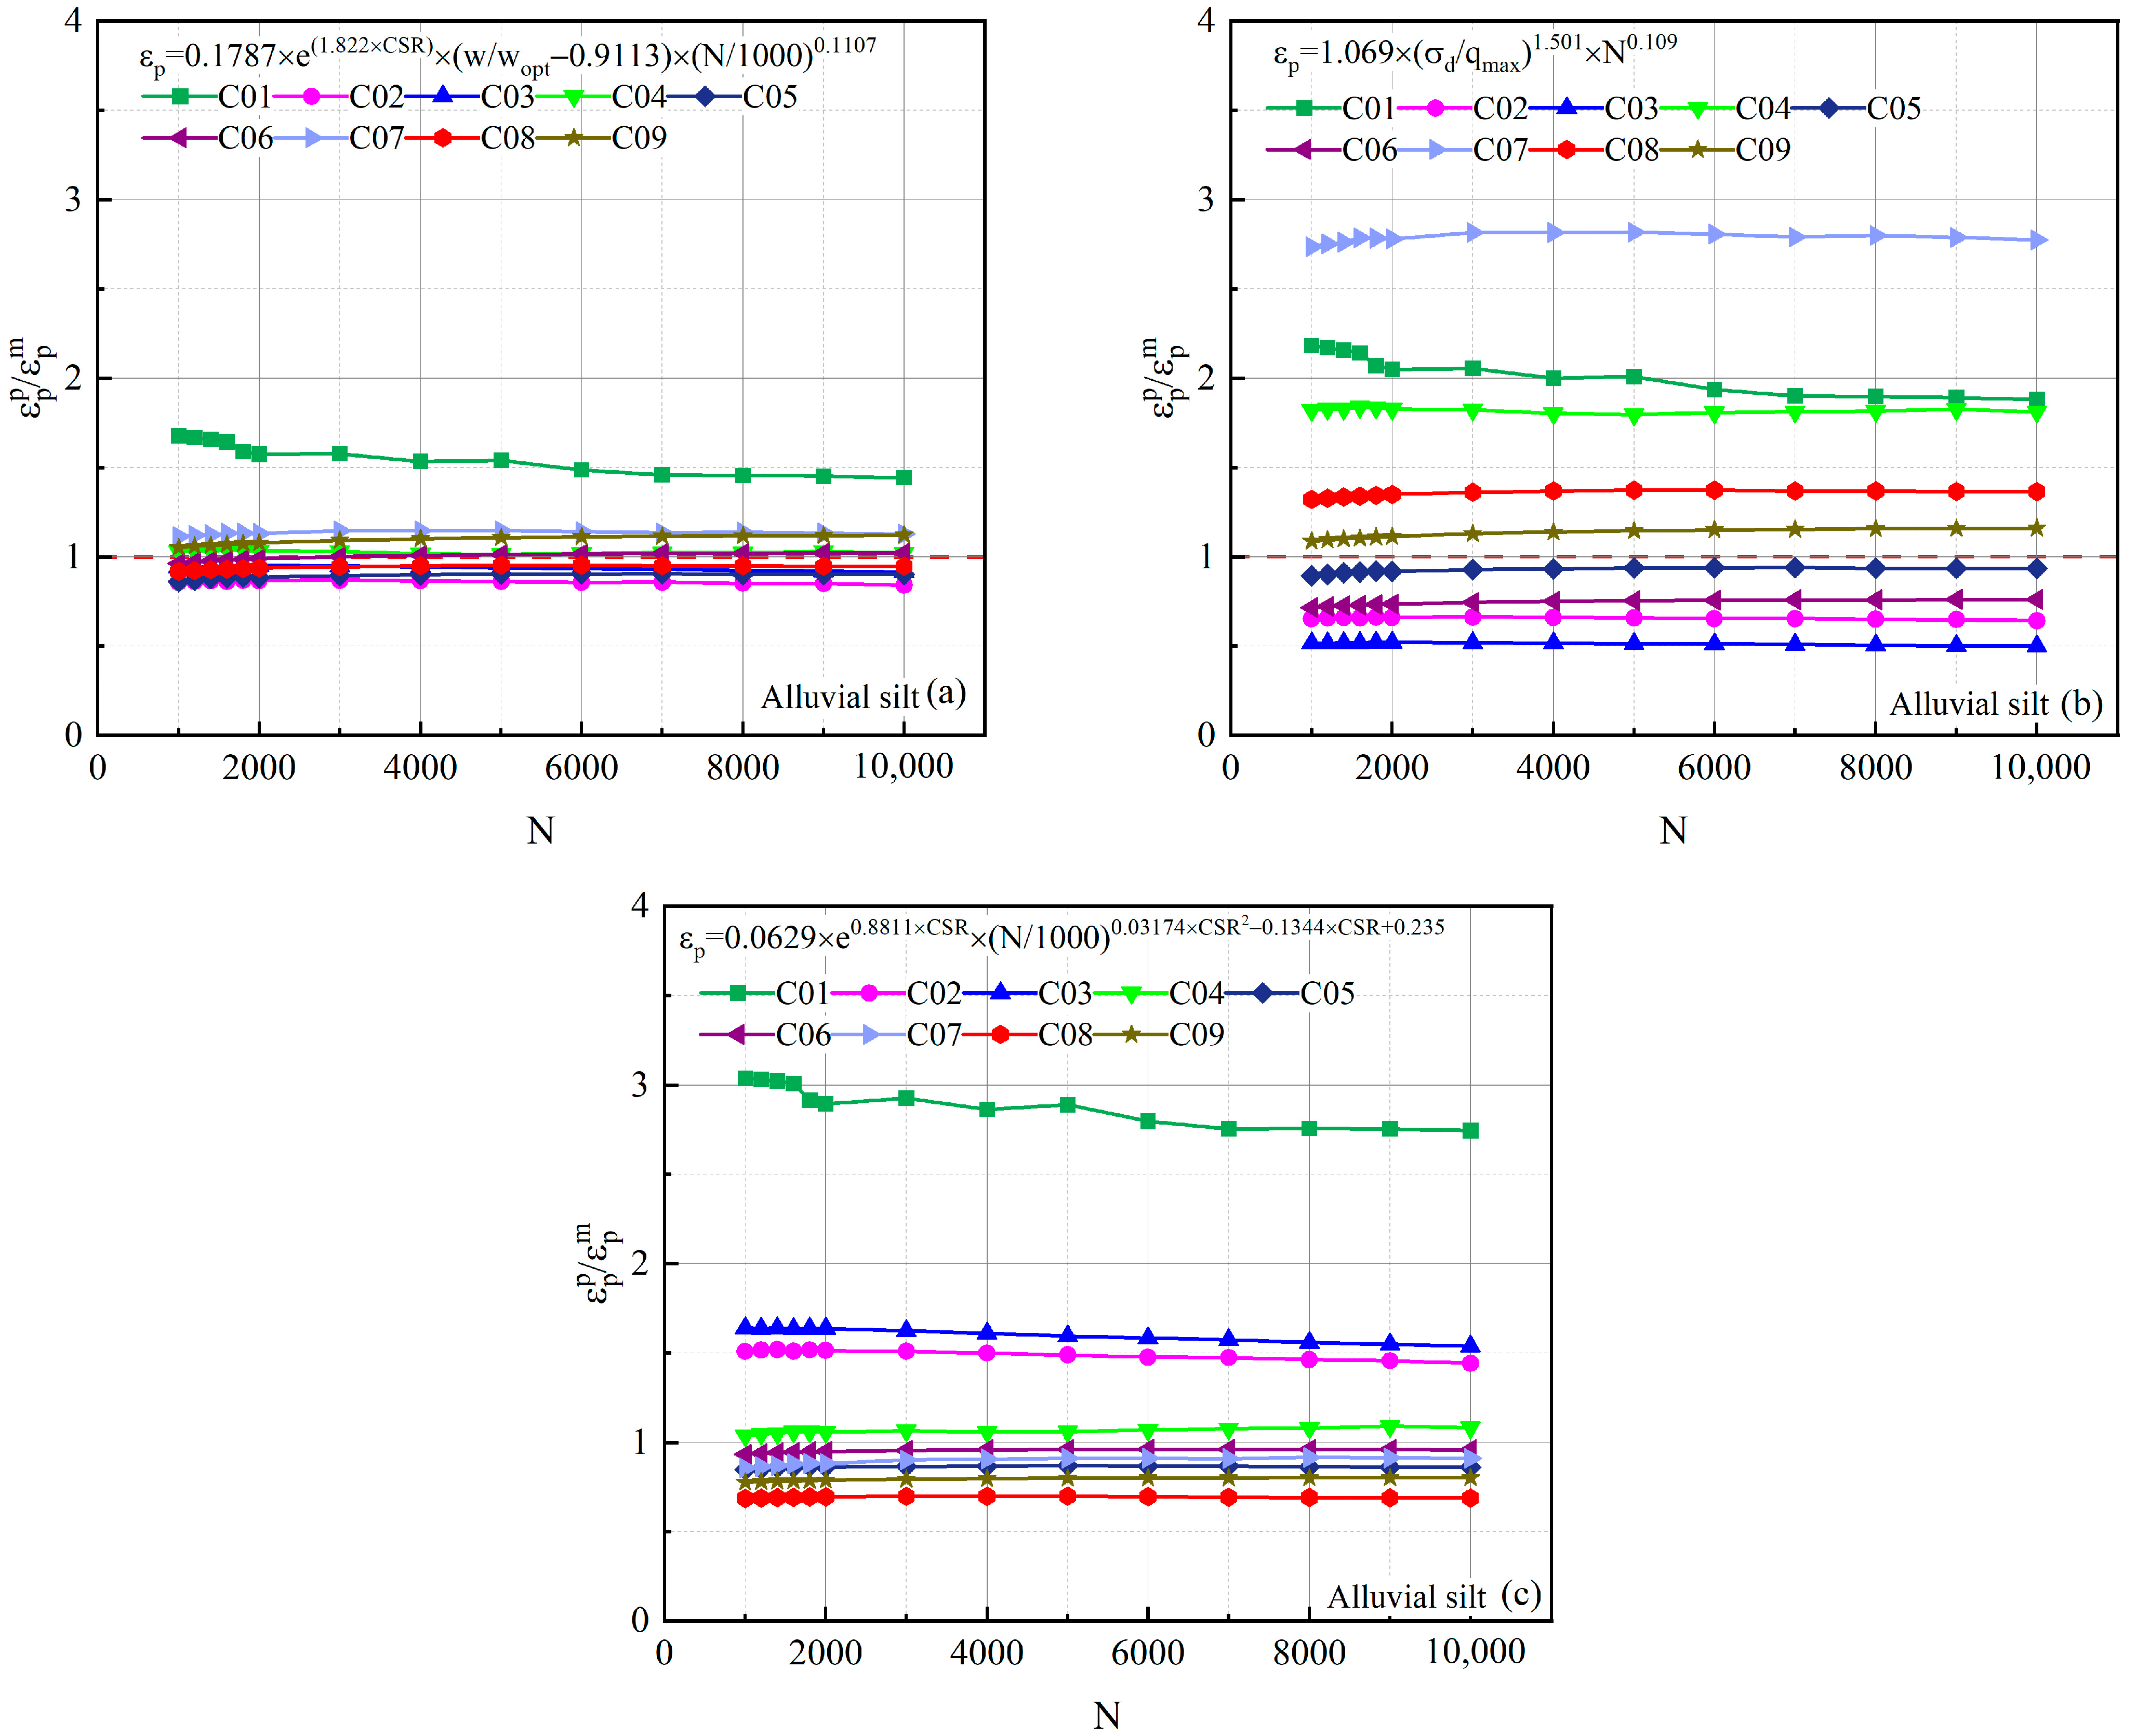
4.1. Empirical Model

Up to now, the relationship between the number of cycles and the permanent strain has been widely studied [12]. Wu et al. [48] found that the linear relationship between l o g   ( ε p ) and l o g   ( N ) was more obvious after the number of reference cycles. Equation (2) was proposed as follows:
log ( ε p ) = log ( ε p , N f ) + λ log ( N N f )
where N f is the reference number of cycles, ε p , N f is the permanent strain under the reference number of cycles, and λ is the slope of the calibration line from the number of reference cycles to the end of loading ( N = 10,000 ) in the log ε p l o g   ( N ) coordinate system. Equation (2) can be rewritten as follows:
ε p = ε p , N f ( N N f ) λ
As the prediction of Equation (3) is in good agreement with the experimental data, it is widely used to predict the permanent strain of soil under cyclic loading. Figure 19 shows the development trend of permanent strain with the increasing number of cycles of specimens C01–C09 in a double logarithm coordinate. The results show that the log ε p l o g   ( N ) is more conformed to a linear relationship when the number of cycles exceeds 1000. Thus, the reference cycle number N f is determined as 1000 in this paper. Figure 20 shows the slopes λ for different moisture contents and CSRs. The values of the slopes of the calibration lines are essentially equal, indicating that there is no correlation between λ and moisture content and CSR, which is consistent with the conclusions of other researchers [18,35]. Therefore, the slope λ in Equation (3) is only related to the soil type. The average value of λ = 0.1107 was used for predicting the permanent strain of alluvial silt in this study.
As discussed in Section 3, the permanent strain at reference number of cycles is closely related to moisture content and CSR. Guo et al. [20] found that there is an exponential relationship between permanent strain and CSR at the reference cycle number, as shown in Equation (4). In order to reflect the effect of moisture content on permanent strain, Equation (5) can be used to establish the relationship between ε p , 1000 , CSR, and w as follows:
ε p , 1000 = a e b C S R
ε p , 1000 = a ( e b C S R ) ( w w o p t c )
where a , b , c are model parameters, w o p t is the optimal moisture content and ε p , 1000 is the permanent strain at the reference number of cycles ( N = 1000 ).
Figure 21 shows the relationship between l n ε p , 1000 and CSR, and the test results under different moisture contents can be fitted by linear functions. The slope of the fitted straight line is almost identical. Therefore, the value of parameter b in the predictive model can be determined as the average value of the slopes. Figure 22 shows the relationship between ε p , 1000 and w / w o p t , and the relationship between the two variables under different CSR can also be described by a linear function. The value of parameter c in the prediction model can be determined based on the fitting function. Based on the determined values of parameters b and c , parameter a can be determined through regression analysis, as shown in Figure 22. Combined with the Equations (3) and (5), Equation (6) is obtained. The empirical model can comprehensively consider the influence of moisture content and CSR on permanent strain, and the parameter values are a = 0.1787, b = 0.9113, c = 1.822 and λ = 0.1107.
ε p = 0.1787 ( e 1.822 C S R ) ( w w o p t 0.9113 ) ( N 1000 ) 0.1107
Figure 23 compares the prediction performance of the proposed model with the experimental data, which shows a high degree of agreement. It shows that the model proposed in this paper can accurately predict the development of permanent strain during the whole cyclic loading process. This model has only four parameters, which have clear physical meanings and are easily determined.

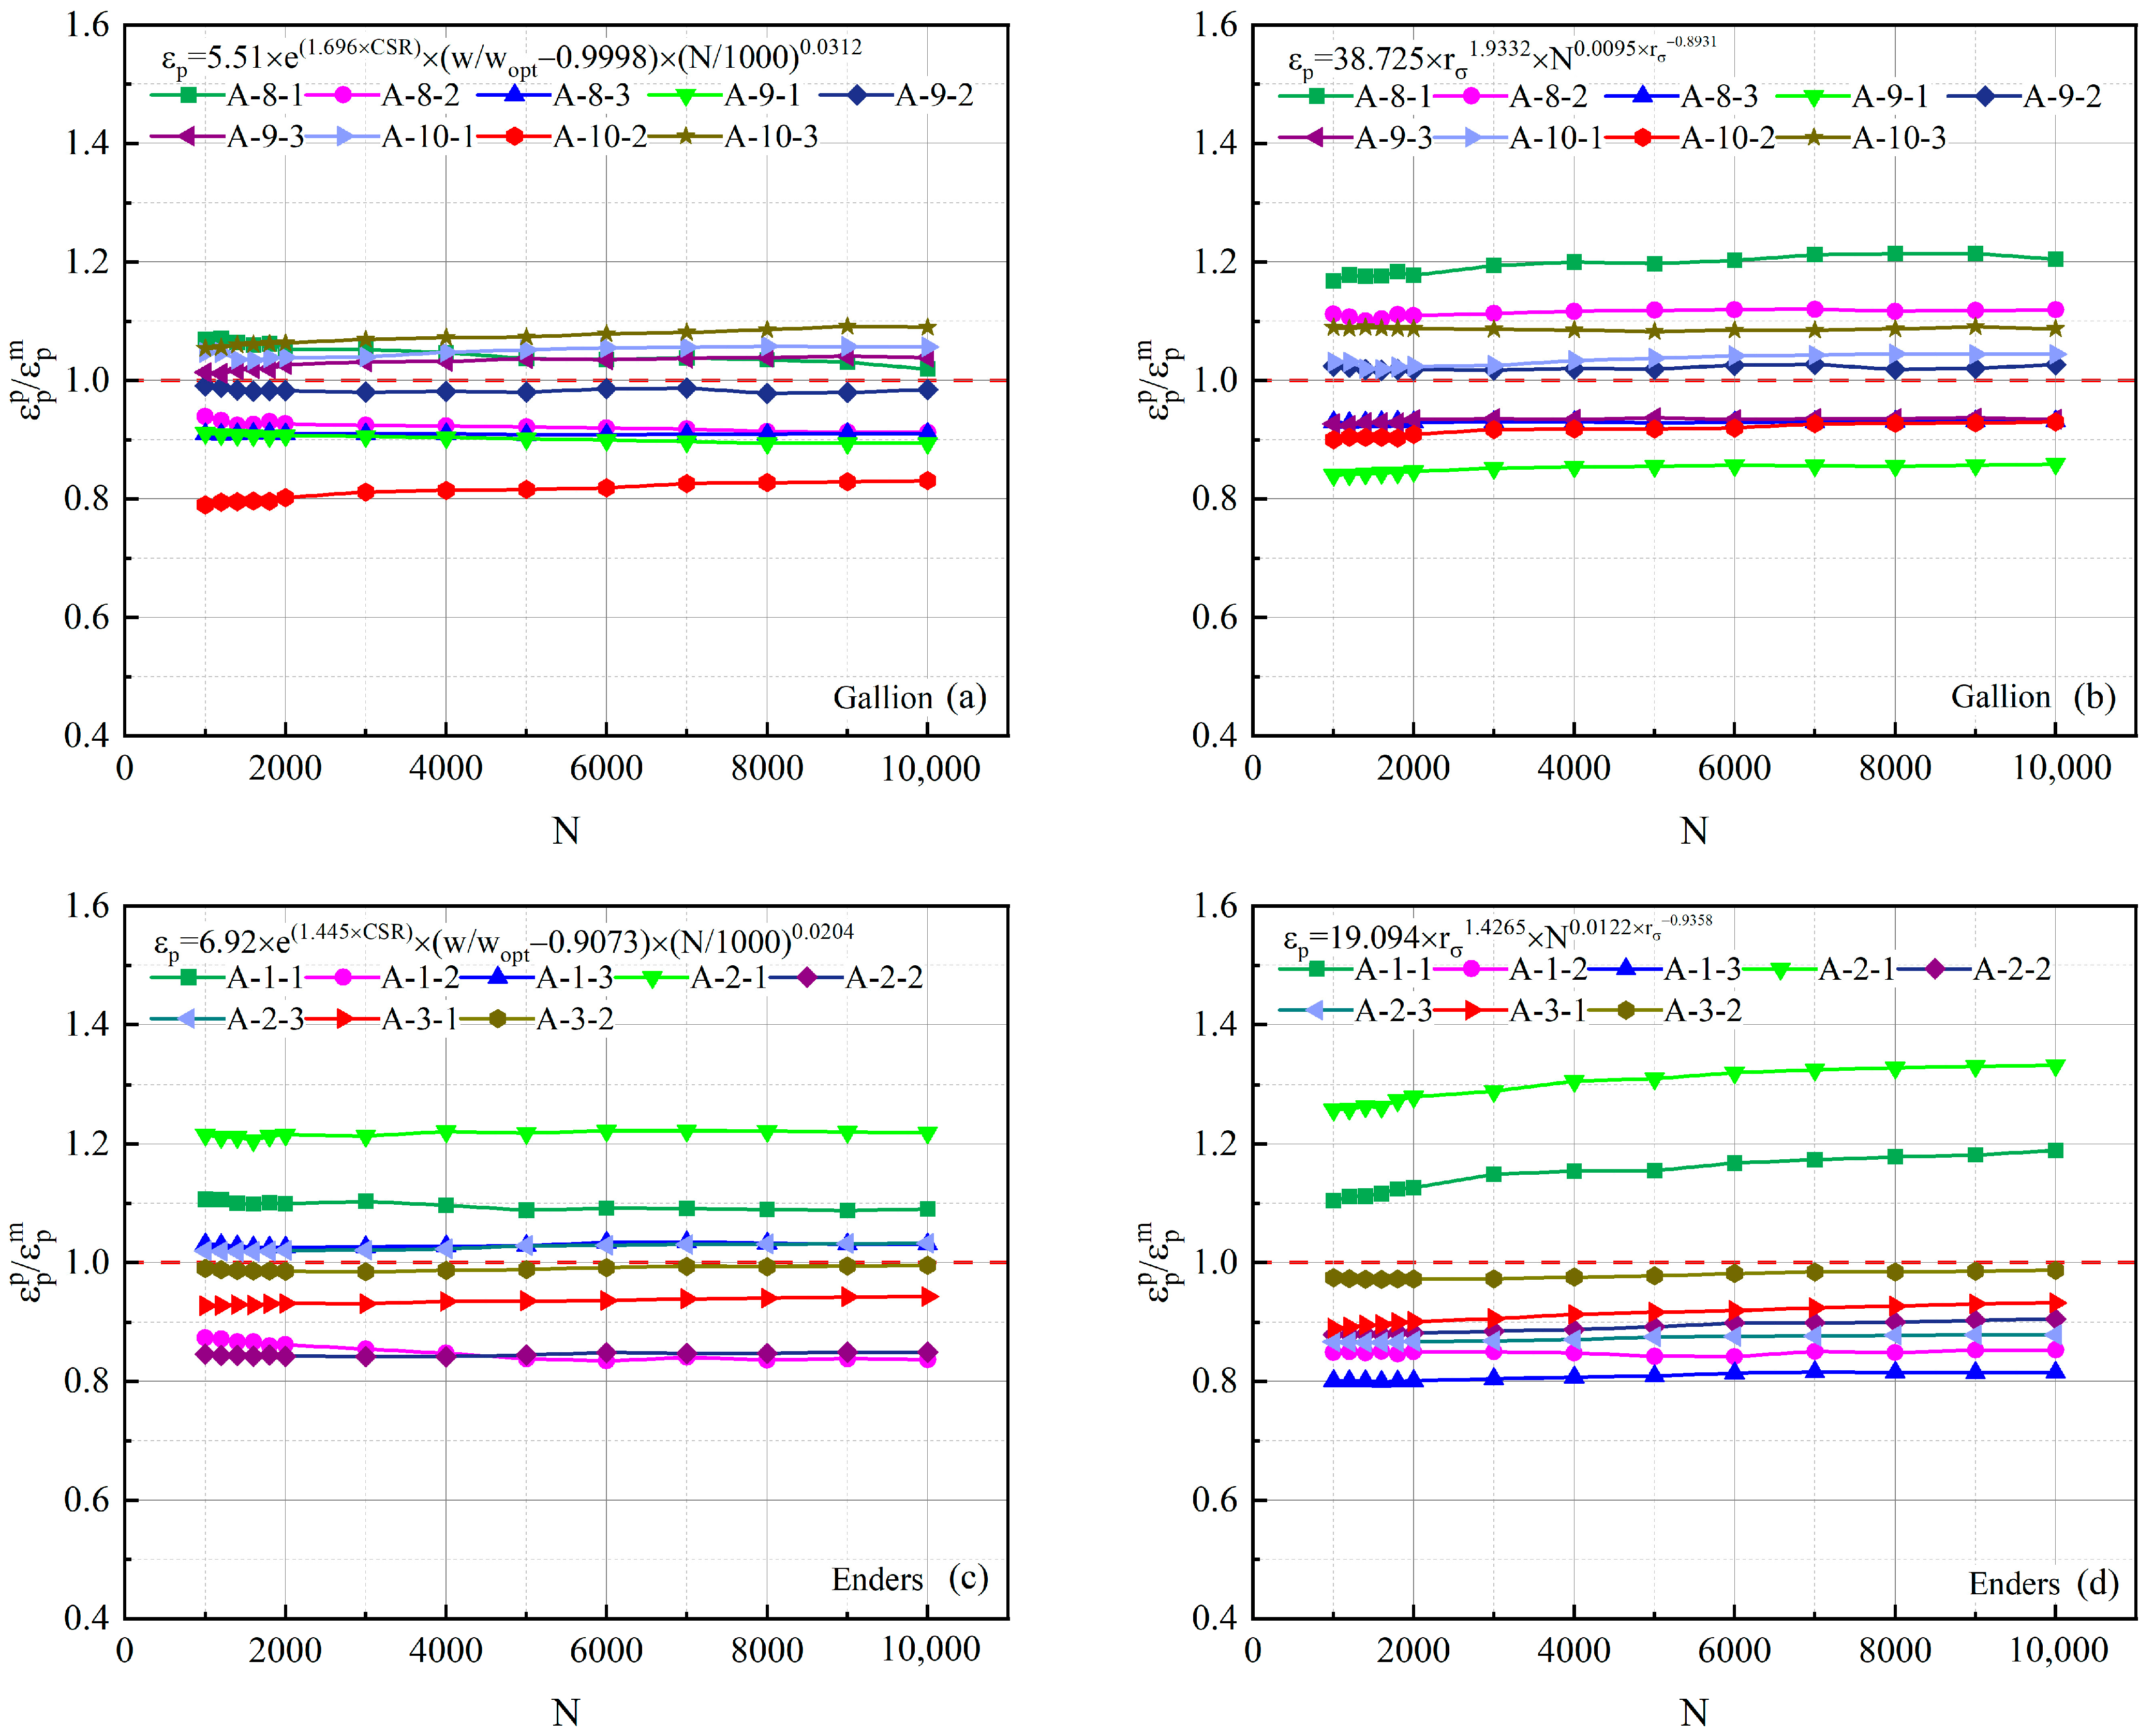
4.2. Verification of the Empirical Model

To verify the accuracy of the proposed model, the prediction results of Equation (6) and Xiao’s model [35] and H. Jamali’s model [21] are compared with the experimental data in Figure 24, respectively. As observed in Figure 24a, most of the ratios of predicted values of Equation (6) to the measured values fall within the range of 0.8 to 1.6. It should be noted that since the permanent strain generated by C01 during the test (less than 0.01%) is small, a slight prediction error will cause a large difference between the predicted value and the measured value. As shown in Figure 24b, Xiao’s model considers the effect of moisture content on permanent deformation by introducing the static strength parameter q m a x . However, the static strength of soil is not only related to moisture content, but also related to physical properties such as compactness and particle size composition, so it cannot accurately reflect the contribution of moisture content to permanent deformation. In addition, Xiao’s model requires a large amount of test data to fit the model parameters, which makes the physical meaning of the model parameters unclear. When calculating q m a x , an additional monotonic triaxial test is required, which makes the calculation process more complicated. In contrast, the prediction accuracy of Xiao’s model is not as high as that of Equation (6), and the ratio of the predicted value to the measured value mostly falls in the range of 0.4 to 2.8. As shown in Figure 24c, H. Jamali’s model only considers the effect of CSR on permanent deformation. Therefore, for the test results with different moisture contents and the same CSR, the predicted values calculated by H. Jamali’s model are the same. Therefore, the predicted value of H. Jamali’s model for the test results with lower moisture contents is too large, and the predicted value of the test results with higher moisture contents is too small, which is inconsistent with the actual situation. In contrast, the ratio of the predicted value to the measured value of H. Jamali’s model mostly falls in the range of 0.6 to 3.0, and the prediction effect is also not as good as the model in this paper.
In addition, it can be seen from Table 4 that the maximum error of the prediction results of the Xiao’s model is 172.5%, the average error is ±57.4%, the maximum error of the prediction results of H. Jamali’s model is 174.4%, and the average error is ±39.9%. However, the maximum error of the prediction results of the model in this paper is 44.3%, and the average error is ±12.6%. It shows that the prediction results of the nine groups of tests using the model in this paper are closer to the test results, and the overall prediction effect is stronger than Xiao’s model and H. Jamali’s model, which fully illustrates the accuracy of the model in this paper.
To further verify the applicability of the proposed model, previous laboratory test data of Elliott et al. [33] were analyzed using the proposed model. The predicted results were compared with the measured data as shown in Figure 25. Elliott et al. [33] conducted extensive cyclic triaxial tests on four subgrade soils in Arkansas, among which the tests of Gallion and Enders subgrade silt considered both the effects of moisture content and cyclic deviator stress and was used to validate the prediction model proposed in this paper. It can be seen from Figure 25 that the Elliott’s model adopts the same method as Xiao et al. [35], and the influence of moisture content on permanent deformation is indirectly taken into account in the model parameter stress ratio r σ . With the same number of model parameters, the ratios of the predicted and measured values of the permanent deformation of the Gallion and Enders subgrade silt by the Elliott’s model are 0.8~1.2 and 0.8~1.3, respectively, while the ratios by the model in this paper are 0.8~1.1 and 0.8~1.2, respectively.
In addition, it can be seen from Table 5 that the maximum error of the prediction result of the Elliott’s model is 33.3% and the average error is ± 11.6%, while the maximum error of the prediction result of the model in this paper is 21.9% and the average error is ±8.3%. It shows that the model in this paper also has good prediction performance for silt in other areas.
Therefore, the proposed model in this paper is universally applicable to predicting the permanent strain of silt under cyclic loading with different moisture contents. It has easily obtainable model parameters, simple calculation methods and high prediction accuracy. The analysis on the past measured data fully demonstrates the good performance of the model in predicting the permanent strain of silt. In engineering practice, theoretically, only three sets of cyclic triaxial tests need to be conducted to determine the four parameters of the prediction model to predict the permanent deformation of silt subgrade under cyclic loading. The empirical model in this paper can be used to predict the permanent deformation of silt subgrade simply and accurately, which is of great significance for reasonable design and construction, effectively prolonging the service life of subgrade and improving the sustainability of highway engineering.

5. Summary and Conclusions

In this paper, a series of monotonic and cyclic triaxial tests were carried out to study the influence of moisture content, cyclic deviator stress and confining pressure on the mechanical properties of the Yellow River alluvial silt. Based on the test results, an empirical model of permanent deformation considering moisture content and stress level was established. The main conclusions are as follows:
(1)
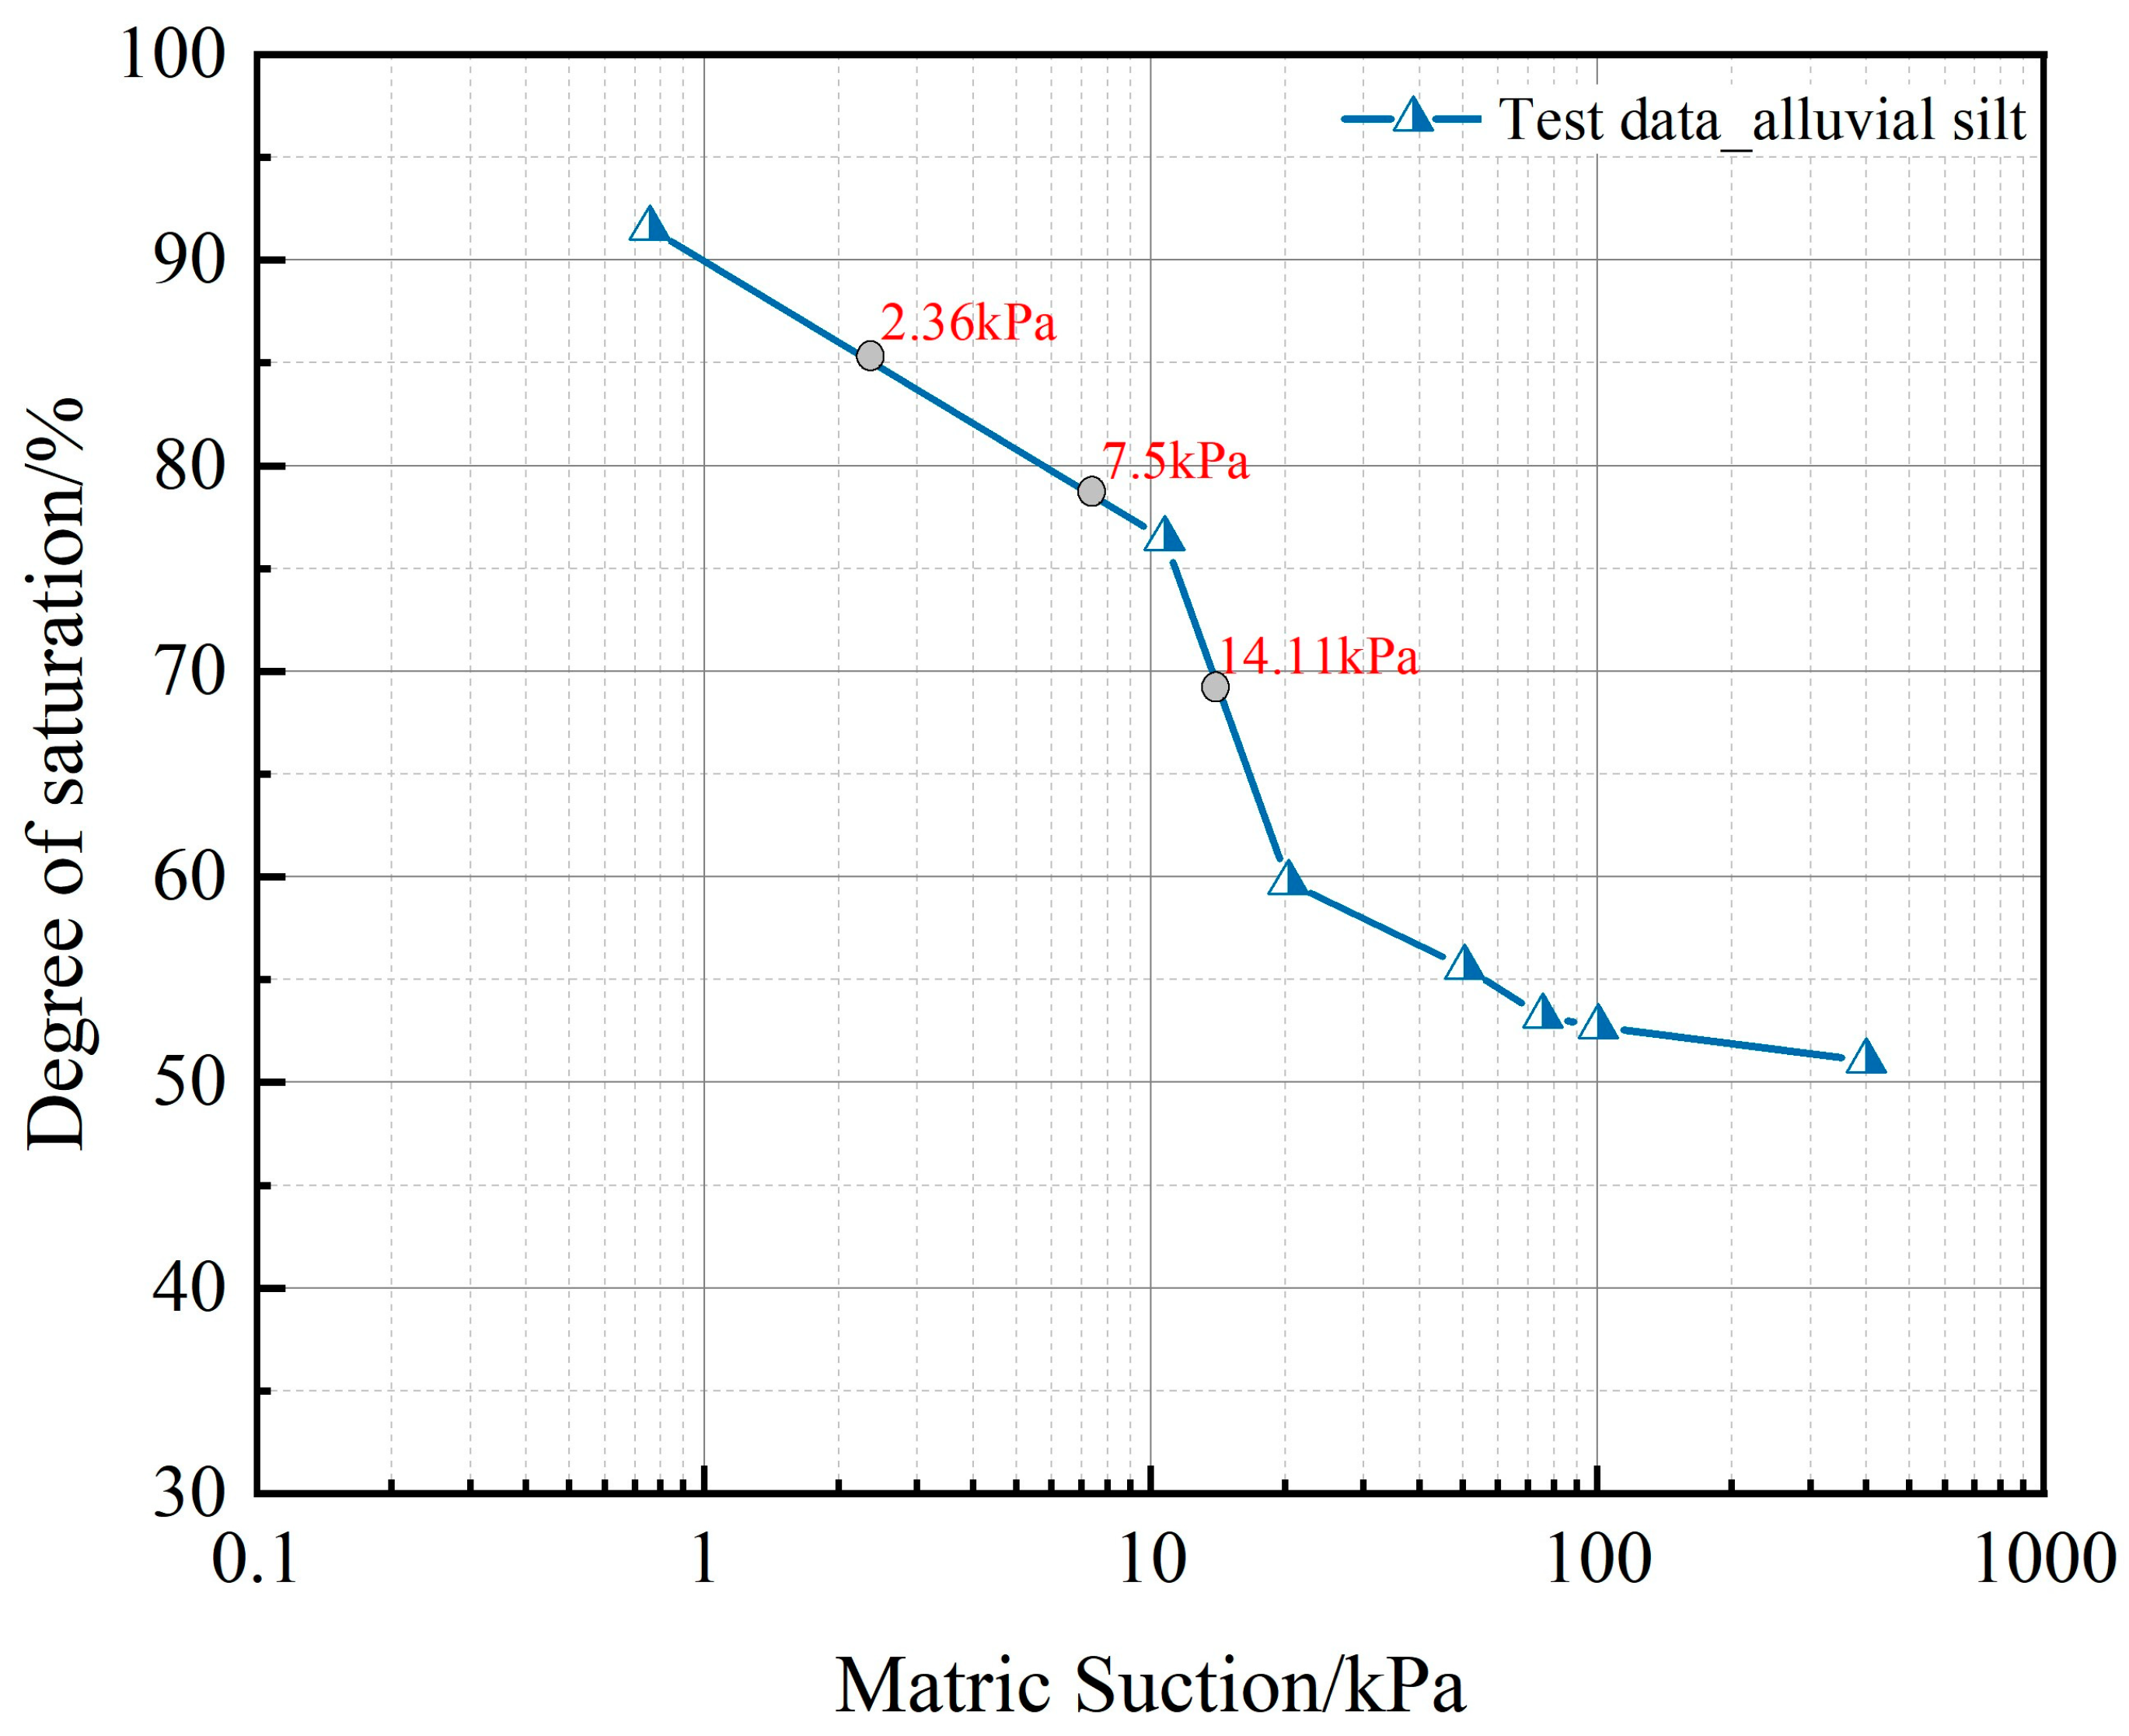
When the moisture content is greater than the optimal moisture content, the static strength of silt decreases with the increase in moisture content, and the internal friction angle does not change with the change in moisture content. The decrease in static strength is mainly caused by the decrease in cohesion. The matric suction of alluvial silt in the Yellow River is more sensitive to the change in moisture content. When the moisture content increases from 110% OMC to 135% OMC, the matric suction decreases by 83.3%, which is the main reason for the decrease in cohesion.
(2)
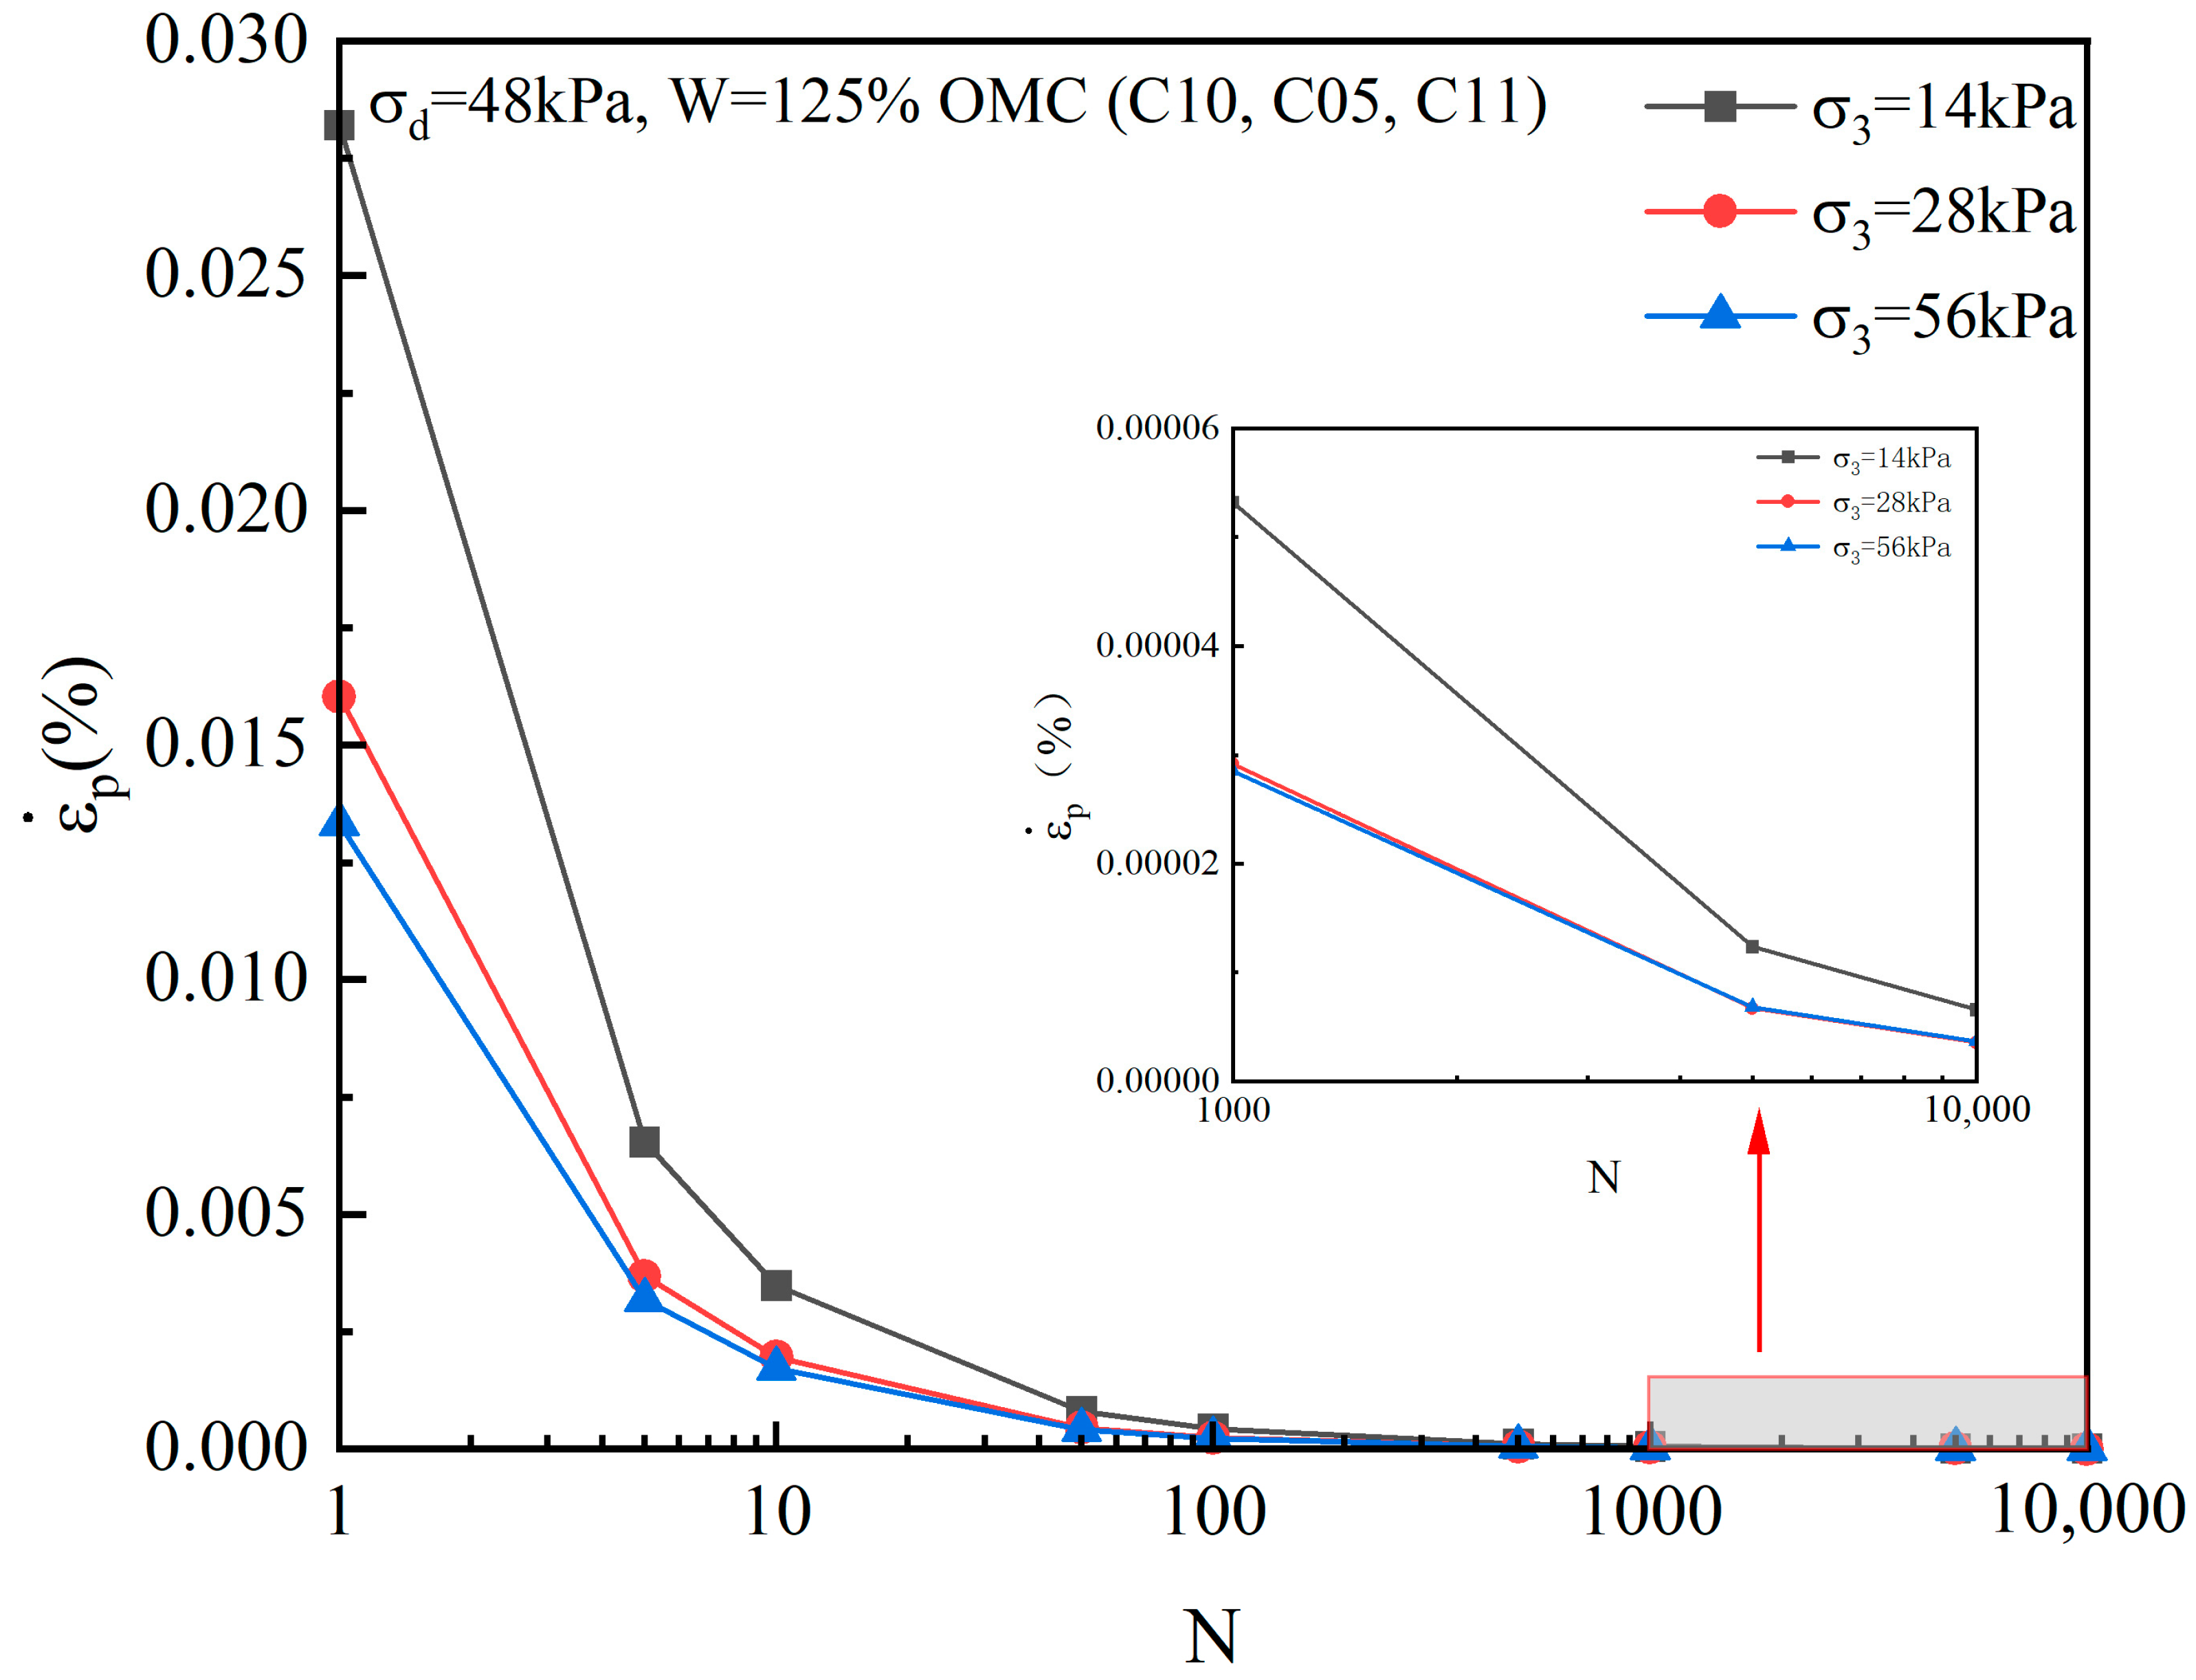
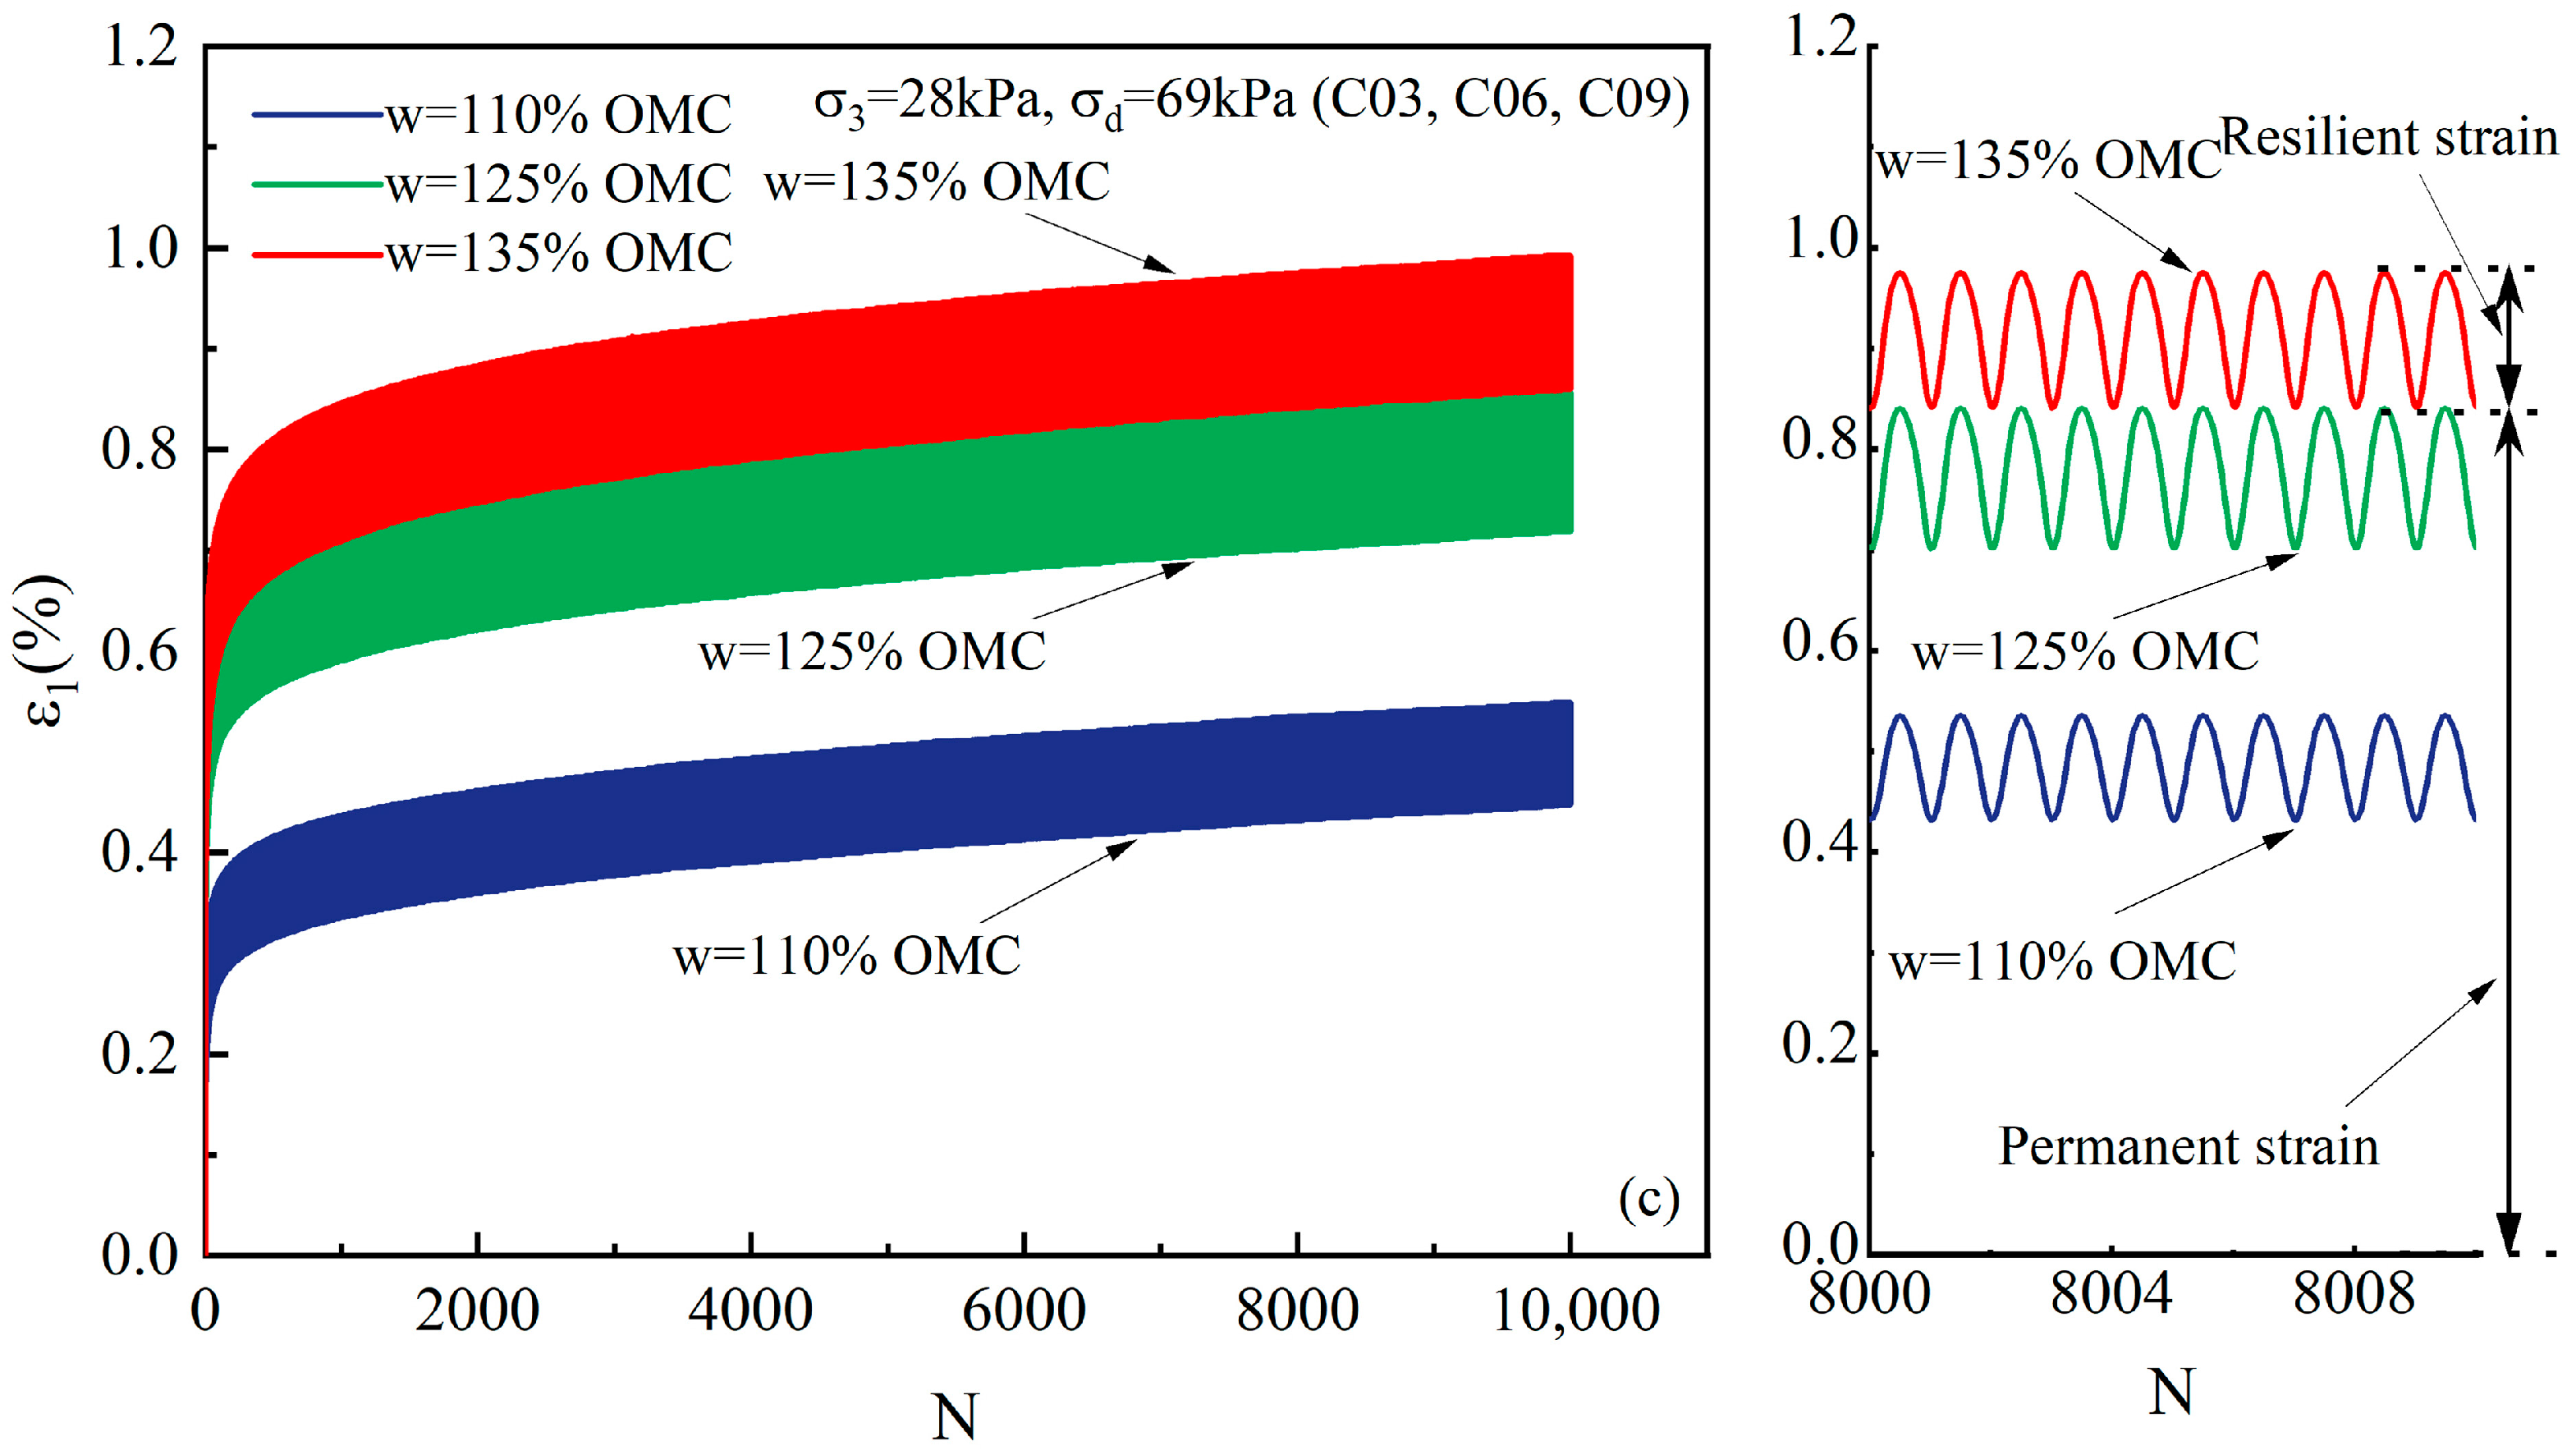
Under the condition of the plastic shakedown state, the axial permanent strain of silt accumulates rapidly during the first 1000 cycles of cyclic loading, and the permanent strain accounts for more than 75% of the total permanent strain of the total number of cycles. The effect of the early stage of loading on the total permanent strain is significant. As the cyclic loading progresses, the area of the hysteresis curve gradually decreases and the tilt angle increases, indicating that the permanent strain accumulation rate gradually slows down.
(3)
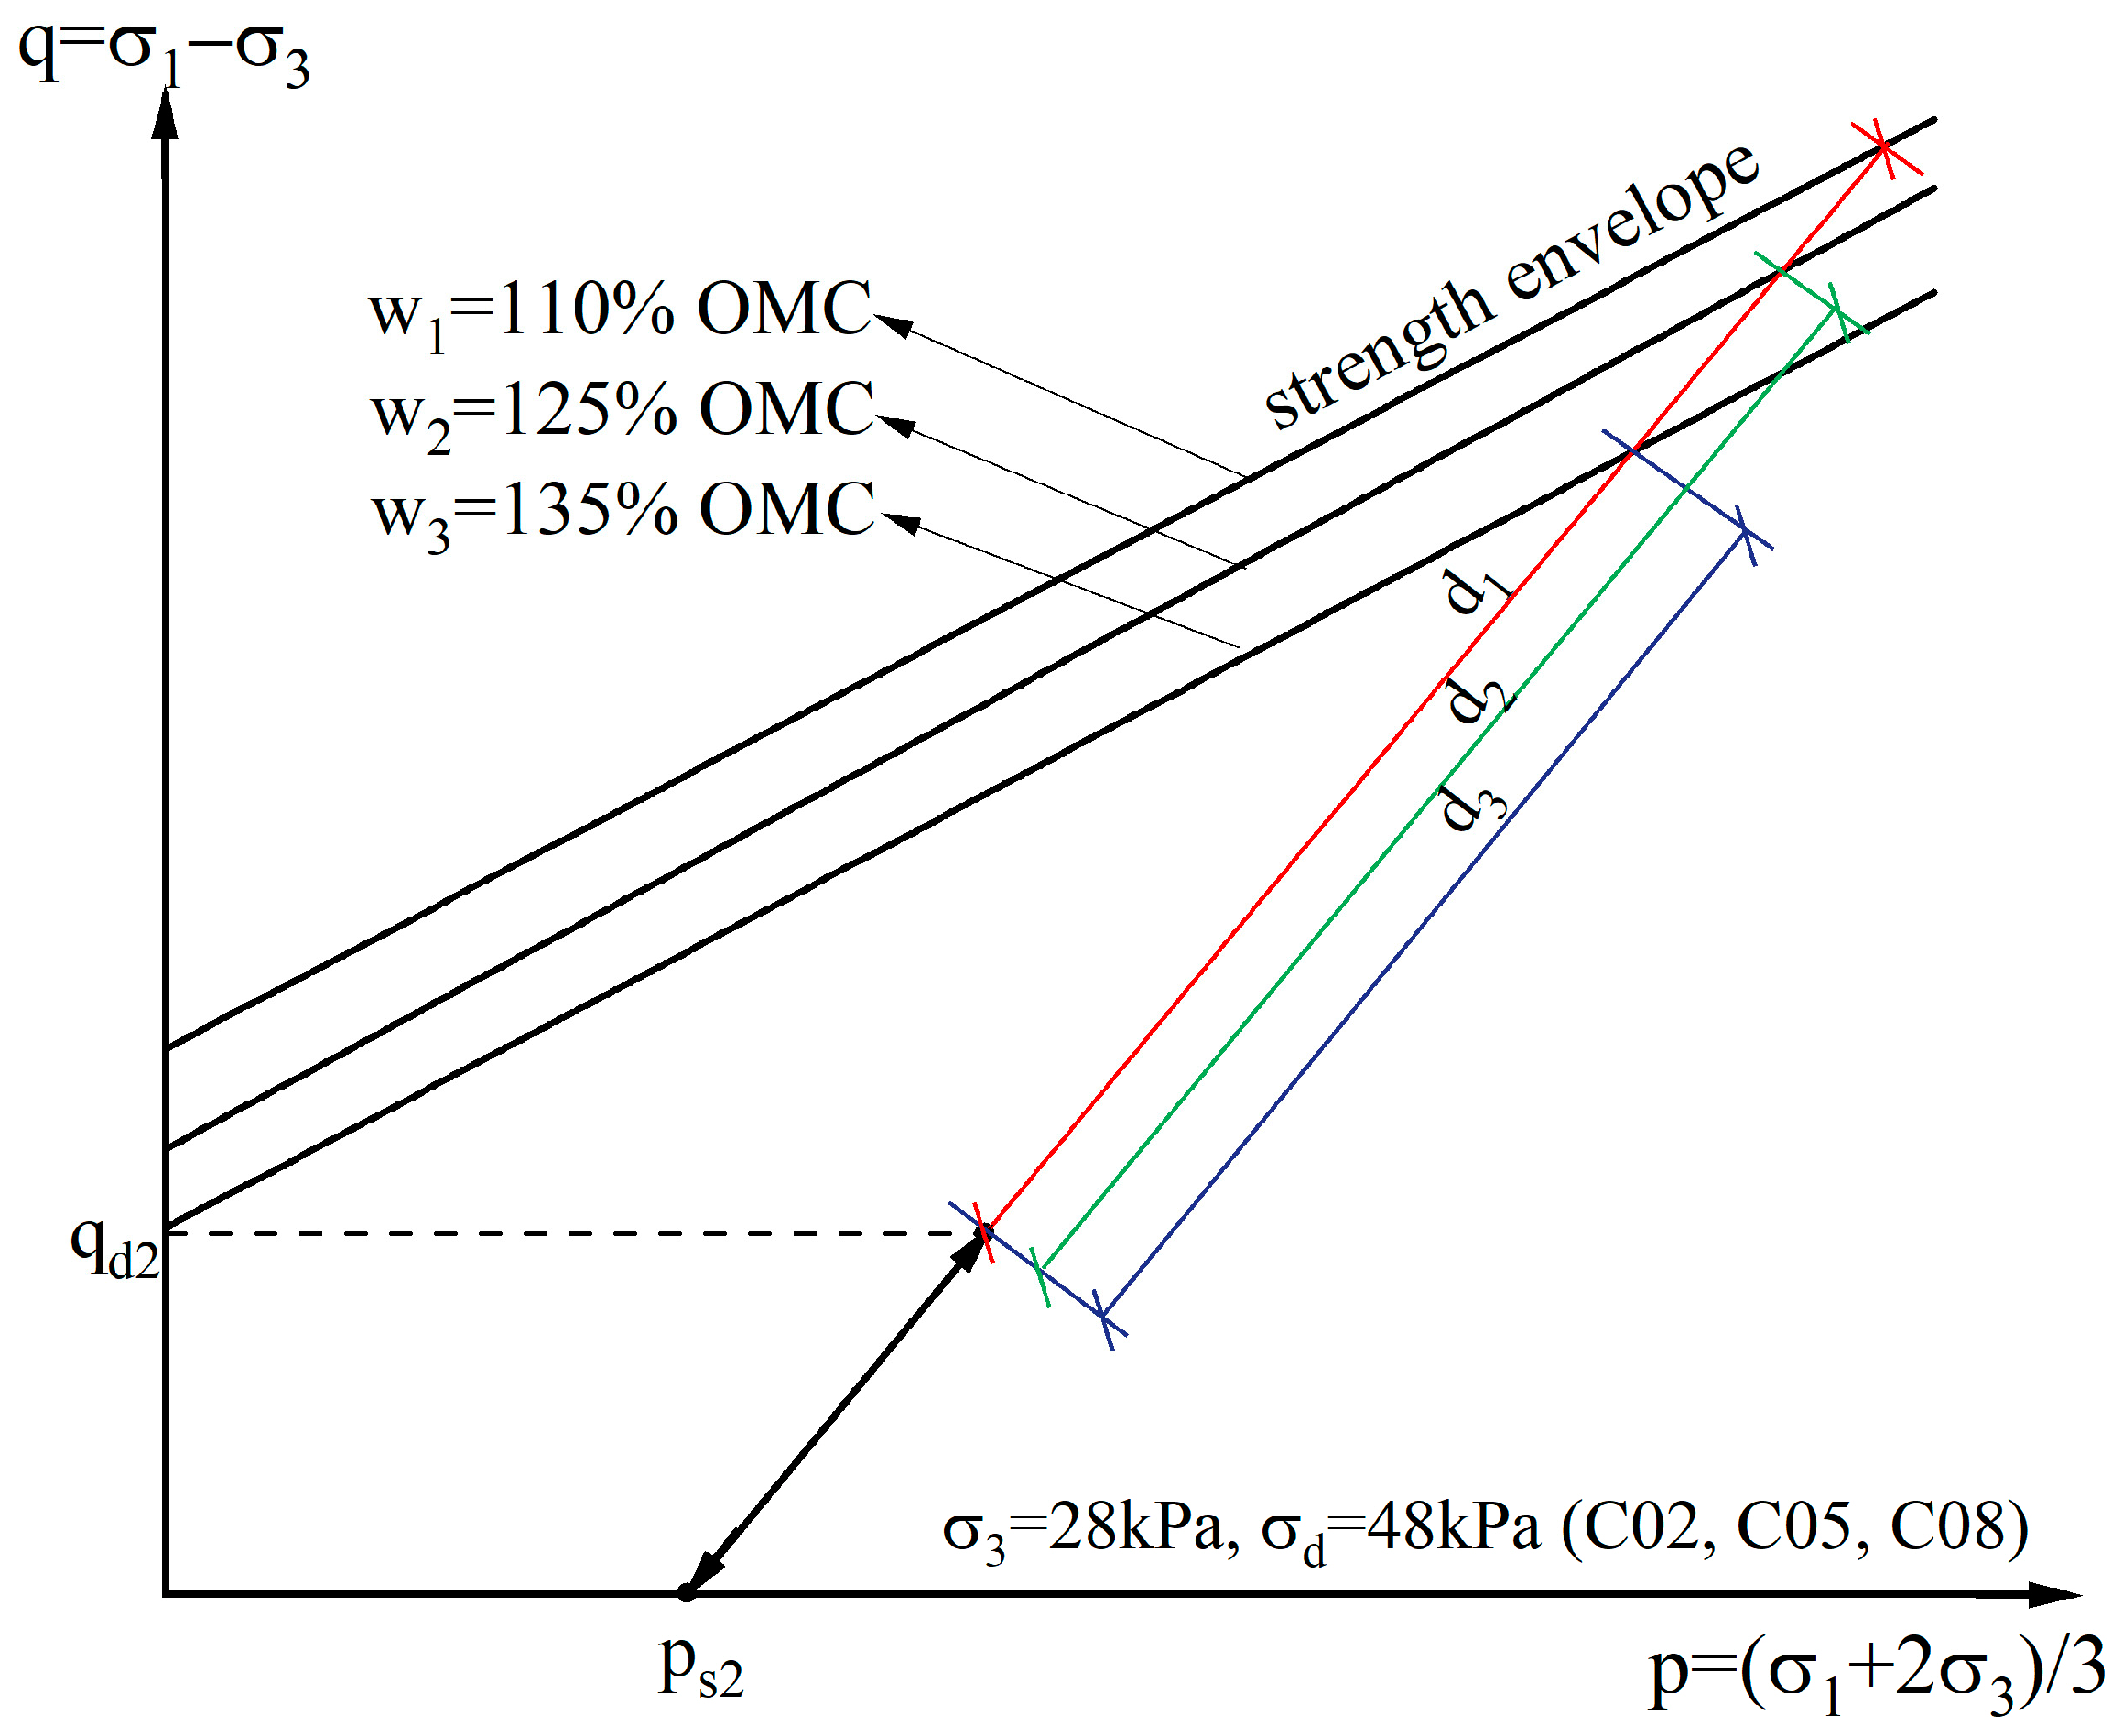
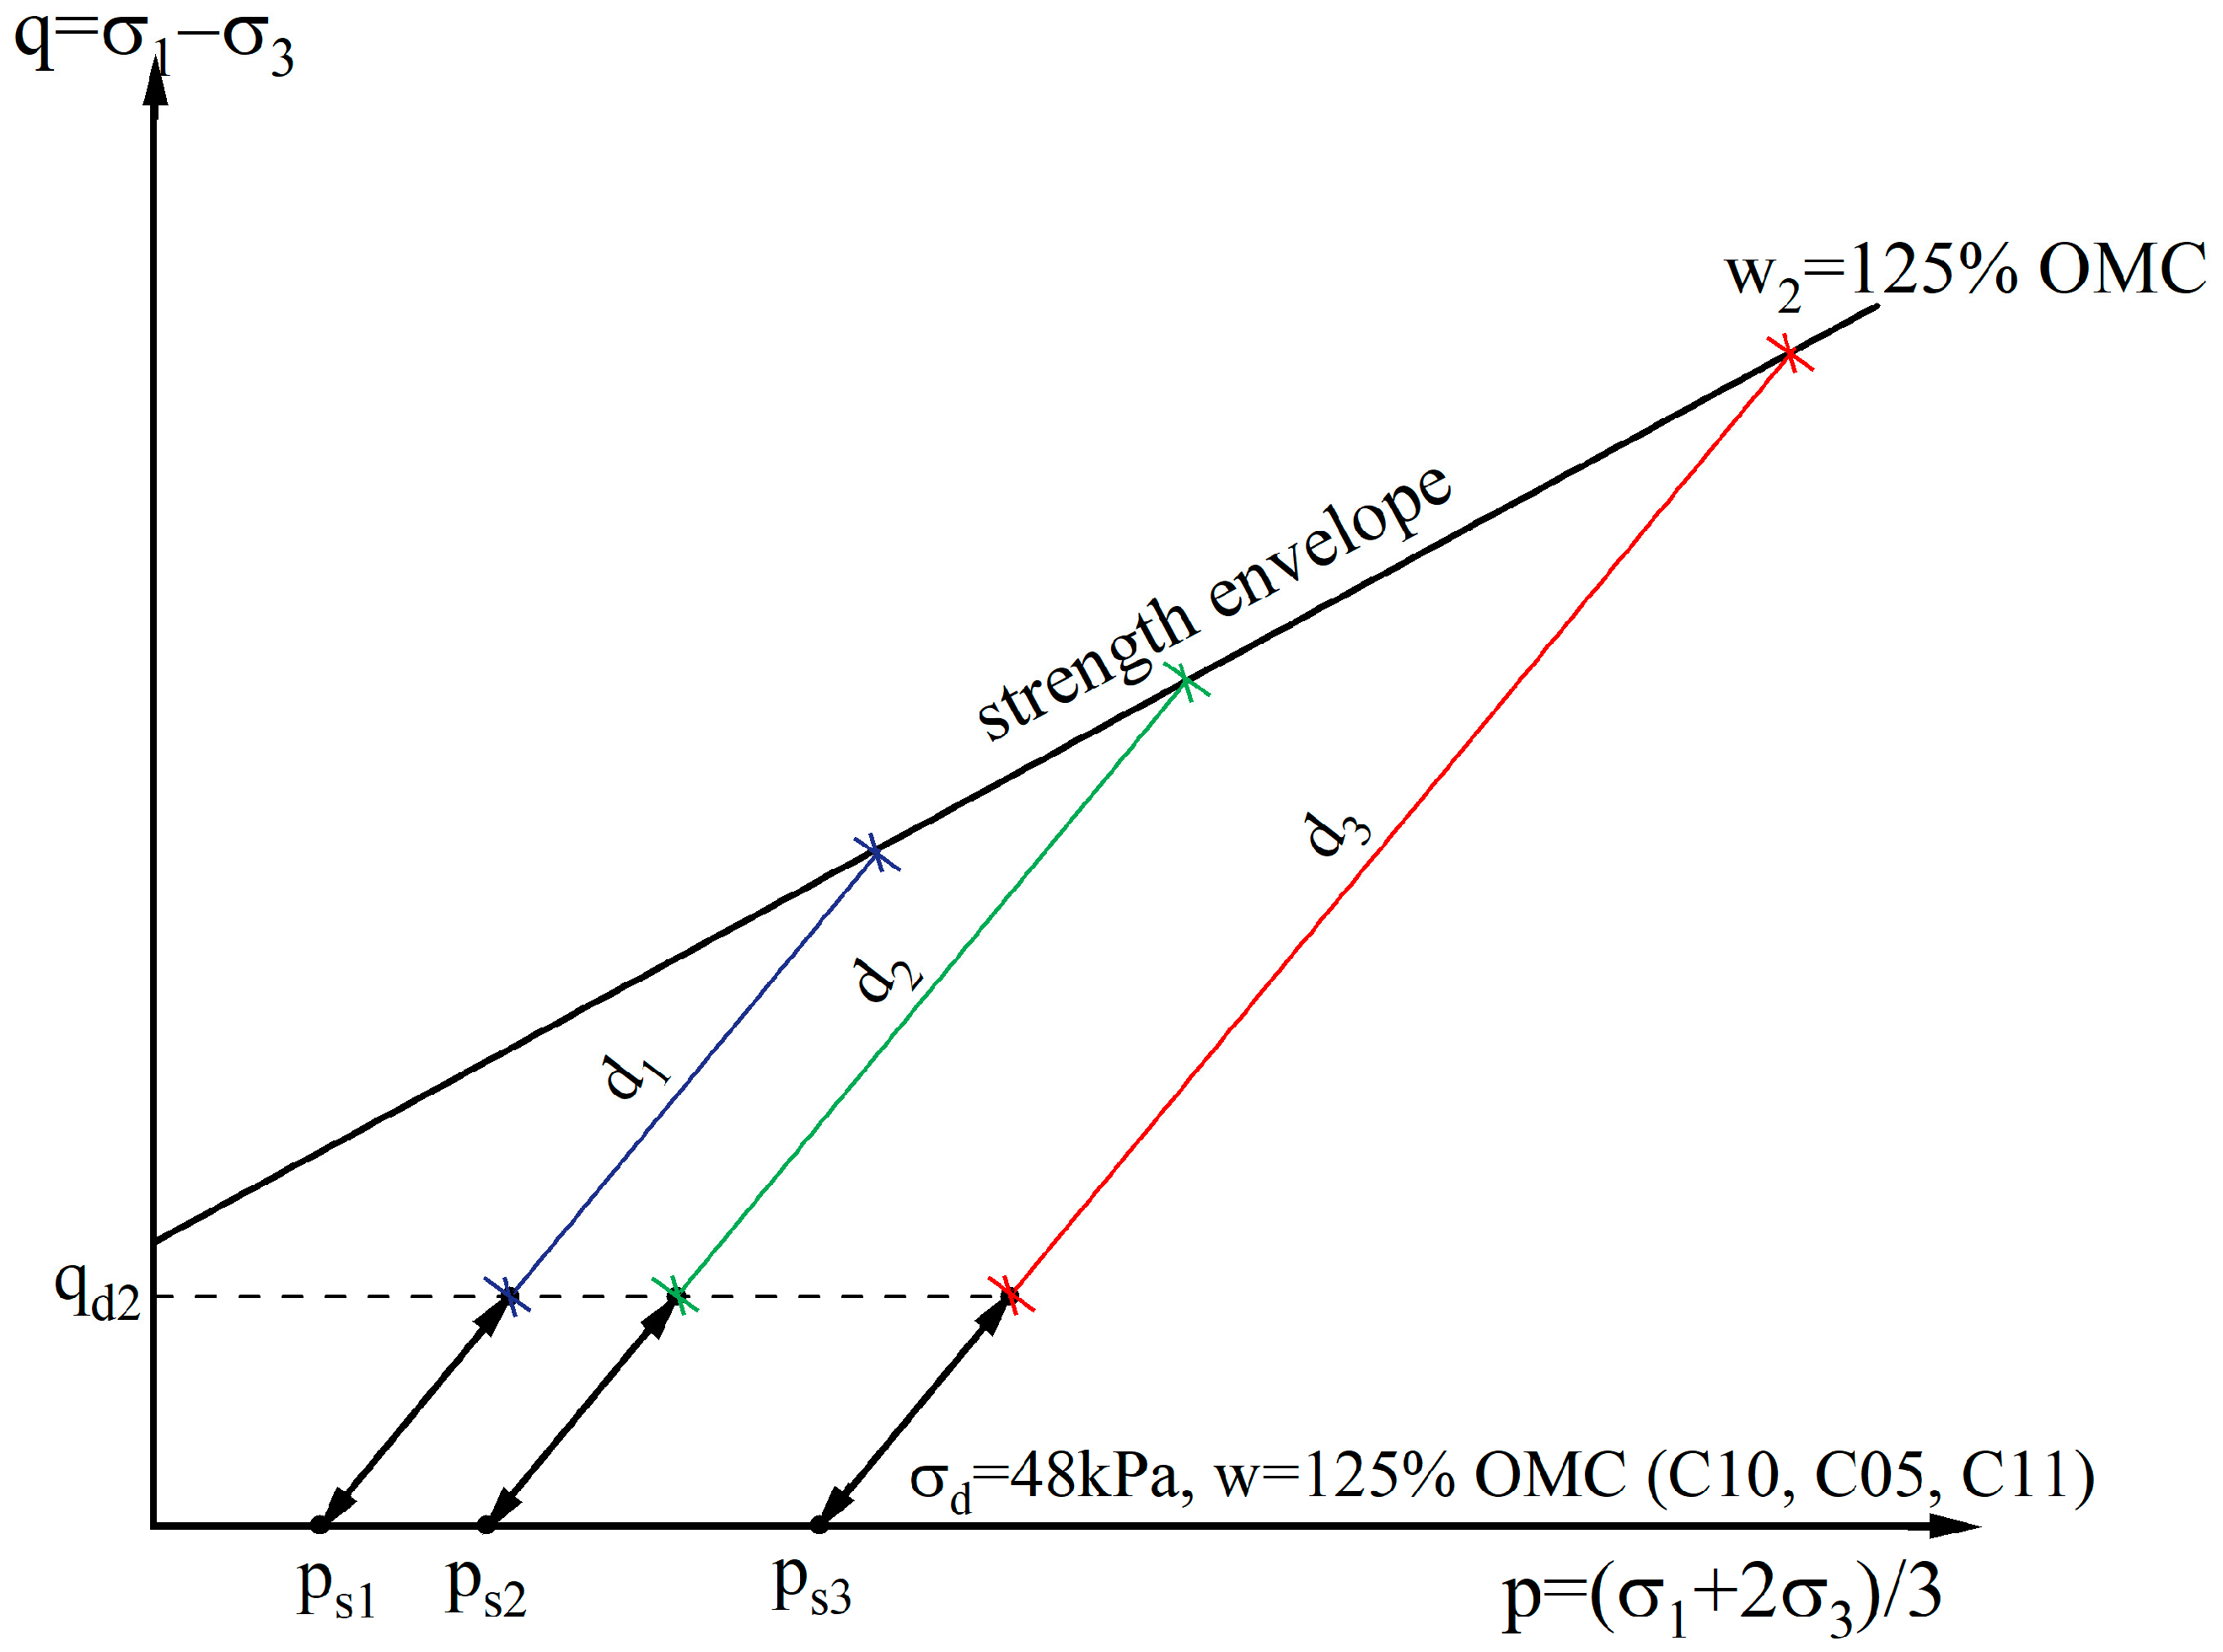
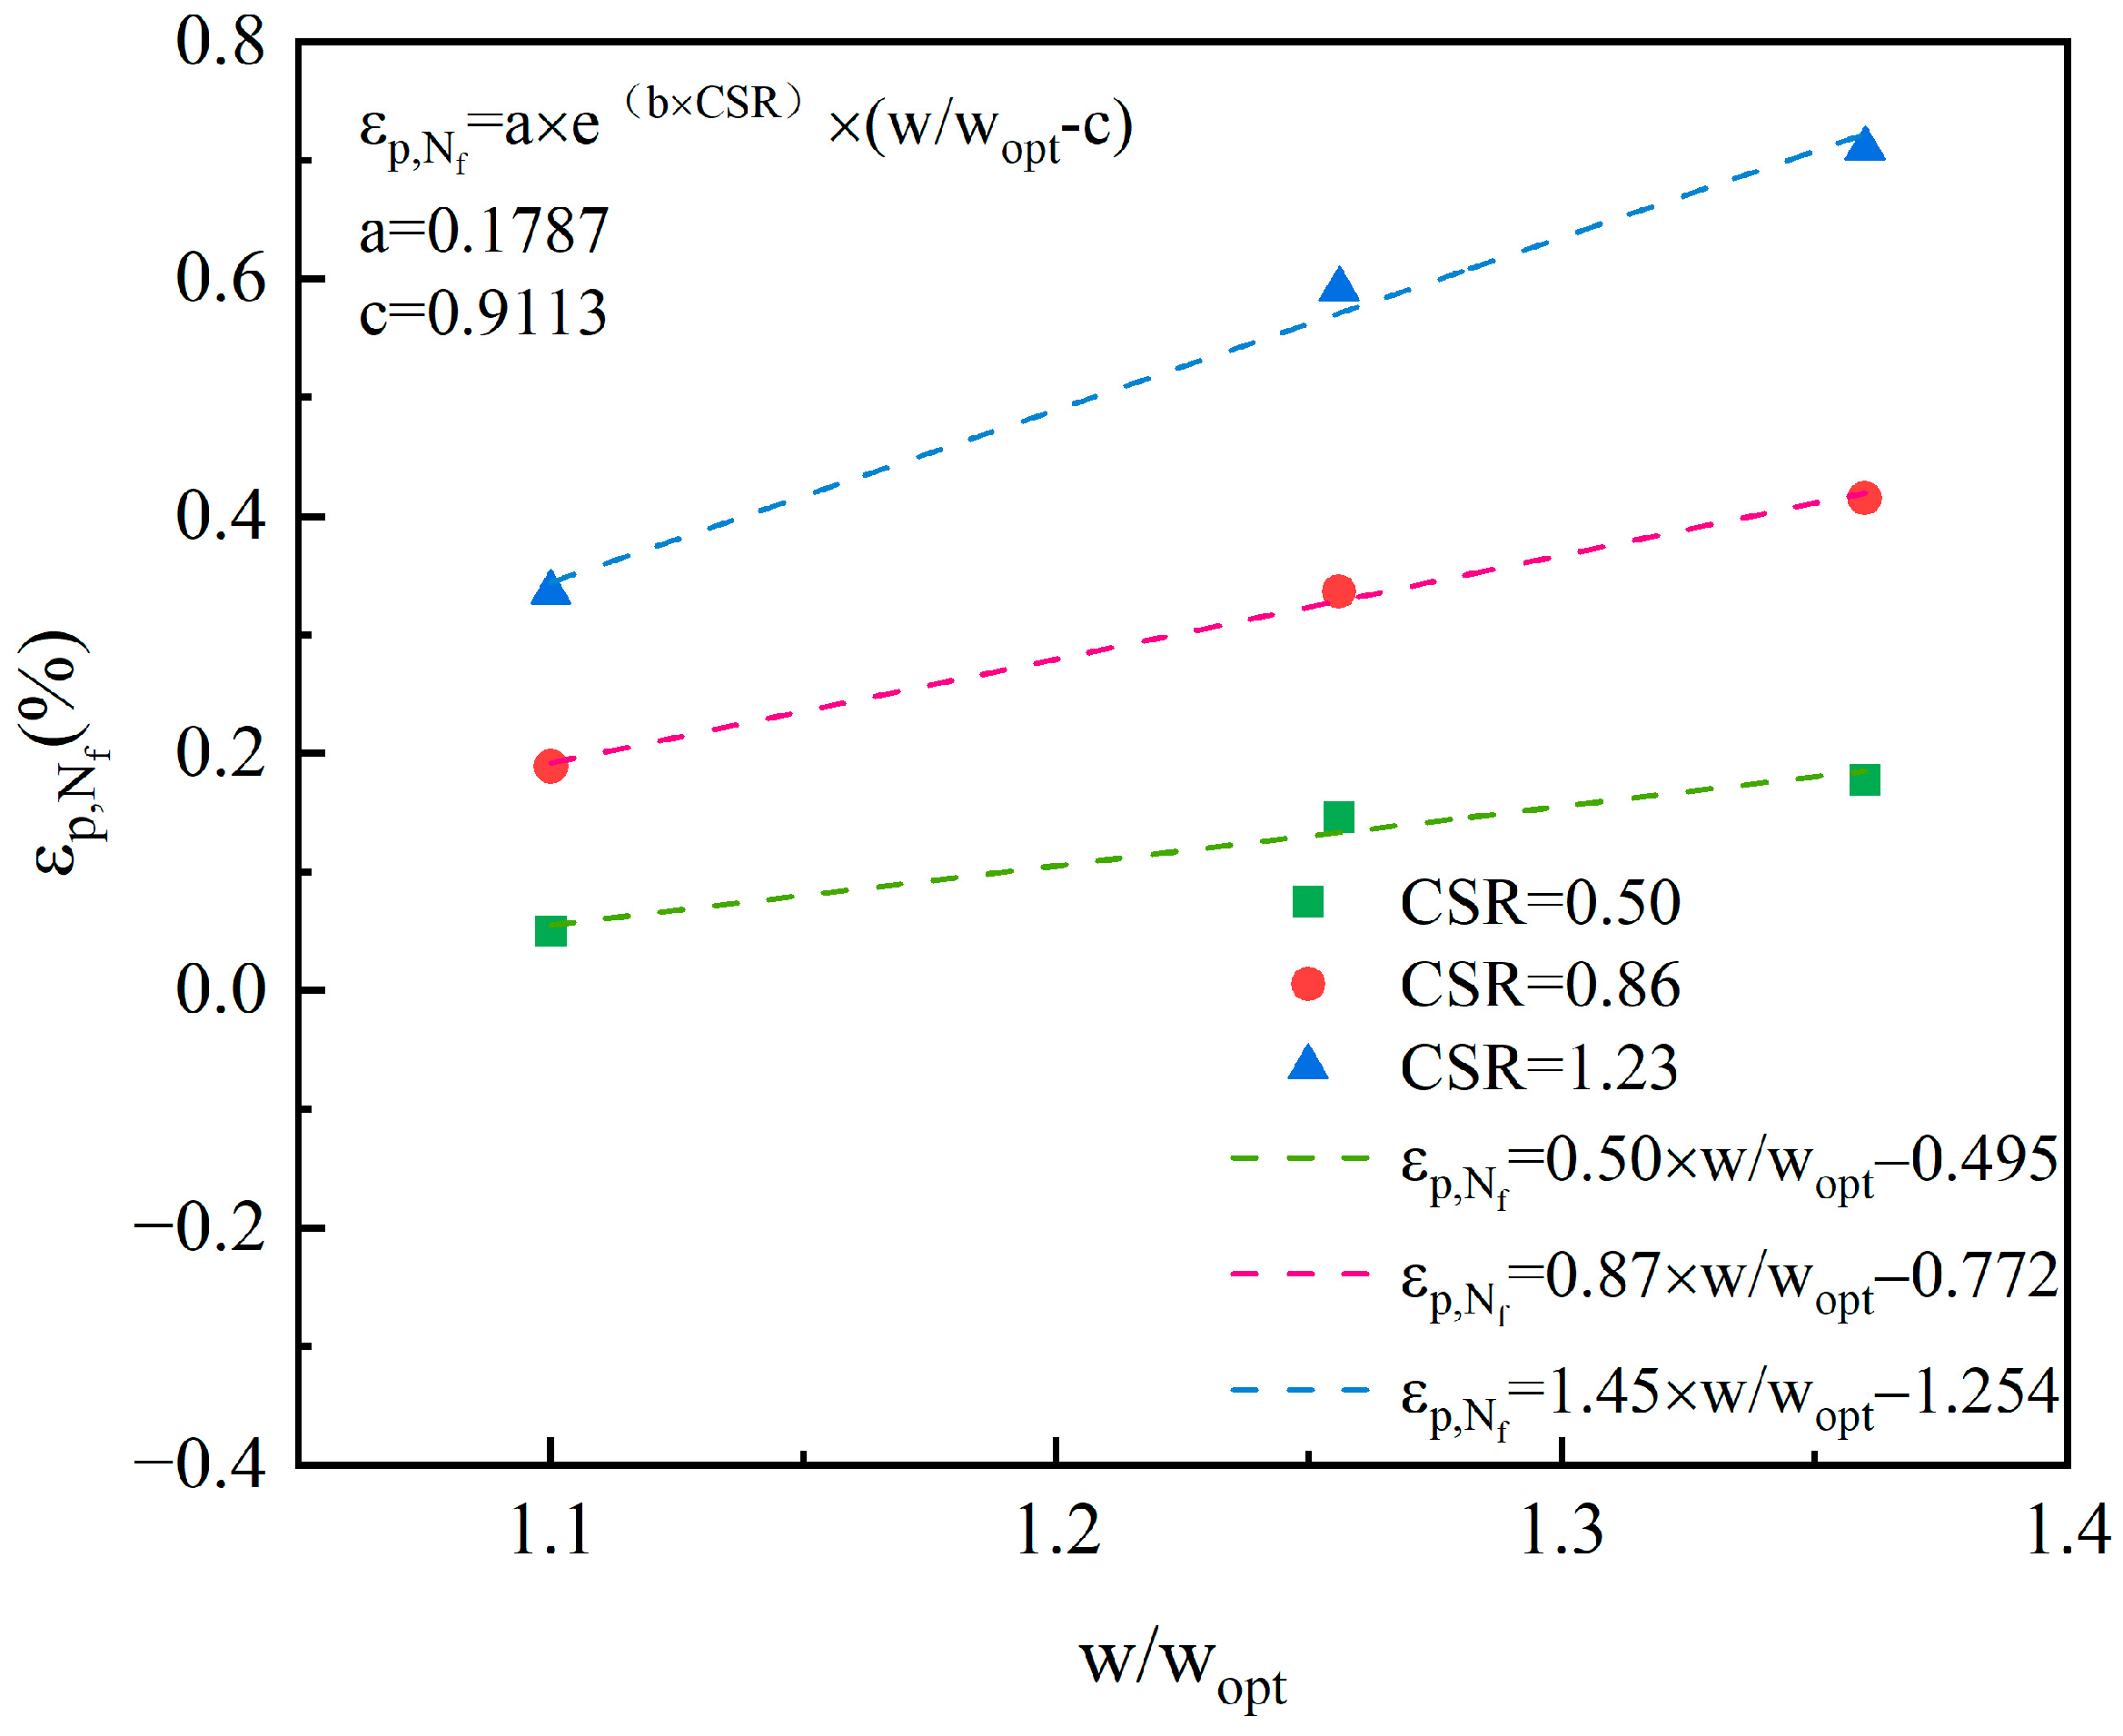
With the increase in moisture content and cyclic deviator stress, and the decrease in confining pressure, the axial permanent strain and the accumulating rate of permanent strain of the silt increases. The increase in permanent strain has a linear relationship with the increase in moisture content and cyclic deviator stress, and a power relationship with the decrease in confining pressure. The influence of cyclic deviator stress on permanent deformation is the most significant, and the influence of confining pressure is the smallest. The permanent strain of silt under different influencing factors increases with the decrease in the distance between the peak point of the cyclic stress path and the strength envelope.
(4)
A prediction model with a wide applicability to predicting the permanent strain of the silt under cyclic loading with different moisture contents was established by introducing the reference number of cycles. The comparison with the existing prediction models and the prediction for the experimental data in previous literature demonstrated the advantages of the proposed model, including easy acquisition of the model parameters, a simple calculation method and high prediction accuracy. This model can provide useful references for the engineering design and construction of silt subgrades. In the future, the hollow cylinder torsional shear test can be carried out to study the engineering properties of silt under the heart-shaped stress path and predict the permanent deformation of silt subgrade caused by traffic load.

Author Contributions

Conceptualization, Z.D., Z.Z. and L.W.; methodology, Z.D., Z.Z. and L.W.; experimentation, Z.Z. and Y.L.; formal analysis, Z.D., Z.Z. and L.W.; data curation, Z.D. and J.Z.; writing—original draft preparation, Z.Z.; writing—review and editing, Z.D., Z.Z. and L.W.; project administration, Z.D. All authors have read and agreed to the published version of the manuscript.

Funding

The research was funded by the National Natural Science Foundation of China (Grant nos. U22A20598 and 51908513) and Key Research and Development and Promotion Project of Henan Province (Grant no. 212102310279).

Institutional Review Board Statement

Not applicable.

Informed Consent Statement

Not applicable.

Data Availability Statement

The data used to support the findings of this study are available from the corresponding author upon request.

Acknowledgments

The authors appreciate the anonymous reviewers for their constructive comments and suggestions that significantly improved the quality of this manuscript.

Conflicts of Interest

The authors declare that they have no known competing financial interest or personal relationships that could have appeared to influence the work reported in this paper.

References

  1. Liu, J.; Xiao, J. Experimental study on the stability of railroad silt subgrade with increasing train speed. J. Geotech. Geoenviron. Eng. 2010, 136, 833–841. [Google Scholar] [CrossRef]
  2. Li, M.; Li, Y.; Islam, M.R. Effects of water content and interface roughness on the shear strength of silt–cement mortar interface. Soils Found. 2021, 61, 1615–1629. [Google Scholar] [CrossRef]
  3. Wang, Y.; Cao, T.; Shao, J.; Song, Y.; Wan, Y. Experimental study on static characteristics of the Yellow River silt under (triaxial) consolidated undrained conditions. Mar. Georesour. Geotechnol. 2023, 41, 285–294. [Google Scholar] [CrossRef]
  4. Drumm, E.C.; Reeves, J.S.; Madgett, M.R.; Trolinger, W.D. Subgrade resilient modulus correction for saturation effects. J. Geotech. Geoenviron. Eng. 1997, 123, 663–670. [Google Scholar] [CrossRef]
  5. Guan, Y.; Drumm, E.C.; Jackson, N.M. Weighting factor for seasonal subgrade resilient modulus. Transp. Res. Rec. 1998, 1619, 94–101. [Google Scholar] [CrossRef]
  6. Yang, L.; Shao, S.; Wang, F.; Wang, L. Experimental Study on the Axial Deformation Characteristics of Compacted Lanzhou Loess under Traffic Loads. Sustainability 2023, 15, 10939. [Google Scholar] [CrossRef]
  7. Marr, W.A., Jr.; Chrisitian, J.T. Permanent displacements due to cyclic wave loading. J. Geotech. Eng. Div. 1981, 107, 1129–1149. [Google Scholar] [CrossRef]
  8. Wichtmann, T.; Niemunis, A.; Triantafyllidis, T. Strain accumulation in sand due to cyclic loading: Drained triaxial tests. Soil Dyn. Earthq. Eng. 2005, 25, 967–979. [Google Scholar] [CrossRef]
  9. Wichtmann, T.; Niemunis, A.; Triantafyllidis, T. Validation and calibration of a high-cycle accumulation model based on cyclic triaxial tests on eight sands. Soils Found. 2009, 49, 711–728. [Google Scholar] [CrossRef]
  10. Saeidaskari, J.; Alibolandi, M.; Azizkandi, A.S. Undrained monotonic and cyclic behavior of Qeshm calcareous sand. Mar. Georesour. Geotechnol. 2021, 39, 798–811. [Google Scholar] [CrossRef]
  11. Li, M.; Dai, M.; Yao, S.; Gao, S.; Yuan, G. Effects of frequencies on the cyclic behavior of marine soft clay under different consolidated stress paths. Mar. Georesour. Geotechnol. 2023, 41, 436–445. [Google Scholar] [CrossRef]
  12. Ramos, A.; Correia, A.G.; Indraratna, B.; Ngo, T.; Calçada, R.; Costa, P.A. Mechanistic-empirical permanent deformation models: Laboratory testing, modelling and ranking. Transp. Geotech. 2020, 23, 100326. [Google Scholar] [CrossRef]
  13. Prévost, J.H. Mathematical modelling of monotonic and cyclic undrained clay behaviour. Int. J. Numer. Anal. Methods Geomech. 1977, 1, 195–216. [Google Scholar] [CrossRef]
  14. Manzari, M.T.; Dafalias, Y.F. A critical state two-surface plasticity model for sands. Géotechnique 1997, 47, 255–272. [Google Scholar] [CrossRef]
  15. Chen, C.; Xu, G.; Zhou, Z.; Kong, L.; Zhang, X.; Yin, S. Undrained dynamic behaviour of peaty organic soil under long-term cyclic loading, Part II: Constitutive model and simulation. Soil Dyn. Earthq. Eng. 2020, 129. [Google Scholar] [CrossRef]
  16. Li, S.L.; He, S.Y.; Wang, X.T.; Chen, S.W.; Guo, X.Y. Prediction of Soft Ground Settlement by BP Neural Network. Appl. Mech. Mater. 2014, 608, 825–828. [Google Scholar] [CrossRef]
  17. Monismith, C.L.; Ogawa, N.; Freeme, C.R. Permanent deformation characteristics of subgrade soils due to repeated loading. Transp. Res. Rec. 1975, 1–17. [Google Scholar]
  18. Li, D.; Selig, E.T. Cumulative plastic deformation for fine-grained subgrade soils. J. Geotech. Eng. 1996, 122, 1006–1013. [Google Scholar] [CrossRef]
  19. Chai, J.C.; Miura, N. Traffic-load-induced permanent deformation of road on soft subsoil. J. Geotech. Geoenviron. Eng. 2002, 128, 907–916. [Google Scholar] [CrossRef]
  20. Guo, L.; Wang, J.; Cai, Y.; Liu, H.; Gao, Y.; Sun, H. Undrained deformation behavior of saturated soft clay under long-term cyclic loading. Soil Dyn. Earthq. Eng. 2013, 50, 28–37. [Google Scholar] [CrossRef]
  21. Jamali, H.; Tolooiyan, A.; Dehghani, M.; Asakereh, A.; Kalantari, B. Long-term dynamic behaviour of Coode Island Silt (CIS) containing different sand content. Appl. Ocean Res. 2018, 73, 59–69. [Google Scholar] [CrossRef]
  22. Qian, J.; Li, S.; Gu, X.; Zhang, J. A unified model for estimating the permanent deformation of sand under a large number of cyclic loads. Ocean Eng. 2019, 181, 293–302. [Google Scholar] [CrossRef]
  23. Wu, H.N.; Shen, S.L.; Chai, J.C.; Zhang, D.M.; Xu, Y.S. Evaluation of train-load-induced settlement in metro tunnels. Proc. Inst. Civ. Eng.-Geotech. Eng. 2015, 168, 396–406. [Google Scholar] [CrossRef]
  24. Qian, J.; Li, S.; Zhang, J.; Jiang, J.; Wang, Q. Effects of OCR on monotonic and cyclic behavior of reconstituted Shanghai silty clay. Soil Dyn. Earthq. Eng. 2019, 118, 111–119. [Google Scholar] [CrossRef]
  25. Chik, Z.; Aljanabi, Q.A.; Kasa, A.; Taha, M.R. Tenfold cross validation artificial neural network modeling of the settlement behavior of a stone column under a highway embankment. Arab. J. Geosci. 2014, 7, 4877–4887. [Google Scholar] [CrossRef]
  26. Ren, X.W.; Tang, Y.Q.; Li, J.; Yang, Q. A prediction method using grey model for cumulative plastic deformation under cyclic loads. Nat. Hazards 2012, 64, 441–457. [Google Scholar] [CrossRef]
  27. Xu, G.; Wang, Y.; Liu, S.; Wang, S. Tensioning-phase box girder deformation prediction model based on ant colony algorithm and residual correction. Math. Probl. Eng. 2018, 2018, 1872578. [Google Scholar] [CrossRef]
  28. Werkmeister, S.; Dawson, A.R.; Wellner, F. Permanent deformation behavior of granular materials and the shakedown concept. Transp. Res. Rec. 2001, 1757, 75–81. [Google Scholar] [CrossRef]
  29. Cerni, G.; Cardone, F.; Virgili, A.; Camilli, S. Characterisation of permanent deformation behaviour of unbound granular materials under repeated triaxial loading. Constr. Build. Mater. 2012, 28, 79–87. [Google Scholar] [CrossRef]
  30. Salour, F.; Erlingsson, S. Permanent deformation characteristics of silty sand subgrades from multistage RLT tests. Int. J. Pavement Eng. 2017, 18, 236–246. [Google Scholar] [CrossRef]
  31. Zhang, X.; Zhang, Y.; Liu, X.; Liu, J.; Liu, J. Shakedown behavior of yellow river alluvial silt stabilized with lignin–lime combined additive. J. Mater. Civ. Eng. 2020, 32, 04019318. [Google Scholar] [CrossRef]
  32. Li, Y.; Nie, R.; Yue, Z.; Leng, W.; Guo, Y. Dynamic behaviors of fine-grained subgrade soil under single-stage and multi-stage intermittent cyclic loading: Permanent deformation and its prediction model. Soil Dyn. Earthq. Eng. 2021, 142, 106548. [Google Scholar] [CrossRef]
  33. Elliott, R.P.; Dennis, N.D.; Qiu, Y. Permanent Deformation of Subgrade Soils; Fayetteville, Mack-Blackwell Transportation Center Publ.: Fayetteville, AR, USA, 1998. [Google Scholar]
  34. Puppala, A.J.; Saride, S.; Chomtid, S. Experimental and modeling studies of permanent strains of subgrade soils. J. Geotech. Geoenviron. Eng. 2009, 135, 1379–1389. [Google Scholar] [CrossRef]
  35. Xiao, J.; Juang, C.H.; Xu, C.; Li, X.; Wang, L. Strength and deformation characteristics of compacted silt from the lower reaches of the Yellow River of China under monotonic and repeated loading. Eng. Geol. 2014, 178, 49–57. [Google Scholar] [CrossRef]
  36. ASTM D854-14; Standard Test Methods for Specific Gravity of Soil Solids by Water Pycnometer. ASTM International: West Conshohocken, PA, USA, 2014.
  37. ASTM D4318-10; Standard Test Methods for Liquid Limit, Plastic Limit, and Plasticity Index of Soils. ASTM International: West Conshohocken, PA, USA, 2010.
  38. ASTM D422-63; Standard Test Method for Particle-Size Analysis of Soils. ASTM International: West Conshohocken, PA, USA, 2007.
  39. ASTM D698-12; Standard Test Methods for Laboratory Compaction Characteristics of Soil Using Standard Effort. ASTM International: West Conshohocken, PA, USA, 2021.
  40. ASTM D2487-17; Standard Practice for Classification of Soils for Engineering Purposes (Unified Soil Classification System). ASTM International: West Conshohocken, PA, USA, 2017.
  41. Chen, D.; Tang, J.; Yang, X. Effects of Drying–Wetting Cycle and Fines Content on Hysteresis and Dynamic Properties of Granite Residual Soil under Cyclic Loading. Appl. Sci. 2023, 13, 6660. [Google Scholar] [CrossRef]
  42. Lackenby, J.; Indraratna, B.; McDowell, G.; Christie, D. Effect of confining pressure on ballast degradation and deformation under cyclic triaxial loading. Géotechnique 2007, 57, 527–536. [Google Scholar] [CrossRef]
  43. Rahman, M.S.; Erlingsson, S. Predicting permanent deformation behaviour of unbound granular materials. Int. J. Pavement Eng. 2015, 16, 587–601. [Google Scholar] [CrossRef]
  44. ASTM D5311-11; Standard Test Method for Load Controlled Cyclic Triaxial Strength of Soil. ASTM International: West Conshohocken, PA, USA, 2011.
  45. Uzan, J. Characterization of clayey subgrade materials for mechanistic design of flexible pavements. Transp. Res. Rec. 1998, 1629, 189–196. [Google Scholar] [CrossRef]
  46. Ren, H.; Liu, X.; Xuan, M.; Ye, X.; Li, Q.; Zhang, S. Study of cumulative plastic deformation of compacted silt under cyclic loading. Rock Soil Mech. 2021, 42, 1045–1055. [Google Scholar]
  47. Chen, R.; Chen, J.; Zhao, X.; Bian, X.; Chen, Y. Cumulative settlement of track subgrade in high-speed railway under varying water levels. Int. J. Rail Transp. 2014, 2, 205–220. [Google Scholar] [CrossRef]
  48. Wu, T.; Jin, H.; Guo, L.; Sun, H.; Tong, J.; Jiang, Y.; Wei, P. Predicting method on settlement of soft subgrade soil caused by traffic loading involving principal stress rotation and loading frequency. Soil Dyn. Earthq. Eng. 2022, 152, 107023. [Google Scholar] [CrossRef]
Figure 1. Typical permanent strain behavior of granular materials under cyclic traffic loading.
Sustainability 15 13155 g001
Figure 2. Typical grain size distribution curve of alluvial silt of the Yellow River.
Sustainability 15 13155 g002
Figure 3. A schematic diagram of the variation in axial stress with loading time.
Sustainability 15 13155 g003
Figure 4. Axial strain versus the number of cycles (Sample C05).
Sustainability 15 13155 g004
Figure 5. Stress–strain hysteretic loops for the different numbers of cycles (Sample C09).
Sustainability 15 13155 g005
Figure 6. The variation in axial strain with the number of cycles under different cyclic deviator stress (Sample C01, C02, C03).
Sustainability 15 13155 g006
Figure 7. The distance between the cyclic loading peak stress point and the strength envelope (Sample C01, C02, C03).
Sustainability 15 13155 g007
Figure 8. The accumulating rate of permanent strain under different cyclic deviator stress conditions (Sample C01, C02, C03).
Sustainability 15 13155 g008
Figure 9. The relationship between permanent strain and cyclic deviator stress at different numbers of cycles (Sample C01, C02, C03).
Sustainability 15 13155 g009
Figure 10. The variation in axial strain with the number of cycles under different confining stress values (Sample C10, C05, C11).
Sustainability 15 13155 g010
Figure 11. The distance between the cyclic loading peak stress point and the strength envelope (Sample C10, C05, C11).
Sustainability 15 13155 g011
Figure 12. The accumulating rate of permanent strain under different confining stress conditions (Sample C10, C05, C11).
Sustainability 15 13155 g012
Figure 13. The relationship between permanent strain and confining stress at different numbers of cycles (Sample C10, C05, C11).
Sustainability 15 13155 g013
Figure 14. The variation in axial strain with the number of cycles under different moisture contents: (a) σ d = 28 kPa, (b) σ d = 48 kPa, (c) σ d = 69 kPa.
Sustainability 15 13155 g014aSustainability 15 13155 g014b
Figure 15. The accumulating rate of permanent strain under different moisture content conditions (Sample C02, C05, C08).
Sustainability 15 13155 g015
Figure 16. The relationship between permanent strain and moisture content at different numbers of cycles (Sample C02, C05, C08).
Sustainability 15 13155 g016
Figure 17. SWCC absorption curves of alluvial silt.
Sustainability 15 13155 g017
Figure 18. The distance between the cyclic loading peak stress point and the strength envelope (Sample C02, C05, C08).
Sustainability 15 13155 g018
Figure 19. Permanent strain versus the number of cycles in the double logarithm coordinates.
Sustainability 15 13155 g019
Figure 20. Determination of the parameter λ for alluvial silt.
Sustainability 15 13155 g020
Figure 21. Determination of the parameter b for alluvial silt.
Sustainability 15 13155 g021
Figure 22. Determination of the parameter a and c for alluvial silt.
Sustainability 15 13155 g022
Figure 23. The comparison between the test results and the calculation results of the model in this paper.
Sustainability 15 13155 g023
Figure 24. Comparison between the experimental measurements and predictions of permanent strain by (a) Equation (6), (b) Xiao’s model and (c) H. Jamali’s model.
Sustainability 15 13155 g024
Figure 25. Comparison between the experimental measurements of Elliott et al. [33] and predictions of permanent strain by (a) Equation (6) of Gallion, (b) the model in Elliott et al. of Gallion, (c) Equation (6) of Enders, (d) the model in Elliott et al. of Enders.
Sustainability 15 13155 g025
Table 1. Index properties of alluvial silt.
Specific GravityPlastic Limit (%)Liquid Limit (%)Plasticity Index (%)Percent of Particle Size (%)Optimal Moisture Content (%)Maximum Dry Density (g/cm3)
0.075–0.25 mm0.005–0.075 mm<0.005 mm
2.6814.4024.009.6026.7361.213.7914.001.86
Table 2. Test conditions and results of cyclic triaxial tests on alluvial silt.
No.w (%) σ 3 (kPa) σ d (kPa) ε p , N = 10,000 (%)
C01110% OMC28280.0750
C02110% OMC28480.2475
C03110% OMC28690.4475
C04125% OMC28280.1900
C05125% OMC28480.4150
C06125% OMC28690.7188
C07135% OMC28280.2262
C08135% OMC28480.5188
C09135% OMC28690.8600
C10125% OMC14480.7088
C11125% OMC56480.3337
Table 3. Strength parameters and matric suction of silt with different moisture contents.
Test Moisture
Content
w (%)
Cohesive Force
C (kPa)
Friction
Angle
φ (°)
Test Degree of
Saturation
S (%)
Corresponding Matric
Suction
ψ m (kPa)
110% OMC35.432.469.0514.11
125% OMC29.133.478.577.52
135% OMC23.932.685.222.36
Table 4. Comparison between the models in Xiao’s model, H. Jamali’s model and this study.
Test Numberw (%) σ 3 (kPa) σ d (kPa) Axial   Permanent   Strain   at   10,000   Cycles   ε p 10,000 (%)
MeasuredXiao’s ModelH. Jamali’s ModelThis Study
EstimatedError (%)EstimatedError (%)EstimatedError (%)
C01110% OMC28280.07500.1592112.30.2058174.40.108244.3
C02110% OMC28480.24750.1776−28.20.356844.20.2085−15.8
C03110% OMC28690.44750.2424−45.80.688753.90.4091−8.6
C04125% OMC28280.19000.357488.10.20588.30.19422.2
C05125% OMC28480.41500.3989−3.90.3568−14.20.3742−9.8
C06125% OMC28690.71880.5443−24.30.6887−4.20.73442.2
C07135% OMC28280.22620.6163172.50.2058−9.00.255012.7
C08135% OMC28480.51880.687732.60.3568−31.20.4914−5.3
C09135% OMC28690.86000.93849.10.6887−19.90.964212.1
Table 5. Comparison between the test data in Elliott et al.’s work and this study.
Test Numberw (%) σ 3 (kPa) σ d (kPa) Axial   Permanent   Strain   at   10,000   Cycles   ε p 10,000
MeasuredElliott et al.This Study
EstimatedError (%)EstimatedError (%)
A-8-1105% OMC21280.90831.094420.50.92591.9
A-8-2105% OMC21411.71651.921411.91.5663−8.8
A-8-3105% OMC21624.01693.7431−6.83.6574−8.9
A-9-1110% OMC21282.06621.7749−14.11.8481−10.6
A-9-2110% OMC21413.17463.25822.63.1265−1.5
A-9-3110% OMC21627.02596.5662−6.57.30023.9
A-10-1120% OMC21283.49373.64754.43.69245.7
A-10-2120% OMC21417.51696.9900−7.06.2467−16.9
A-10-3120% OMC216213.386314.55548.714.58589.0
A-1-1105% OMC21282.50002.972718.92.72599.0
A-1-2105% OMC21415.10004.3503−14.74.2664−16.3
A-1-3105% OMC21628.52006.9452−18.58.78693.1
A-2-1110% OMC21283.02004.024433.33.681121.9
A-2-2110% OMC21416.78006.1350−9.55.7613−15.0
A-2-3110% OMC216211.490010.0984−12.111.86583.3
A-3-1120% OMC21285.93005.5286−6.85.5913−5.7
A-3-2120% OMC21418.79008.6773−1.38.7510−0.4
Disclaimer/Publisher’s Note: The statements, opinions and data contained in all publications are solely those of the individual author(s) and contributor(s) and not of MDPI and/or the editor(s). MDPI and/or the editor(s) disclaim responsibility for any injury to people or property resulting from any ideas, methods, instructions or products referred to in the content.

