Article

Eco-Environmental Quality Assessment Using the Remote Sensing Ecological Index in Suzhou City, China

1
School of Environment and Surveying Engineering, Suzhou University, Suzhou 234000, China
2
Graduate School, Angeles University Foundation, Angeles 2009, Philippines
3
3S Technology Application Research Center in Northern Anhui, Suzhou 234000, China
*
Authors to whom correspondence should be addressed.
Sustainability 2023, 15(17), 13158; https://doi.org/10.3390/su151713158
Submission received: 22 July 2023 / Revised: 29 August 2023 / Accepted: 30 August 2023 / Published: 1 September 2023

Abstract

:
This study utilizes four environmental indicators derived from six-phase Landsat images (TM, OLI, and TIRS) to construct a remote sensing ecological index (RSEI) and to quantitatively and comprehensively assess the spatiotemporal changes in the eco-environmental quality (EEQ) of Suzhou City, China. The environmental indicators consist of the wetness index (WI), greenness index (GI), dryness index (DI), and heat index (HI). The obtained results showed: (1) positive effects of the WI and GI, as well as negative effects of the DI and HI, on the EEQ of Suzhou City in the 2002–2022 period. The GI was observed to have the greatest impact on the RSEI of Suzhou City. (2) The average RSEI values of Suzhou City exhibit a “W” shape pattern in the 2002–2022 period. The lowest and highest average RSEI values were 0.632 and 0.746, respectively, while the average annual RSEI value was 0.702. The EEQ of Suzhou City was observed to be at a relatively good level. (3) The EEQ of Suzhou City exhibits sharp declines in the periods of 2006–2010 and 2014–2018, for which the degraded RSEI area covers 440.60 and 404.16 km2, while the area ratios are 56.13% and 51.48%, respectively. The EEQ of Suzhou City has substantially increased during the periods of 2010–2014, 2018–2022, and 2002–2022, showing improved RSEI areas of 583.7, 390.13, and 347.02 km2 and area ratios of 74.36%, 49.70%, and 44.21%, respectively. The results of this study provide a scientific basis for the protection, utilization, and development of the ecological environment (EE) of Suzhou City. They also provide valuable references and data support for the sustainable development, the high-quality development of the EE, and the construction of the ecological civilization of Suzhou City. The policymakers of environmental protection departments in Suzhou City can use this study’s inferences to devise local environmental protection policies.

1. Introduction

The ecological environment (EE) is a natural-economic-social complex ecosystem [1]. A good EE plays a vital role in promoting social stability, ecological civilization construction, ecological security, and sustainable development [2,3,4]. The eco-environmental quality (EEQ) is a concrete aspect of the EE that is closely related to human activities. Effective scientific monitoring and quantitative evaluation of the urban EEQ are crucial for protecting the urban EE, harmonious development between human beings and nature, and the sustainable development of society [5]. Remote sensing technology has become an essential tool for monitoring and assessing EEQ due to its wide range of information acquisition, real-time monitoring, high precision, convenience, objectivity, large-scale coverage, rapidity, and periodicity [6,7,8,9]. In practice, remote sensing technology has been extensively applied in EE monitoring and evaluation. The Ministry of Ecology and Environment of the People’s Republic of China promulgated the “Technical Criterion for Eco-environmental Status Evaluation [1]” and “Technical Criterion for Ecosystem Status Evaluation [8]” in 2006 and 2015 [10,11], respectively, suggesting the application of the EE index (Ecological Index, EI) to evaluate the regional EE. Numerous scholars have indicated that the EI index only has a single value. However, besides the subjectivity of the index weight determination, the acquisition of statistical data is complex, the indicators are not uniform, and the differences between the data can be substantial [12,13]. To address the above-mentioned limitations, Xu [14,15] proposed the Remote Sensing-based Ecological Index (RSEI) to quantitatively evaluate the quality of regional EE. Compared to the EI index, the RSEI offers scalability, visualization, and comparability. The data are readily accessible, and RSEI maintains good data currency. The involved indicators are easy to calculate and share the same value ranges. Additionally, the index weight and threshold settings are not influenced by human intervention, resulting in objective evaluation results [16]. The RSEI presents an efficient and timely regional EEQ monitoring and evaluation method. It has been widely used, yielding good evaluation results [8,13,17,18,19,20]. Boori et al. [21] employed TM, ETM+, OLI, and TIRS images as data sources and the Samara region of Russia as their study area. They analyzed the EEQ of the Samara region of Russia from 2010 to 2020 using the RSEI. Overall, the EEQ improved, and four methods were utilized to verify its accuracy. Saleh et al. [22] used TM and OLI images and the RSEI to analyze the spatiotemporal changes in the EEQ of the metropolitan city of Isfahan (Iran) in 2004–2019 and analyzed the RSEI’s spatial heterogeneity using the Moran index. Li et al. [4] employed TM, OLI, and TIRS images as data sources to analyze the spatiotemporal changes in the EEQ in the Hetao irrigation area over the 2010–2020 period using the RSEI, highlighting an increase in the average RSEI value by 12% from 0.45 in 2010 to 0.57 in 2020, thus suggesting a gradual improvement in the EEQ in the study area. Liang et al. [14] utilized ETM and OLI images as data sources to investigate the spatiotemporal changes in the EEQ and their driving factors in the Yuanmou dry-hot valley of China in the 2000–2020 period using the RSEI, principal component (PC) analysis, and geographic detectors. Hu et al. [17] applied the RSEI using Landsat image data from 2014 and 2018 to quantitatively evaluate the EEQ in Sanya City, indicating a worse EEQ in Sanya City in the 2014–2018 period. They analyzed the reasons for the deterioration of the EEQ in the study area. In addition, the PLUS model was applied to simulate the land use changes in Sanya City, achieving an overall simulation accuracy of 92.75%. Wang et al. [20] used the long-term Landsat image series (1990–2019) and Google Earth Engine to assess the EEQ in Golmud, Qinghai Province, using the RSEI, indicating a degradation of the EEQ in Golmud over the 1990–2019 period. In addition, the mutation test was performed using the Mann-Kendall model and a good effect was achieved. Miao and Liang [23] utilized the Landsat satellite image series from 2000, 2009, and 2017 to quantitatively assess the spatiotemporal changes in the EEQ and their influencing factors in the Yongjiang river basin using the RSEI. The results showed that the EEQ of the Yongjiang river basin deteriorated gradually from 2000 to 2009 and was effectively improved from 2009 to 2017. The EEQ deterioration of the Yongjiang river basin was mainly due to the substantial increase in impermeable surface and a large-scale reduction in vegetation. However, few studies have quantitatively evaluated the EEQ of Suzhou City, Anhui Province, China. Moreover, these studies primarily relied on statistical data, the Pressure–State–Response (PSR) model, and the entropy-weighted matter-element model [24].
Accordingly, there is still a lack of quantitative studies on the EEQ in Suzhou City using remote sensing data and the RSEI. Therefore, to better understand the EEQ in Suzhou City and further quantitatively assess its spatiotemporal changes, the RSEI in this study is applied using long-term Landsat image series of the urban planning area of Suzhou City in 2002, 2006, 2010, 2014, 2018, and 2022. In addition, the environmental quality status of Suzhou over the past 21 years is discussed based on the greenness index (GI), wetness index (WI), dryness index (DI), and heat index (HI). At the same time, the RSEI is utilized to dynamically monitor and quantitatively evaluate the EEQ in Suzhou City and to analyze the spatiotemporal changes in the EEQ of Suzhou City.

2. Materials and Methods
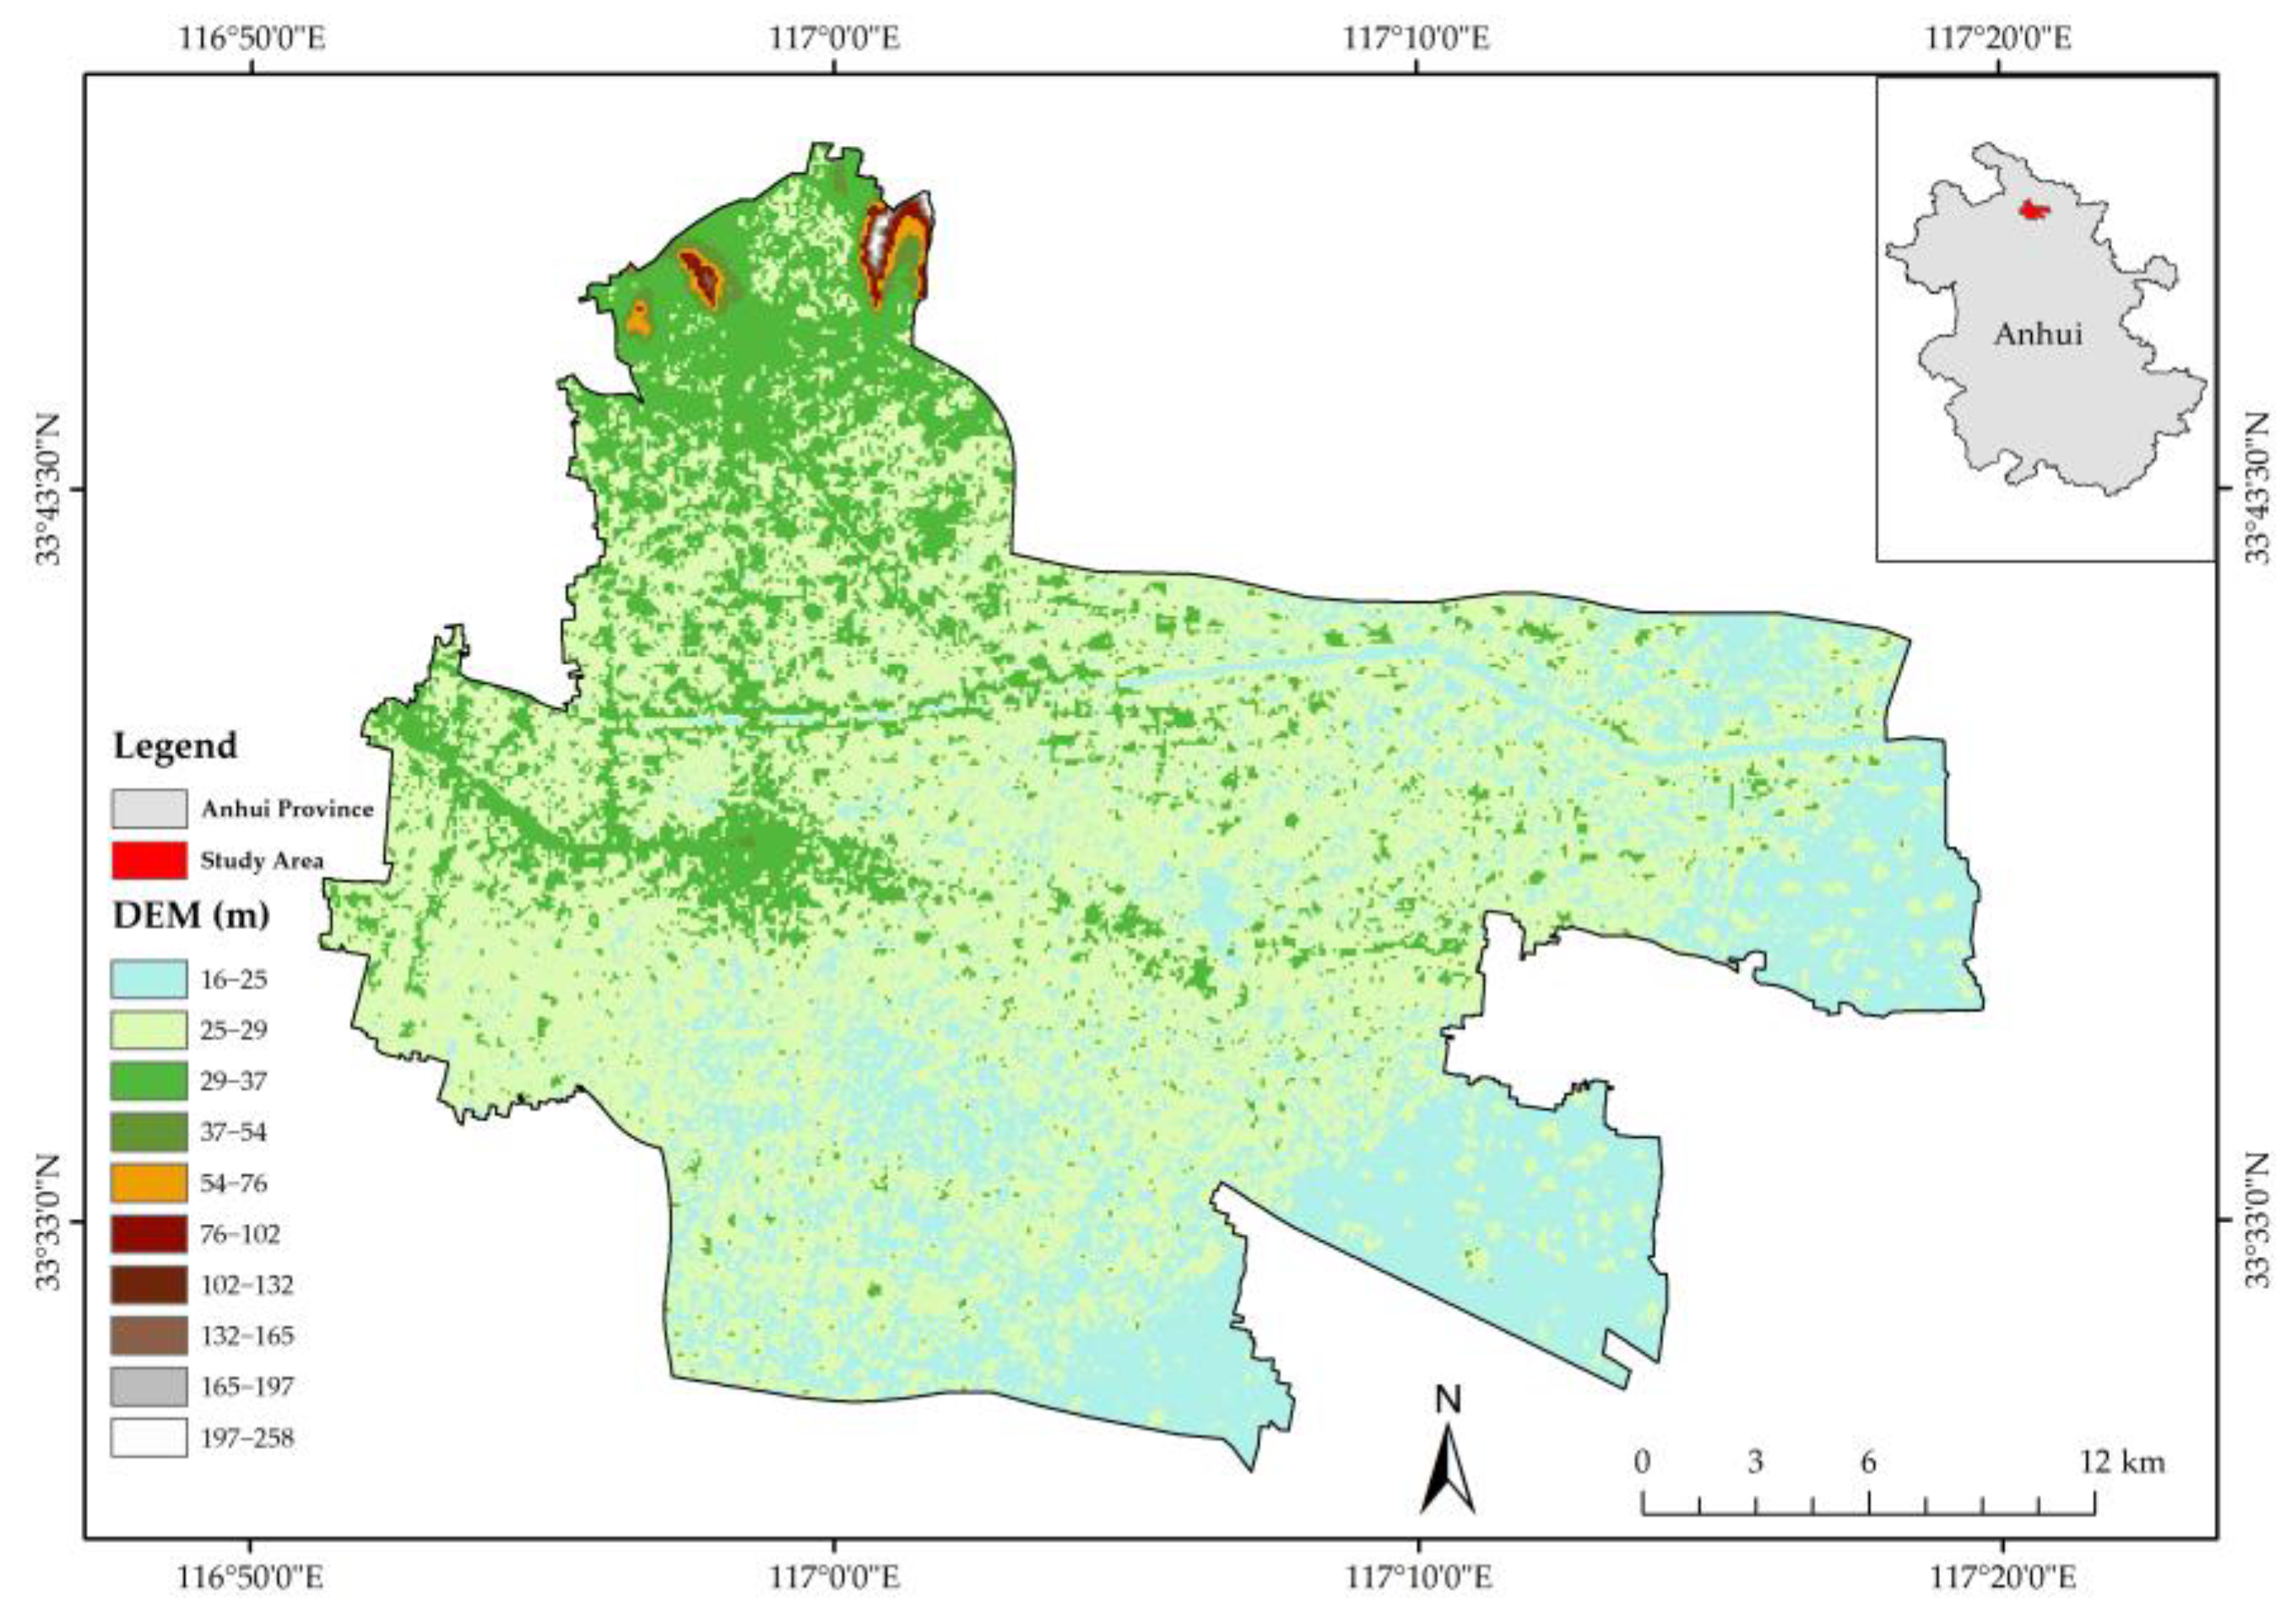
2.1. Study Area

Suzhou City is located in the northern part of Anhui Province, bordered by the Anhui, Shandong, Jiangsu, and Henan provinces. Suzhou City in Anhui Province is the nearest city to the sea. This city is also one of the main cities in the Huaihai Economic Cooperation Zone, including four counties (Xiao, Lingbi, Dangshan, and Si) and one district (Yongqiao), and covering a total area of 9939 km2. The transportation in Suzhou City is very convenient. There are three railway lines (Beijing-Shanghai, Longhai, and Suhuai), one high-speed railway line (Beijing-Shanghai), and three expressway lines (Lianhuo, Jingfu, and Sixu) in Suzhou City. Suzhou City is rich in coal resources and is one of China’s 13 large-scale coal bases. It also has abundant marble and dolomite reserves, and Lingbi stone, in Souzhou, ranks first among China’s four major stone formations [25]. In 2022, the gross domestic product (GDP) of Suzhou City was estimated at 222.46 billion CNY, while the resident population and urbanization rate were 5.30 million and 46.38%, respectively. The urban planning area of Suzhou City considered in this study covers a total area of 785 km2. The geographical location of Suzhou City is shown in Figure 1.

2.2. Data Source and Preprocessing

This study collected satellite images of Suzhou City from the United States Geological Survey website [26]. The collected images consisted of three scenes of TM and three scenes of OLI and TIRS, with a tracking number of 121/037. The time interval of the images was four years, while the cloud cover of the collected satellite images was below 2%. The satellite image attributes are listed in Table 1. The satellite images were first preprocessed using radiometric calibration and Fast Line-of-Sight Atmospheric Analysis of Spectral Hypercubes (FLAASH) atmospheric correction in ENVI 5.6 software and then cropped based on the vector boundary files of Suzhou City. In order to avoid the influence of water body information on the PC loads, the modified normalized difference water index ( M N D W I ) was utilized to mask the water body information of Suzhou City using the following formula [27,28]:
M N D W I = ρ G ρ N I R ρ G + ρ N I R ,
where ρ R and ρ N I R   are the reflectance of the green and near-infrared bands, respectively.

2.3. Construction of the RSEI

According to Xu [15], the RSEI is a comprehensive index integrating four factors, namely WI, GI, DI, and HI [17].
(1)
Wetness Index
The WI is closely related to the EEQ and can exhibit a strong sensitivity to vegetation and soil moisture following the Kauth–Thomas transformation. The W E T component can describe the WI. The W E T can be calculated based on the TM and OLI image data using Equations (2) and (3), respectively [14,15].
W E T T M = 0.0315 ρ B + 0.2021 ρ G + 0.3102 ρ R + 0.1594 ρ N I R 0.6806 ρ S W I R 1 0.6109 ρ S W I R 2
W E T O L I = 0.1511 ρ B + 0.1973 ρ G + 0.3283 ρ R + 0.3407 ρ N I R 0.7117 ρ S W I R 1 0.4559 ρ S W I R 2
where ρ B , ρ G , ρ R , ρ N I R , ρ S W I R 1 , and ρ S W I R 2 are the reflectance of the blue, green, red, near-infrared, short-wave infrared 1, and short-wave infrared 2 bands, respectively.
(2)
Greenness Index
The normalized difference vegetation index ( N D V I ) often expresses the GI. The N D V I was applied to monitor the vegetation coverage and growth according to Equation (4) [14,15].
N D V I = ρ N I R ρ R ρ N I R + ρ R ,
(3)
Dryness Index
Buildings and bare soils in the urban EE are essential to urban surface desiccation. The normalized difference built-up and soil index ( N D B S I ) is half of the sum of the soil index ( S I ) and the index-based built-up index ( I B I ). The N D B S I commonly expresses the DI. The S I , I B I , and N D B S I can be determined using Equations (5), (6) and (7), respectively [14,15].
S I = ( ρ S W I R 1 + ρ R ) ( ρ N I R + ρ B ) ( ρ S W I R 1 + ρ R ) + ( ρ N I R + ρ B ) ,
I B I = 2 ρ S W I R 1 ρ S W I R 1 + ρ N I R ρ N I R ρ N I R + ρ R ρ G ρ G + ρ S W I R 1 2 ρ S W I R 1 ρ S W I R 1 + ρ N I R + ρ N I R ρ N I R + ρ R + ρ G ρ G + ρ S W I R 1 ,
N D B S I = S I + I B I 2 ,
(4)
Heat Index
Land Surface Temperature ( L S T ) is closely related to several factors, including human activities, urbanization process, and EE. The HI can be described using L S T . Numerous methods can be utilized to determine L S T , of which the atmospheric correction method is highly reliable and easy to perform. Hence, the atmospheric correction method was applied to calculate the L S T in the study area. First, the DN value of the original image was converted into radiance values ( L ) through radiometric calibration. Second, the fractional vegetation coverage ( F V C ) was calculated using Equation (4) to determine the land surface emissivity ( ε ). Finally, the black body radiance ( B T S ) and L S T values were computed. The L , F V C , ε, B T S , and L S T were determined using Equations (8)–(13) [14,15,29,30,31].
L = g a i n × D N + b i a s ,
F V C = N D V I N D V I s o i l N D V I v e g N D V I s o i l ,
ε b u i l d i n g = 0.9589 + 0.086 F V C 0.0671 F V C 2 ,
ε s u r f a c e = 0.9625 + 0.0614 F V C 0.0461 F V C 2 ,
B T S = L L T ( 1 ε ) L T ε ,
L S T = K 2 l n K 1 1 + B ( T S ) 273 ,
where L is the radiance value of the thermal infrared band; g a i n and b i a s are the gain and bias values of the band, respectively (Table 2); D N is the gray value of the image pixel; N D V I s o i l and N D V I v e g are the N D V I values of areas without and with vegetation coverage, respectively. According to Qin [31], the N D V I s o i l and N D V I v e g were set to 0.05 and 0.70, respectively; ε b u i l d i n g and ε s u r f a c e are the town and natural surface emissivity, respectively; B T S is the black body radiance value; L and L are the upward and downward radiance values of the atmosphere, respectively; T is the atmospheric transmittance. The L , L , and T values were obtained by visiting the National Aeronautics and Space Administration (NASA) website (https://atmcorr.gsfc.nasa.gov, accessed on 8 March 2023) (Table 3). ε is the land surface emissivity; K1 and K2 are the calibration coefficients (Table 2).
(5)
Normalization of Indicators
Due to the different physical meanings of the indicators and non-uniform dimensions, the data of the four indicators were normalized in this study between 0 and 1 using Equation (14).
N = I I m i n I m a x + I m i n ,
where N is the indicator value after normalization; I m a x and I m i n are the maximum and minimum values of each indicator, respectively.
In this study, the four normalized indicators were superimposed and synthesized using ENVI 5.6 software. In addition, the obtained data were first analyzed using P C analysis to obtain the first P C ( P C 1 ) before calculating the initial R S E I ( R S E I 0 ) values. The R S E I 0 values were normalized to determine the R S E I . The R S E I 0 and R S E I values were determined using Equations (15) and (16), respectively.
R S E I 0 = 1 P C 1 f ( W E T , N D V I , N D B S I , L S T ) ,
R S E I = R S E I 0 R S E I 0 m i n R S E I 0 m a x + R S E I 0 m i n ,
where f is the normalization process of each indicator; R S E I 0 m a x and R S E I 0 m i n are the maximum and minimum values of the R S E I 0 , respectively.

3. Results and Analysis

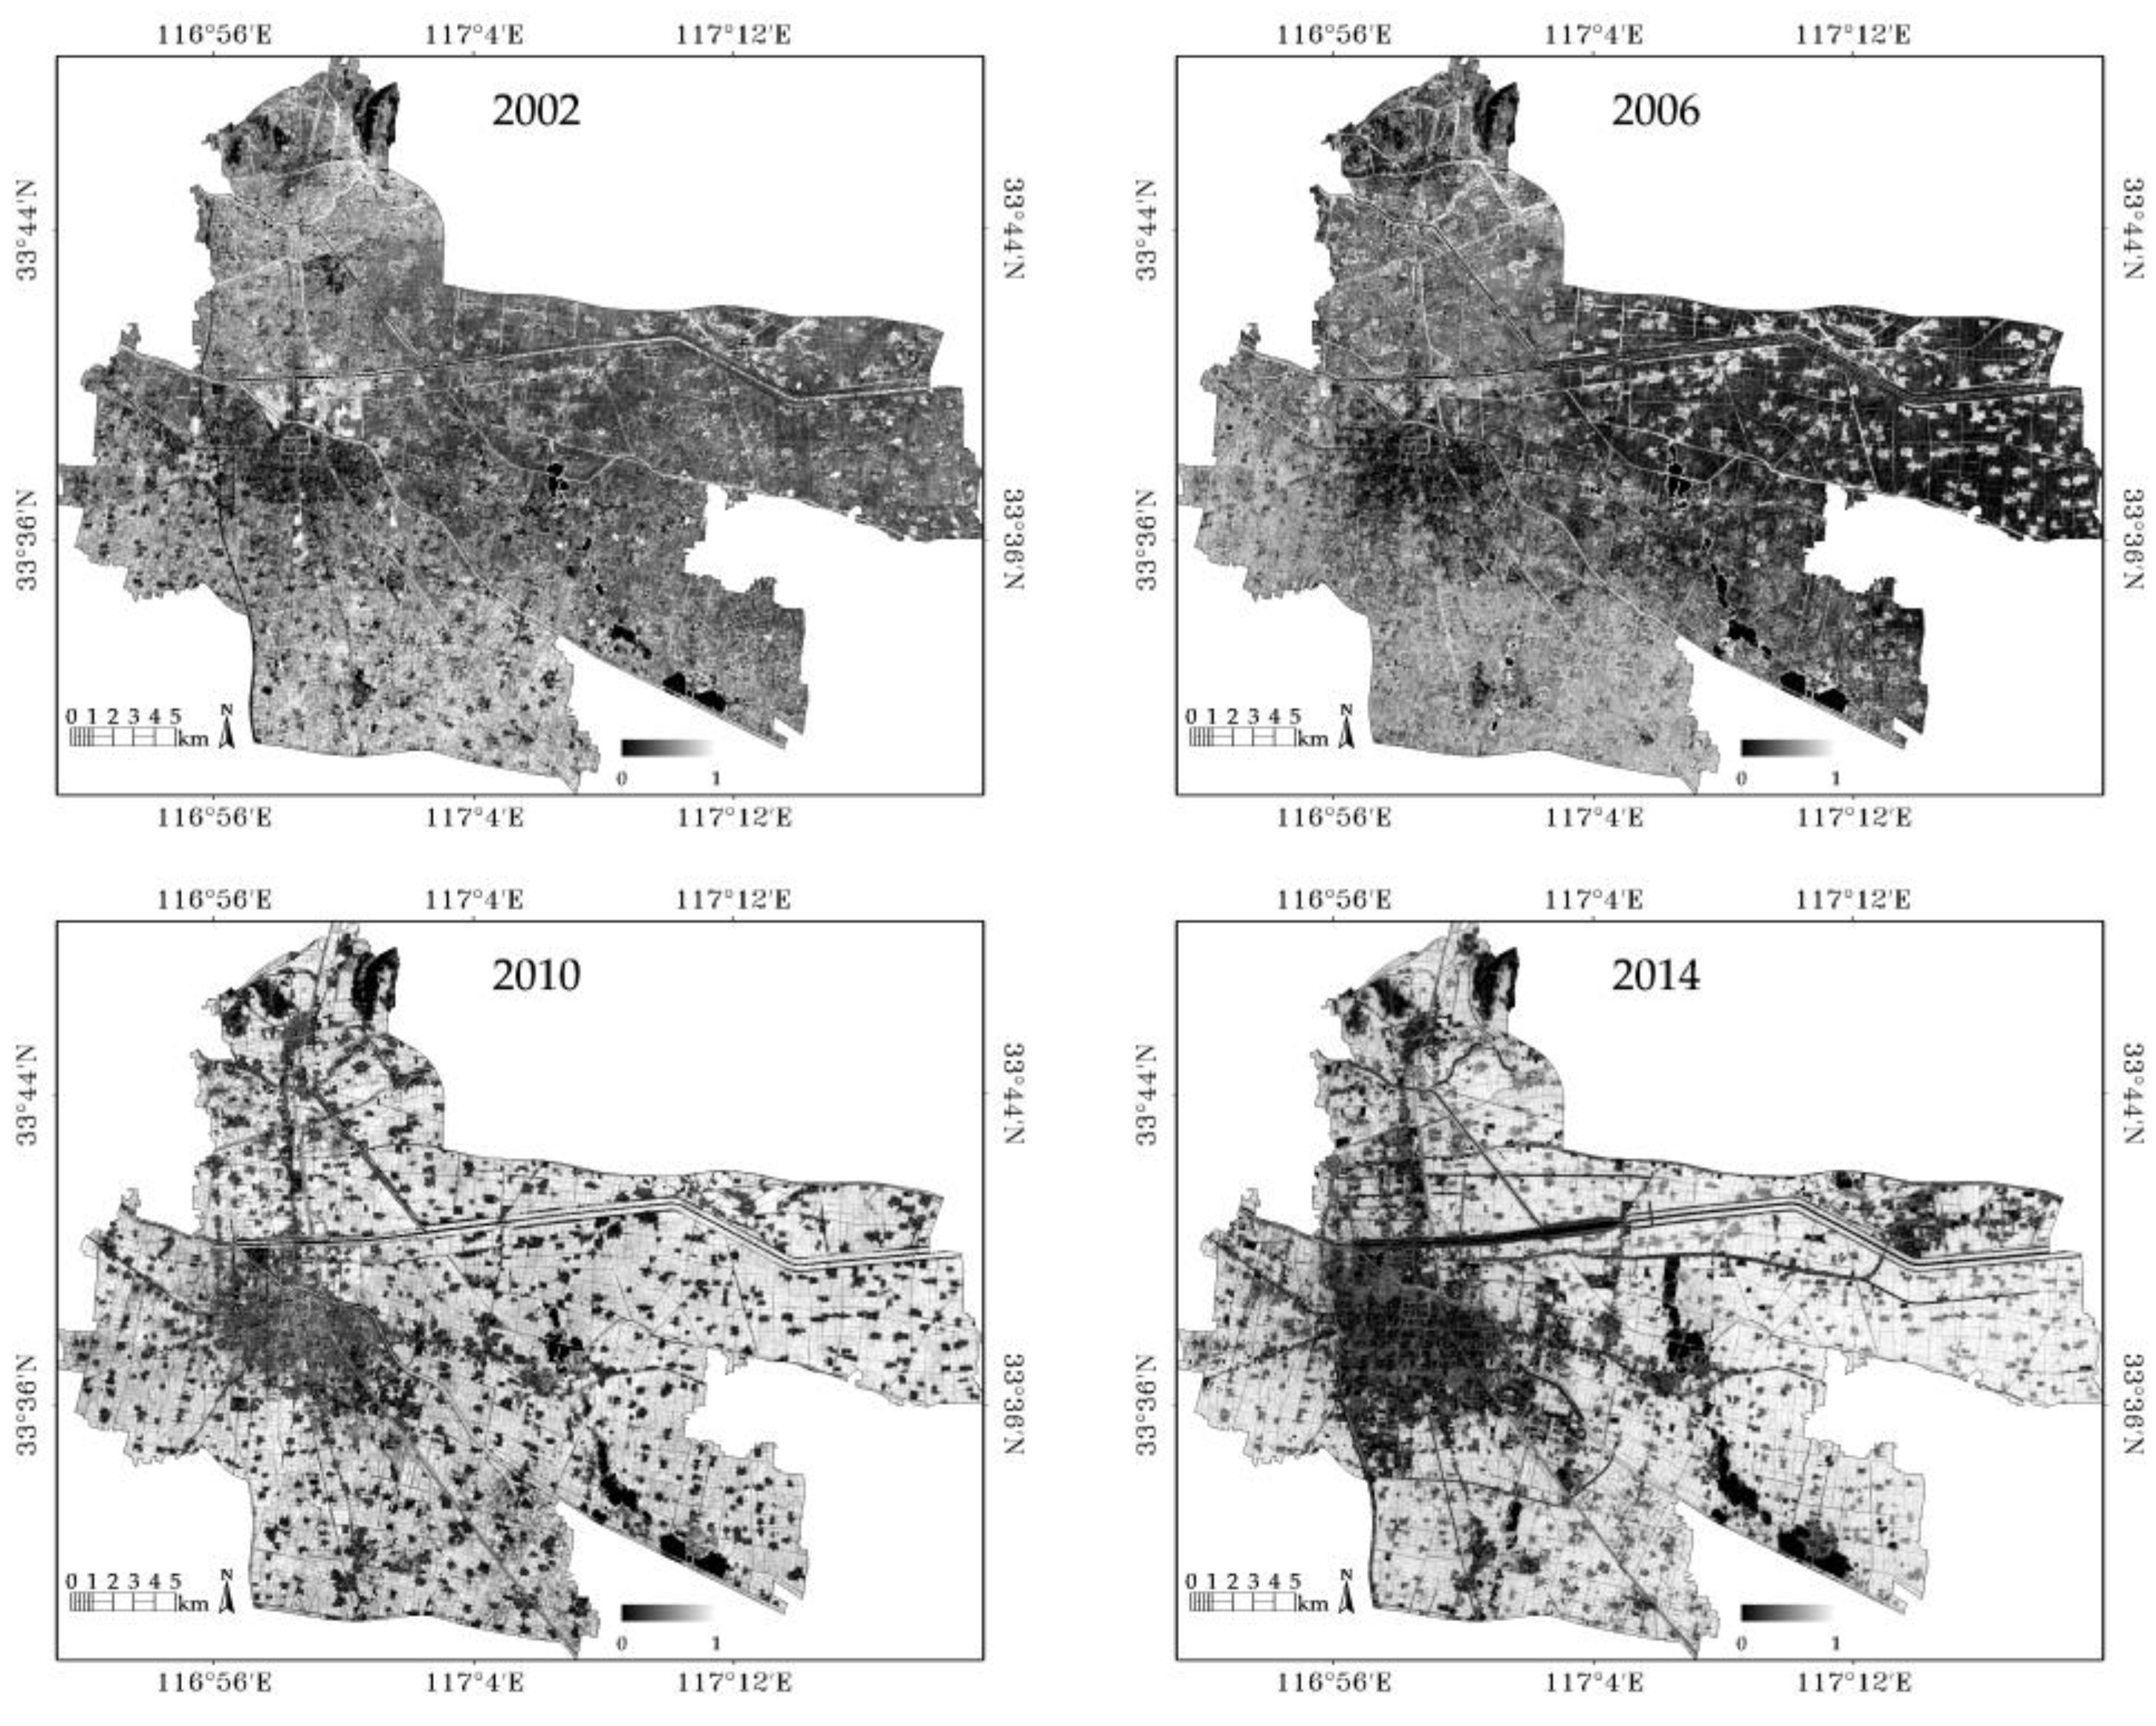
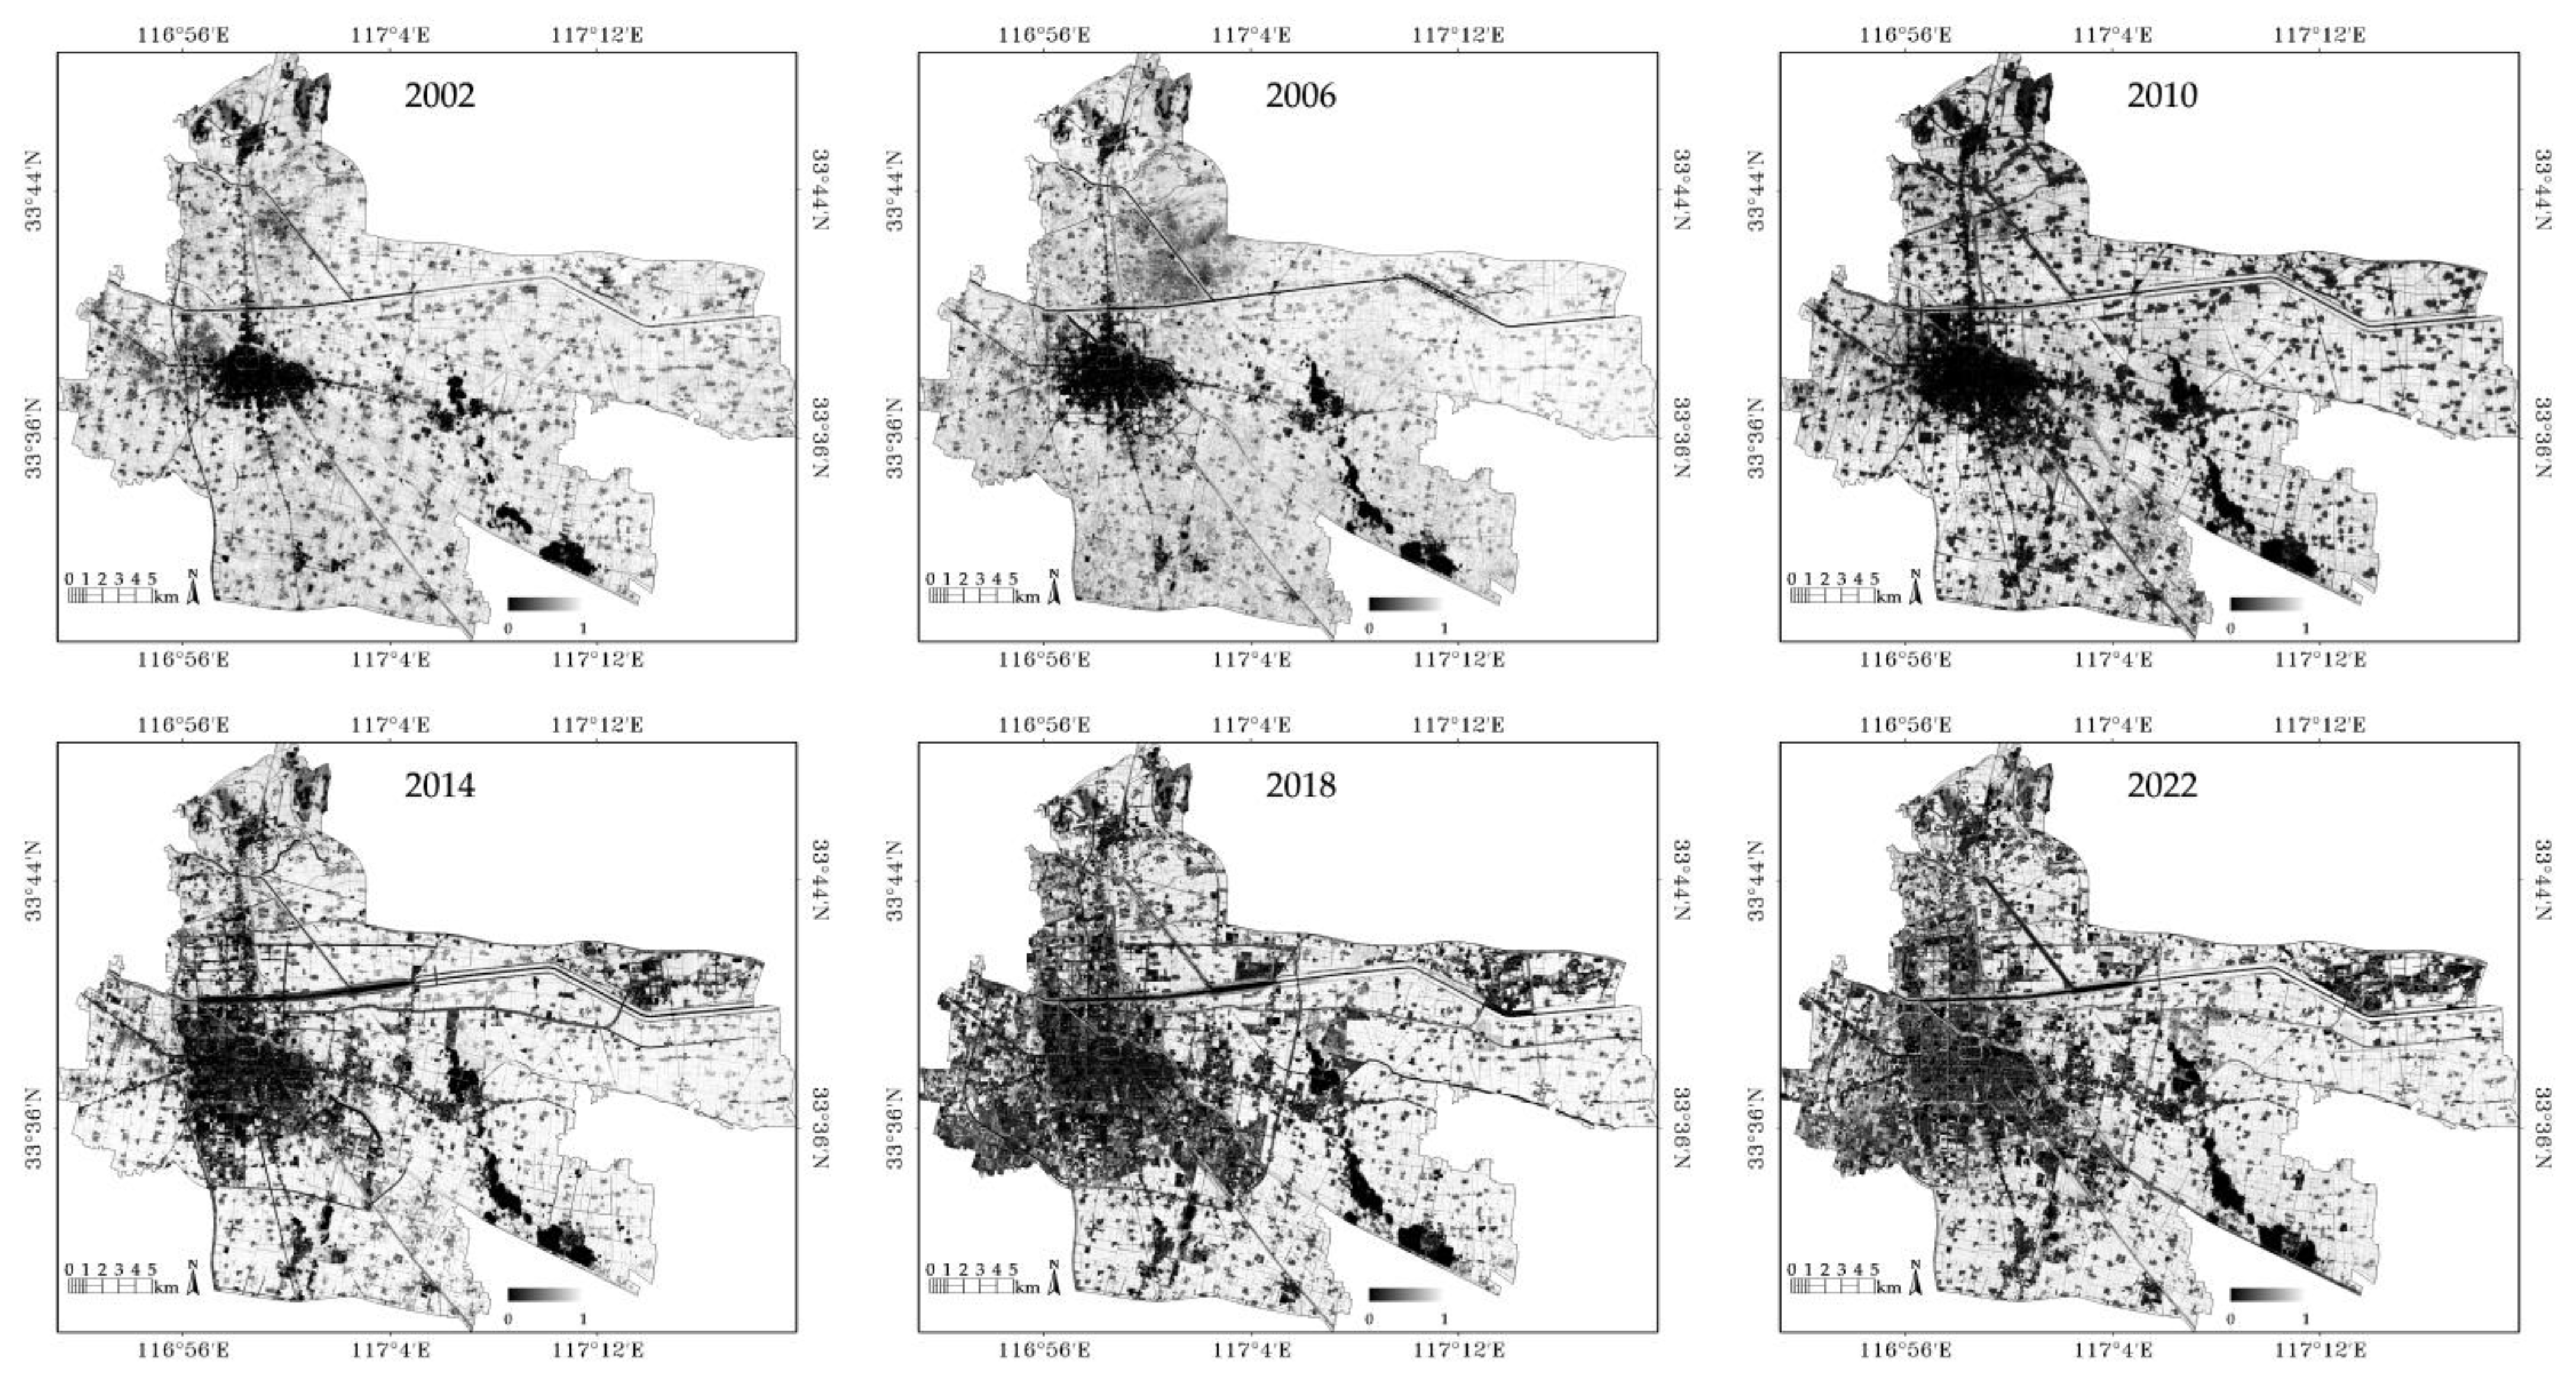
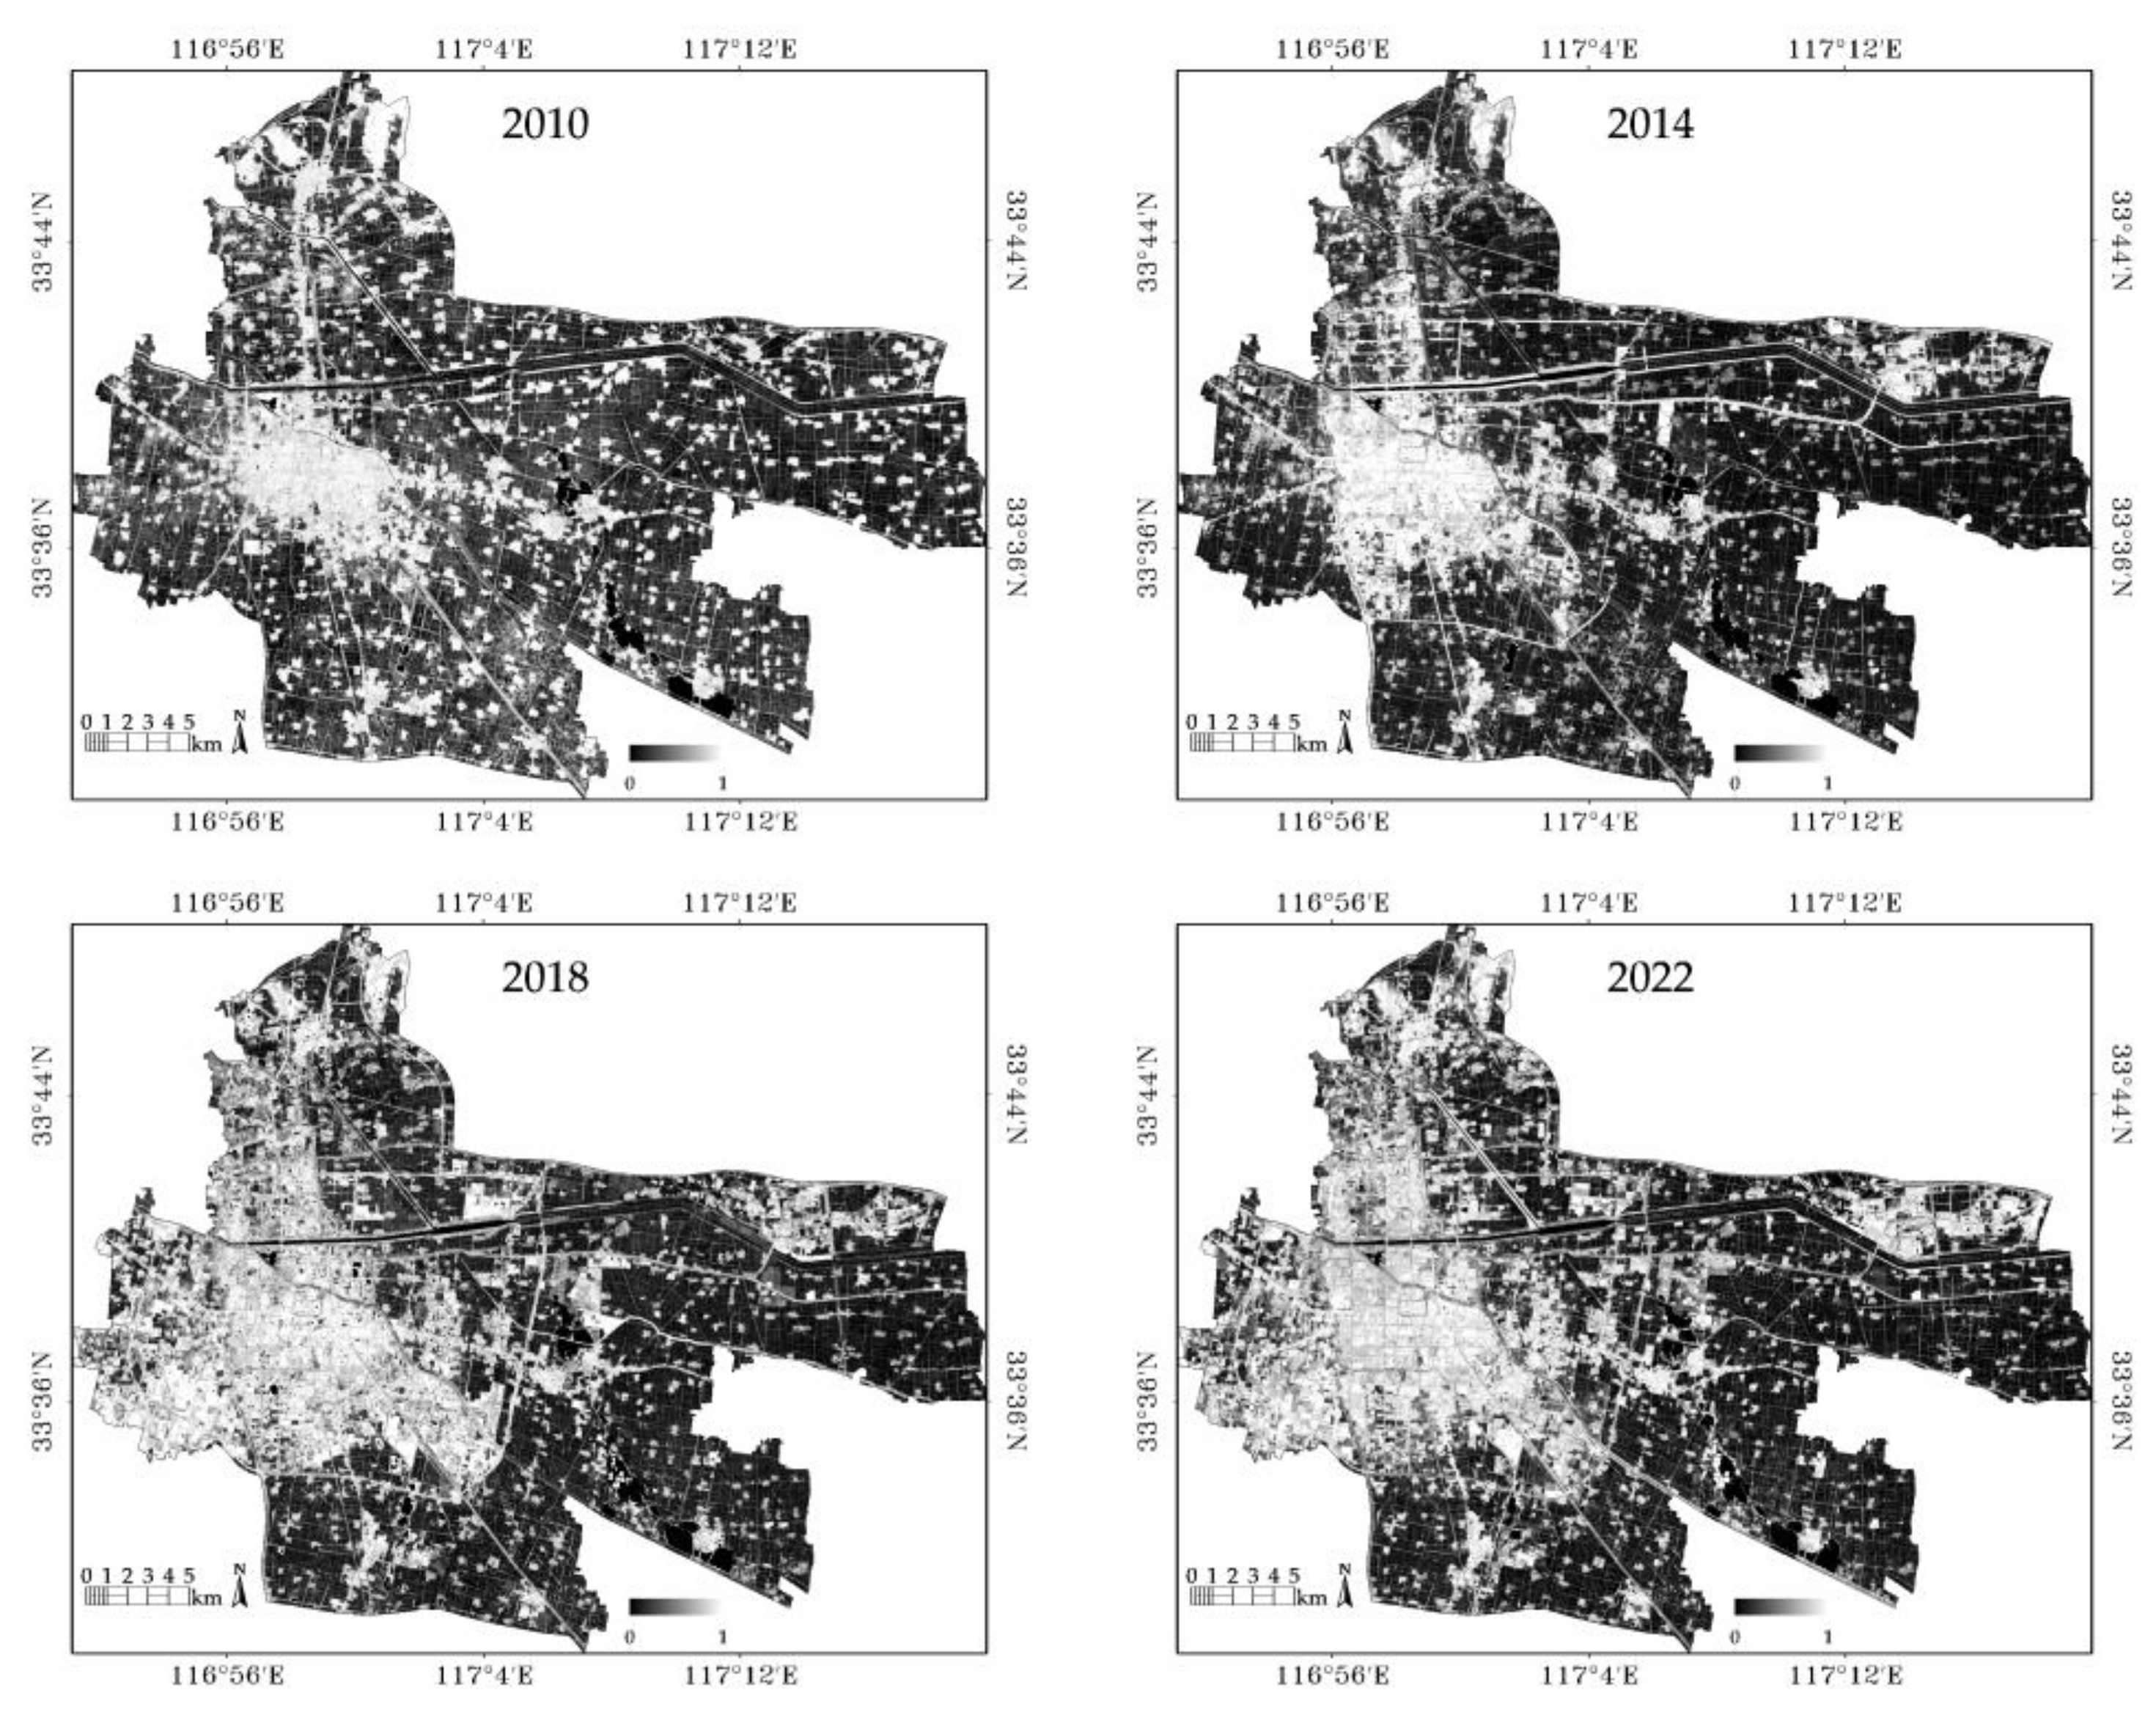
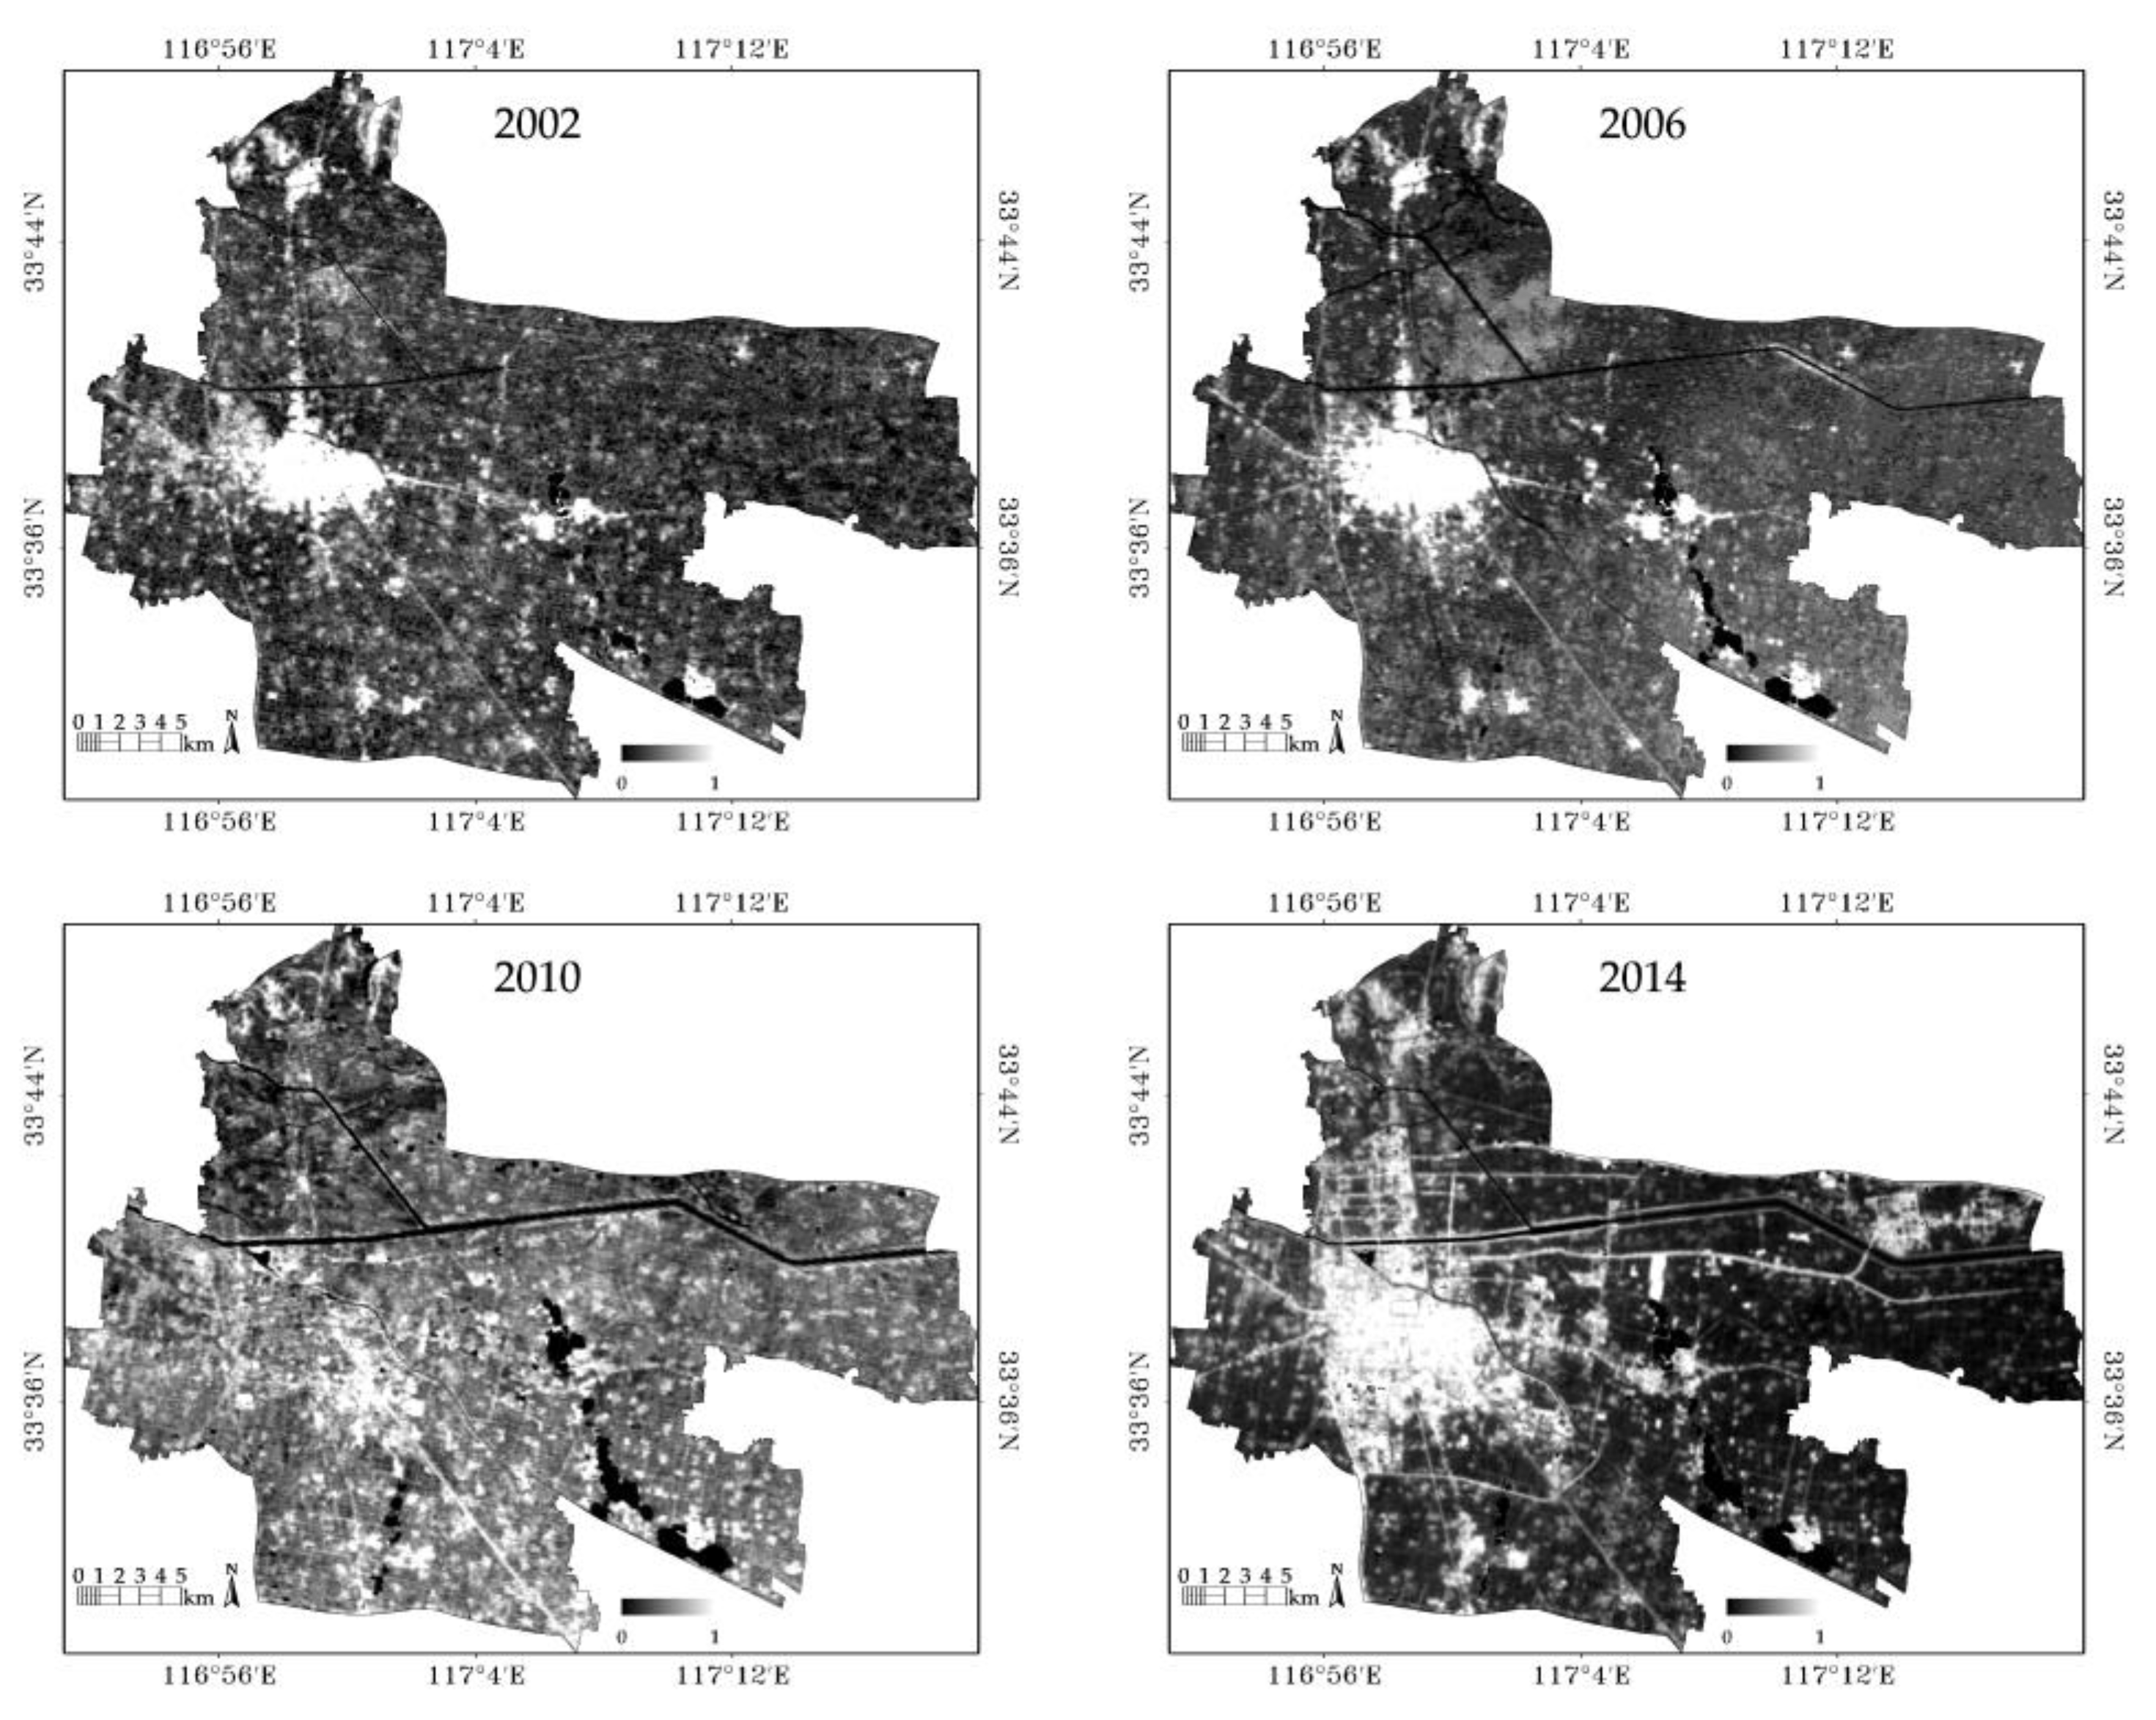
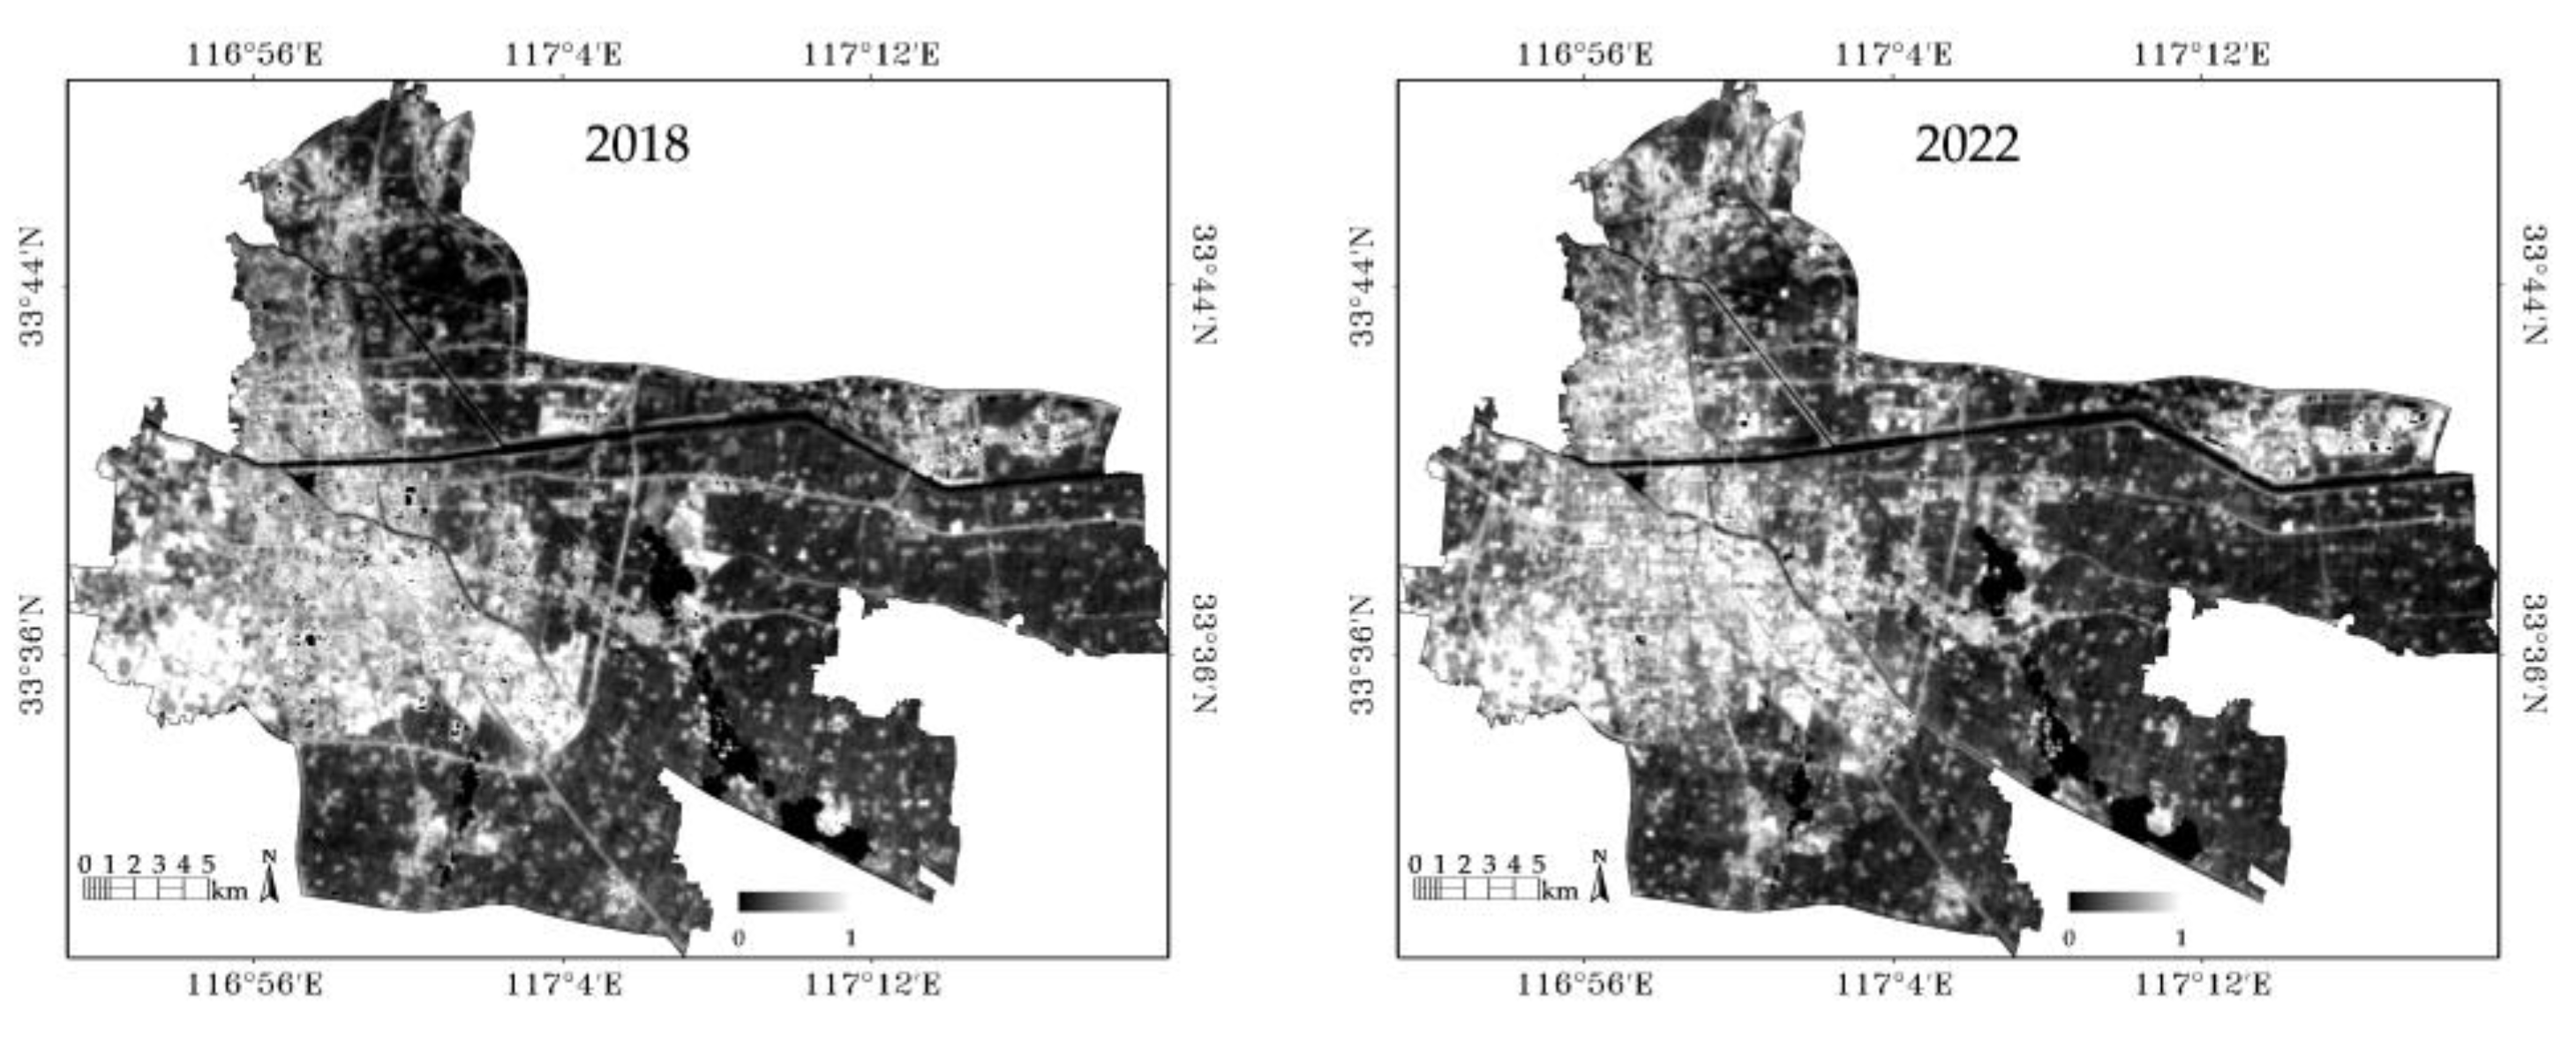
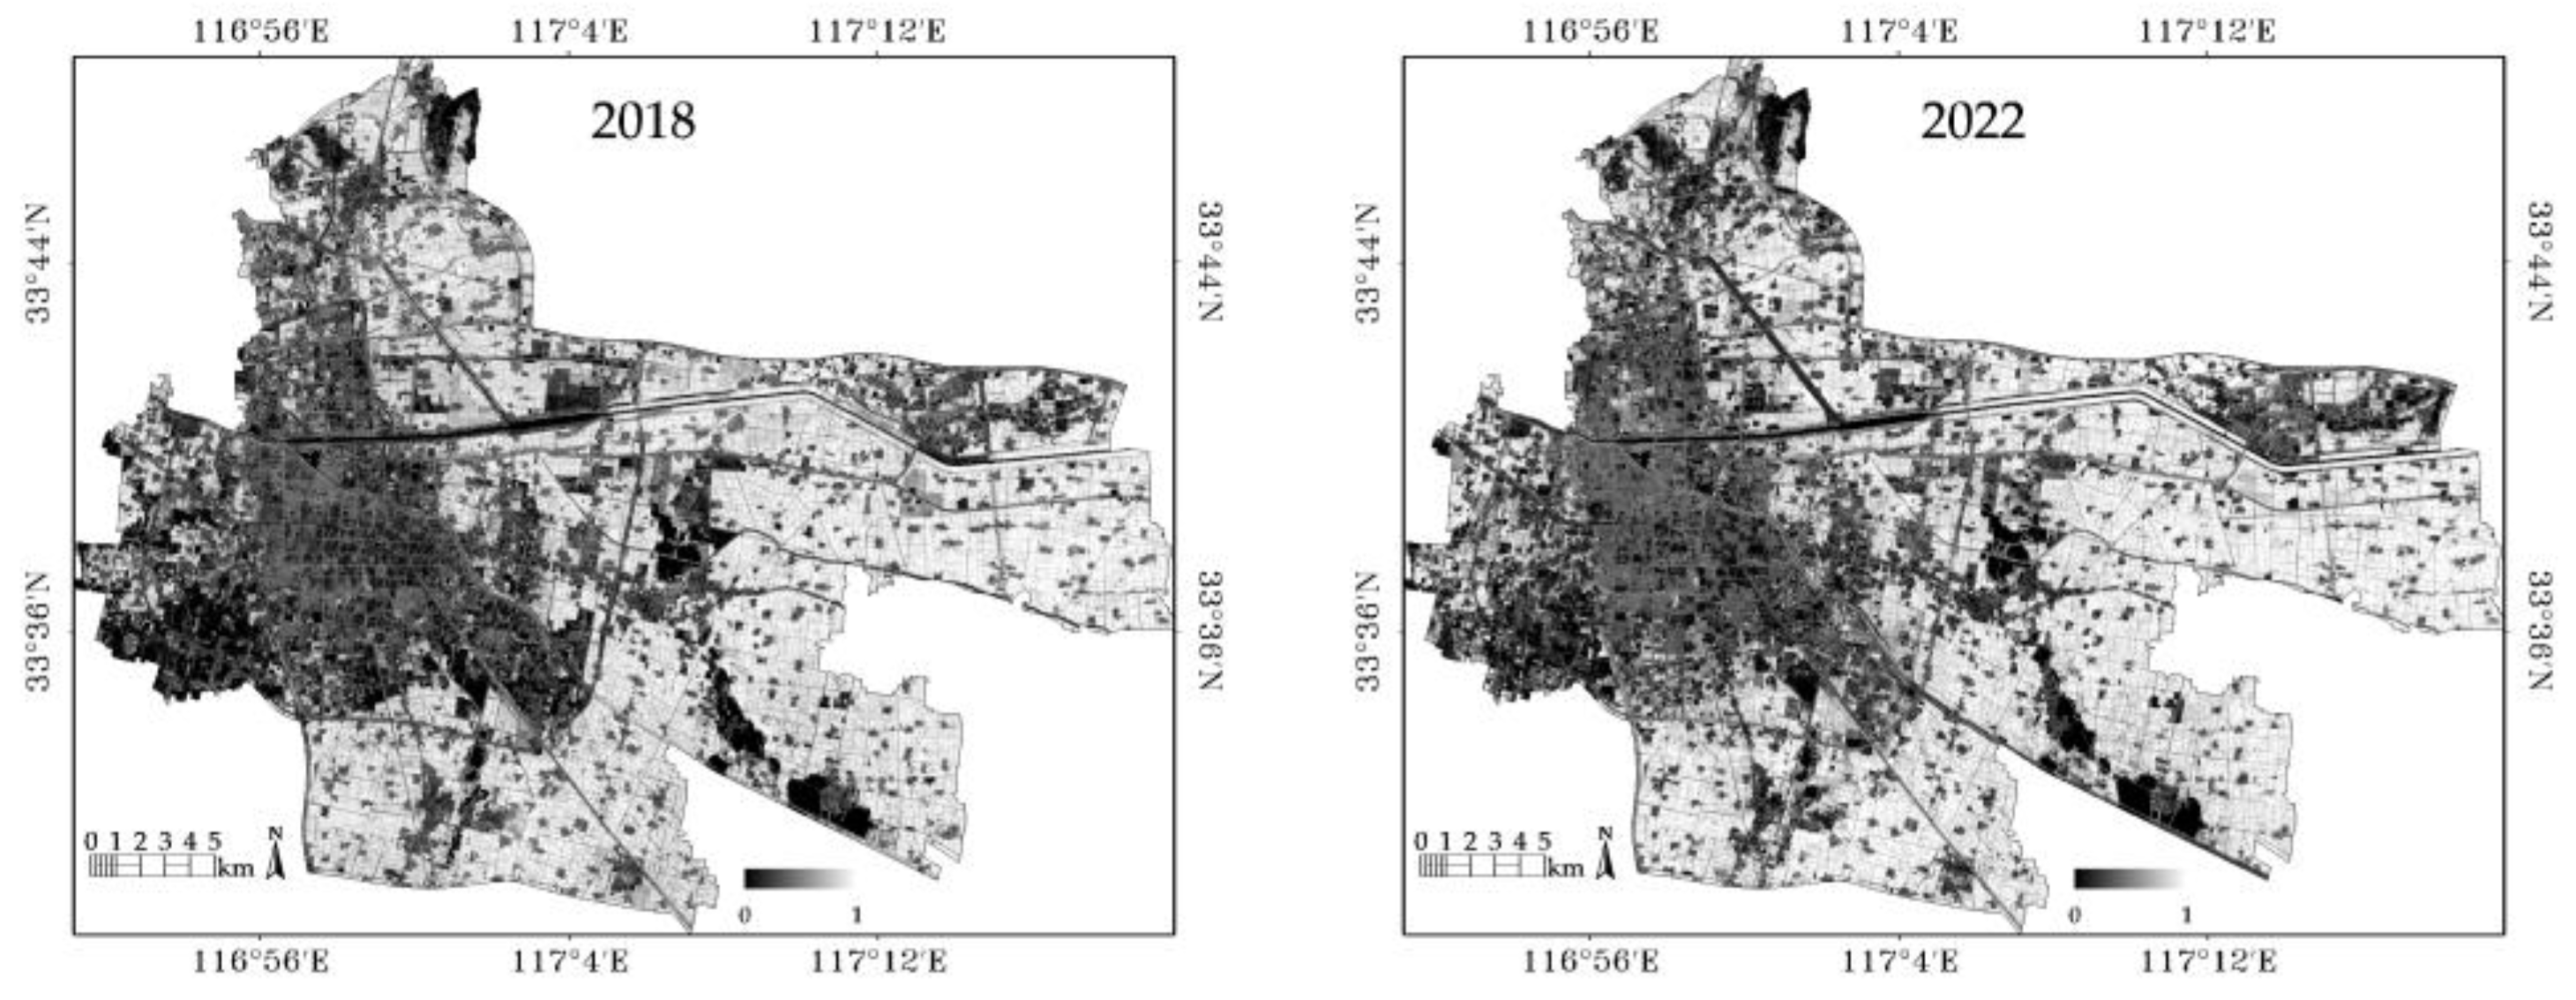
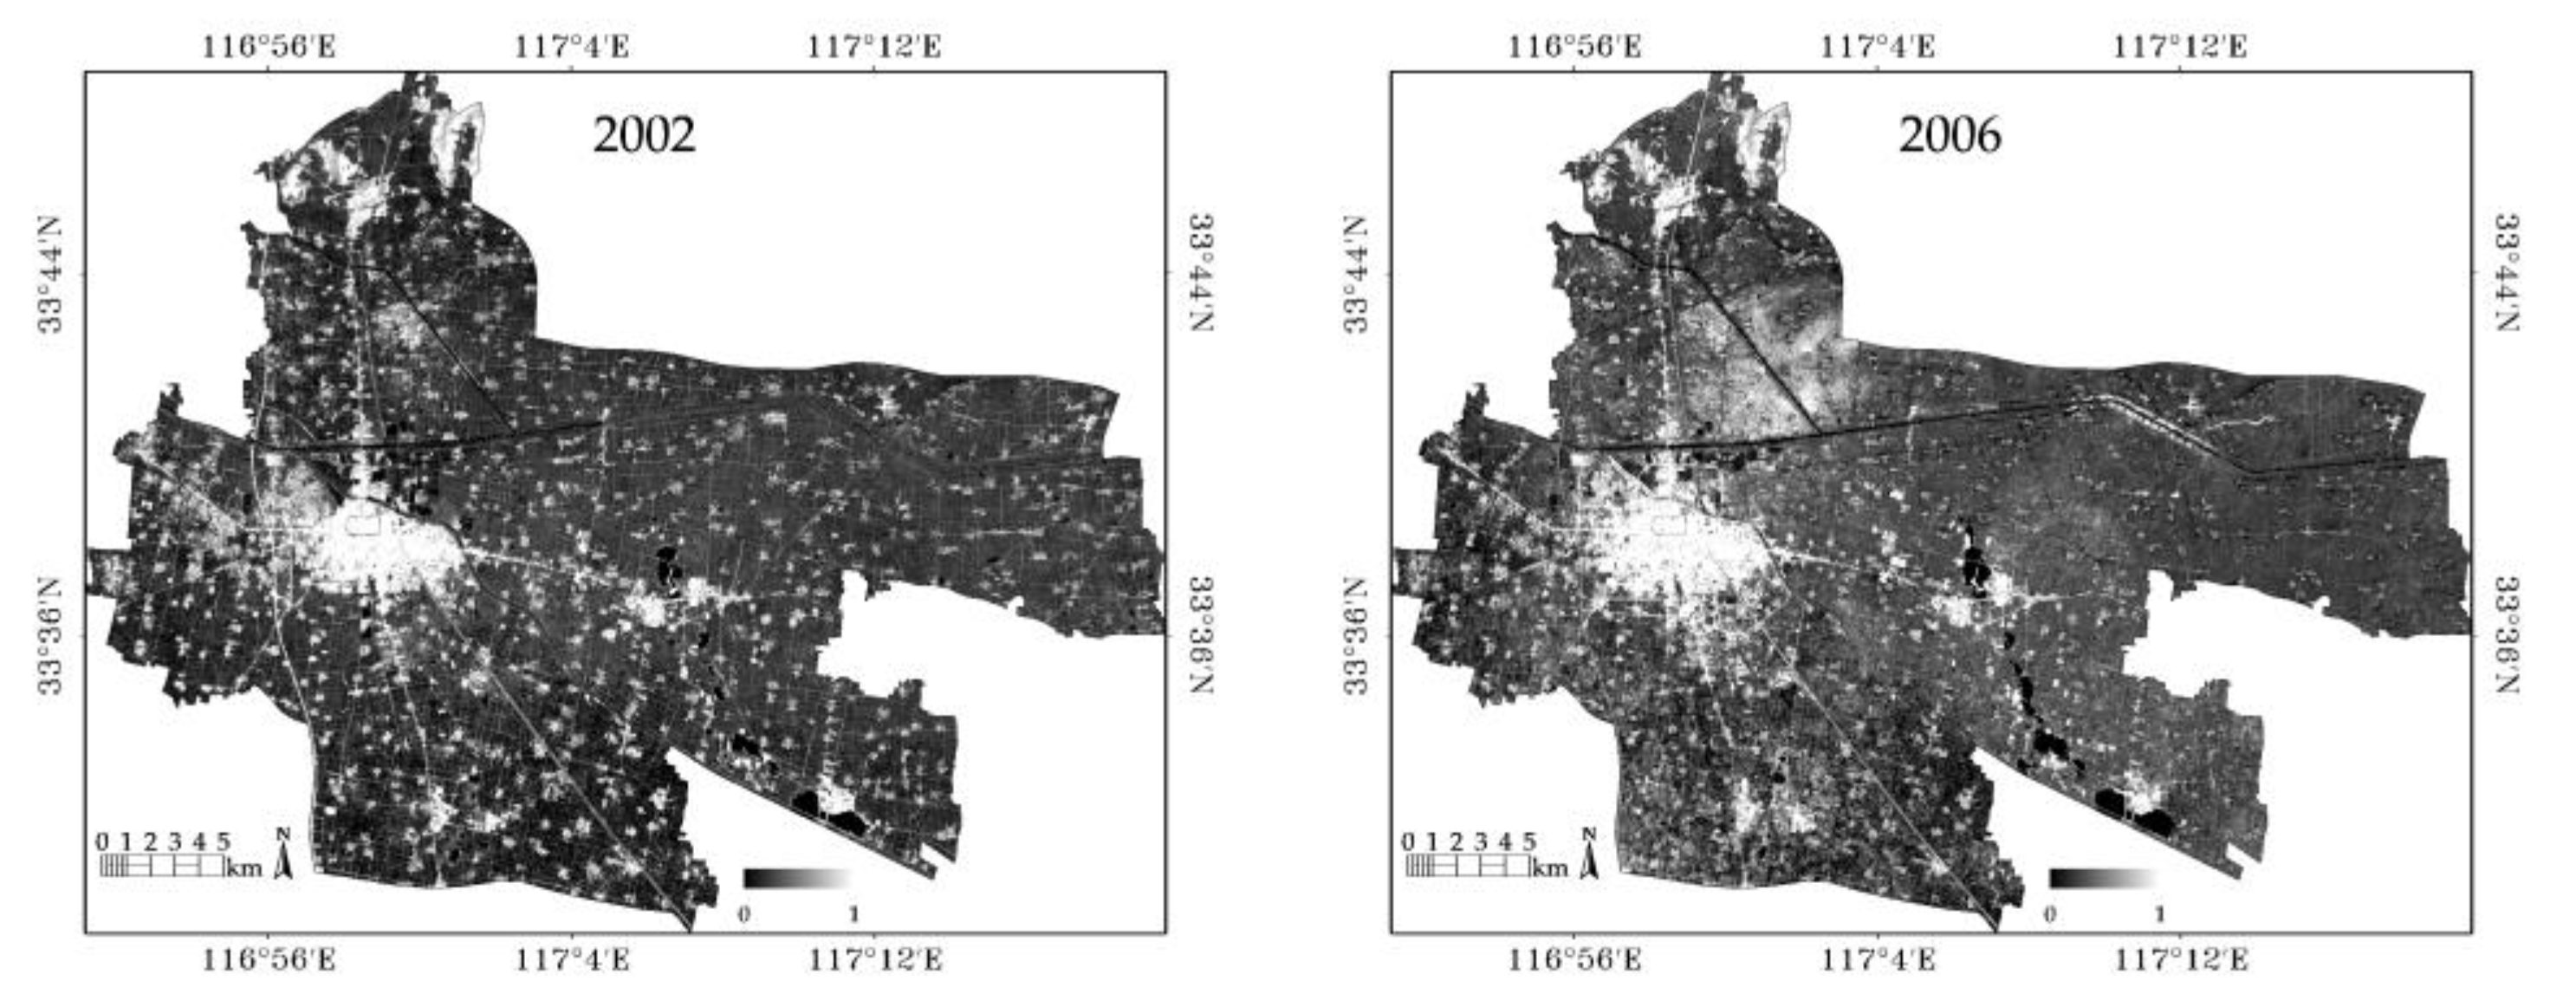
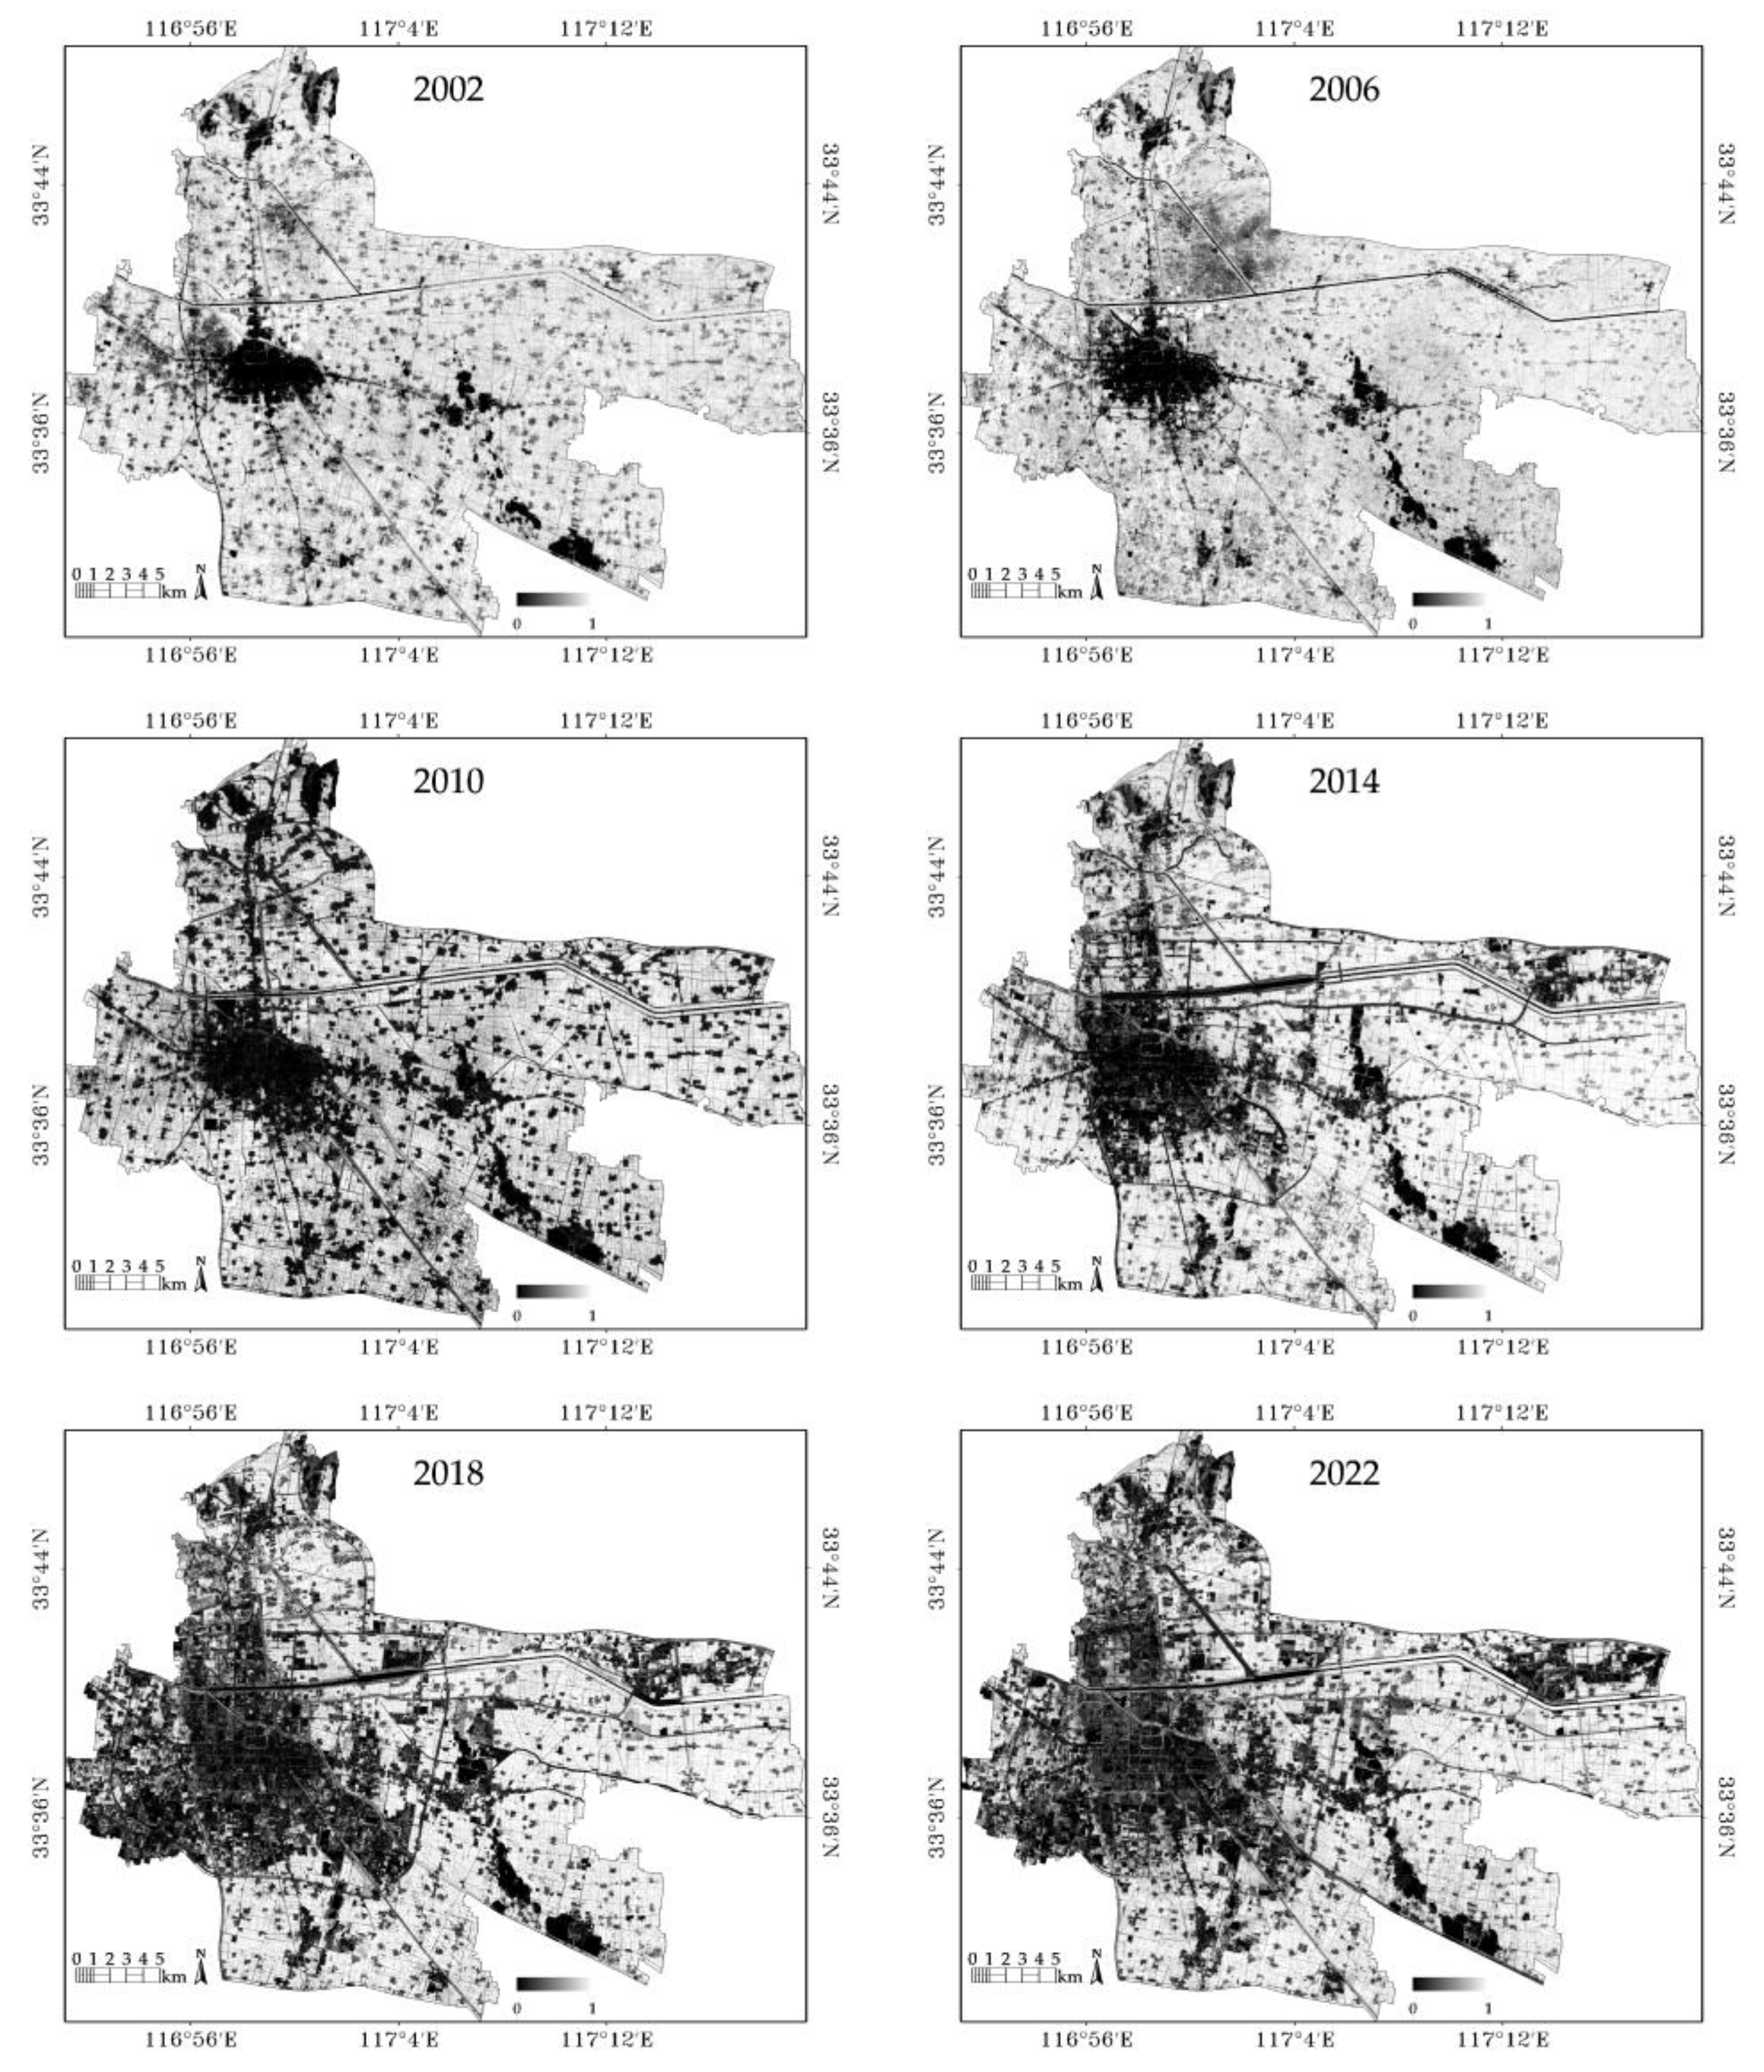
3.1. Results of the Four Indicators and RSEI

The EEQ wetness component of Suzhou City was calculated using ENVI 5.6 software based on Equations (1)–(3) and (14) (Figure 2), whereas the EEQ greenness component of Suzhou City was determined using Equations (1), (4), and (14) (Figure 3). The EEQ dryness component of Suzhou City was calculated using Equations (1), (5)–(7), and (14) (Figure 4). The EEQ heat component of Suzhou City was calculated using Equations (1) and (8)–(14) (Figure 5). These components were employed to compute the spatial distribution of the RSEI of Suzhou City using Equations (14)–(16) (Figure 6).
There can be some deviations between the experimental results and the actual situation of Suzhou City due to the limited image resolution and inconsistent imaging times. Therefore, further comprehensive evaluation studies based on the combining of land use data with the GEE platform are required.

3.2. Temporal Changes in the EEQ of Suzhou City

Table 4 details the statistical results of the four indicators (WET, NDVI, NDBSI, and LST) and the RSEI values of Suzhou City. It indicates that the highest WET value is 0.839, with an average value exceeding 0.758. The NDVI peaks at 0.868, with its average surpassing 0.669. The average and lowest values of the NDBSI are less than 0.522 and 0.288, respectively. The LST’s average and lowest values are less than 0.563 and 0.292, respectively. On the other hand, the PC analysis showed positive WET and NDVI values and negative LST and NDBSI values. The higher the WET and NDVI values are, the higher the soil moisture content and the better the vegetation coverage and EEQ are in Suzhou City. In contrast, the higher the LST and NDBSI values are, the more severe the soil desertification is. This results in increased bare soil areas, a higher LST, and a worse EEQ in Suzhou City. The NDVI revealed higher values in the PC1 loads compared to the other indicators. The sums of the absolute values of NDBSI and LST from 2010 and 2022 are inferior to those of the WET and NDVI. This indicates that the optimization effects of soil moisture and vegetation coverage on the EE are greater than those of the bare soils and impermeable surfaces in the study area. In contrast, the sums of the absolute NDBSI and LST values in 2002, 2006, 2014, and 2018 surpass the WET and NDVI values, demonstrating that the optimization effects of soil moisture and vegetation coverage on the EE in the study area are lower than those of the disturbance caused by bare soils and impermeable surfaces. The average RSEI values of Suzhou City showed a “W”-shaped pattern over the 2002–2022 period. In addition, the average RSEI value of the six years that were studied is 0.702, indicating a relatively good overall EEQ in Suzhou City. In addition, the average RSEI value exhibits increasing, decreasing, increasing, decreasing, and increasing trends over the 2002–2006, 2006–2010, 2010–2014, 2014–2018, and 2018–2022 periods, from 0.735 to 0.746 (1.50%), 0.746 to 0.632 (15.28%), 0.632 to 0.744 (17.72%), 0.744 to 0.639 (14.11%), and 0.639 to 0.715 (11.89%), demonstrating improvement-deterioration-improvement-deterioration-improvement trends of the EE in the study area, respectively. Overall, the average RSEI value of Suzhou City decreased by 2.72% from 0.735 to 0.715 in 2002 and 2022, respectively, highlighting a slight change in the EE of Suzhou City.

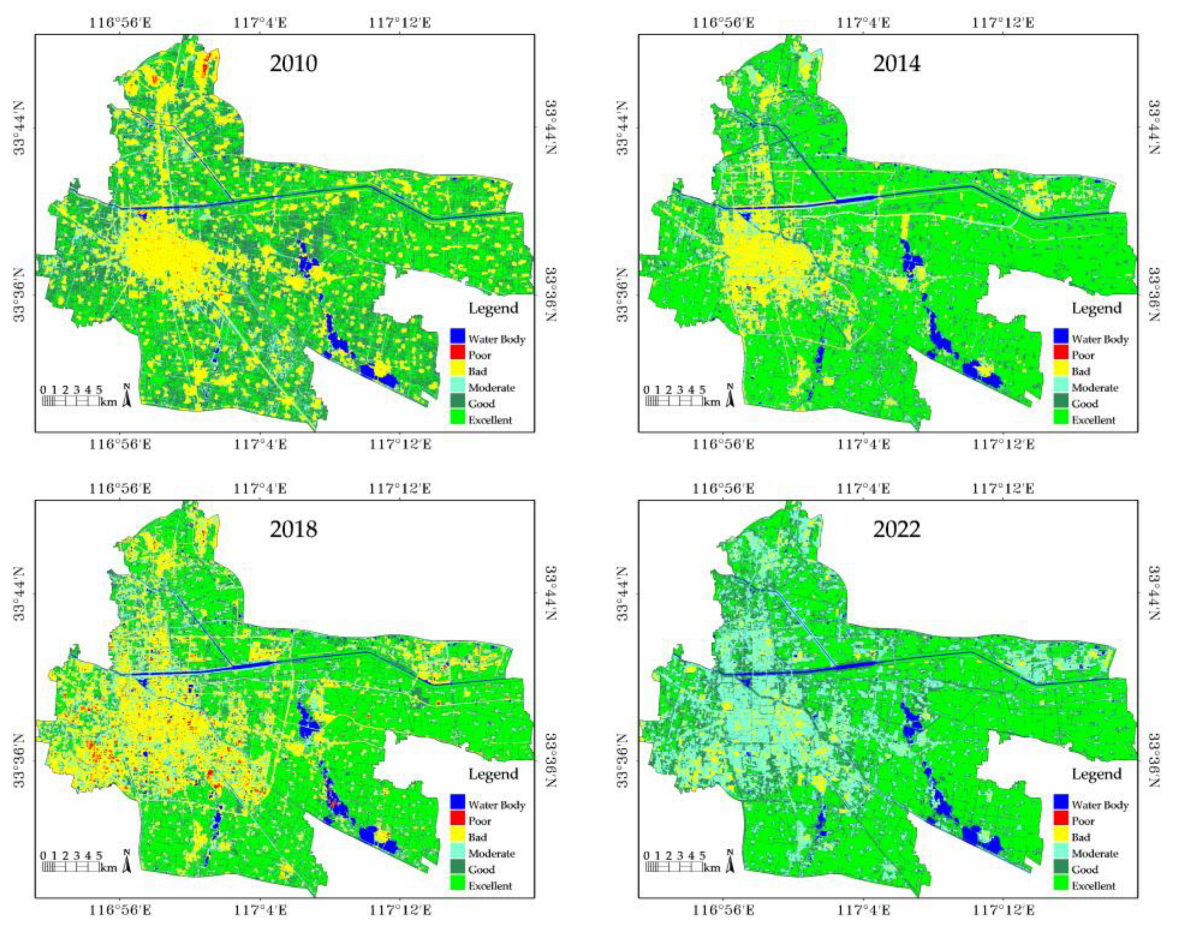
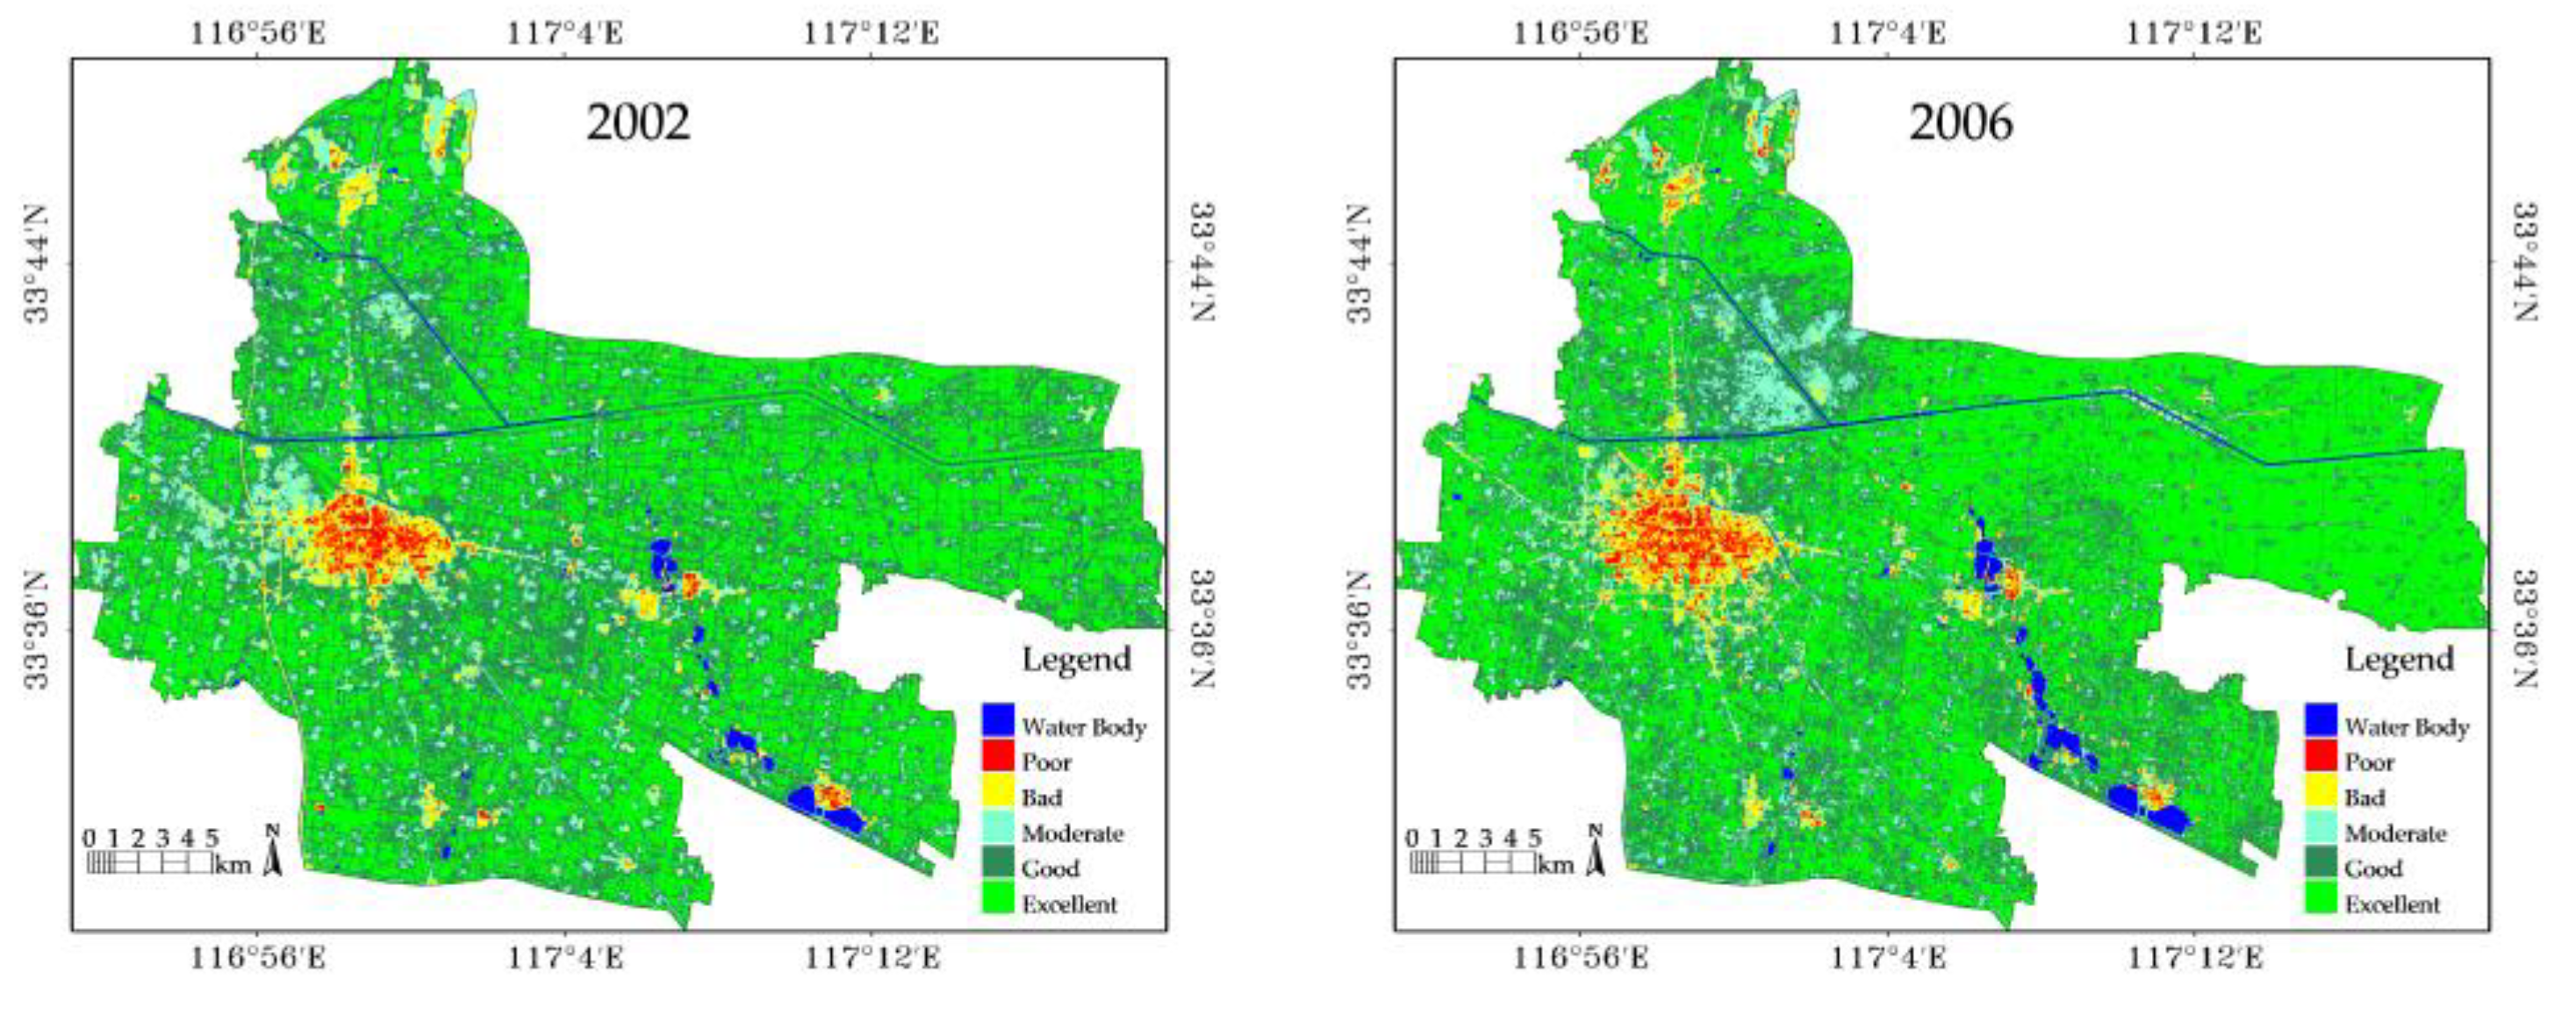
3.3. Spatial Changes in the EEQ of Suzhou City

In this study, the EEQ of Suzhou City was classified into five levels: excellent, good, moderate, bad, and poor, ranging from 0.8 to 1, 0.6 to 0.8, 0.4 to 0.6, 0.2 to 0.4, and 0 to 0.2, respectively, based on the “Technical Criterion for Ecosystem Status Evaluation,” the RSEI results, and the actual situation of Suzhou City (Figure 7). In addition, the areas and area ratio statistics of the EEQ levels are listed in Table 5. Figure 7 and Table 5 indicate that the excellent EEQ level of Suzhou City ranks first in the 2002–2022 period. The EEQ of Suzhou City shows a dominance of the good and excellent levels over the 2002–2014 period. However, in 2018 and 2022, the EEQ levels of Suzhou City are mainly excellent and bad, and excellent and moderate, respectively. The poor and bad EEQ levels are mainly distributed in the urban area, Ma’anshan Modern Industrial Park, Fuli Town, Beiyangzhai Administrative District of the economic and technological development zone, Jinhai Street, and suburban construction land due to the penetrated influences of human activities, and the dry and hot climate conditions. The good and excellent EEQ levels are primarily distributed around the main urban area and suburbs, and near water bodies. This finding can be attributed to the substantial improvement in the water and air temperature conditions and the relatively high FVC in these areas. The accelerated urbanization process of Suzhou City substantially increased the total area of the poor and bad EEQ levels of Suzhou City during 2002–2018 from 37.64 to 190.68 km2. In contrast, the total area of the poor and bad EEQ levels of Suzhou City illustrates a decreasing trend over the 2018–2022 period from 190.68 to 32.77 km2. The EEQ of Suzhou City has been remarkably improved due to the substantial improvement of the EE of the main urban area. This observation is closely related to the recognition of Suzhou City as a national civilized city in May 2018. On the other hand, the area ratio of the bad EEQ and below-EEQ levels decreased from 37.64% to 4.17% over the 2002–2022 period. In the same way, the area ratios of the good and above and excellent EEQ levels decreased from 80.45% to 65.60% and from 44.32% to 43.49%, respectively, over the same period.

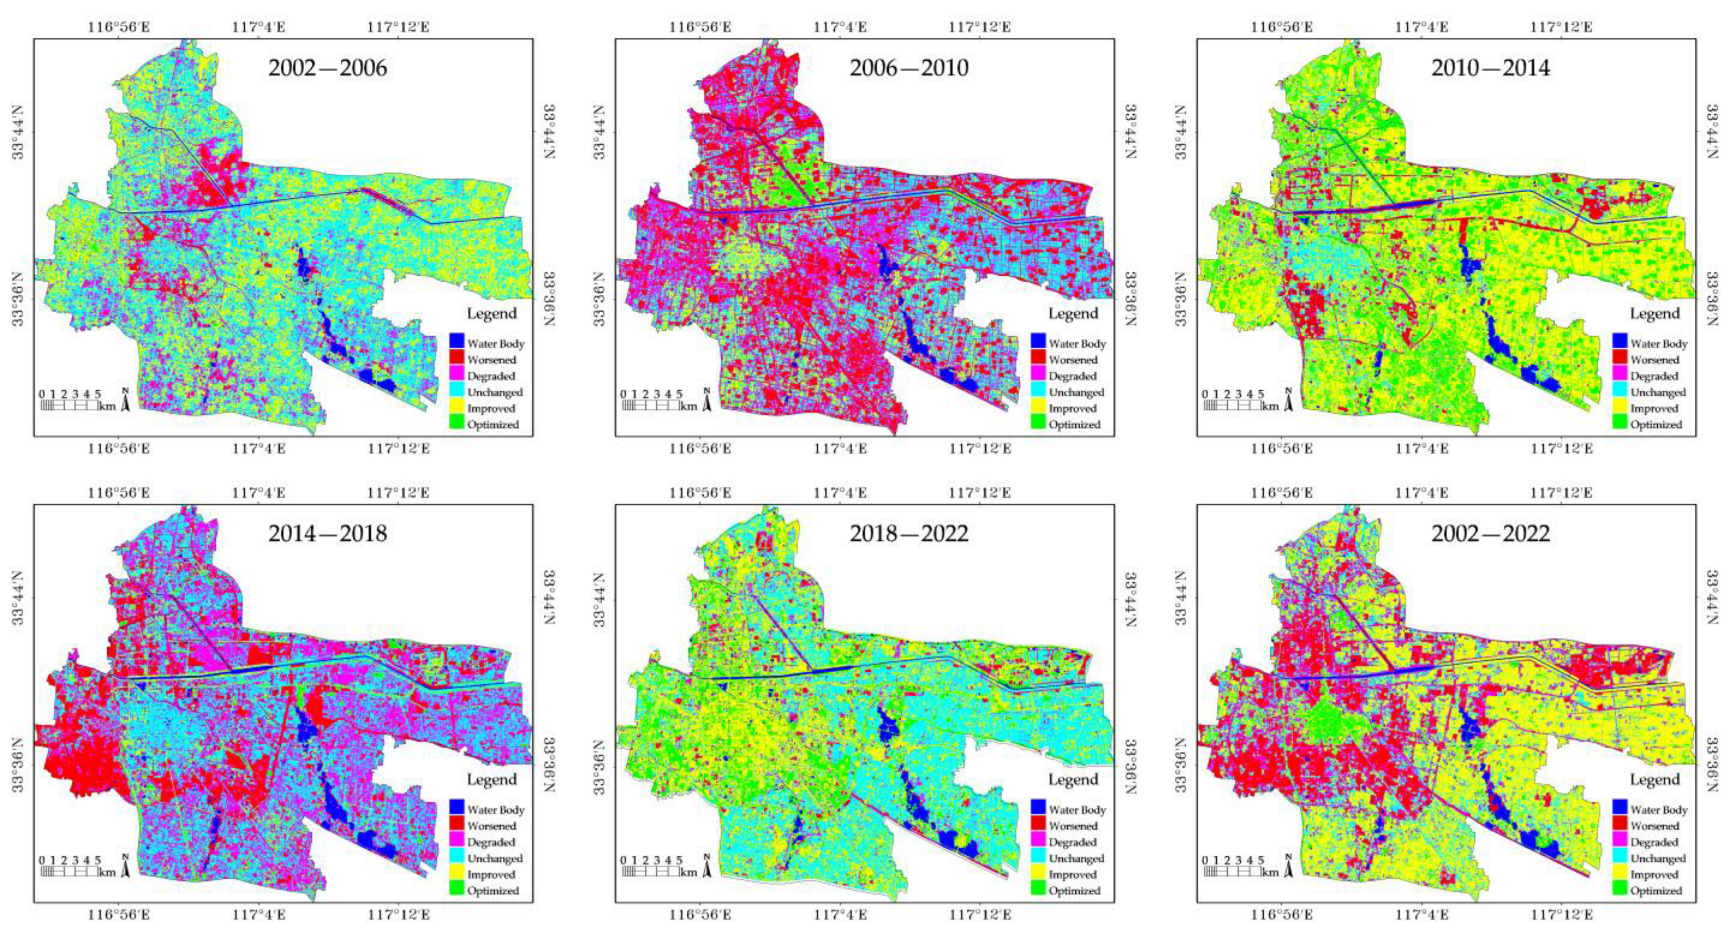
3.4. Spatiotemporal Differences in the EEQ of Suzhou City

In order to better understand the spatiotemporal changes in the EEQ values of Suzhou City during the period from 2002 to 2022, different calculations were conducted on the RSEI values of Suzhou City in various years, relying on the results reported by Wang et al. [7], Zhang et al. [32], and Sun et al. [33], as well as the actual situation of Suzhou City. The spatiotemporal differences in the EEQ values were classified into five grades: worsened, degraded, unchanged, improved, and optimized, ranging from −1 to −0.2, −0.2 to −0.05, −0.05 to 0.05, 0.05 to 0.2, and 0.2 to 1, respectively (Figure 8). The obtained spatiotemporal difference results were utilized to determine the areas and area ratios of the EEQ grades of Suzhou City (Table 6). During 2002–2006, the worsened RSEI area and area ratio of Suzhou City were 141.88 km2 and 18.07%, respectively. In contrast, the improved RSEI area and area ratio in the same period were 255.93 km2 and 32.61%, respectively. In the 2006–2010 period, the worsened RSEI area showed a continuous increase due to the continuous expansion of the built-up area, resulting in area and area ratio values of 440.60 km2 and 56.13%, respectively. The improved RSEI area continued to reduce, showing area and area ratio values of 99.07 km2 and 12.62%, respectively. The worsened RSEI area decreased substantially over 2010–2014, exhibiting area and area ratio values of 82.94 km2 and 10.56%, respectively. In contrast, the improved RSEI area increased significantly, with area and area ratio values of 583.7 km2 and 84.36%, respectively. The worsened RSEI area showed a continuous rise in 2014–2018 due to the acceleration of urbanization, with area and area ratio values of 404.16 km2 and 51.48%, respectively. In this period, the improved RSEI area decreased significantly, indicating area and area ratio values of 62.31 km2 and 7.94%, respectively. In 2018–2022, the area of the worsened RSEI area decreased significantly due to the creation of a national civilized city in Suzhou City, showing area and area ratio values of 66.53 km2 and 8.48%, respectively. The improved RSEI area increased substantially, resulting in area and area ratio values of 347.02 km2 and 49.70%, respectively. From 2002 to 2022, the worsened RSEI area and area ratio were 259.39 km2 and 33.04%, respectively. At the same time, the improved RSEI area and area ratio were 347.02 km2 and 44.21%, respectively. Figure 8 indicates that the worsened EEQ areas of Suzhou City in the 2002–2006 period were mainly distributed in Bianhe Street, the high-tech industrial development zone, Beiguan Street, Xiguan Street, Sanba Street, Nanguan Street, and Sanliwan Street. The improved EEQ areas were primarily distributed in Xierpu Township, Beiyangzhai Administrative District of the economic and technological development zone, Chengdong Street, Tuohe Street, and the Ma’anshan Modern Industrial Park. The EEQ of Suzhou City shows a sharp decline in the 2006–2010 period. The worsened EEQ areas are mainly distributed in Xierpu Township, Fuli Town, Sanba Street, Beiyangzhai Administrative District of the economic and technological development zone, and Tuohe Street. In contrast, the EEQ was substantially improved in Bianhe Street, the high-tech industrial development zone, Beiguan Street, Yongqiao Street, and Xiguan Street. In 2010–2014, a large-scale improvement of the EEQ is observed in Suzhou City. The EE in the main urban area of Suzhou City is relatively stable. The worsened EEQ areas were mainly distributed in the Beiyangzhai Administrative District of the economic and technological development zone and Ma’anshan Modern Industrial Park. The EEQ in the 2010–2014 period considerably improved in Xisipo Town, Luling Town, Dadian Town, and Bianhe Street. Although the EEQ of Suzhou City exhibits a considerable decline from 2014 to 2018, the EE shows a stable pattern in the main urban area of Suzhou City. The worsened EEQ areas were mainly distributed in Xierpu Township, Sanba Street, Sanliwan Street, Daodong Street, and Bianhe Street, while those of the improved EEQ were mainly distributed in Chengdong Street and the Ma’anshan Modern Industrial Park. The improved EEQ covers a large surface area in Suzhou City in 2018–2022, particularly in the main urban area. The area ratio of the stable area of the EEQ in Suzhou City was about 40%, while the worsened EEQ areas were primarily distributed in Fuli Town and the Ma’anshan Modern Industrial Park. In summary, a substantial continuous improvement of the Suzhou City EEQ is observed in 2002–2022, especially in the city’s central, eastern, and southern parts. In contrast, the EEQ of the construction land near the central part of Suzhou City and Ma’anshan Modern Industrial Park deteriorated.

4. Conclusions

This study utilizes TM-, OLI-, and TIRS-derived long-term Landsat satellite images to quantitatively assess the spatiotemporal changes in the EEQ of Suzhou City, China, over the 2002–2022 period using the RSEI. It uses PC analysis to combine four environmental input indicators (GI, WI, DI, and HI) in the RSEI. The main conclusions of this study are as follows:
(1) The WET and NDVI values are both positive, influencing the EEQ of Suzhou City positively. In contrast, the NDBSI and LST values are both negative, thereby negatively affecting the EEQ of Suzhou City. These findings are in line with the law of ecology.
(2) The average RSEI value of Suzhou City showed an oscillating trend (increasing-decreasing-increasing-decreasing-increasing) from 0.735 to 0.746, 0.746 to 0.632, 0.632 to 0.744, 0.744 to 0.639, and 0.639 to 0.715 over the 2002–2006, 2006–2010, 2010–2014, 2014–2018, and 2018–2022 periods, respectively. The average RSEI values of Suzhou City indicated a “W” shape from 2002 to 2022. The average annual RSEI value was 0.702, suggesting a relatively good EEQ.
(3) The dominant EEQ levels in Suzhou City from 2002 to 2014 were primarily good and excellent. In 2018 and 2022, the EEQ levels of Suzhou City were mainly excellent and bad and excellent and moderate, respectively. The poor and bad EEQ areas of Suzhou City were mainly distributed in the urban area, Ma’anshan Modern Industrial Park, Fuli Town, Beiyangzhai Administrative District of the economic and technological development zone, Jinhai Street, and suburban construction land. The good and excellent EEQ areas of Suzhou City were substantially distributed near the main urban area and water bodies, as well as in the suburbs.
(4) The EEQ of Suzhou City showed a continuous improvement due to the construction of a national civilized and garden city, particularly in the central, eastern, and southern parts of Suzhou City. The worsened EEQ areas of Suzhou City were mainly distributed in the construction land around the central part of the city and the Ma’anshan Modern Industrial Park.
(5) The evaluation results are objective and can be applied to assess and monitor the EEQ of Suzhou City. Regarding economic and social development, government departments should perform reasonable urban planning to better protect the EEQ of Suzhou City. This includes strengthening the restoration of urban ecological functions, continuously improving the greening rate, rationally utilizing and protecting wetland resources, and increasing the construction of wetland parks.
(6) In future research, in order to make the EEQ evaluation results more scientific and accurate, researchers can optimize the RSEI algorithm, employ GEE as a platform and long-term series and high-resolution images as data sources, and combine RSEI, land use data, and atmospheric pollutants (AQI, SOx, NOx, COx, PM2.5, and PM10) to comprehensively evaluate the EEQ of Suzhou City.

Author Contributions

Conceptualization, G.F. and R.D.A.P.II; methodology, G.F.; software, G.F. and Y.Z.; validation, G.F. and Y.Z.; formal analysis, G.F.; resources, G.F.; data curation, G.F. and Y.Z.; writing—original draft preparation, G.F.; writing—review and editing, G.F. and R.D.A.P.II; visualization, G.F. and Y.Z.; supervision, G.F.; project administration, G.F.; funding acquisition, G.F. All authors have read and agreed to the published version of the manuscript.

Funding

This research was funded by the Scientific Research Development Fund of Suzhou University (2021fzjj23), 3S Technology Application Research Center in Northern Anhui (2021XJPT12), Teaching Team of Surveying and Mapping Engineering in Anhui Province (2020jxtd285), Professional Leader Fund of Suzhou University (2019XJZY06), and School-enterprise Cooperation Practice Education Base of Suzhou University (szxy2022xqhz01).

Institutional Review Board Statement

Not applicable.

Informed Consent Statement

Not applicable.

Data Availability Statement

The authors confirm that all the data are available in the article.

Conflicts of Interest

The authors declare no conflict of interest.

References

  1. Zhang, J.; Yang, L.P.; Gong, E.J.; Wang, Y.; Ren, J.; Liu, M. Dynamic monitoring of eco-enviromental quality in Xi’an based on GEE and adjusted RSEI. Acta Ecol. Sin. 2023, 5, 2114–2127. [Google Scholar]
  2. Zhao, G.Q.; Chen, L.W.; Mu, J.; Li, T.X.; Li, J.P.; Ma, Y.M.; Qu, X.M.; Wang, Y. Discussion on construction of ecological environment quality evaluation system. Meteorol. Environ. Sci. 2018, 1, 1–11. [Google Scholar]
  3. Nong, L.P.; Wang, J.L.; Yu, Y.H. Research on ecological environment quality in central Yunnan based on MRSEI model. J. Ecol. Rural Environ. 2021, 8, 972–982. [Google Scholar]
  4. Li, S.Z.; Xue, H.Z.; Li, J.R.; Zhou, L.J.; Gu, J.H.; Dong, G.T. Study on the ecological environment quality change in Hetao irrigation area with remote sensing ecology index. Ecol. Sci. 2022, 3, 156–165. [Google Scholar]
  5. Li, J.; Zhong, Q.; Zhang, Y. Evaluation of ecological environment in Karst Mountains based on RSEI: Taking Sinan County as an Example. Geomat. Spat. Inf. Technol. 2023, 6, 136–147. [Google Scholar]
  6. Luo, M.S.Y.; Tao, R.; Zhang, C.F.; Chen, X.F. Study on the ecological environment change in Yichang City based on remote sensing ecological index. Geospat. Inf. 2022, 5, 12–17. [Google Scholar]
  7. Wang, Y.; Wang, S.D. Dynamic change analysis of ecological quality based on RSEI: A case study of the Danjiang river basin (Henan section). Sci. Soil Water Conserv. 2019, 3, 57–65. [Google Scholar]
  8. Zhang, W.; Du, P.J.; Guo, S.C.; Lin, C.; Zheng, H.R.; Fu, P.J. Enhanced remote sensing ecological index and ecological environment evaluation in arid area. Natl. Remote Sens. Bull. 2023, 2, 299–317. [Google Scholar] [CrossRef]
  9. DeVries, B.; Verbesselt, J.; Kooistra, L.; Herold, M. Robust monitoring of small-scale forest disturbances in a tropical montane forest using Landsat time series. Remote Sens. Environ. 2015, 161, 107–121. [Google Scholar] [CrossRef]
  10. State Environmental Protection Administration of China. Technical Criterion for Eco-Environmental Status Evaluation; HJ/T 192-2006; China Environmental Science Press: Beijing, China, 2006.
  11. Ministry of Ecology and Environment of the People’s Republic of China. Technical Criterion for Ecosystem Status Evaluation; HJ 192-2015; China Environmental Science Press: Beijing, China, 2015.
  12. Zhou, M.; Liu, Y.C.; Meng, L.H.; Jiao, K.Q.; Li, Q.; Zou, X.Y. Evaluation of ecological environment quality of Dongjiang River headwaters based on remote sensing ecological index during 2000–2019. Bull. Soil Water Conserv. 2021, 4, 231–240. [Google Scholar]
  13. Zhang, Y.Q.; Jiang, F.; Ji, M.D.; Jiang, H.S.; Wang, Z.Y. Assessment of the ecological environment at district and county level based on remote sensing index. Arid Zone Res. 2020, 6, 1598–1605. [Google Scholar]
  14. Liang, Q.L.; Shi, Z.T.; Chen, Y.H.; He, G.X.; Shi, L.T.; Li, J. Ecological environmental dynamic monitoring and driving force analysis of based on remote sensing ecological index. Bull. Soil Water Conserv. 2022, 6, 146–154. [Google Scholar]
  15. Xu, H.Q. A remote sensing urban ecological index and its application. Acta Ecol. Sin. 2013, 24, 7853–7862. [Google Scholar]
  16. Runge, A.; Nitze, I.; Grosse, G. Remote sensing annual dynamics of rapid permafrost thaw disturbances with LandTrendr. Remote Sens. Environ. 2022, 268, 112752. [Google Scholar] [CrossRef]
  17. Hu, K.; Han, N.L.; Yu, M.; Zhang, Y.C. Land use change simulation in Sanya city based on remote sensing ecological index. Sci. Soil Water Conserv. 2023, 1, 101–109. [Google Scholar]
  18. Yue, H.; Liu, Y.; Li, Y.; Lu, Y. Eco-environmental quality assessment in China’s 35 major cities based on remote sensing ecological index. IEEE Access 2019, 7, 51295–51311. [Google Scholar] [CrossRef]
  19. Hu, X.S.; Xu, H.Q. A new remote sensing index for assessing the spatial heterogeneity in urban ecological quality: A case from Fuzhou city, China. Ecol. Indic. 2018, 89, 11–21. [Google Scholar] [CrossRef]
  20. Wang, D.C.; Chen, X.; Sun, Z.C.; Xin, Y.; Wang, H.Q.; Chai, H.; Wang, H.Y. Monitoring of changes in the ecological index of long-time sequence remote sensing in Golmud, Qinghai Province. Acta Ecol. Sin. 2022, 14, 5922–5933. [Google Scholar]
  21. Boori, M.; Choudhary, K.; Paringer, R.; Kupriyanov, A. Spatiotemporal ecological vulnerability analysis with statistical correlation based on satellite remote sensing in Samara, Russia. J. Environ. Manag. 2021, 285, 112138. [Google Scholar] [CrossRef]
  22. Saleh, S.; Amoushahi, S.; Gholipour, M. Spatiotemporal ecological quality assessment of metropolitan cities: A case study of central Iran. Environ. Monit. Assess. 2021, 193, 305. [Google Scholar] [CrossRef]
  23. Miao, X.H.; Liang, Q.O. Analysis of ecological environment changes in Yongjiang river basin based on remote sensing ecological index. Resour. Environ. Yangtze Basin 2021, 2, 427–438. [Google Scholar]
  24. Chen, F.; Qiao, G.T.; Zhang, D.D.; Wang, N. Evaluation of ecological environment quality and diagnosis of obstacle factors in Suzhou. J. Nanyang Inst. Technol. 2022, 4, 44–49. [Google Scholar]
  25. The People’s Government of Suzhou Municipality. Physical Geography. 2023. Available online: https://www.ahsz.gov.cn/zjsz/zrdl/index.html (accessed on 12 June 2023).
  26. The United States Geological Survey (USGS). Available online: https://earthexplorer.usgs.gov (accessed on 4 March 2023).
  27. Quan, W.T.; Zhang, S.Y.; Liu, Y.; Wang, W.D. Monitoring and evaluation of ecological environment changes in Dongzhuang reservoir basin in Shaanxi Province based on remote sensing ecological index. Bull. Soil Water Conserv. 2022, 5, 96–104. [Google Scholar]
  28. Turner, M.G. Landscape ecology: The effect of pattern on process. Annu. Rev. Ecol. Syst. 1989, 20, 171–197. [Google Scholar] [CrossRef]
  29. Wang, Z.C.; He, X.H. Assessments of ecological quality in Jinjiang district of Chengdu city using the FVC and RSEI models. J. Ecol. Rural Environ. 2021, 4, 492–500. [Google Scholar]
  30. Fang, G.; Deng, D.B. Temporal and spatial change analysis of urban heat island effect in Suzhou. J. Suzhou Univ. 2022, 3, 59–63. [Google Scholar]
  31. Qin, Z.H.; Li, W.J.; Xu, B.; Chen, Z.X.; Liu, J. The estimation of land surface emissivity for Landsat TM6. Remote Sens. Land Resour. 2004, 3, 28–32, 36, 41. [Google Scholar]
  32. Zhang, W.Q.; Sun, C.J.; Li, X.G. Vegetation cover change and ecological effect assessment in the loess plateau of southwest Shanxi Province based on remote sensing image. J. Nat. Resour. 2019, 8, 1748–1758. [Google Scholar] [CrossRef]
  33. Sun, G.J.; Li, X.M.; Zhang, W.Q.; Chen, W.; Wang, J.R. Evaluation of ecological security in Poverty-stricken region of Lüliang mountain based on the remote sensing image. China Environ. Sci. 2019, 12, 5352–5360. [Google Scholar]
Figure 1. Geographical location of Suzhou City. Note: DEM is the abbreviation of Digital Elevation Model.
Sustainability 15 13158 g001
Figure 2. WET distribution of Suzhou City in 2002–2022.
Sustainability 15 13158 g002aSustainability 15 13158 g002b
Figure 3. NDVI distribution of Suzhou City in 2002–2022.
Sustainability 15 13158 g003
Figure 4. NDBSI distribution of Suzhou City in 2002–2022.
Sustainability 15 13158 g004aSustainability 15 13158 g004b
Figure 5. LST distribution of Suzhou City in 2002–2022.
Sustainability 15 13158 g005aSustainability 15 13158 g005b
Figure 6. RSEI distribution of Suzhou City in 2002–2022.
Sustainability 15 13158 g006
Figure 7. RSEI spatial distribution in 2002–2022.
Sustainability 15 13158 g007aSustainability 15 13158 g007b
Figure 8. Eco-environmental quality detection change distribution of Suzhou City in 2002–2022.
Sustainability 15 13158 g008
Table 1. Image attributes.
YearsSatellite/SensorTimeCloud (%)
2002Landsat 5/TM4 August 20021
2006Landsat 5/TM30 July 20060
2010Landsat 5/TM19 March 20102
2014Landsat 8/OLI and TIRS1 May 20140.28
2018Landsat 8/OLI and TIRS10 April 20180.58
2022Landsat 8/OLI and TIRS21 April 20220.09
Table 2. Parameter values for TM and TIRS.
Sensor TypeGainBiasK1 (W·(m2∙sr·μm)−1)K2 (K)
TM5.5375 × 10−21.18243607.761260.56
TIRS3.342 × 10−40.1774.891321.08
Table 3. Parameter values for T ,   L   and   L .
Type200220062010201420182022
T0.420.350.810.850.850.83
L4.765.041.371.131.021.26
L6.697.122.221.891.702.10
Table 4. RSEI and component index values.
YearsIndexMeanStandard DeviationPC1 Loads
2002WET0.8150.0360.099
NDVI0.8680.1100.697
NDBSI0.5220.084−0.544
LST0.3750.085−0.455
RSEI0.7350.145
2006WET0.8370.0420.022
NDVI0.8270.1510.759
NDBSI0.4190.113−0.576
LST0.3770.077−0.302
RSEI0.7460.160
2010WET0.7620.0720.230
NDVI0.6890.2070.679
NDBSI0.3870.200−0.687
LST0.5630.074−0.117
RSEI0.6320.217
2014WET0.8390.1020.288
NDVI0.7390.2360.640
NDBSI0.2880.215−0.616
LST0.2920.147−0.359
RSEI0.7440.224
2018WET0.8160.0770.217
NDVI0.6690.2300.667
NDBSI0.3770.222−0.663
LST0.4120.110−0.261
RSEI0.6390.246
2022WET0.7580.1050.450
NDVI0.8120.1440.611
NDBSI0.3290.115−0.513
LST0.3040.108−0.402
RSEI0.7150.188
Table 5. RSEI Distribution of Suzhou City in 2002–2022.
YearsGradePoorBadModerateGoodExcellentWater Body
2002Area (km2)8.2229.4275.12315.09347.929.23
Ratio (%)1.053.759.5740.1344.321.18
2006Area (km2)11.3431.8971.24262.93393.8713.73
Ratio (%)1.444.069.0833.4950.181.75
2010Area (km2)1.57179.56101.08256.65230.1815.96
Ratio (%)0.222.8812.8832.6929.322.03
2014Area (km2)0.3398.47105.98126.54432.0821.60
Ratio (%)0.0412.5513.516.1255.042.75
2018Area (km2)6.73183.95131.46133.15304.6425.07
Ratio (%)0.8623.4316.7516.9638.813.19
2022Area (km2)0.0232.77216.64173.60341.4120.56
Ratio (%)04.1727.6122.1143.492.62
Table 6. Eco-environmental quality changes in Suzhou City in 2002–2022.
YearsGradeWorsenedDegradedUnchangedImprovedOptimizedWater Body
2002–2006Area (km2)29.77112.11372.44242.0613.8714.75
Ratio (%)3.7914.2847.4430.841.771.88
2006–2010Area (km2)205.58235.02227.4683.5115.5617.87
Ratio (%)26.1929.9428.9810.641.982.28
2010–2014Area (km2)51.1131.8395.36398.35185.3523.00
Ratio (%)6.514.0512.1550.7523.612.93
2014–2018Area (km2)140.15264.01288.7445.2917.0229.79
Ratio (%)17.8533.6336.785.772.173.79
2018–2022Area (km2)23.4443.09298.81276.86113.2729.53
Ratio (%)2.995.4938.0635.2714.433.76
2002–2022Area (km2)134.18125.21155.84310.4636.5622.75
Ratio (%)17.0915.9519.8539.554.662.90
Disclaimer/Publisher’s Note: The statements, opinions and data contained in all publications are solely those of the individual author(s) and contributor(s) and not of MDPI and/or the editor(s). MDPI and/or the editor(s) disclaim responsibility for any injury to people or property resulting from any ideas, methods, instructions or products referred to in the content.

