1. Introduction
With the 17 Sustainable Development Goals (SDGs), the 2030 Agenda made by the United Nations has defined a precise strategy to achieve a better and more sustainable future for all, in which they aim to end poverty, fight against inequality, tackle climate change, and build peaceful societies that respect human rights. The 17 SDGs refer to a set of important topics that take into account the three dimensions of sustainable development— economic, social, and ecological—in a balanced way and form a common basis to offer everyone the opportunity to live in an environmentally, economically, and socially sustainable world.
It is a global challenge, and as such, to contribute to the achievement of this result, all players in the economic, social, and institutional domains are called to do their part by 2030, since the objectives have an overall validity and concern and involve all countries and components of society, from private companies to the public sector and from civil society to information and culture operators.
A research topic investigated by the Laboratory of Geographic Information Systems at the University of Salerno, Italy [
1], was conceived to specifically contribute to Goal 11, namely, “Make cities and human settlements inclusive, safe, resilient and sustainable”. Here the approach is to promote the use of urban planning with the goal of creating healthier cities and settlements, which addresses the growing difficulties of modern cities as well as rural settlements.
The topic is investigated by taking a multidisciplinary approach with expertise from computer science, civil engineering, and anthropology/social psychology, whose efforts are shared and integrated to create cross-fertilization. The goal of this research is to provide all typologies of users involved in policy decision making and adoption with effective tools to both analyze and interpret the phenomena and dynamics of urban scenarios, understand the impact they produce, and understand how they affect the citizens’ well-being. As a matter of fact, as highlighted in [
2,
3], an active collaboration between citizens, organizations, and institutions in terms of Information and Communication Technologies (ICT) support is an essential component for the well-being of the community and the city itself.
To pursue this aim, the main focus of the research activities carried out is on the urban planning discipline integrated with ICT support, whereby we aimed at proposing a smart design for smart and innovative solutions. Such a domain is an increasingly important field of interest since, in addition to being a constantly expanding market, the adoption of virtuous principles and good practices can notably improve citizens’ lives.
A paramount role in this context is played by data. Modern cities try to deal with sustainability topics by first capturing the vast and variegate number of data coming from several heterogeneous sources, including citizens as human sensors. Such data acquisition represents the starting point for processing and generating territorial information that is useful for problem solving. To support this, data science and data analysis provide expert users with methodologies and tools to process data and produce information. Nevertheless, this information comprises diverse elements found within the urban landscape, and comprehending it necessitates technical and scientific expertise that is not commonplace among citizens and administrators, despite the fact that it impacts our daily lives. Then, once the information of interest has been generated, its visualization becomes another relevant requirement to be satisfied to be a useful and productive means for a continuous collaboration between citizens and decision makers.
This paper focuses on the latter topic, whereby we propose a visual methodology to help administrators process urban data and enhance the public’s understanding of the intricate inter-relationships between various factors and the evolution of social and environmental phenomena.
To achieve this goal, the authors propose that visual representation based on chorems be adopted, which produces visual syntheses of territorial scenarios that are appropriate to perform an analysis and are simple to understand despite the large amount of data and the limitations of the map [
4,
5,
6,
7].
In the literature, chorems have been used mainly in the environmental domain, where they have demonstrated their efficacy to represent geographical characteristics and related phenomena and are thus appropriate for both technical and nontechnical people. As an example, in [
8], the authors tested the efficacy of using chorems to interact with urban planners to acquire information about urban heat islands, a phenomenon that is invisible but typically present in most of modern cities. To clarify how the factors contributing to the phenomenon can be controlled to minimize its effects, the visual concept of chorems was employed, which made it easy to comprehend for both decision makers, who need to collaborate with technical personnel, and citizens, who need to comprehend the rationale for the administration’s actions to alleviate the phenomenon.
Following this approach, the authors aim to extend this paradigm to phenomena of a diverse nature, such as social, emotional, and well-being ones, which normally develop in an urban area. In particular, the specific dynamics investigated concerns the happiness phenomenon as monitored in an urban environment. Starting from the initial proposal presented in [
9], the authors argue that some specific characteristics of the urban environment, such as pedestrian or cycling orientedness, urban greenery, and furniture, may influence the mental well-being of citizens. Moreover, an analysis of data collected in the urban environment can be an effective way to measure factors, such as happiness and perceptions of the aesthetic beauty of the surroundings [
10,
11]. Therefore, utilizing a visual representation based on chorems can aid in illustrating the correlation between urban characteristics and happiness, which can foster a greater sense of awareness and participation among administrators, technicians, and citizens towards their city.
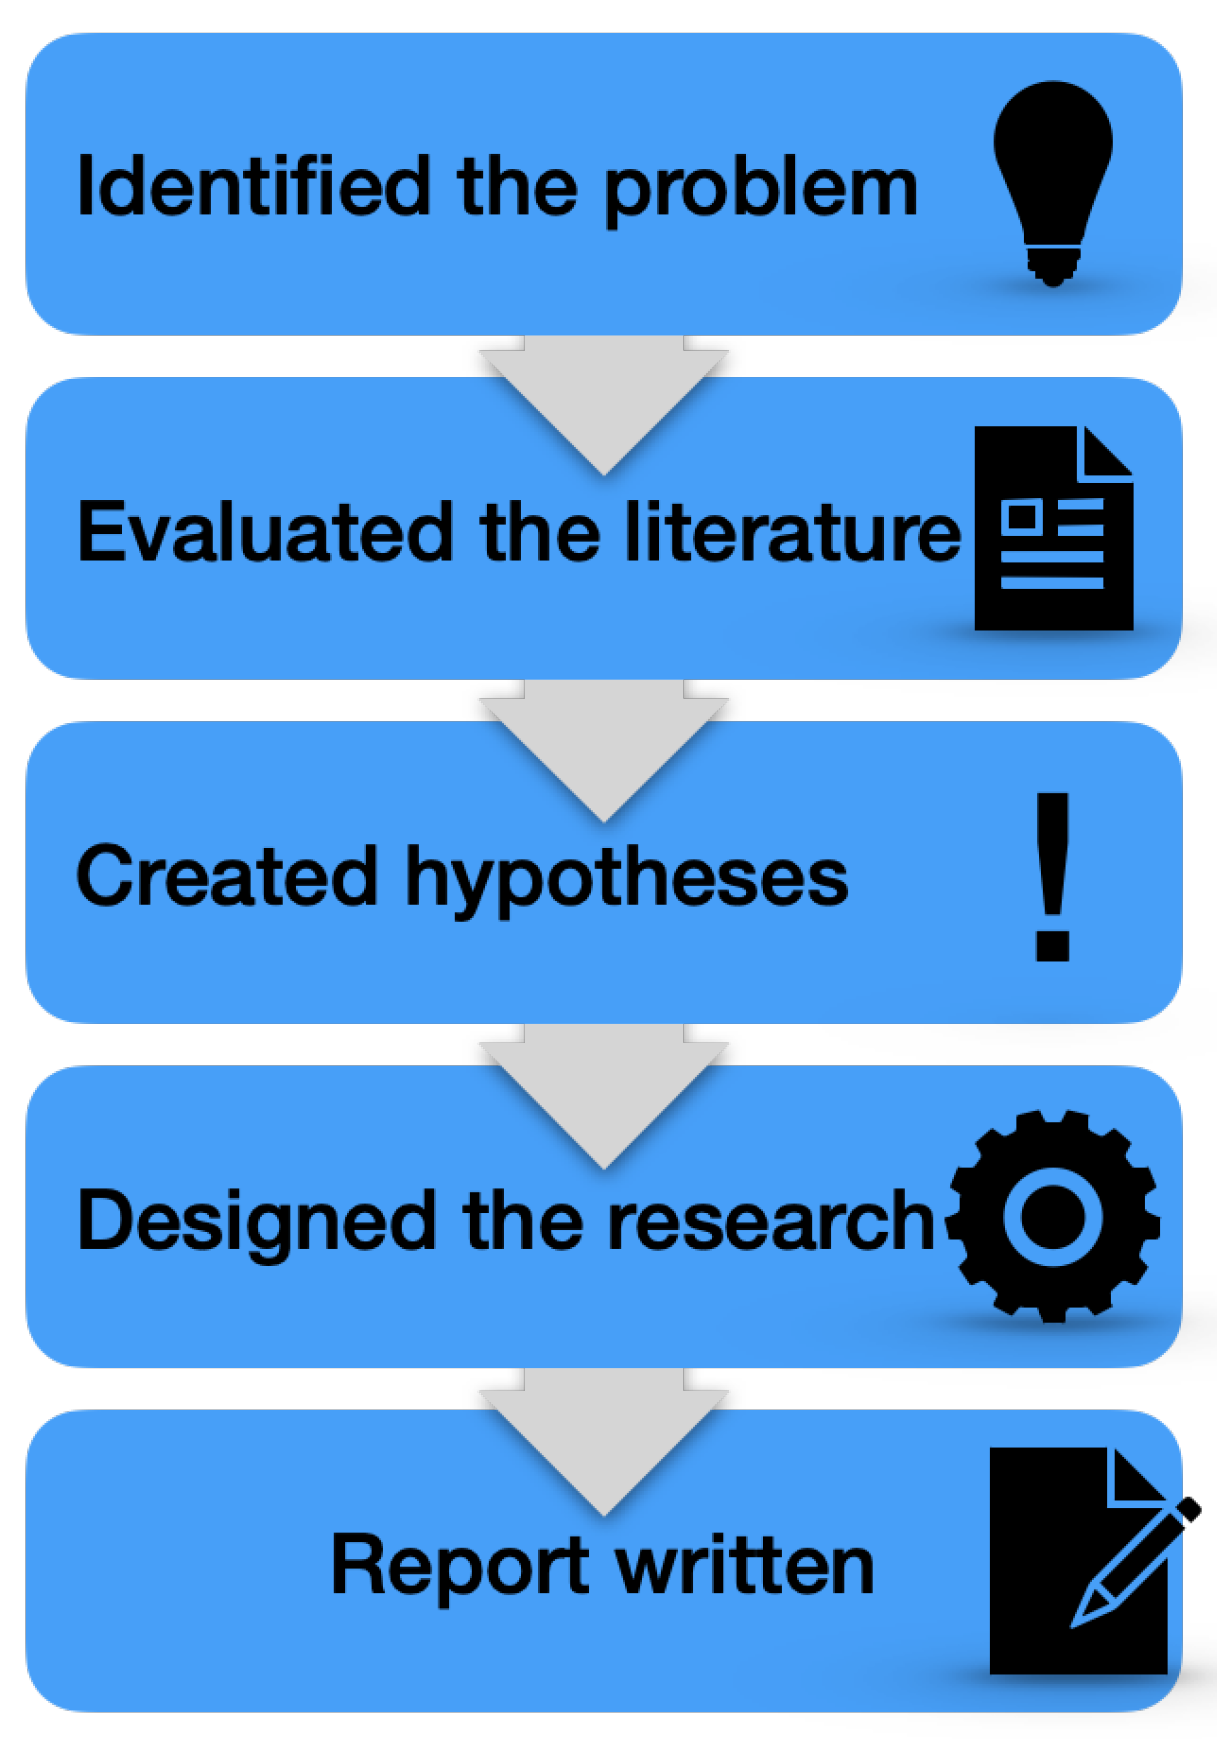
Figure 1 depicts the diagram of the research methodology adopted, which is addressed to visually summarize the research steps previously described and to achieve the whole research goal.
The remainder of the paper is structured as follows:
Section 2 recalls the structure of chorems and presents a preliminary concept of an urban happiness index derived from environmental characteristics.
Section 3 outlines the chorems that were specifically developed to address the urban environmental attributes and the urban happiness index. In
Section 4, some case studies are described by discussing how both decision makers and citizens may benefit from the expressiveness of chorems to quickly perceive the meaning associated with data and use it properly during their activities. The Discussion and Conclusions are given in
Section 5 and
Section 6, respectively.
2. Preliminaries
The goal of this section is first to briefly introduce the structure of a chorem and show how chorems can represent the visual synthesis of a geographic scenario. Secondly, the definition of urban happiness is recalled along with parameters that are useful to build an index for its monitoring.
2.1. Chorems
The notion of
chorem was originally introduced in 1986 by the French geographer Brunet as a simplified representation of a territory that omits details deemed irrelevant for map comprehension [
4]. However, over time, the concept has undergone significant changes. Despite this, the proliferation of ad hoc solutions, which results from the absence of a rigorous methodology to create and compose chorems, has led to difficulties in conveying the intended information [
5,
6,
11].
Figure 2 and
Figure 3 show how users can locate or distribute sets of chorems on different typologies of maps. In particular,
Figure 2 depicts a chorematic map embedding chorems for cities, regions, and driving dynamics, and thus builds a thematic map referring to the USA.
Figure 3 illustrates a geographic map that showcases various instances of data, such as traffic patterns, air pollution, temperature, wind speed, and the quality of urban green spaces. These instances of data are represented on the map as chorems [
8].
In [
7], the authors presented a definition and classification of chorems as visual syntheses of geographic database contents with the aim of standardizing chorem creation and usage and providing a practical framework for computer systems. Based on this, chorems can be categorized into three groups: geographical, phenomenon, and annotation. The initial group pertains to geographic features, the second group is utilized for spatiotemporal events that encompass one or more geographic chorems, and the third group adds supplementary visual information to enhance comprehension, such as temperature readings for a particular region.
The Phenomenal category can be subdivided into three types: Flow, Tropism, and Spatial Diffusion. The Flow chorem captures the movement between two or more geographic chorems, such as migration patterns. The Tropism chorem reflects the fascination or aversion of a particular geographic chorem, such as the ability of an area to attract people. Lastly, the Spatial Diffusion chorem depicts the spatial progression or regression of a geographic chorem along a specified direction.
Figure 4 depicts the underlying structure of a chorem, which was first described in [
7]. It visually integrates the iconic and the property components of a chorem. In particular, the iconic representation includes a graphical component, which corresponds to the visual representation, and a meaning, which refers to the semantic component. The property component is divided into two parts: a type attribute that specifies the category that the chorem belongs to, namely geographic, phenomenal, or annotation; and a source indicating where the data can be acquired.
The various components of the chorem structure, regardless of their type, contribute to creating a more accurate representation of a particular scenario when spatially distributed on a map. This results in the creation of a chorematic map, which presents a schematic representation of relevant data related to a specific place or region. To aid users in interpreting the map, a legend is typically associated with the chorematic map, which explains the meaning of each chorem.
The potential of chorems was discussed by Del Fatto et al. in [
13], where they listed the various roles that chorems can play. Building on this approach, subsequent research in [
7,
12] demonstrated how chorems can serve as a starting point for further processing tasks aimed at deriving spatial analysis data and supporting expert decision making. The authors introduced a range of operators, both geographic and semantic, to extract spatial knowledge that could help domain experts quickly and comprehensively navigate a chorematic map, from an initial overview to more detailed information, in critical situations.
Geographic Zoom
The operation being described is the zooming in/out of a chorematic map. This operation affects only the visual aspect of the map by altering the size of the visible details of the chorems. It does not change the structure or content of the chorems themselves.
Semantic Zoom
In general, a semantic zoom (in/out) enables access to different levels of information by analyzing and visualizing chorems in greater detail through (dis)aggregation. When applied to geographic chorems, this operation splits them up or aggregates them to show a new level of geographic data abstraction, with the corresponding iconic representation components properly substituted in terms of both graphical component and meaning.
When a semantic zoom is applied to a phenomenal chorem, it is decomposed or aggregated along with the related geographic chorems. In this case, the chorem structure is modified differently, and although the resulting chorem still corresponds to the initial phenomenal chorem, its meaning changes to refer to a different abstraction of the territory.
Geographic Filter
This operation enables users to select phenomenal chorems based on the graphical component of one or more geographic chorems serving as a spatial filter. The selection criteria are based on the territory of interest, where the phenomenal chorems need to be analyzed.
The output of this operation consists of one or more phenomenal chorems that meet the selection criteria. The structure of the resulting chorems remains unchanged in terms of their properties and iconic representation, but the number of phenomenal chorems may vary to satisfy the condition.
Semantic filter
The operation being described here allows users to filter chorems based on specific semantic conditions. This means that the filtering process is based on the meaning or significance of the data being represented by the chorems. For example, if a chorem represents a certain category of data points, such as “high-risk” or “low-risk”, then the user can filter the chorems to display only the ones that meet a certain semantic condition, such as “high-risk” chorems. This allows for a more focused analysis of the data, as the user can easily identify and isolate the chorems that are of interest to them.
2.2. Urban Happiness Definition
The concept of Happiness in an urban environment has gained increasing attention in recent years as policymakers and researchers strive to understand the factors that contribute to well-being in cities.
General speaking, the happiness index is a quantitative measure of the overall satisfaction and quality of life of citizens in a specific geographic area, typically a neighborhood or city. Determining such a value involves the use of various methods to collect data, including surveys, focus groups, and interviews with citizens, as well as factors, such as income, employment, education, health, and community involvement [
14,
15]. Moreover, new technologies such as big data and satellite imagery are also being used to gather data on a larger scale and to provide more comprehensive and nuanced insights into the state of happiness and well-being in urban areas [
15,
16].
As for the specific elements involved in the index processing, in [
10], the author presents a database of studies measuring happiness. He states that happiness is usually measured by using single questions such as the following: “Taking all things together, how happy would you say you are these days…?”. This approach is centered on subjective parameters that focus on the person and her feelings. A different and more objective approach is described in [
2], where the authors propose that happiness is influenced by both personal factors and the attributes of the surrounding environment. In addition, the paper [
17] suggests that the design of the city and its structures can alter human behaviors and interactions in public spaces, which can potentially elevate the overall level of happiness.
In terms of applications, the happiness index can be used in urban environments to inform policy decisions, to allocate resources, and to measure the impact of interventions aimed at improving quality of life [
18]. For example, cities can use the happiness index to inform the allocation of funding for community programs and public services, such as parks, transportation, and healthcare.
Overall, the use of the happiness index in urban environments is still in its early stage, and there is a need for further research and development to refine the methods used to measure happiness and to ensure that the results accurately reflect the mental well-being of citizens [
19]. Despite these challenges, the growing recognition of the importance of happiness and well-being in urban environments is a positive trend, and the continued use of the happiness index will likely play a key role in shaping the future of cities and their residents [
16,
20].
The approach adopted in the present paper to evaluate the happiness in an urban environment springs from [
3], where the authors assert that there exists a robust connection between happiness and mental health, and that urban planning should play a role in promoting mental well-being. Drawing from academic research and practical examples, they developed a citizen happiness model based on the physical stimuli found in urban environments. To validate the model, a questionnaire was administered to residents in downtown Tehran, which enabled the authors to determine the degree to which physical stimuli correlated with happiness in that particular environment. In [
3], the authors also explain how happiness is affected, in order of importance, by
pedestrian orientedness (PO),
environmental elements (EE),
spatial cohesion (SC),
bicycle orientedness (BO),
quality of the space (QS), and
GV (GV). Additionally, the following elements, in order of significance, comprise the
environmental elements:
cafés and restaurants (CR),
benches to sit and talk (BST),
works of art (WA),
fountain (FU),
illumination (I), and
access to lavatories (AL). Finally, the
variety (V),
physical penetrability (PP),
place identity (PI),
flexibility (F), and
legibility (L) compose the
quality of the space in order of relevance.
Although the authors suggest that individuals take into account the fact that the model was developed for Tehran, and hence some adaptations may be necessary when applied to a different city, in the present paper, it represents a method that is suitable for our goals. That is, it is general enough to be used as a basis for the visual representation based on the chorems. In the event that it is necessary to modify some factors according to different city needs, the latter can be adapted without impacting the method of representation, which visually expresses the result of the analysis and not the entire process, which is instead transparent, as described in the following.
In the following section, we show how the aforementioned elements are used and grouped to determine an urban happiness index (UHI), which contributes to visually describing the urban happiness (UH) phenomenon in a given area through a chorem-based representation.
3. Being Aware of the Urban Happiness through Chorems
The objective of this section is two fold. Firstly, it aims to review the concept of UHI as previously introduced in [
9], along with the factors that influence its magnitude. Secondly, it presents a collection of chorems that have been specifically designed to visually represent the phenomenon and its associated elements.
The UHI adopted and adapted in this paper is designed to be applied at the neighborhood scale of a city, where a neighborhood is considered as the smallest and cohesive urban area depending on the urban topology. This approach offers flexibility to a municipal administration, which is a relevant need indeed due to the variety of urban characteristics. An example of a neighborhood can be represented by the administrative districts.
The UHI is measured on a scale from 1 to 10, is derived from the attributes of the urban environment, and is calculated as a weighted average of its constituent elements.
The following formula expresses the UHI composition:
Analogously, the EE and QS indexes can be calculated as follows:
where the weight is
depending on the specific needs of a city. In the following, an example of a UHI value is given. This value is calculated for a city district with a specific urban destination.
As also indicated in [
21], assigning a weight to the constituent variables of a composite index is a challenge. Then, given the purpose of this example, namely to describe the formula expressing the UHI composition to be used in the proposed chorems methodology, a subjective weighting method was devised for a hypothetical scenario. Here, the environmental elements and the quality of space are considered most important and thus carry
and
, respectively, while the others are strictly below
. The whole set of weights is shown in
Table 1. It is understood that a more in-depth study for the weights evaluation can lead to a more reliable index, but this is out of topic.
Once all parameters have been elaborated, the obtained values are depicted in
Table 2.
Here, EE and QS represent the elements evaluated most positively at and 7. This implies that even if the elements such as PO and BO are on average low, the UHI is still good with a value of .
In the case of different goals set by decision makers when planning urban interventions, the importance of some elements may vary to satisfy new requirements. This implies that different weights will be applied, and that a different UHI value will possibly be determined.
As an example, according to the modified weights presented in
Table 3,
Table 4 shows a lower UHI value, namely
, although the values of the elements still hold and the relevance of BO and PO is higher.
As previously mentioned, these two examples are addressed to show the UHI formula used to assign the value to the properties component of the associated chorem. In case of a different formula adoption, the methodology described in the following section still holds.
The Urban Happiness Chorem and Its Components
By using the fundamental elements discussed earlier and representing them through appropriate chorems, it is possible to create chorematic maps that visually analyze the UH phenomenon in different districts. These maps can support decision makers in monitoring activities aimed at improving the quality of life of citizens.
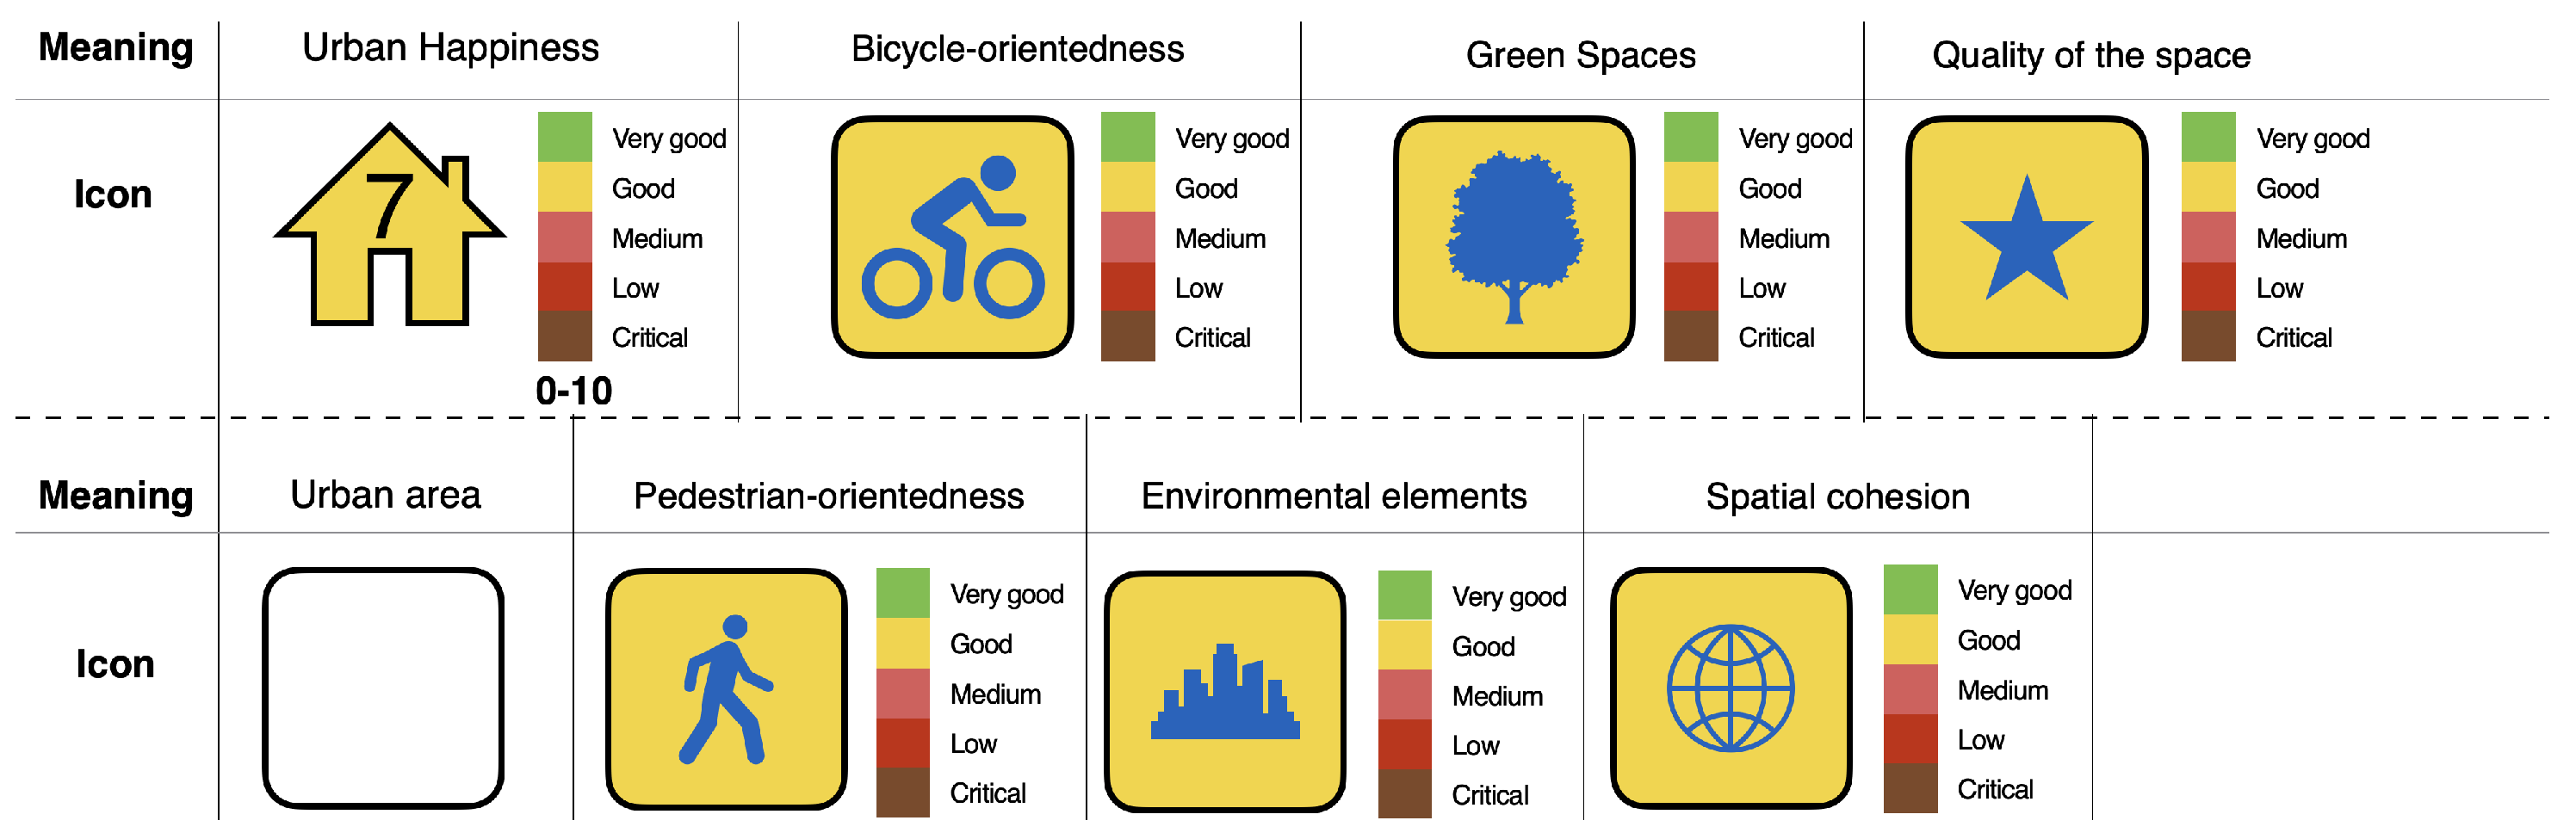
Figure 5 shows the iconography and the corresponding meaning for chorems representing both UH in a district and the elements contributing to its representation.
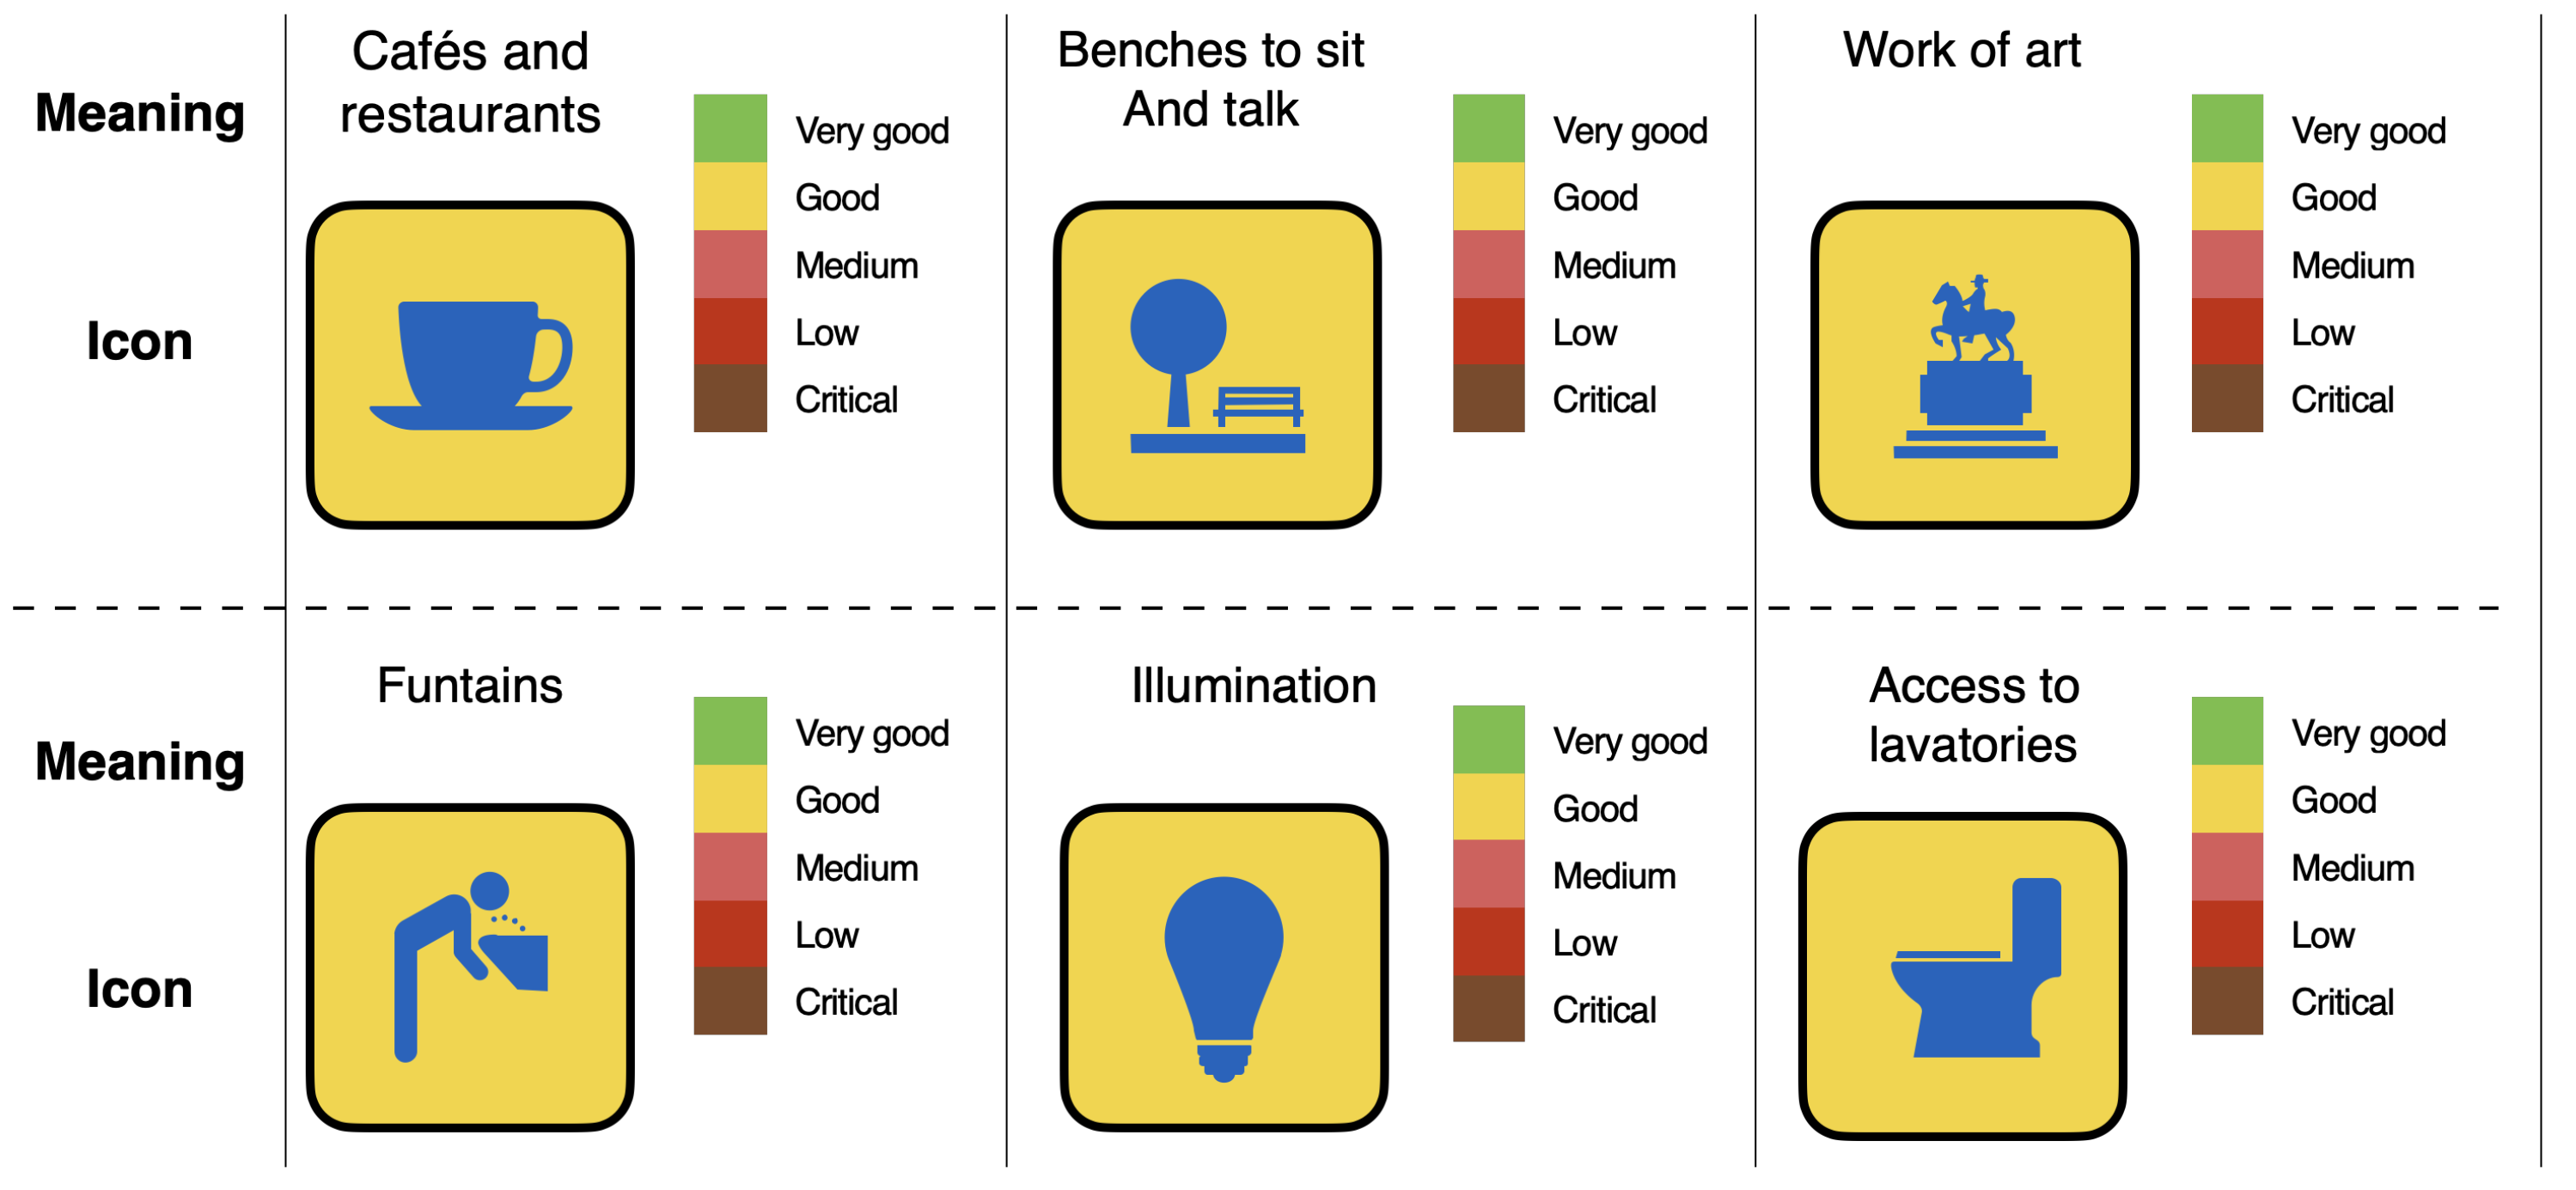
As illustrated in
Figure 6, the chorems introduced in this study represent various environmental elements. Similar to the previous case, the background color of each chorem indicates its level of presence in the corresponding urban area based on a chromatic scale, as reported in the side legend.
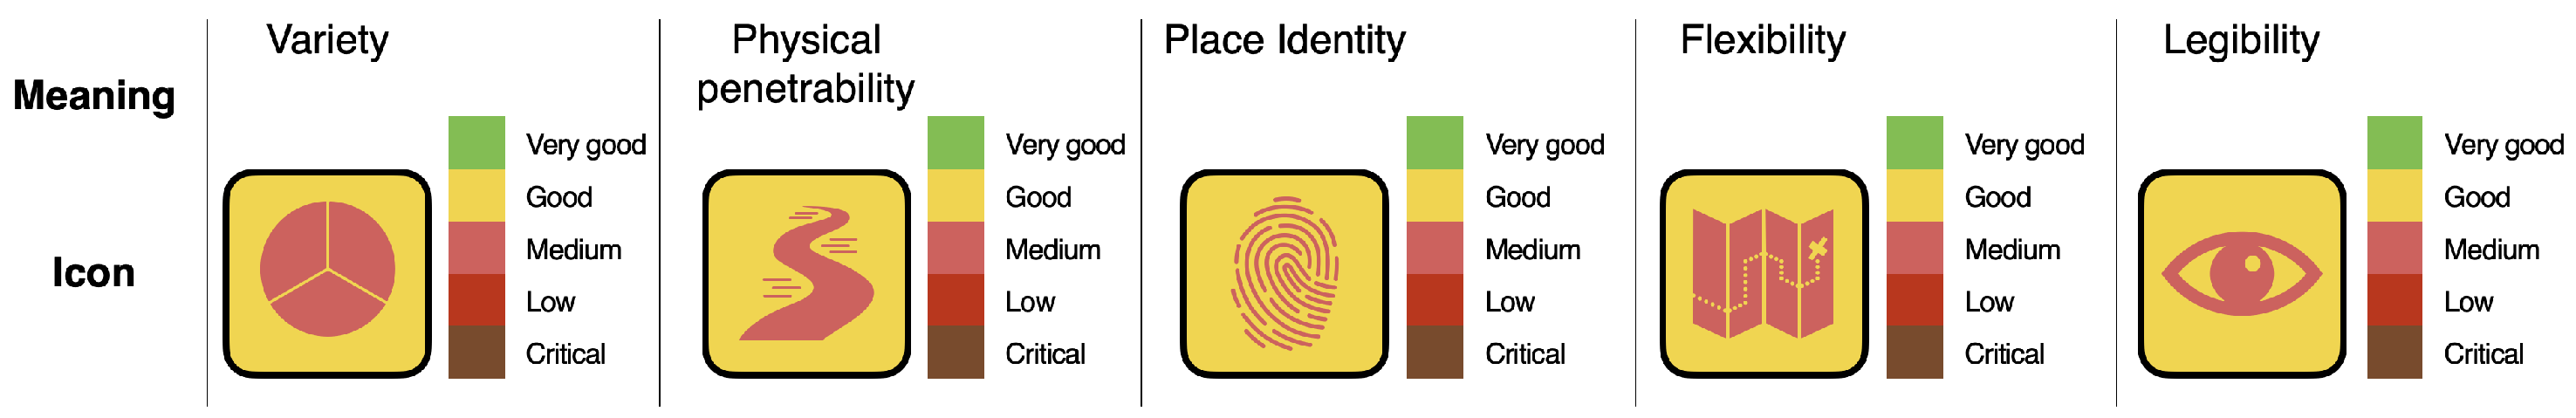
In
Figure 7, the chorems are depicted to represent the various elements that constitute the quality of the space. Similar to the previous case, the chorems are presented with a background based on a chromatic scale, which indicates their respective level within the urban area.
Once the chorems have been designed, they can be embedded in a map, and their qualitative/quantitative values can be processed starting from data coming from the underlying sources, as shown in the example. To illustrate and clarify the methodology proposed in this paper, the figures shown in the following sections display a Web application specifically designed and developed to evaluate user interfaces for chorems usage and analysis.
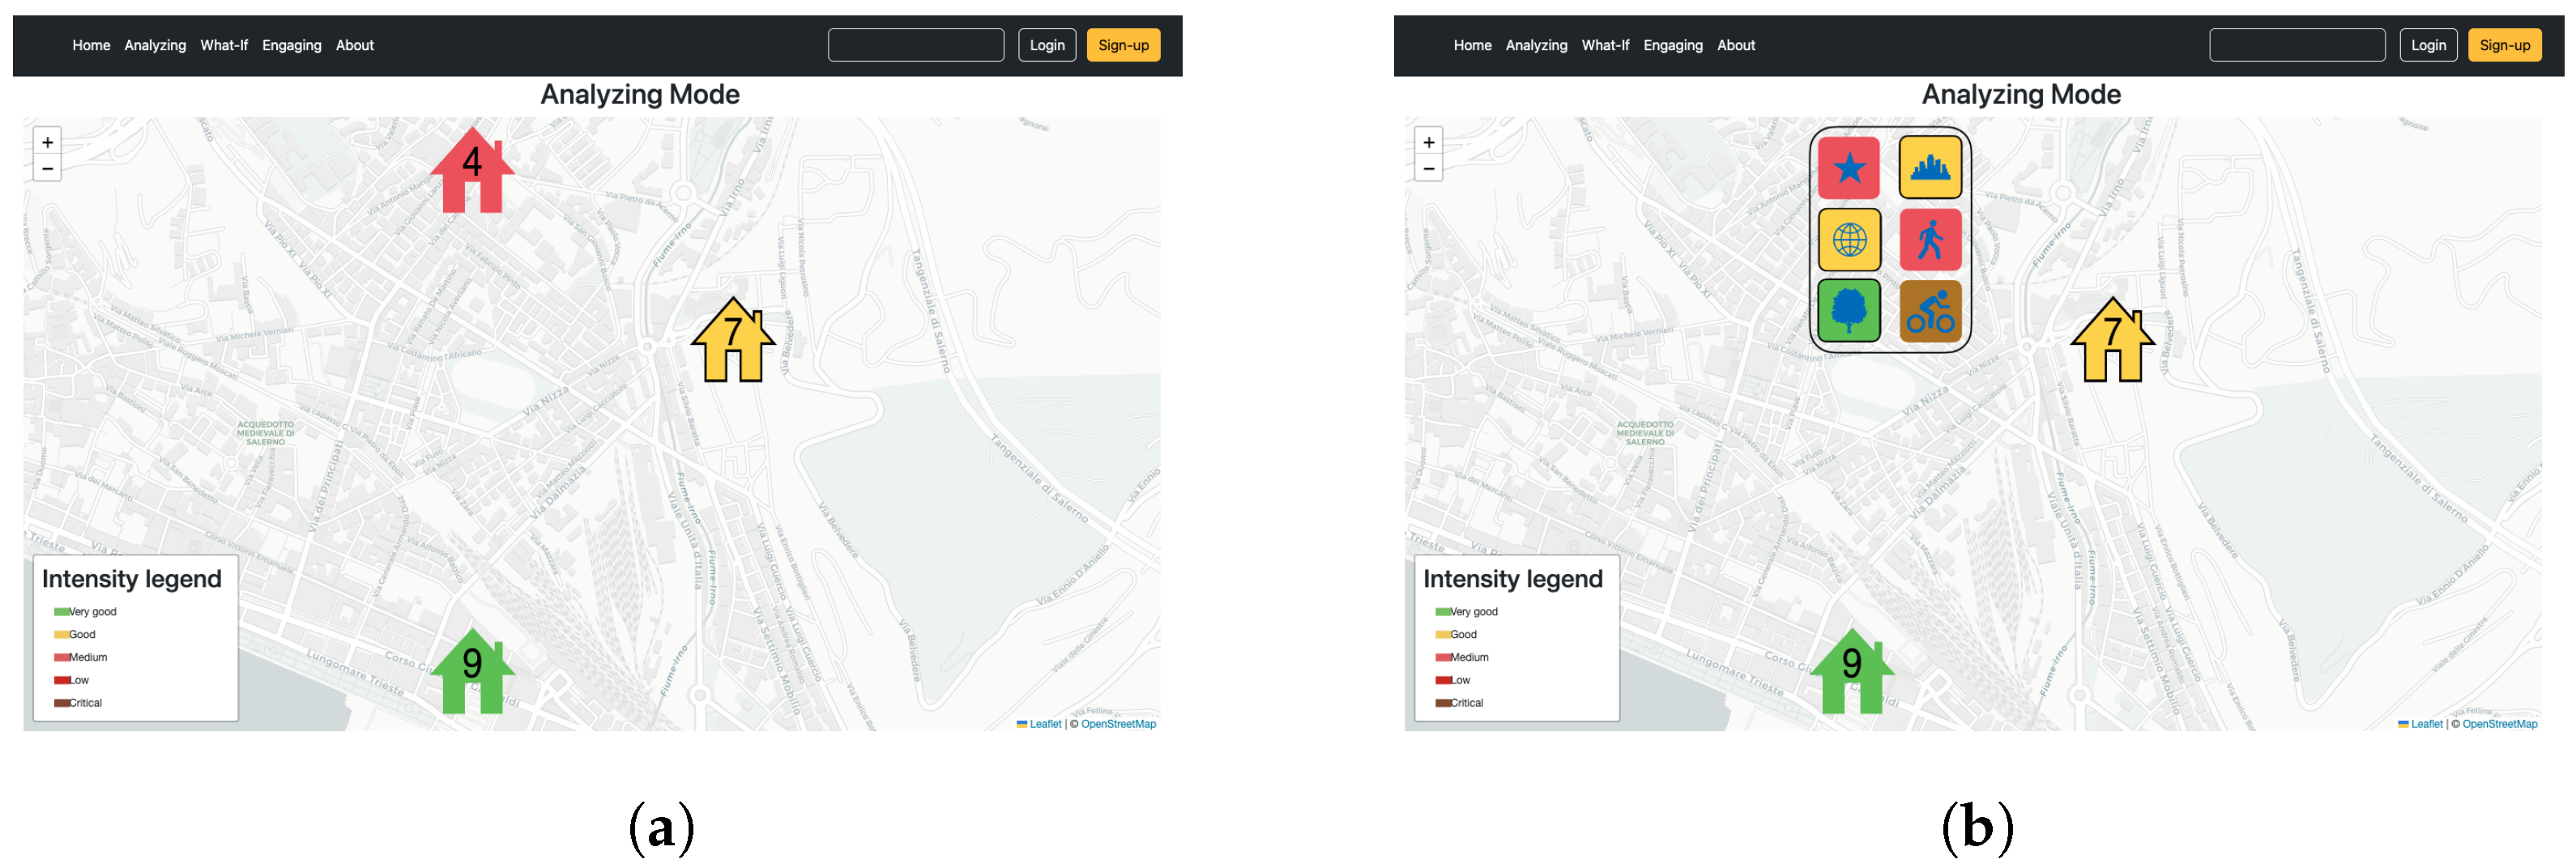
Figure 8a shows an urban area of interest where three UH chorems are located. Here, the chorem on the upper side, visually expresses a red degree of happiness and is associated with a value of four, while the yellow one shows a higher degree, and the green one shows a value of nine.
By applying a semantic zoom to the red UH chorem, it is possible to display the values of the parameters that characterize it, namely the quality of space, the spatial cohesion, the environmental elements, the good vegetation, the bicycle orientedness, and the pedestrian orientedness.
Figure 8b shows the results of such an operator. The low level of UH is most determined by the lack of bicycle orientedness, while the good vegetation parameter balances it with a high value.
The goal of the following section is to show how intuitive chorematic maps are, despite the fact that they represent varied complex phenomena and geographical factors, which contribute to the complexity of an urban environment.
4. Visually Analyzing the Urban Happiness to Improve Citizens’ Lives
Chorems and chorematic maps can be used to study several geographic elements and phenomena since they are suitable for both general-purpose and specific investigations. Moreover, their intuitiveness can be exploited to extend their applicability. As a matter of fact, besides technical experts and administrators, who can manipulate chorems for their analyses, citizens can also be supported in data-interpretation tasks, which thus improves communication and collaboration and aligns the different actors of a smart community towards a shared sustainability goal.
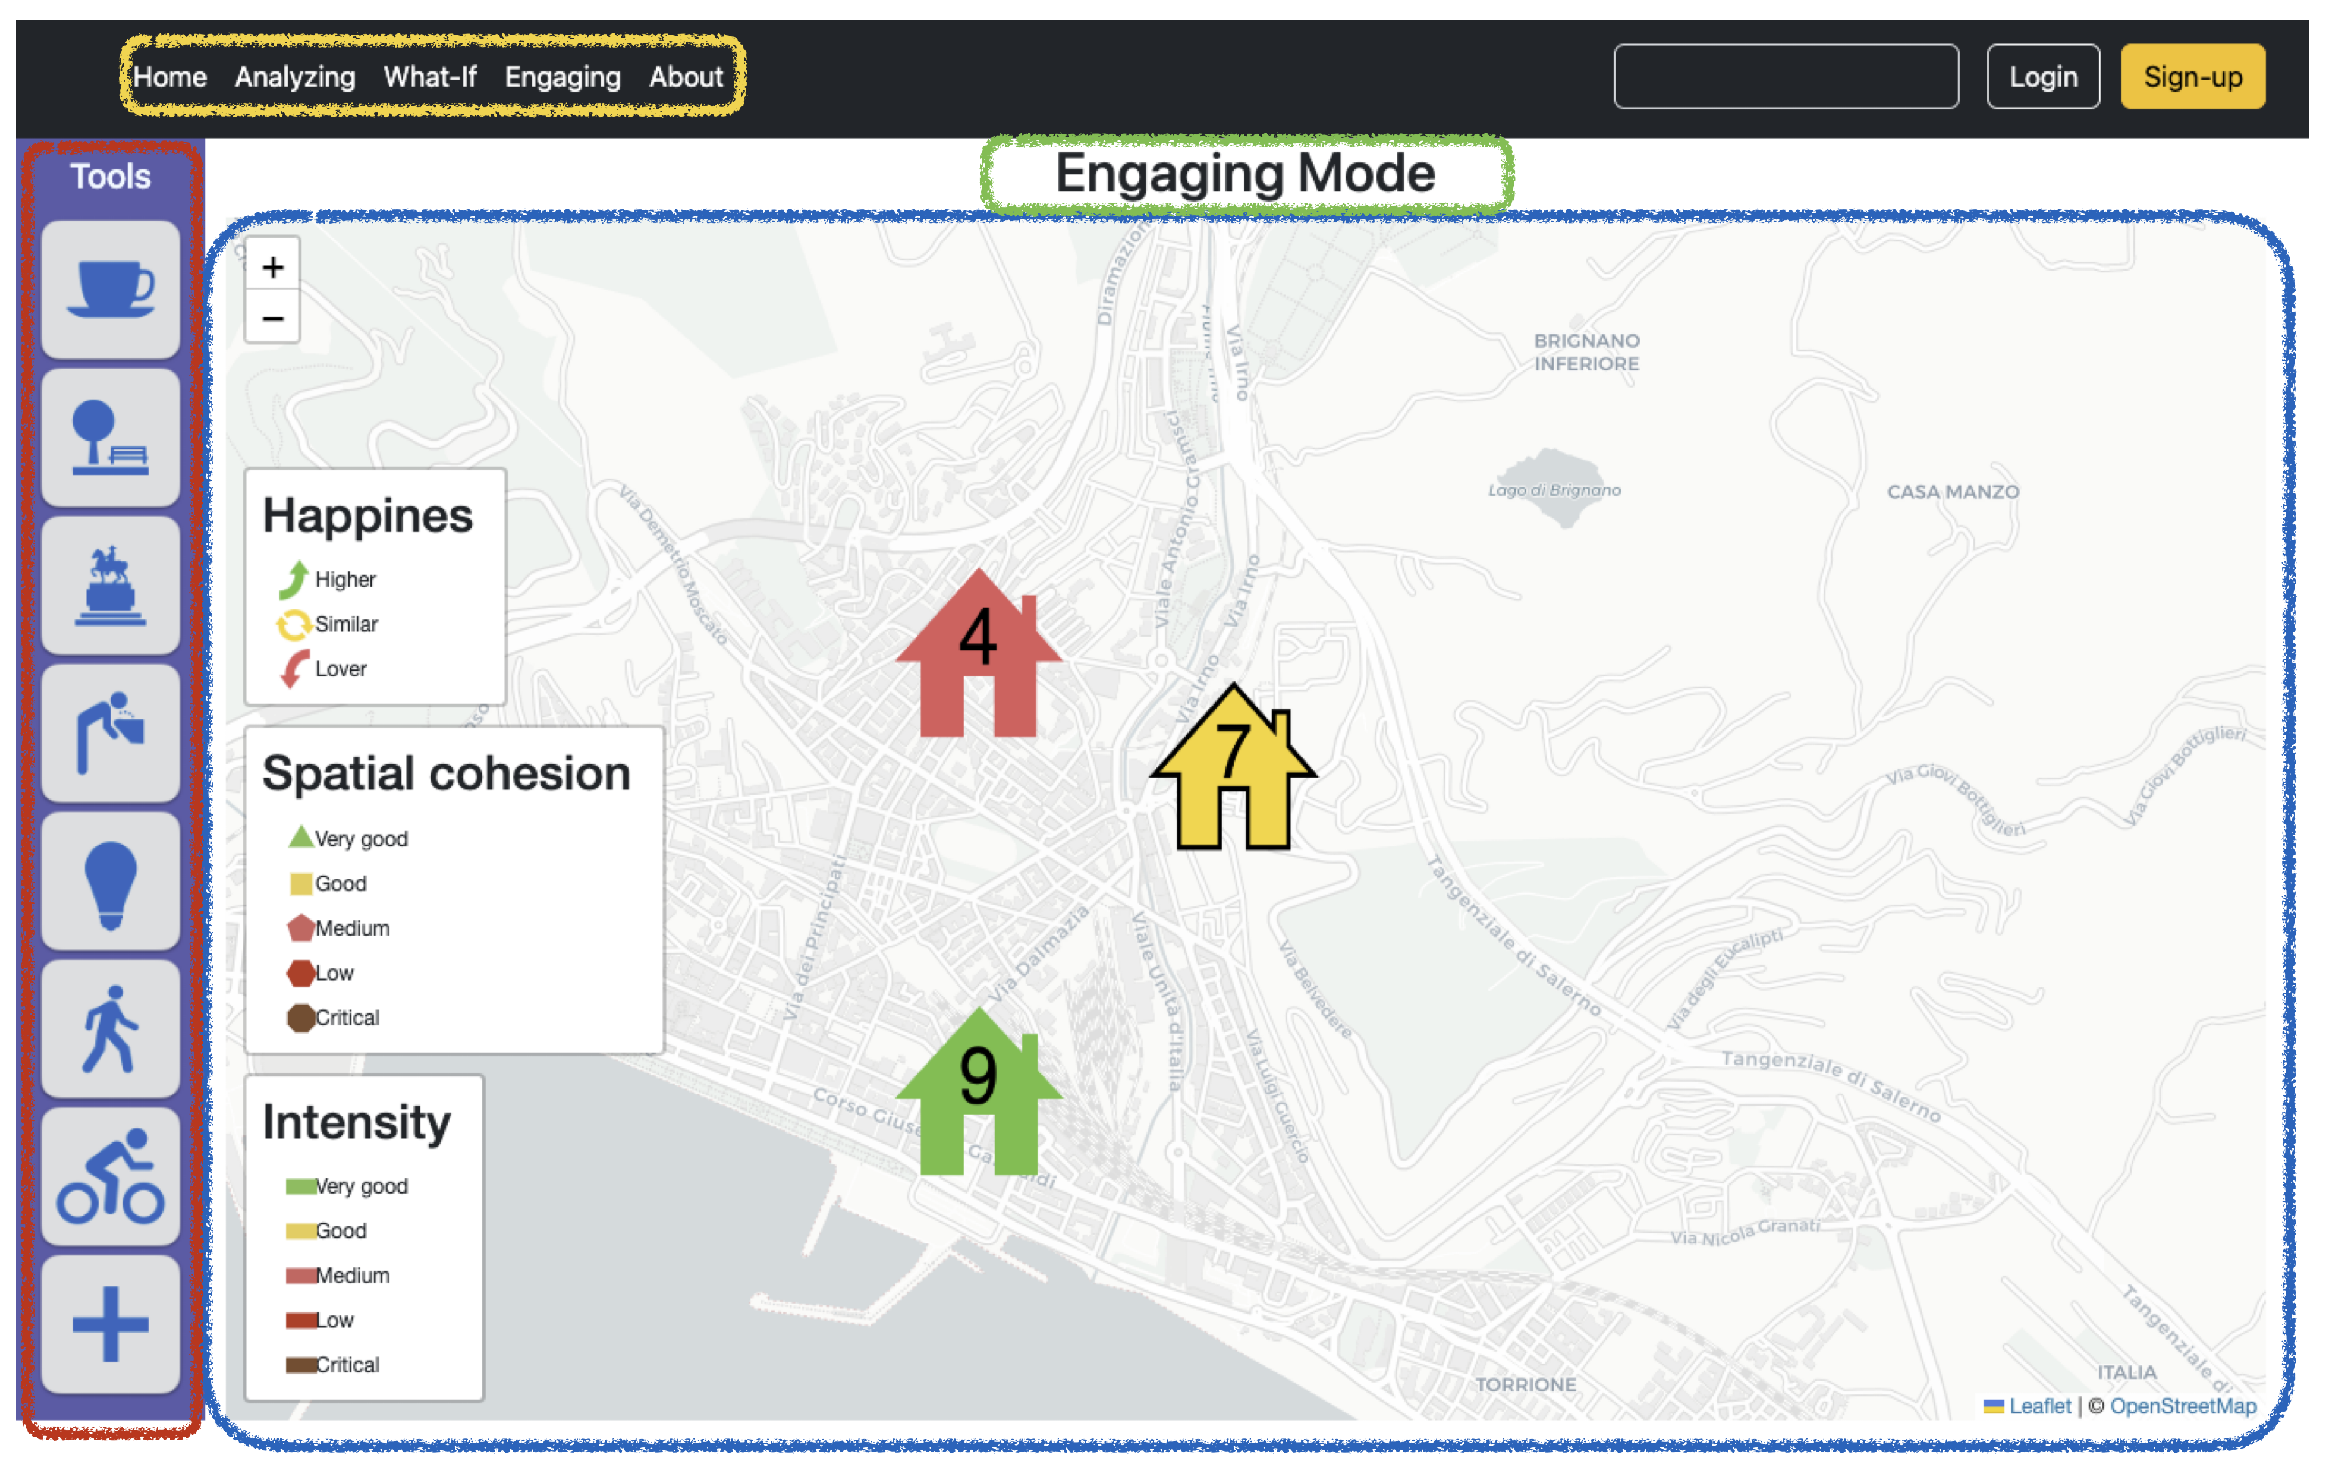
Figure 9 shows the environment built to interact with chorems. It consists of a web application that allows for the visualization of a chorematic layer over the geographic map. The environment has a tool box area on the left, highlighted in red; a map area, highlighted in blue; a menu area, highlighted in yellow; and a mode indicator, highlighted in green. When the application is in
Analyzing Mode, once the area under investigation has been focused on, the user can apply all the chorematic functions, such as a
Geographic Zoom and a
Semantic Zoom, by simply clicking on the involved visualized chorem.
In the following, some examples of investigations conducted by using the above environment are illustrated. They are addressed to study and analyze the UH trend in specific areas and possibly identify actions to perform in order to improve citizens’ life.
Scenario “Sustainability”
As already described in
Figure 8a,b, a UH chorem can visually summarize a set of objective parameters describing a state of urban things. By interacting with it, users can discover more details about that state of things, up to the individual elements that contribute to defining the whole phenomenon.
In
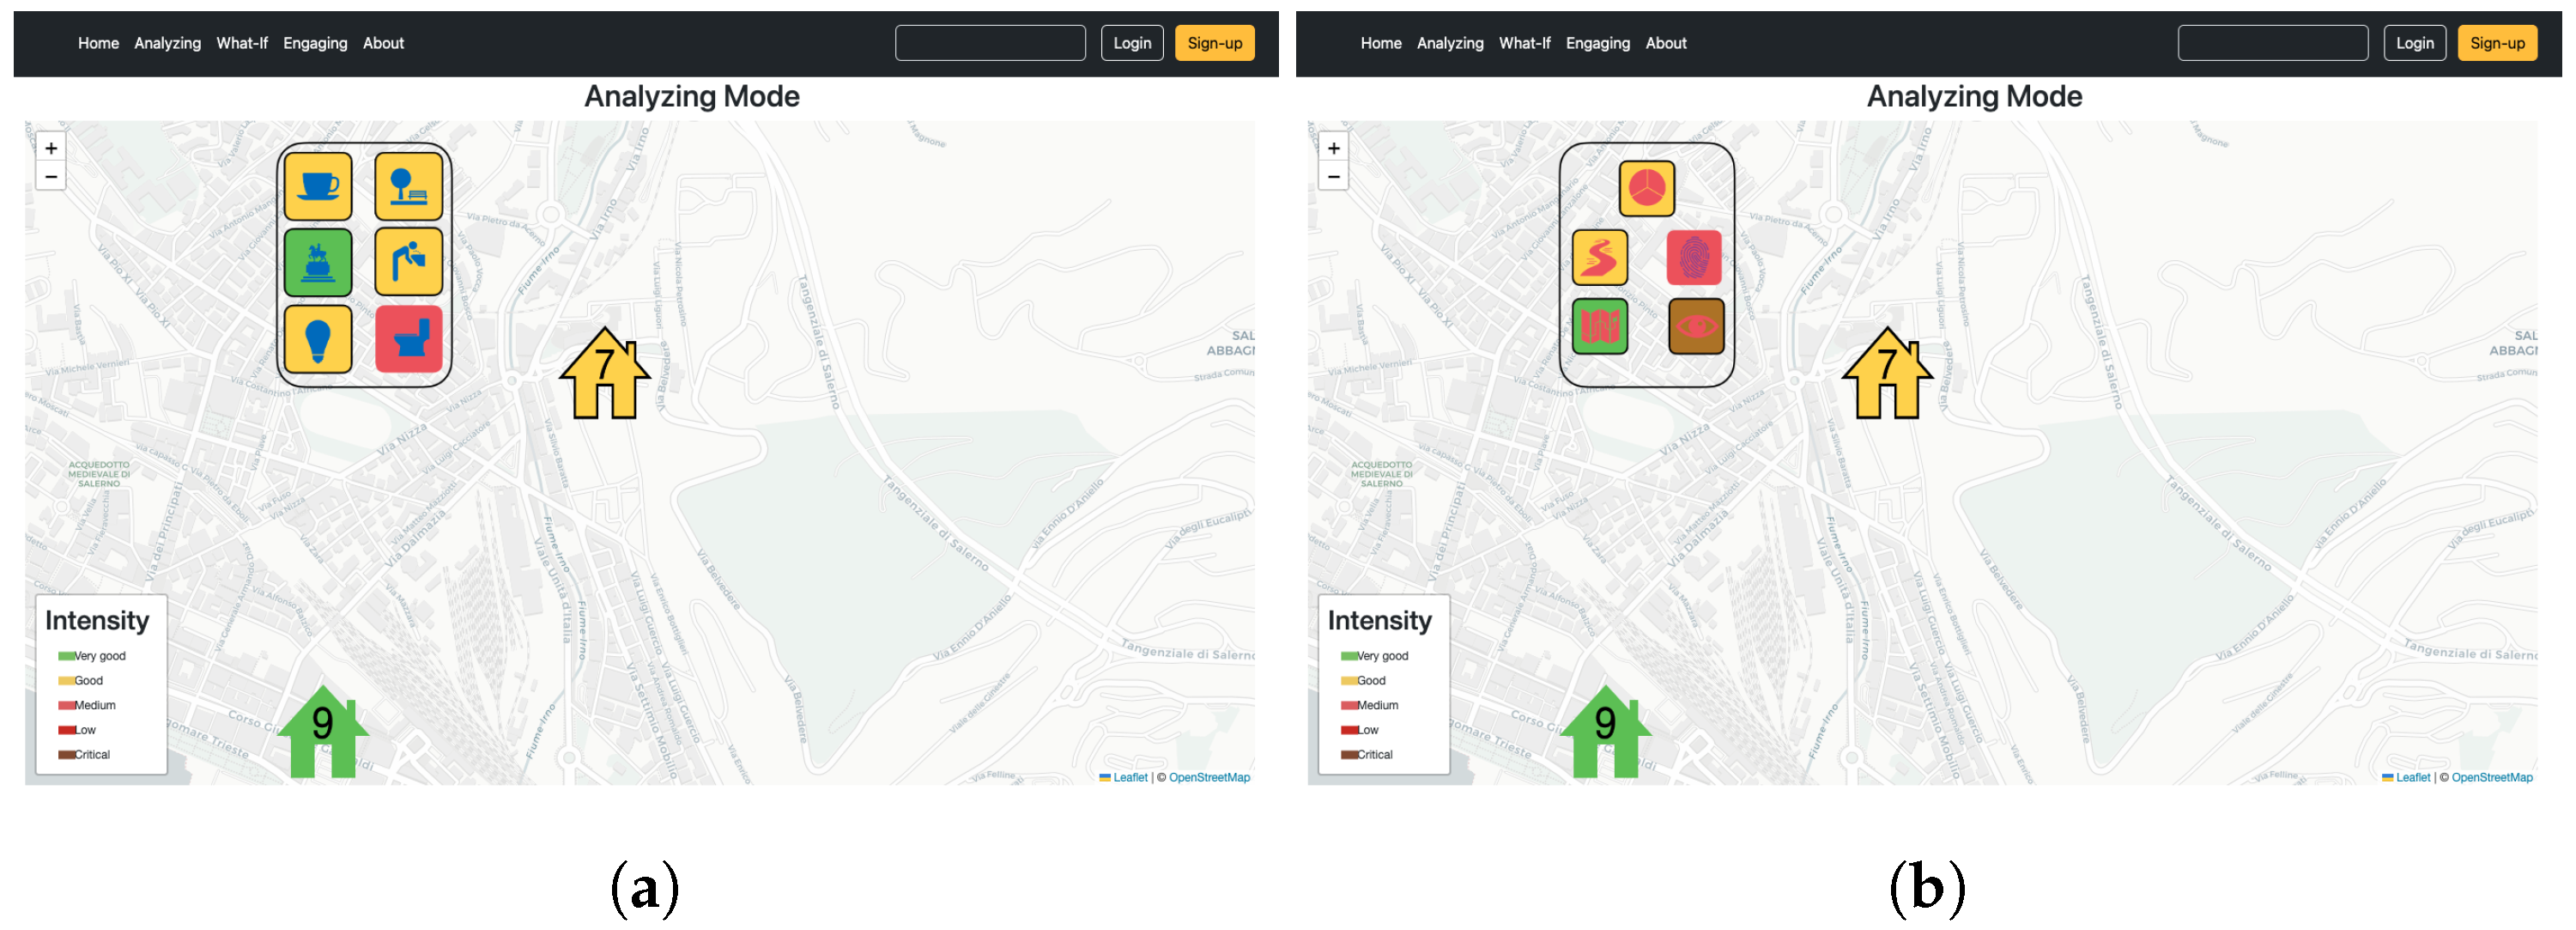
Figure 10, the illustrated scenario can be useful for real estate agencies that are interested in highlighting areas where urban sustainability and happiness represent particularly important aspects. In this case, by showing both the UH chorem and its elements, a real estate agent and her customers are able to compare apparently similar areas and detect which sustainable indicator should be taken into consideration the most.
Figure 10a,b show the results of a semantic zoom applied to reveal the contribution that EE and QS give to the UH phenomenon. In this case, it is possible to detect which elements negatively affect such parameters, namely the access to lavatories for EE and the legibility for QS.
Scenario “What-if”
A local administration can use chorems to identify neighborhoods with high happiness scores and to replicate strategies and programs that have led to success in other similar areas. To this aim, the corresponding UH chorems should be investigated in those areas by several zooming operators to derive information to share with other neighborhoods.
The same approach can be used in diametrically opposite situations. That is, chorems can be used to assess how some elements can variably affect the UH phenomenon in a specific neighborhood, which thus lets users experiment what if scenarios.
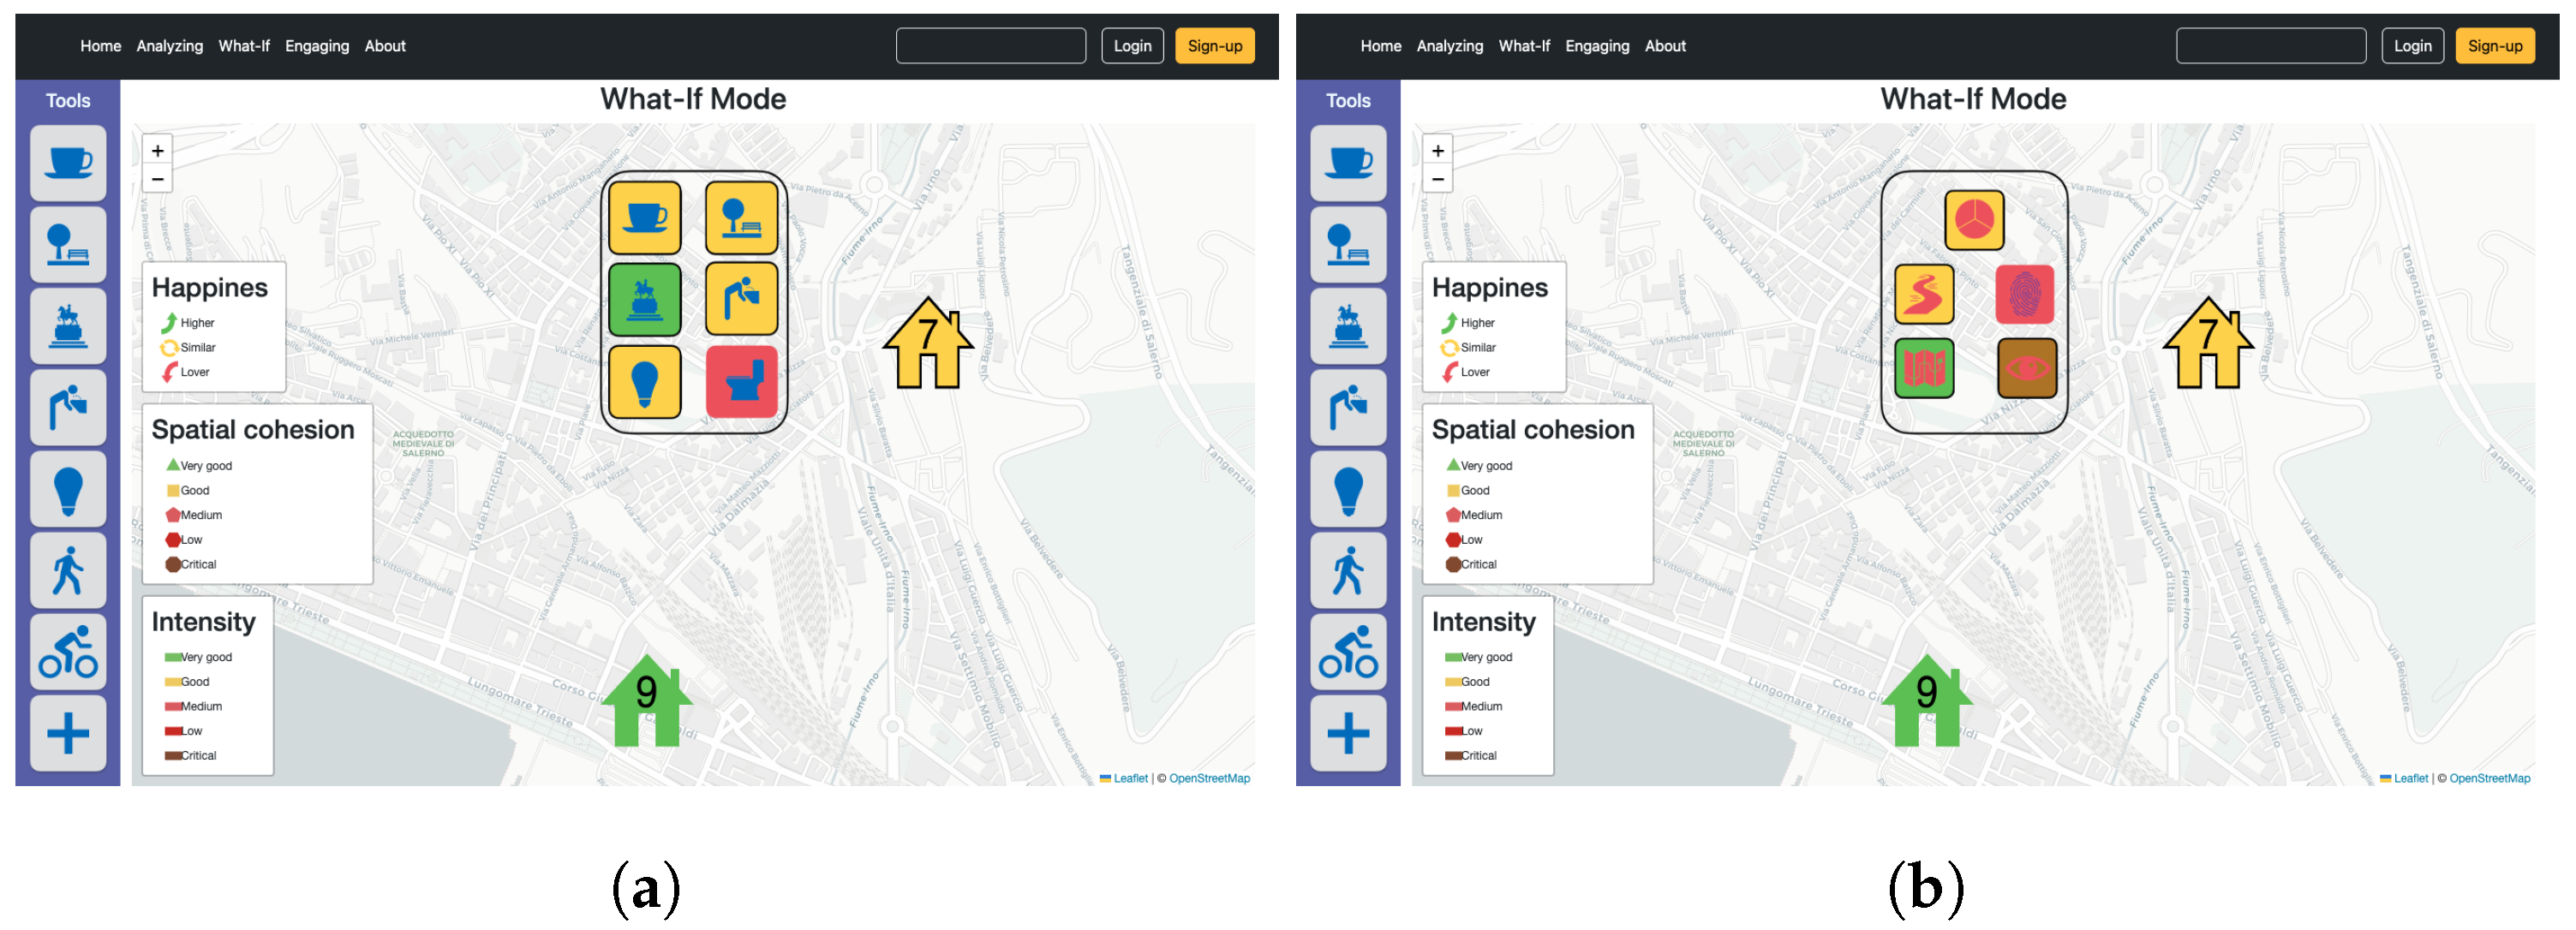
Figure 11 shows possible steps that a user can do in
what if mode. This modality allows individuals to use a visual analytic tool instead of working on Equation (
1) by varying specific qualitative and quantitative parameters and experiment with new scenarios.
In this case,
Figure 11a shows that although the UH phenomenon is negatively affected by the lack of public lavatories, by applying the
Semantic Zoom on the QS chorem (
Figure 11b), it is revealed that the neighborhood is even affected by the low quality of legibility and place identity.
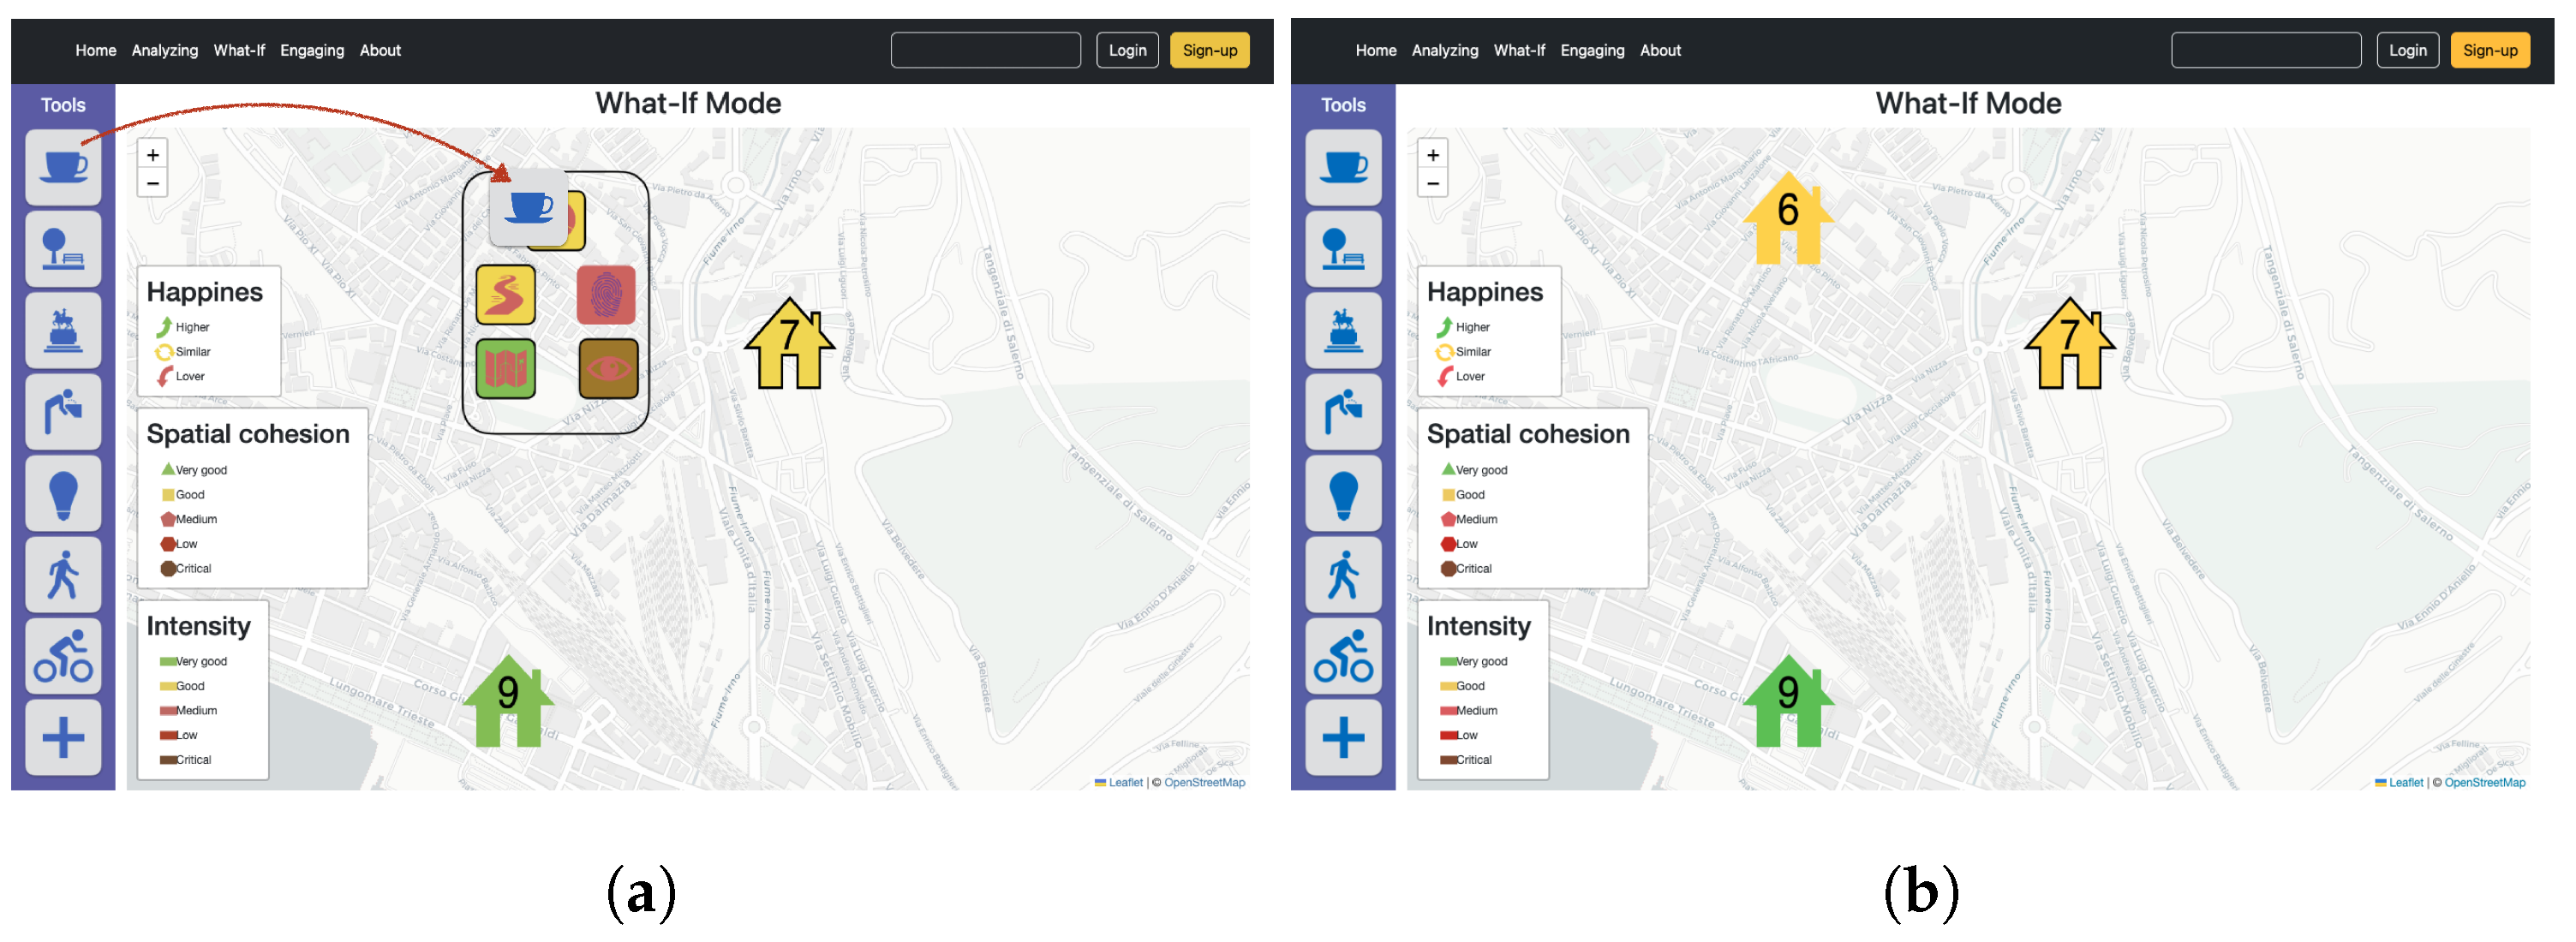
Since these factors are hard to handle in short, the user can evaluate how the UH phenomenon changes when increasing the number of rest shops, such as cafeterias, bars, and restaurants in that zone. To reach this goal, the user can drag the
cafés and restaurants chorem from the left toolbox and drop it in the area (
Figure 12a). By transparently invoking Equation (
1), the application changes the data on which the UH chorem is based, and the new estimation is shown with a new UH chorem, as shown in
Figure 12b.
It is worth to noting that the intuitiveness of the chorem hides the complexity of the underlying model. Although Equation (
1) is rather simple and far from deploying a digital twin, it does not limit the possibility of using chorems even when data might be acquired through more sophisticated models.
Scenario “Public engagement”
The eleventh SDG of the UN 2023 Agenda [
22] claims
“By 2030, enhance inclusive and sustainable urbanization and capacity for participatory, integrated and sustainable human settlement planning and management in all countries”.
The following scenario is addressed to emphasize how the usage of the paradigm based on chorems could increase the capacity for citizens to participate in human settlement planning and management.
Common instruments used to get citizens involved in such activities are surveys, interviews, and polls, as described in [
17,
23,
24,
25,
26,
27,
28,
29], which help develop a theoretical basis for understanding how the urban environment directly and indirectly influences people’s happiness. In the present use case, to encourage engagement in online surveys aimed at determining the weight associated with each UH component, which is the most critical aspect of Equation (
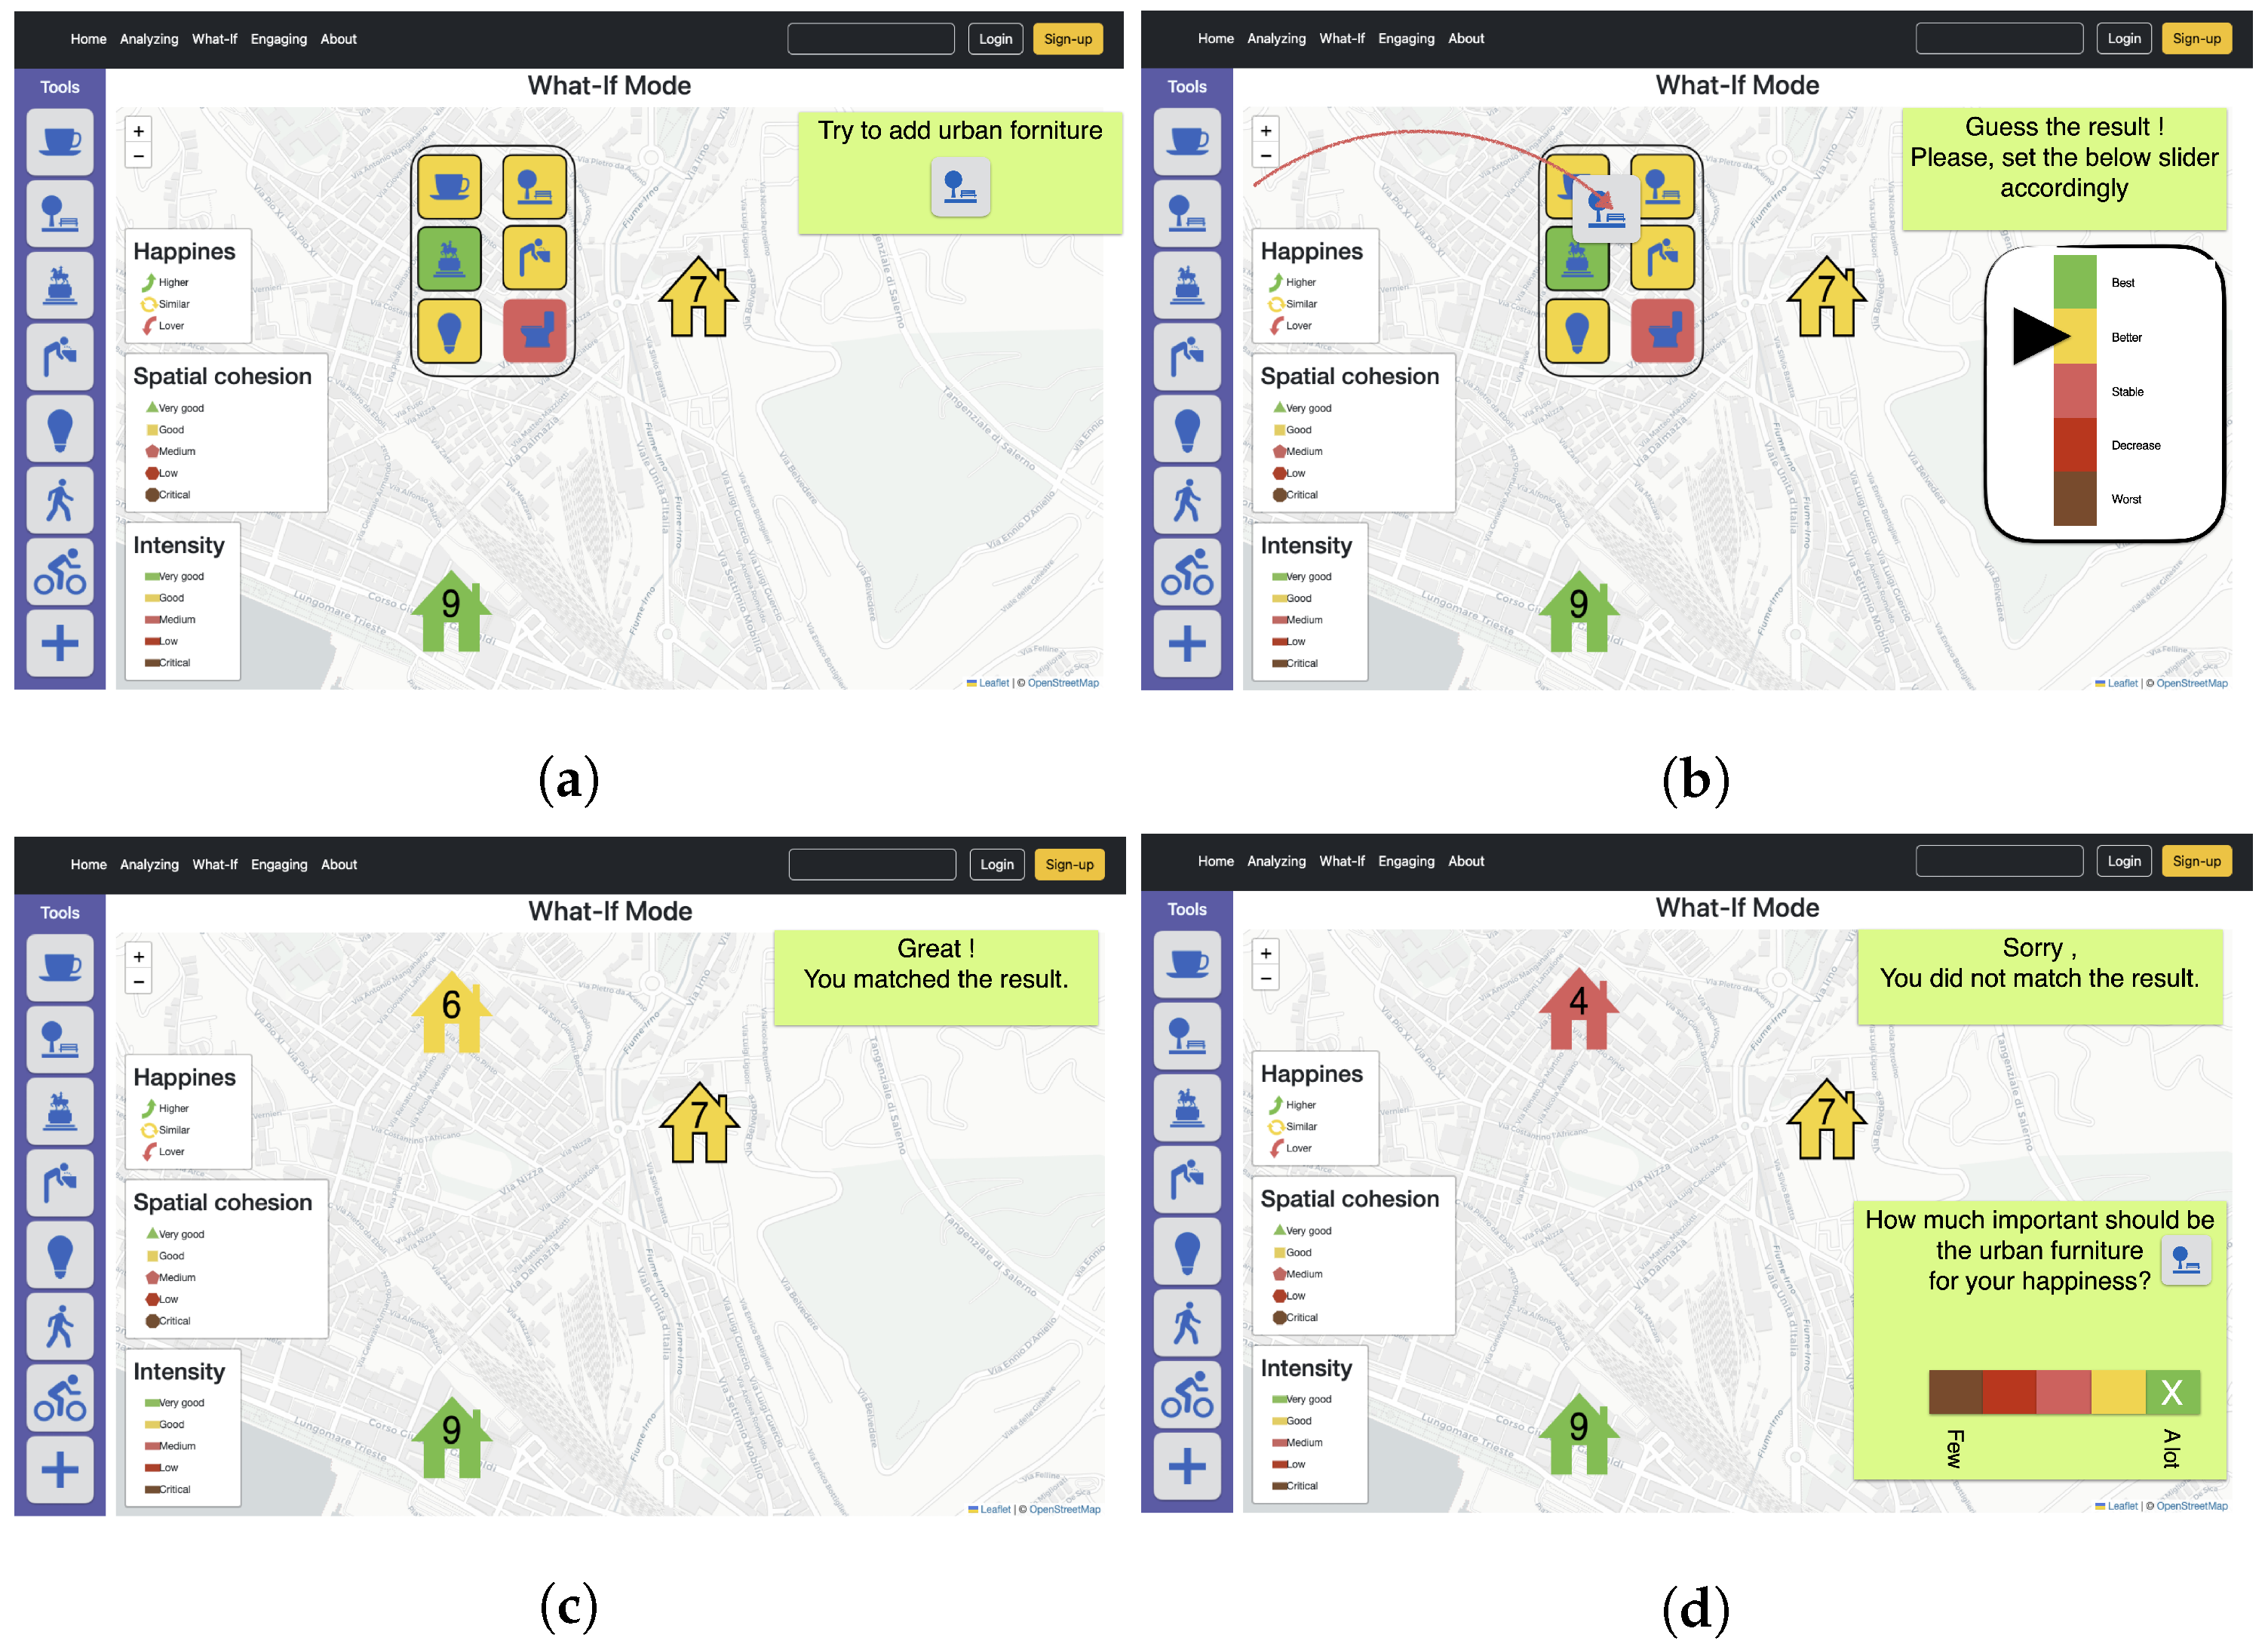
1), a visual gamification is proposed. In particular, users are invited to apply a “
What-If” scenario, similar to the previous one, and provide an opinion from an individual and personal perspective. Additionally, users can suggest new elements that have not yet been considered by creating new chorems.
Figure 13b illustrates how users can express their expectations regarding the improvement in urban furniture quality. It shows the relevance assigned by the user to the “Benches to sit and talk” chorem. If the user’s expectations match those calculated by using Equation (
1), it can be concluded that the weight assigned to the element is in compliance with the user’s preferences, and the application provides the user with positive feedback, as shown in
Figure 13c.
If the user’s expectations do not match those calculated by the application, the user is requested to give feedback, as shown in
Figure 13d, to determine the weight value that the user would assign to the elements, which can be used for further analysis.
5. Discussion
The objective of this paper was to demonstrate how the use of chorems as a visual tool for collecting and analyzing data can encourage actions aimed at promoting sustainability, even among nonexperts. Among the others, a paramount action to be pursued in view of the principles underlying the 2023 Agenda is represented by the citizens’ participation in the decision maker’s awareness about territorial requests and needs.
Over the past ten years, there has been an increasing recognition about the role that citizens can play in yielding prompt and favorable outcomes from interventions, given that they possess the actual knowledge of their living environment [
30]. Even the field of civil protection is becoming increasingly aware of the significant impact that citizens’ involvement can have on decision making and action taking. This is due to the distributed knowledge that citizens possess about their local environment, which can provide crucial insights and perspectives on how to face issues related to civil protection. Moreover, when citizens are involved in decision-making processes, their insights and knowledge can help identify potential risks and hazards, which will lead to prompt and effective actions to mitigate them [
31].
Actually, there are many other areas where an administrator’s decisions can have a direct impact on human well-being and sustainable development, and therefore the usage of a chorem-based paradigm can be helpful in aligning citizens living in the area and the administrator’s decisions. This is particularly relevant when the decisions involve the use of common resources, which can include natural resources closely tied to the geographic location [
32,
33,
34]. By utilizing the chorem-based paradigm, administrators can effectively communicate and involve citizens in decision-making processes that impact their lives, which ensures that the decisions made are more sustainable and supportive of the well-being of the community as a whole.


 (EE chorem); (b) semantic zooming on
  (QS chorem).


