Article

Fluorine-18 Fluorodeoxyglucose Isolation Using Graphene Oxide for Alternative Radiopharmaceutical Spillage Decontamination in PET Scan

by
Mohammad Khairul Azhar Abdul Razab
1,*,
Norazlina Mat Nawi
2,*,
Fara Hana Mohd Hadzuan
1,
Nor Hakimin Abdullah
3,
Maimanah Muhamad
4,
Rosidah Sunaiwi
1,
Fathirah Ibrahim
1,
Farah Amanina Mohd Zin
3 and
An’amt Mohamed Noor
3
1
Medical Radiation Programme, School of Health Sciences, Universiti Sains Malaysia, Health Campus, Kubang Kerian 16150, Kelantan, Malaysia
2
Department of Nuclear Medicine, Radiotherapy & Oncology, School of Medical Sciences, Universiti Sains Malaysia, Health Campus, Kubang Kerian 16150, Kelantan, Malaysia
3
Advanced Materials Research Cluster, Faculty of Bioengineering and Technology, Universiti Malaysia Kelantan, Jeli Campus, Jeli 17600, Kelantan, Malaysia
4
Nuclear Medicine & Molecular Imaging Department, Chancellor Tuanku Muhriz Hospital, Universiti Kebangsaan Malaysia, Jalan Yaacob Latif, Bandar Tun Razak, Cheras 56000, Kuala Lumpur, Malaysia
*
Authors to whom correspondence should be addressed.
Sustainability 2022, 14(8), 4492; https://doi.org/10.3390/su14084492
Submission received: 16 March 2022 / Revised: 1 April 2022 / Accepted: 7 April 2022 / Published: 9 April 2022
(This article belongs to the Special Issue Radioactivity: Sustainable Materials and Innovative Techniques)

Abstract

:
Radiopharmaceuticals (RPC) used for diagnostic and therapeutic purposes in nuclear medicine may contaminate surface areas due to spillage during its preparation or accident during RPC transfer from laboratory to the treatment room. Fluorine-18 Fluorodeoxyglucose (18F-FDG) is the most common RPC for positron emission tomography (PET) scan in nuclear medicine due to its ideal annihilation converted energy at 511 keV and short half-life at 109.8 min. Ineffective medical waste management of 18F-FDG may pose a risk to the environment or cause unnecessary radiation doses to the personnel and public. Depending on the incident rate of these events, simple decontamination methods such as the use of chemicals and swabs might not be cost-effective and sustainable in the environment. This study aims to propose an alternative method to decontaminate 18F-FDG by using graphene oxide (GO). GO was synthesised using the Hummers method while the physical morphology was analysed using a field emission scanning electron microscope (FESEM). 18F-FDG adsorption efficiency rate using GO nanolayers was analysed based on the kinetic study of the GO:18F-FDG mixtures. The chemical adsorbability of the material was analysed via UV–vis spectrophotometer to interlink the microstructures of GO with the sorption affinity interaction. Resultantly, the adsorption rate was effective at a slow decay rate and the optical adsorption of GO with 18F-FDG was dominated by the π π * plasmon peak, which was near 230 nm. By elucidating the underlining GO special features, an alternative technique to isolate 18F-FDG for the decontamination process was successfully proven.

1. Introduction

Radiopharmaceutical (RPC) resources are essential for nuclear imaging and therapeutic purposes in nuclear medicine. Fluorine-18 Fluorodeoxyglucose (18F-FDG) is the most ideal RPC for positron emission tomography (PET) scans due to its ideal half-life and versatile molecular structure [1,2]. Fluorine is considered a favourable atom in drug development due to its physical properties, including a small van der Waals radius (1.47 Å), high electronegativity, and ability to form a strong bond with carbon (C-F energy bond of 112 kcal/mol) [3]. In comparison with a carbon-hydrogen bond (C-H energy bond of 98 kcal/mol), 18F-FDG is more thermally stable and oxidation resistant [3]. Unexpected radioactive contamination might occur in a nuclear medicine department either from source handling, such as breakage of a radionuclide vial, or may originate from the patient either by sneezing, vomiting, or urinating [4]. The hazard associated with radioactive contamination and waste depends on the concentration and nature of the activity of the radionuclide [5]. 18F-FDG, an unstable radioisotope, will decay in the human metabolic process and produce positrons, thereby leading to an annihilation process with electrons and producing pairs of 511 keV gamma-ray photons in 180° directions [6]. This energy is quite high and exposes the personnel, patient, and public to unnecessary radiation doses.
The high demand for PET scans requires mass production of 18F-FDG using cyclotron, which indirectly leads to an increase in the incident rate of radionuclide spillage contaminations. Meanwhile, the usage of a large volume of simple decontamination chemical agents might not be sustainable in the environment [7], and is not cost-effective as its periodic purchase is met with limited production. Thus, alternative decontamination agents must be considered by ensuring the application of a competent material for radionuclide decontamination, which is more efficient, environmentally friendly, and economical in terms of long-term usage of the resources [8].
Graphene oxide (GO) is a nanolayer material that has a carbon compound and is rich in oxygenated functional groups, which makes it a fitting adsorbent for various molecules either in aqueous or dispersed in a polymeric solution [9]. GO also has several desirable properties, such as high surface area, high mechanical strength, electrical conductivity, large pore volume structure, and high solubility due to abundant oxygen-based functional groups [9]. GO is a two-dimensional (2D), carbon-based material that has a single-atom-thin full sp2 hybridised carbon structure with minimal defects, which makes it a well-known adsorbent [10]. Due to its uniquely tuneable physicochemical characteristics [11] and biocompatibility [12], GO has been use in many applications such as the removal of metal ions [13], biomedical [14], electrochemical energy [15], catalysis [16], sensing [17], polymers composite [18], removal of heavy metals [19], wastewater treatment [20] and antibacterial agents [21].
The availability of various functional groups such as carboxyl, hydroxyl, epoxy and keto groups on its nano surface [22] give advantages to GO as a super adsorbent carbon material to efficiently interact with any hazardous and toxic liquid, gas or solid contaminants [23]. Practically, radioactive waste has been decontaminated using special chemical agents which might chemically produce other chemical by-products [24] due to chemical interactions with unstable energetic radionuclide.
Application of GO nanosheets in trapping radionuclides has been conducted on 238U [25], 137Cs [26], 131I [27], 232Th, 95Am, 94Pu, 63Eu, 38Sr and 99mTc [28]. However, adsorption and chemical adsorption characterization of short-live radionuclides such as the 18F radionuclide by using GO has not been comprehensively reported. Herewith, we conduct experiments to prove the efficiency of 18F-FDG decontamination by using GO, which is a stable carbon-based material with minimal production of chemical by-products. The interactions between these compound mixtures with different concentration of GO and activities for energy variations were characterize by using UV–vis spectrometer for complex adsorption capabilities.

2. Materials and Methods

Graphite powder, a naturally occurring form of crystalline carbon along with inorganic compound potassium permanganate (KMnO4) and corrosive substances, sulphuric acid (H2SO4) and phosphoric acid (H3PO4), were used to make up the GO mixture. Hydrogen peroxide (H2O2, 30%) and ice cubes were used to initiate and phase out the oxidation process. Consequently, hydrochloric acid (HCl) and distilled water were used for the centrifuge process. 18F-FDG was obtained at the Nuclear Medicine & Molecular Imaging Department, Chancellor Tuanku Muhriz Hospital, Universiti Kebangsaan Malaysia. A dose calibrator (Capintec CRC-25R, Capintec Inc., Florham Park, NJ, USA) was used to monitor and record the activity of the radionuclides. The characterisation of the synthesised GO was performed using FESEM (FEI QuantaTM 450 FEG, FEI Company, Hillsboro, OR, USA) at SEM Laboratory, School of Health Sciences, Universiti Sains Malaysia. Furthermore, a morphological analysis of the nanolayers and their porosity was conducted. Meanwhile, the chemical adsorbability affinity of the GO:18F-FDG was analysed using a UV–vis spectrometer (CARY 100 Bio, Agilent Technologies Inc., Santa Clara, CA, USA) at the Analytical Laboratory, School of Health Sciences, Universiti Sains Malaysia.

2.1. Synthesis of Graphene Oxide

The Graphene oxide was synthesised by the widely used Hummer’s method [29,30,31]. About 3 g of graphite and 18 g of KMnO4 were added to the 320 mL of H2SO4 and 80 mL of H3PO4 in a ratio of 4:1, respectively. The mouth of the beaker was closed with an aluminium foil and stirred for three days continuously before transferring the reagent into a 500 mL ice cube along with 27 mL of H2O2 (30%) to stop the oxidation and cooling process. The dark brown mixture formed was known as graphite oxide, which was then washed with HCl to separate the GO from the chemical by-products and unexfoliated graphite. About 15 mL of the mixture and 15 mL of HCL were mixed and centrifuged at 5000 g/rpm for 10 min. This washing process was repeated thrice before washing with distilled water several times and centrifuged with the same setting until a pH of 5 was achieved.

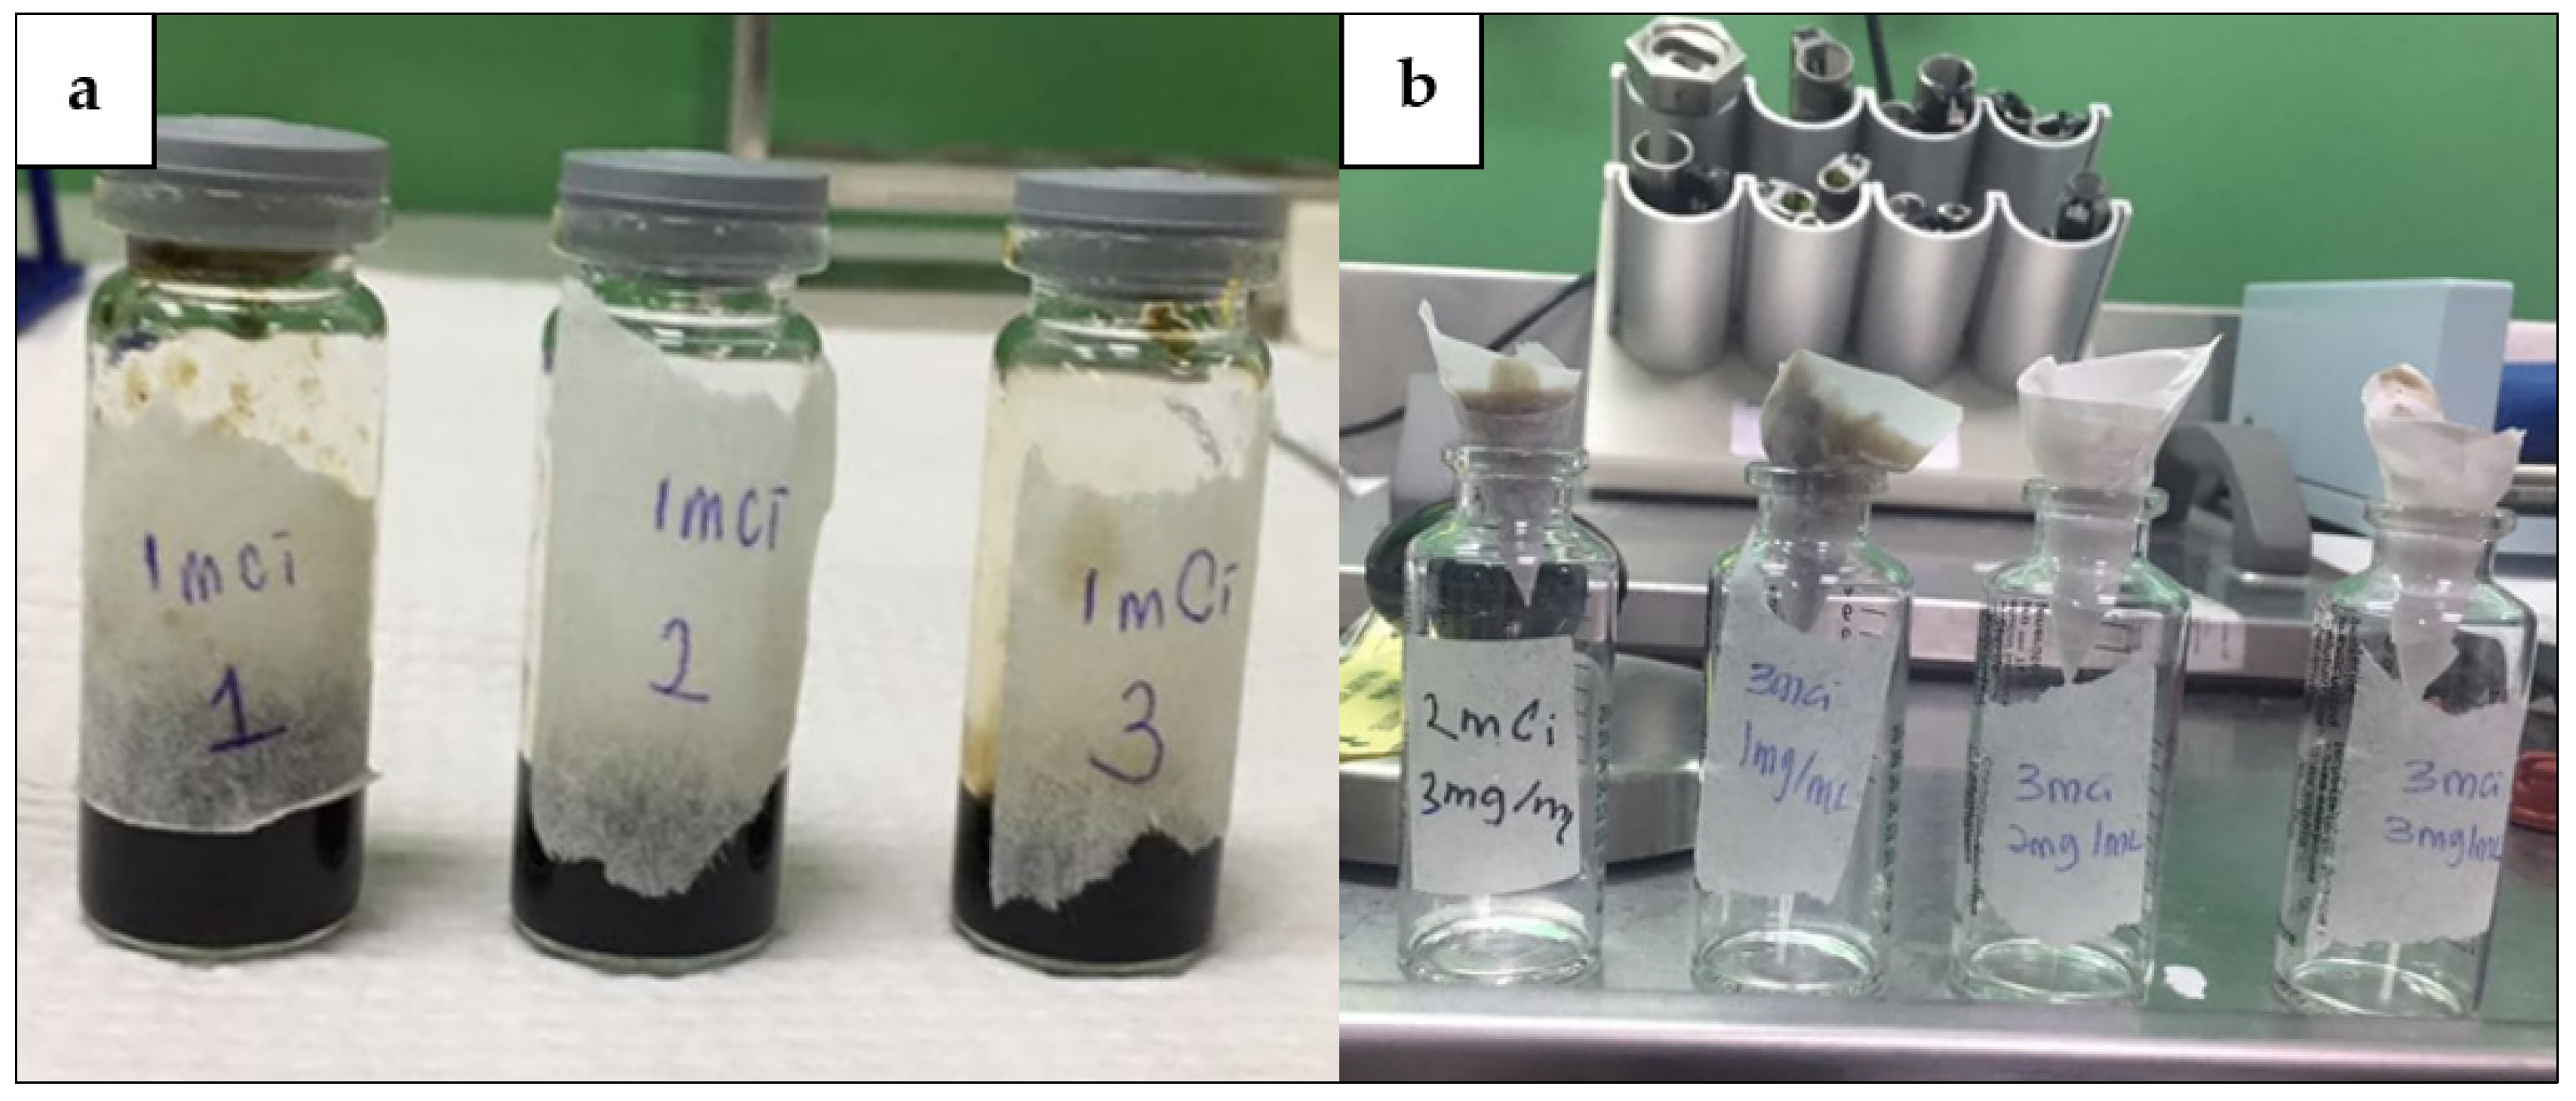
2.2. Isolation of 18F-FDG

The GO concentrations were varied into 1 mg/mL, 2 mg/mL, and 3 mg/mL, which were obtained by applying Equation (1), where M1 is the initial concentration of the solution, V1 is the volume of the solution, M2 is the concentration of the diluted solution after adding more solvent, and V2 is the volume of the diluted solution.
M1V1 = M2V2
The FDG dispenser (NUCLEMED 317R3, NUCLEMED BV, Roeselare, Belgium) was used to accurately prepare the 37 MBq, 74 MBq, and 111 MBq of 18F-FDG, and three different concentrations of GO were added into each glass serum vial as shown in Figure 1a. The mixture of GO:18F-FDG was then poured on a filter paper, and the sediment was obtained as depicted in Figure 1b. The radioactivity of the sediment along with the filter paper and the filtrate (if available) were obtained using the dose calibrator ionisation chamber over the function of time (Ao = initial activity, Ao/4 = 54.9 min, Ao/2 = 109.8 min, Ao3/4 = 164.7 min, and Ao/16 = 219.6 min). The radioactivity of each activity with different concentrations was compared to the natural decay of 18F-FDG by plotting the decay graph. A Geiger–Muller survey meter (Model Fluke 451B, Fluke Corporation, Everett, WA, USA) was used during the experiment to measure the radiation exposure, ensuring there was no leakage or spillage of the radionuclide source on any surfaces in the laboratory.

3. Results and Discussions

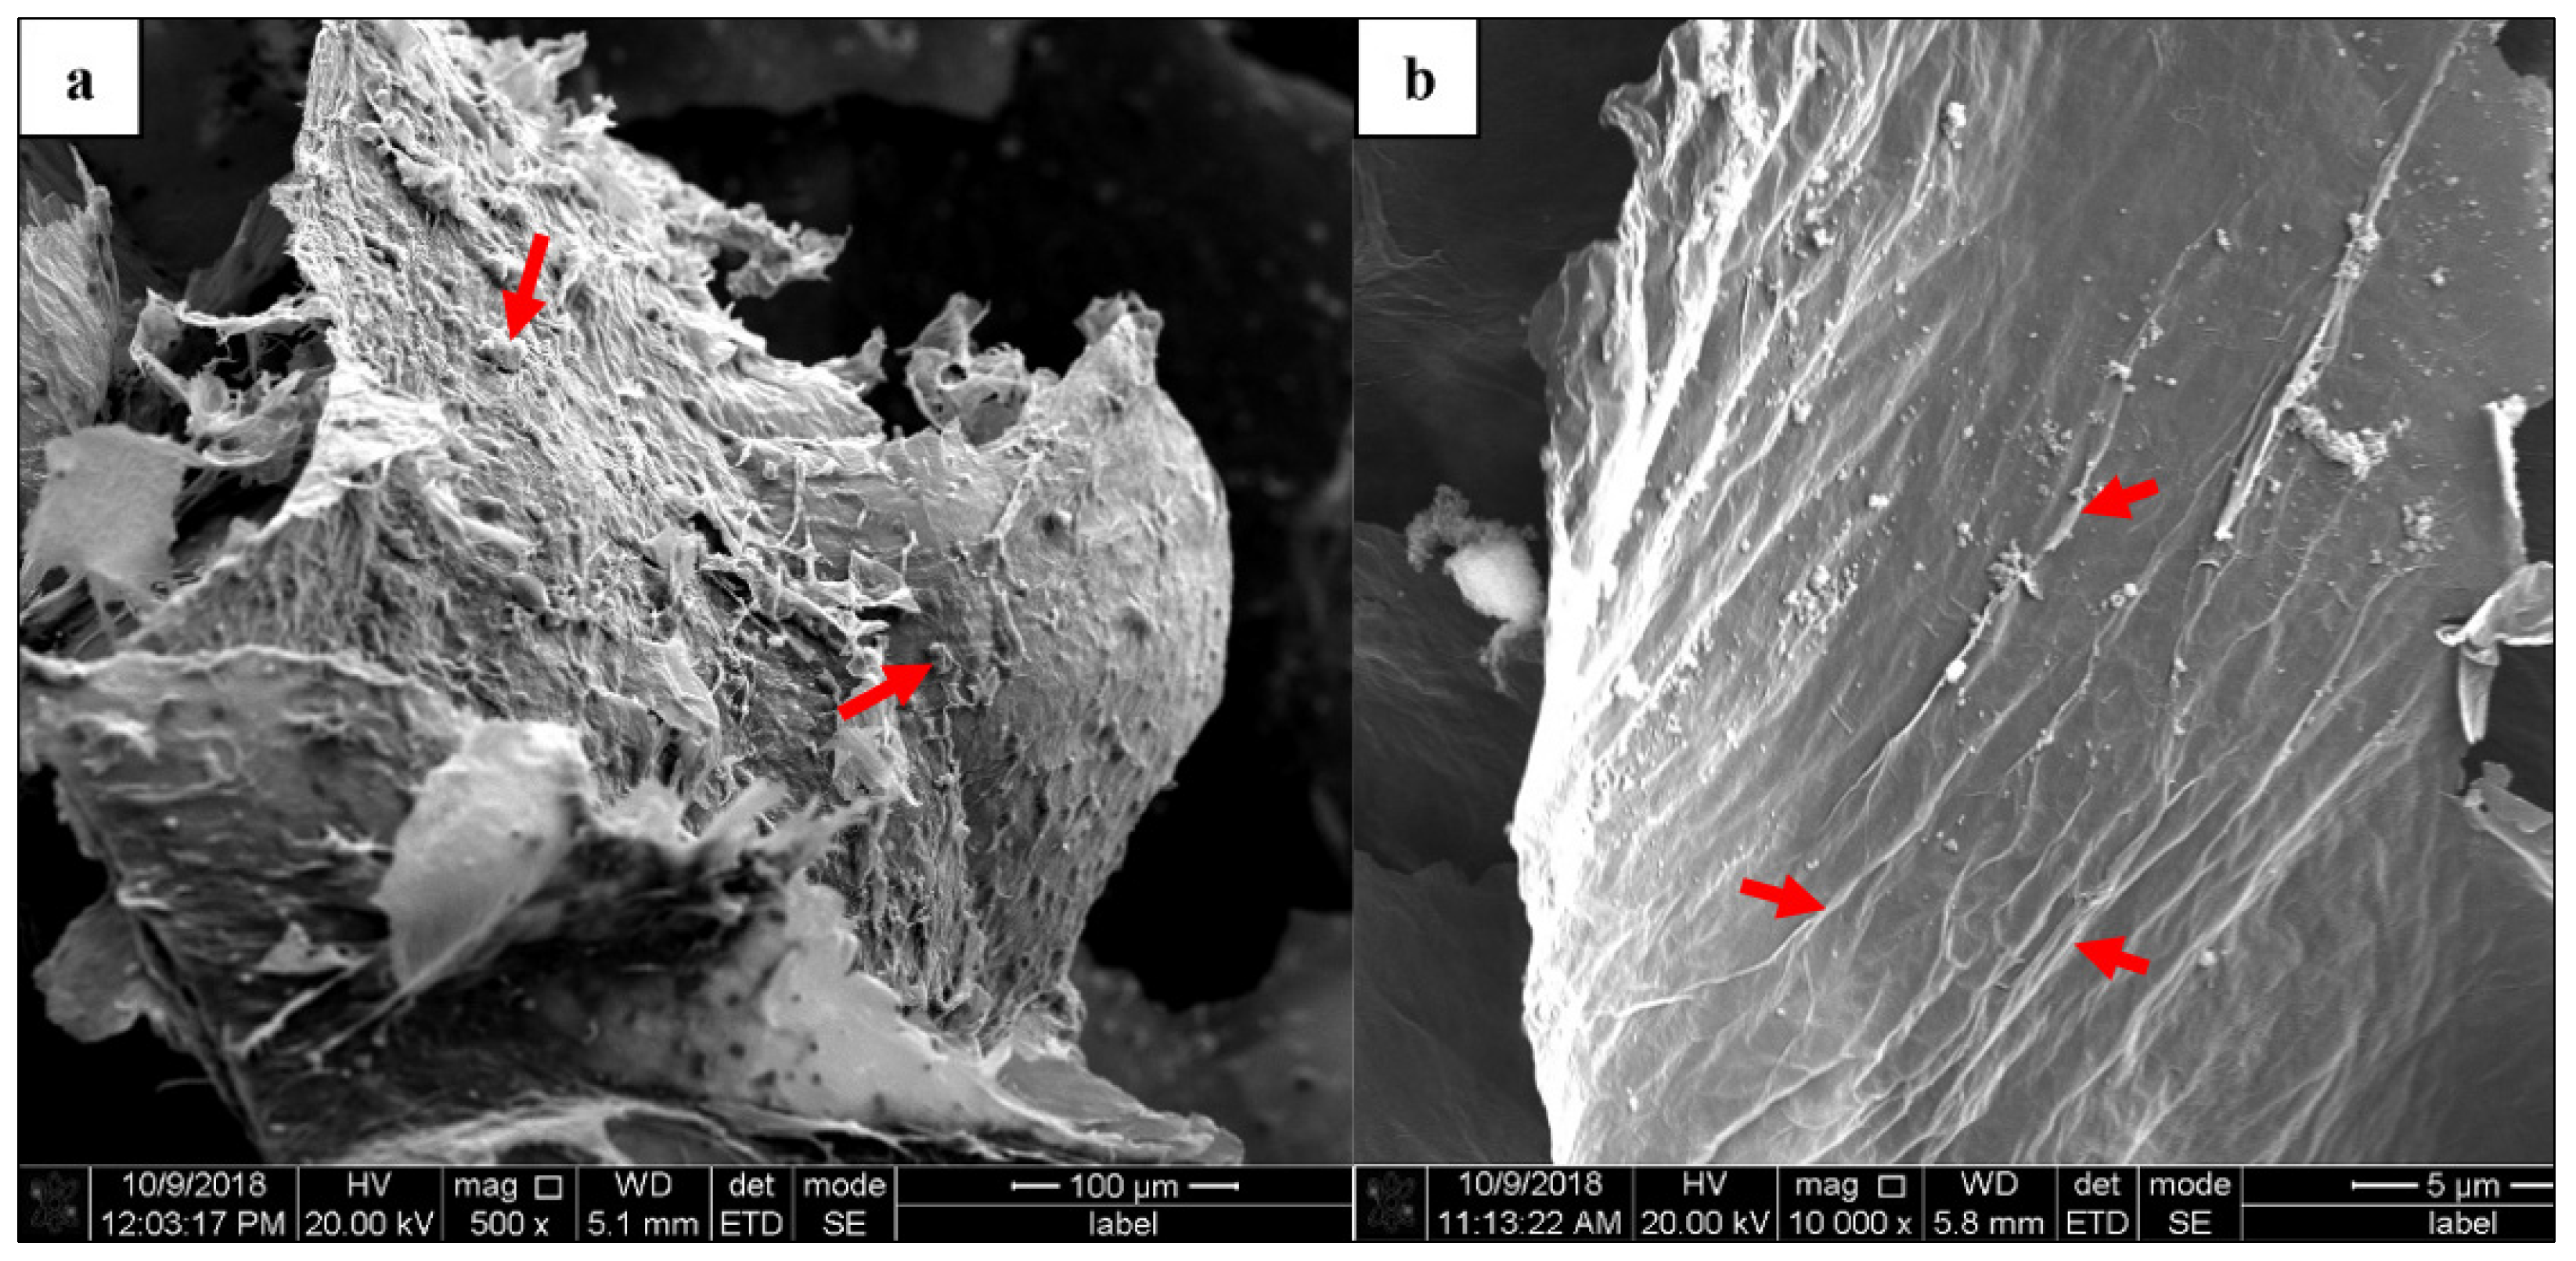
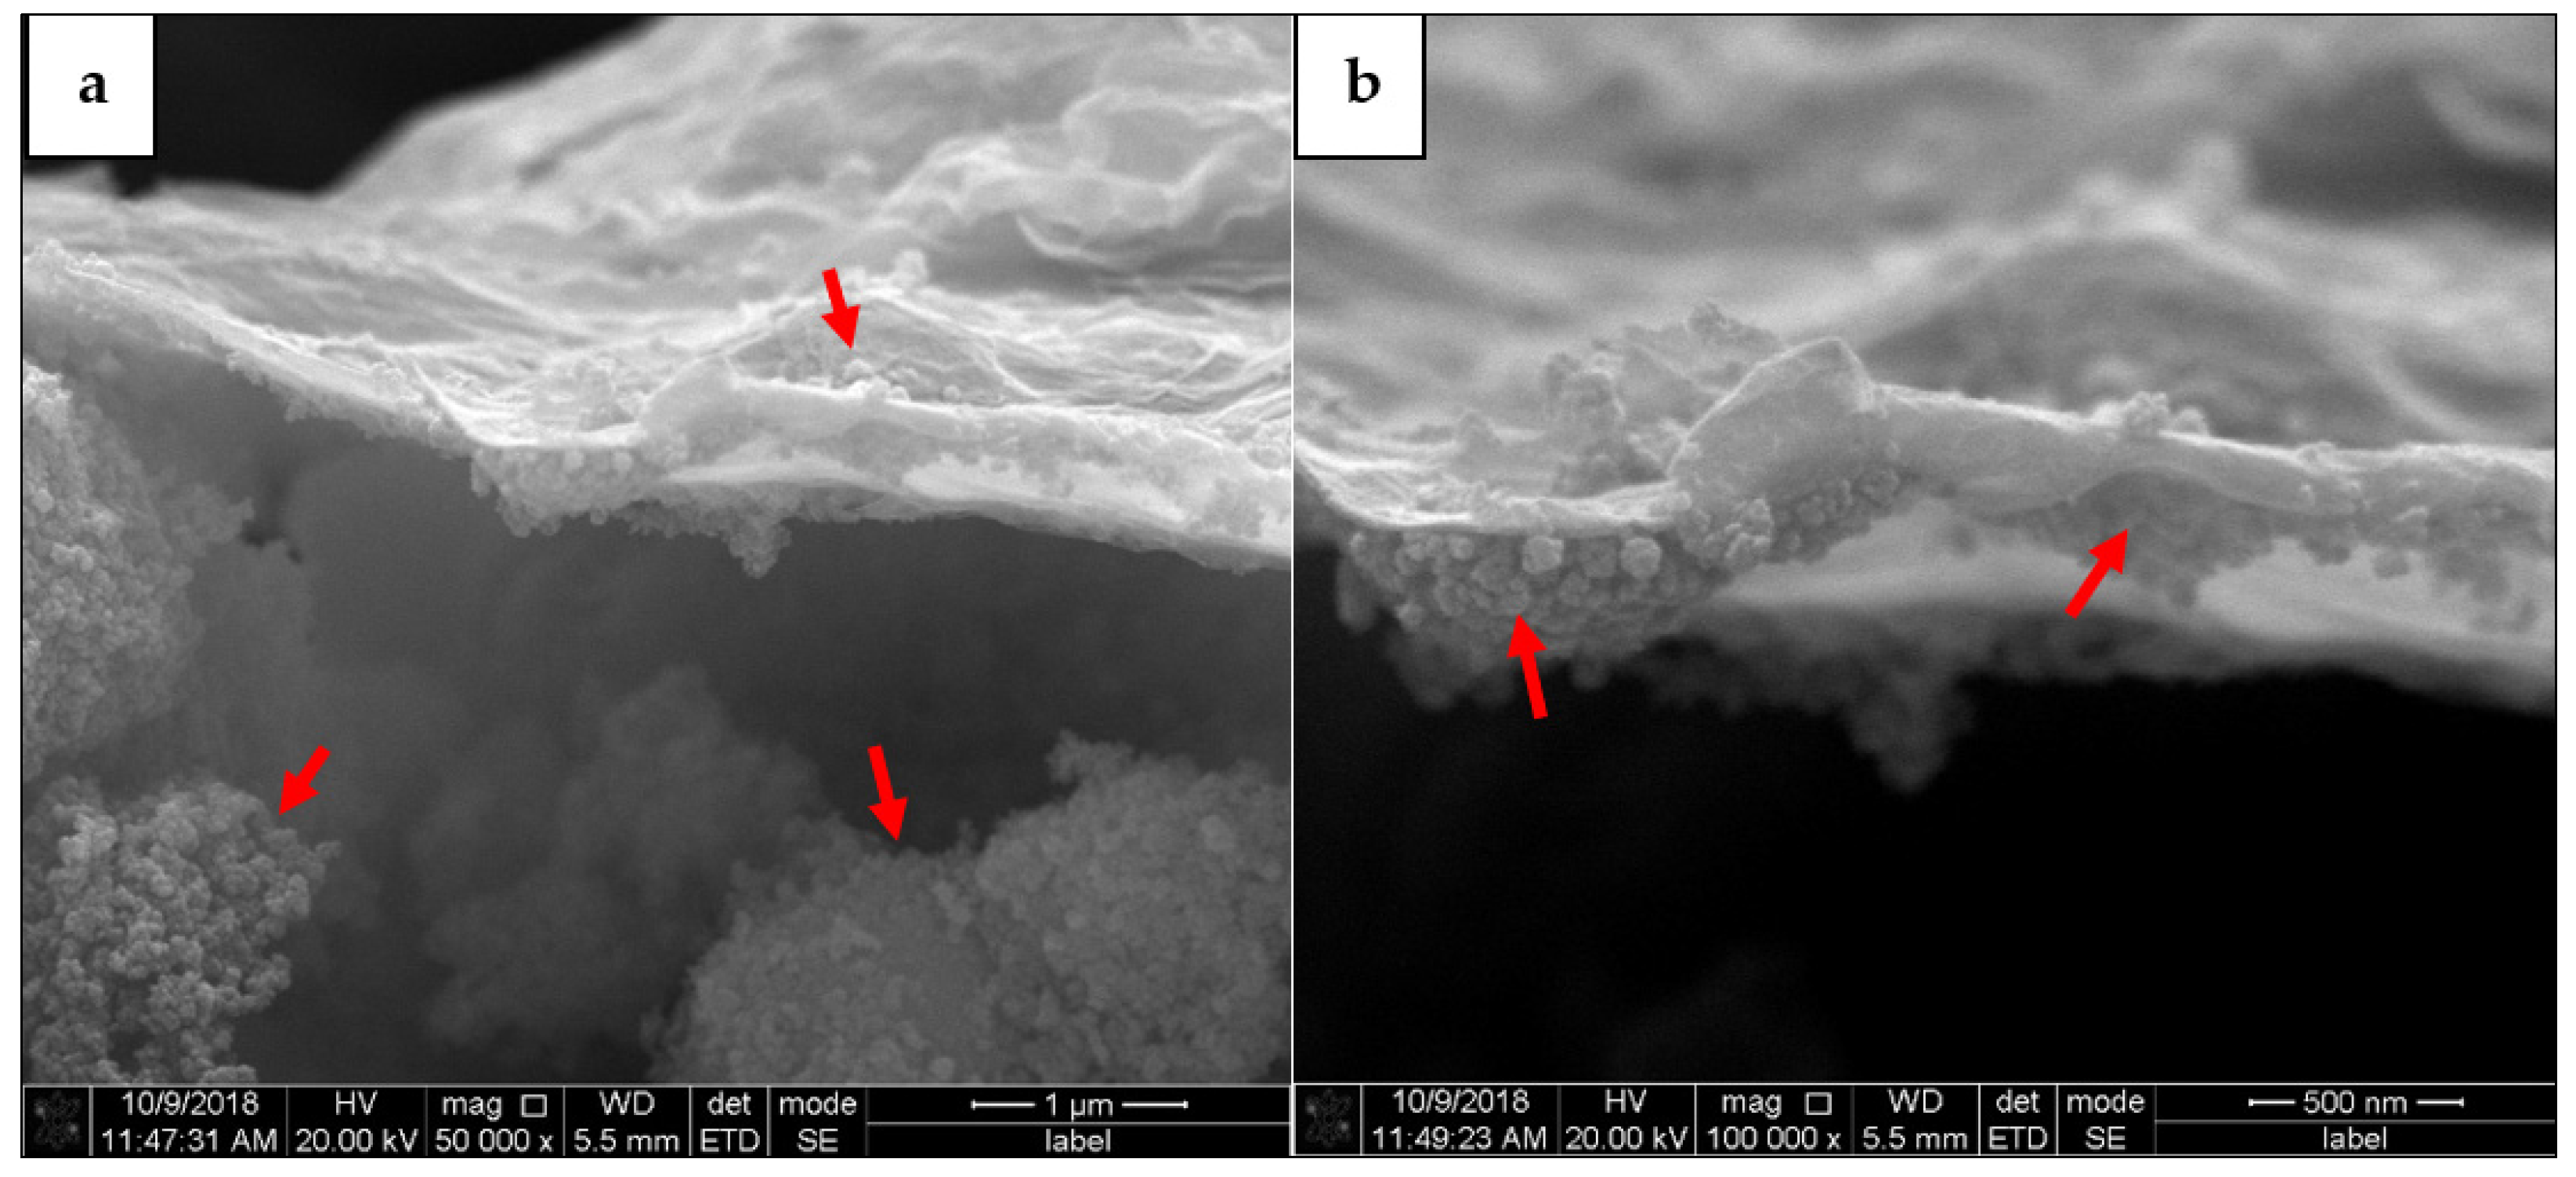
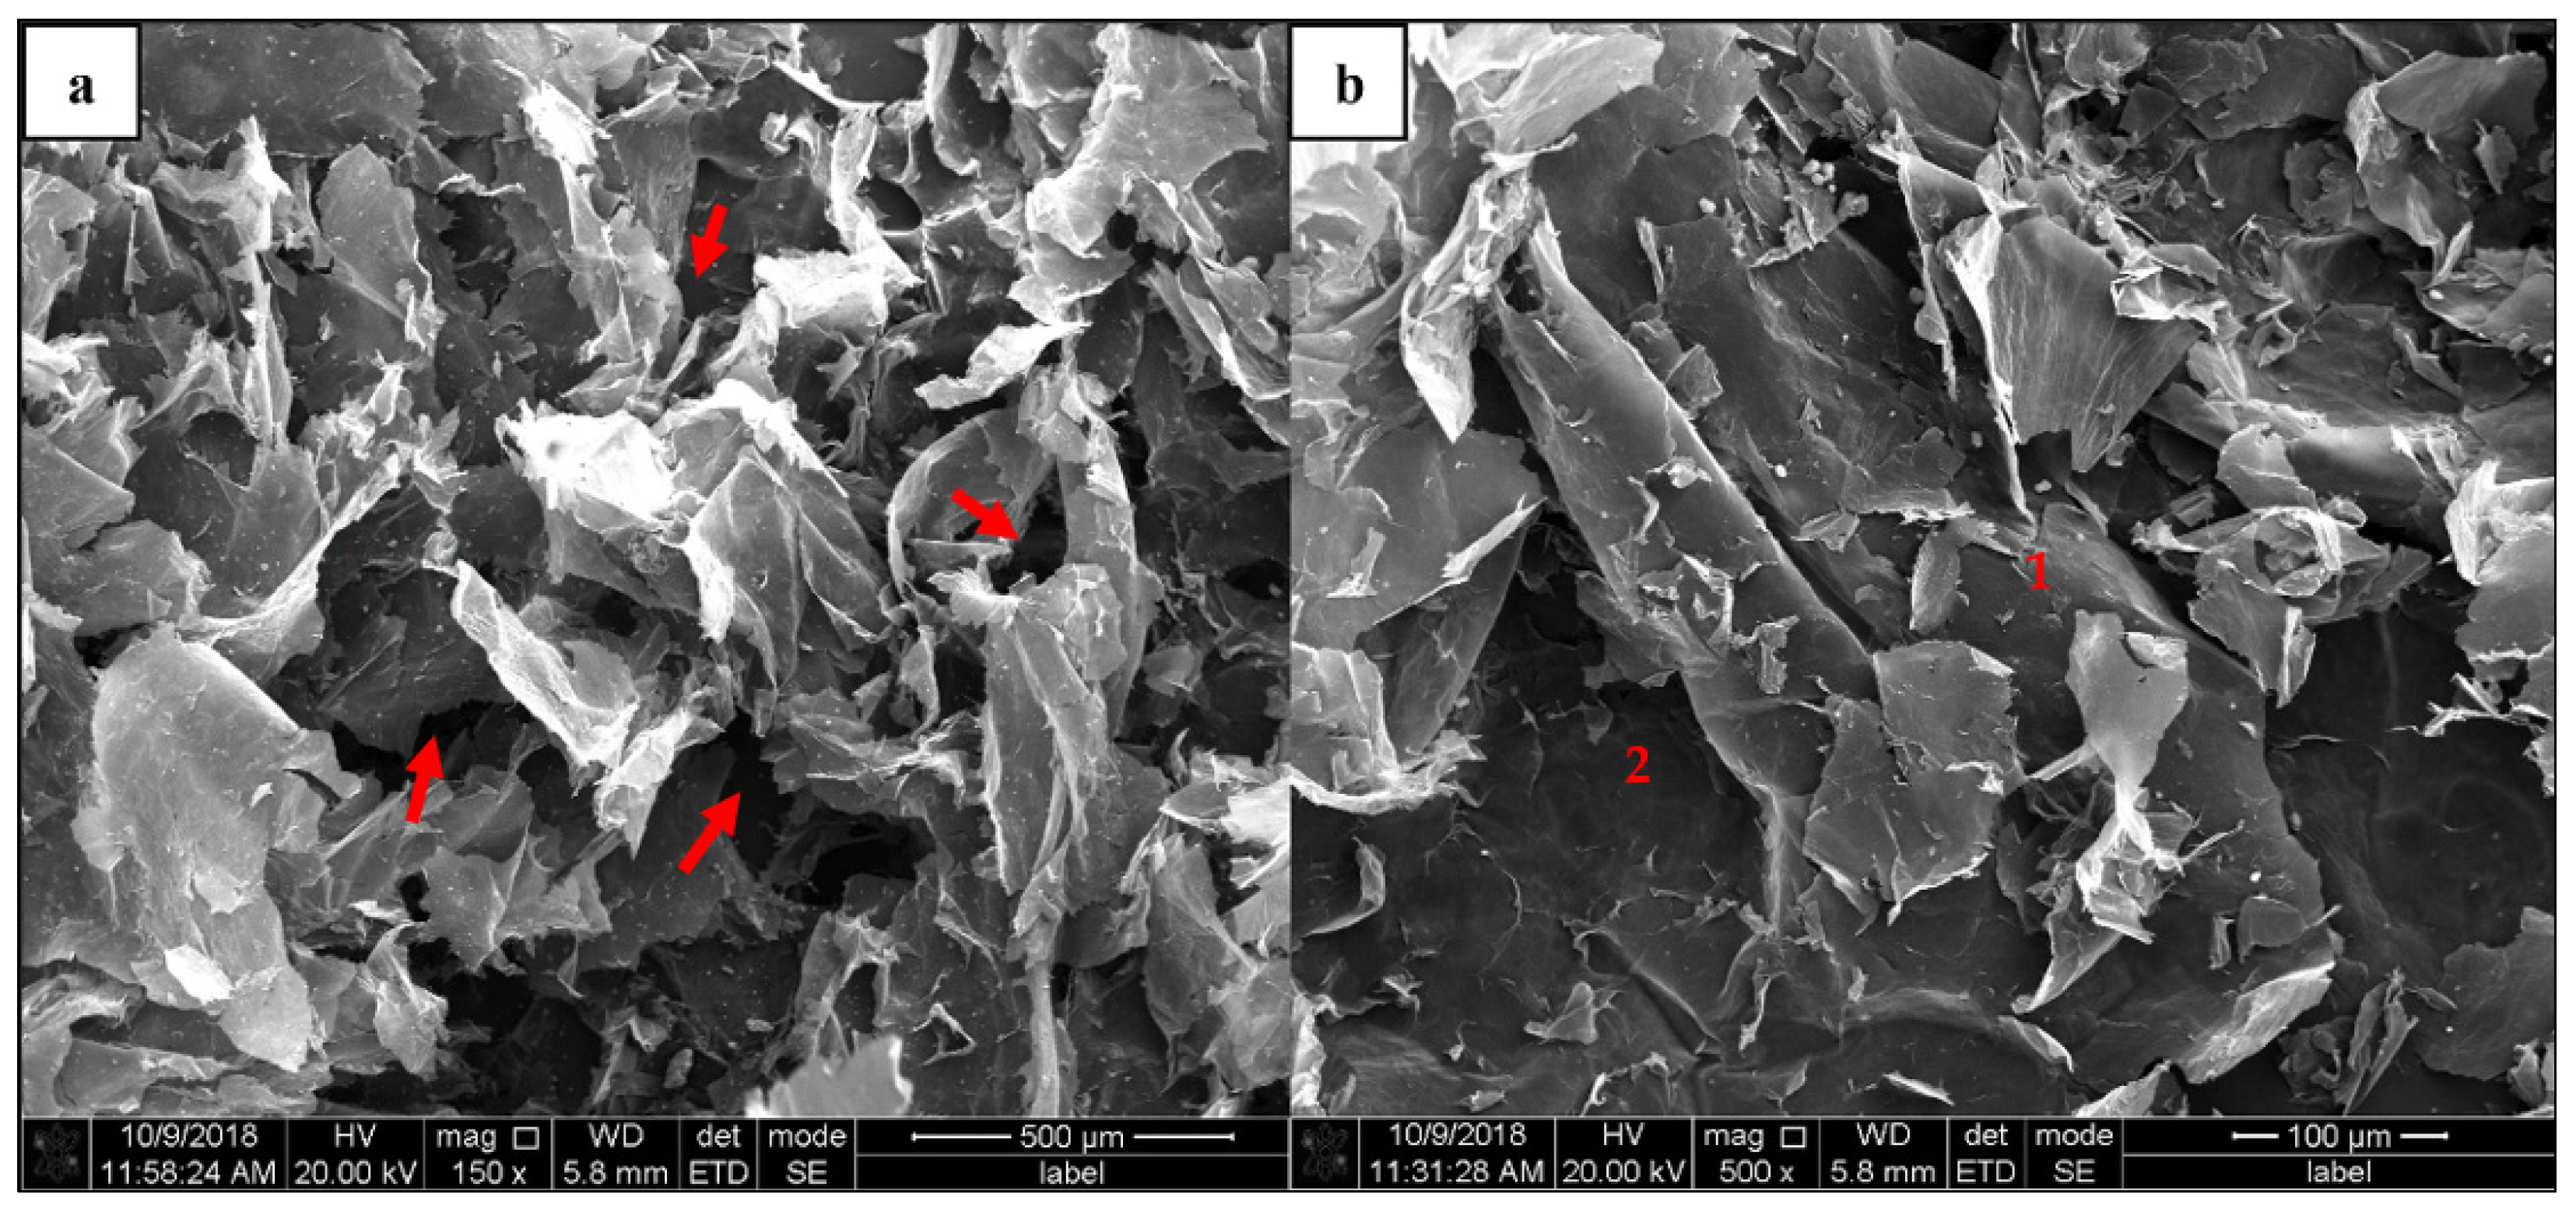
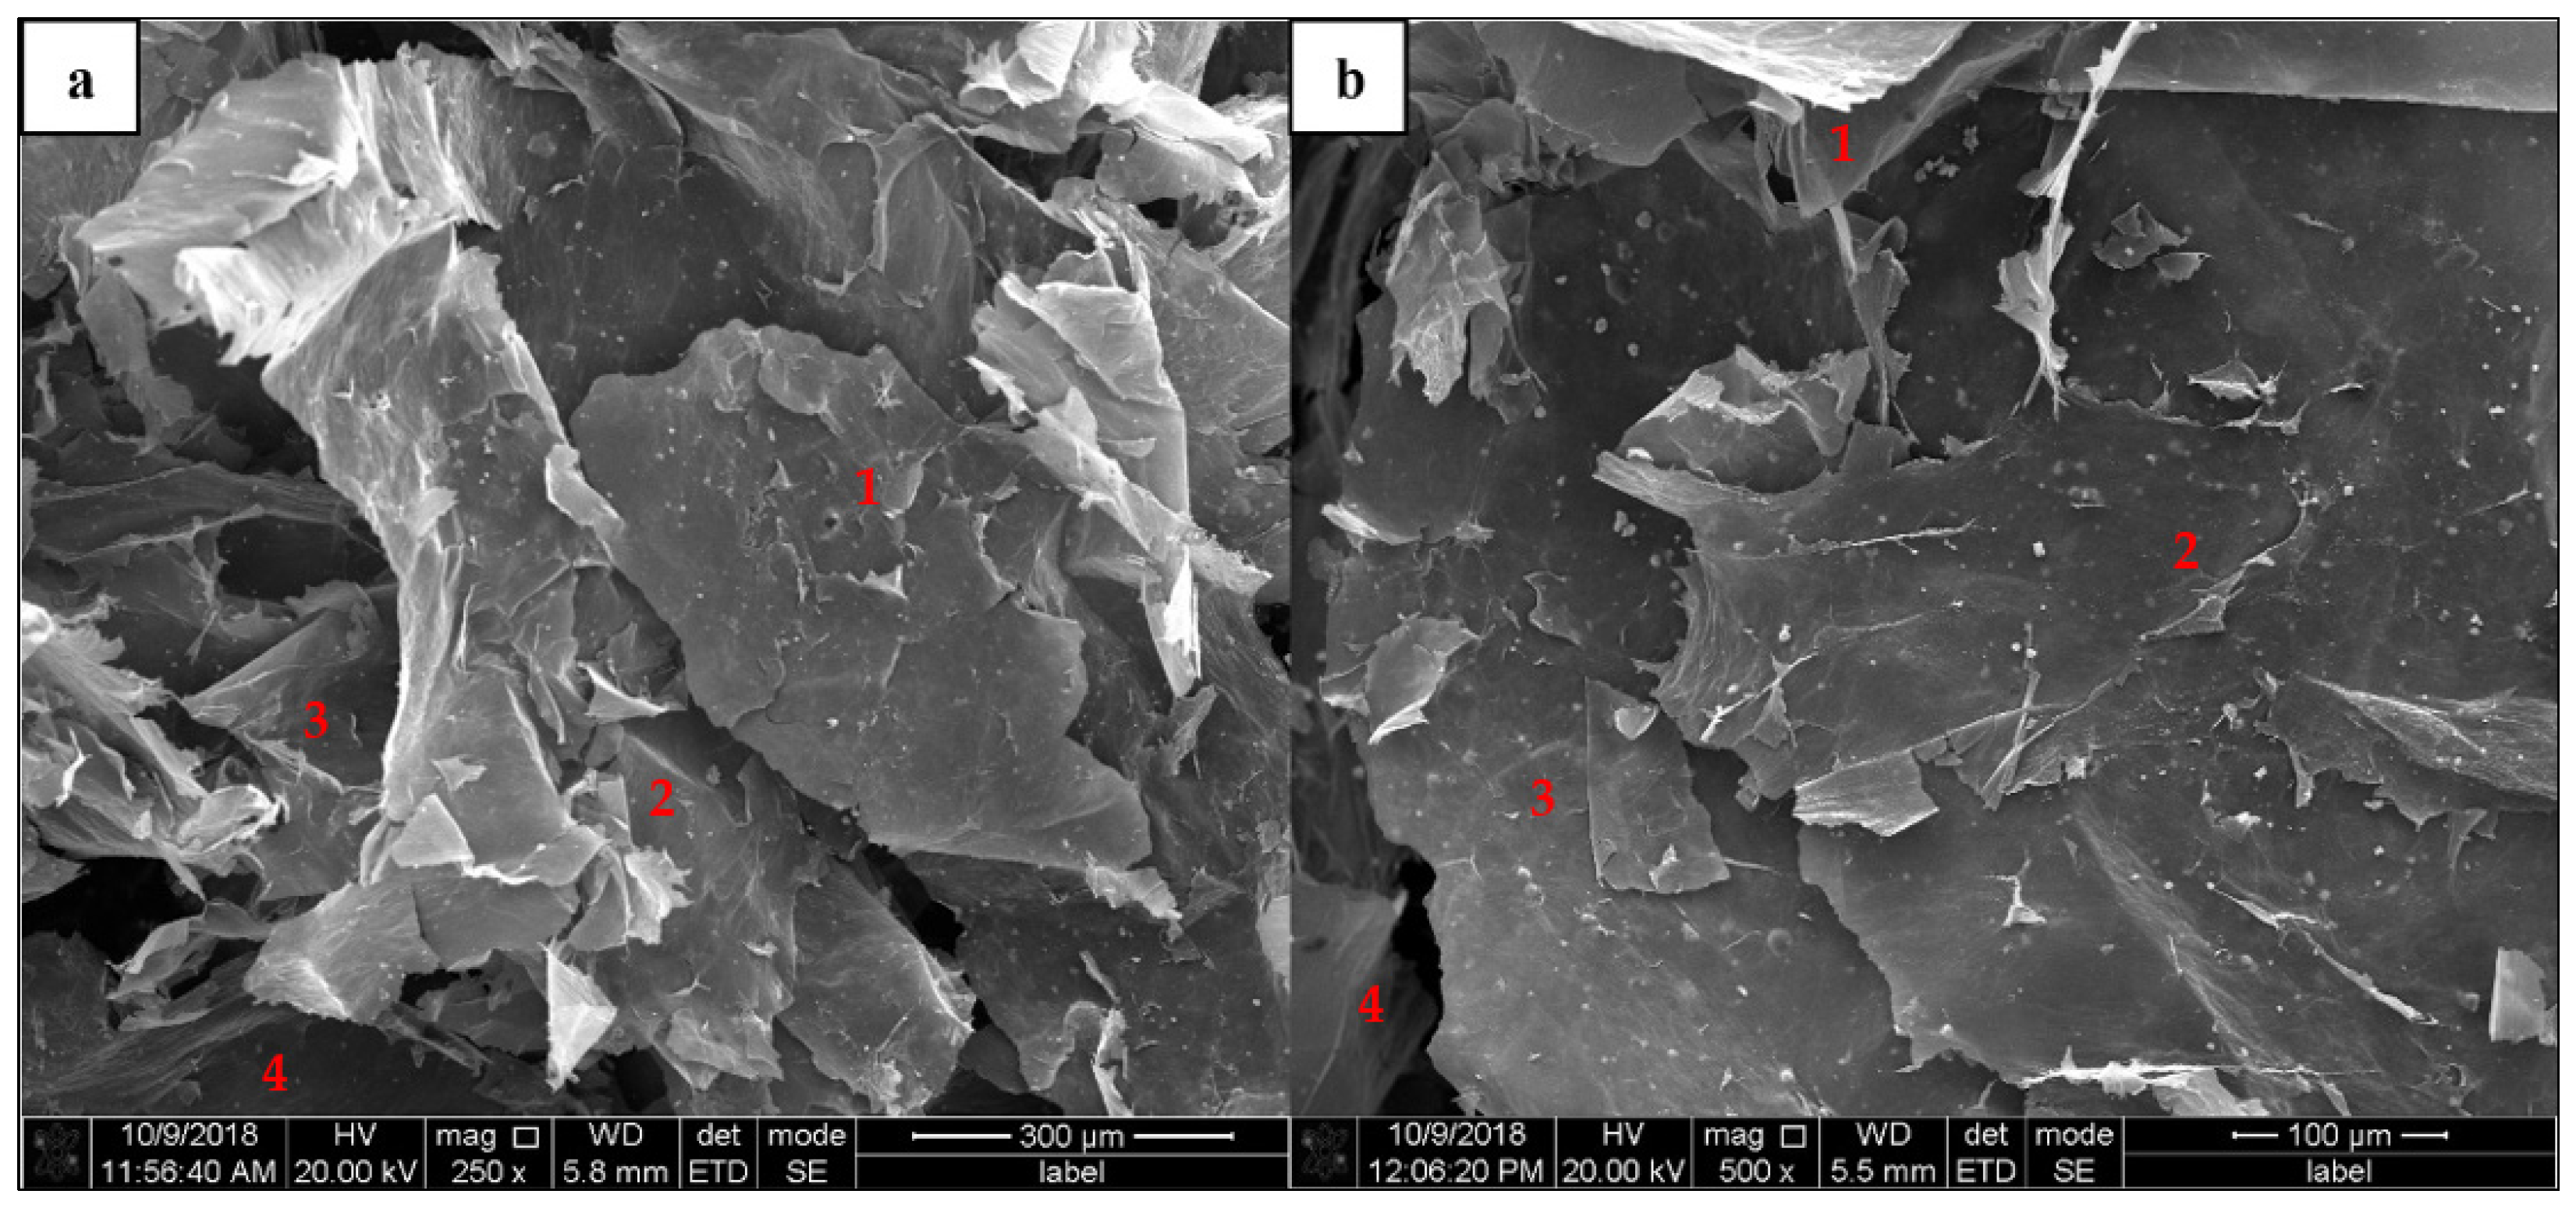
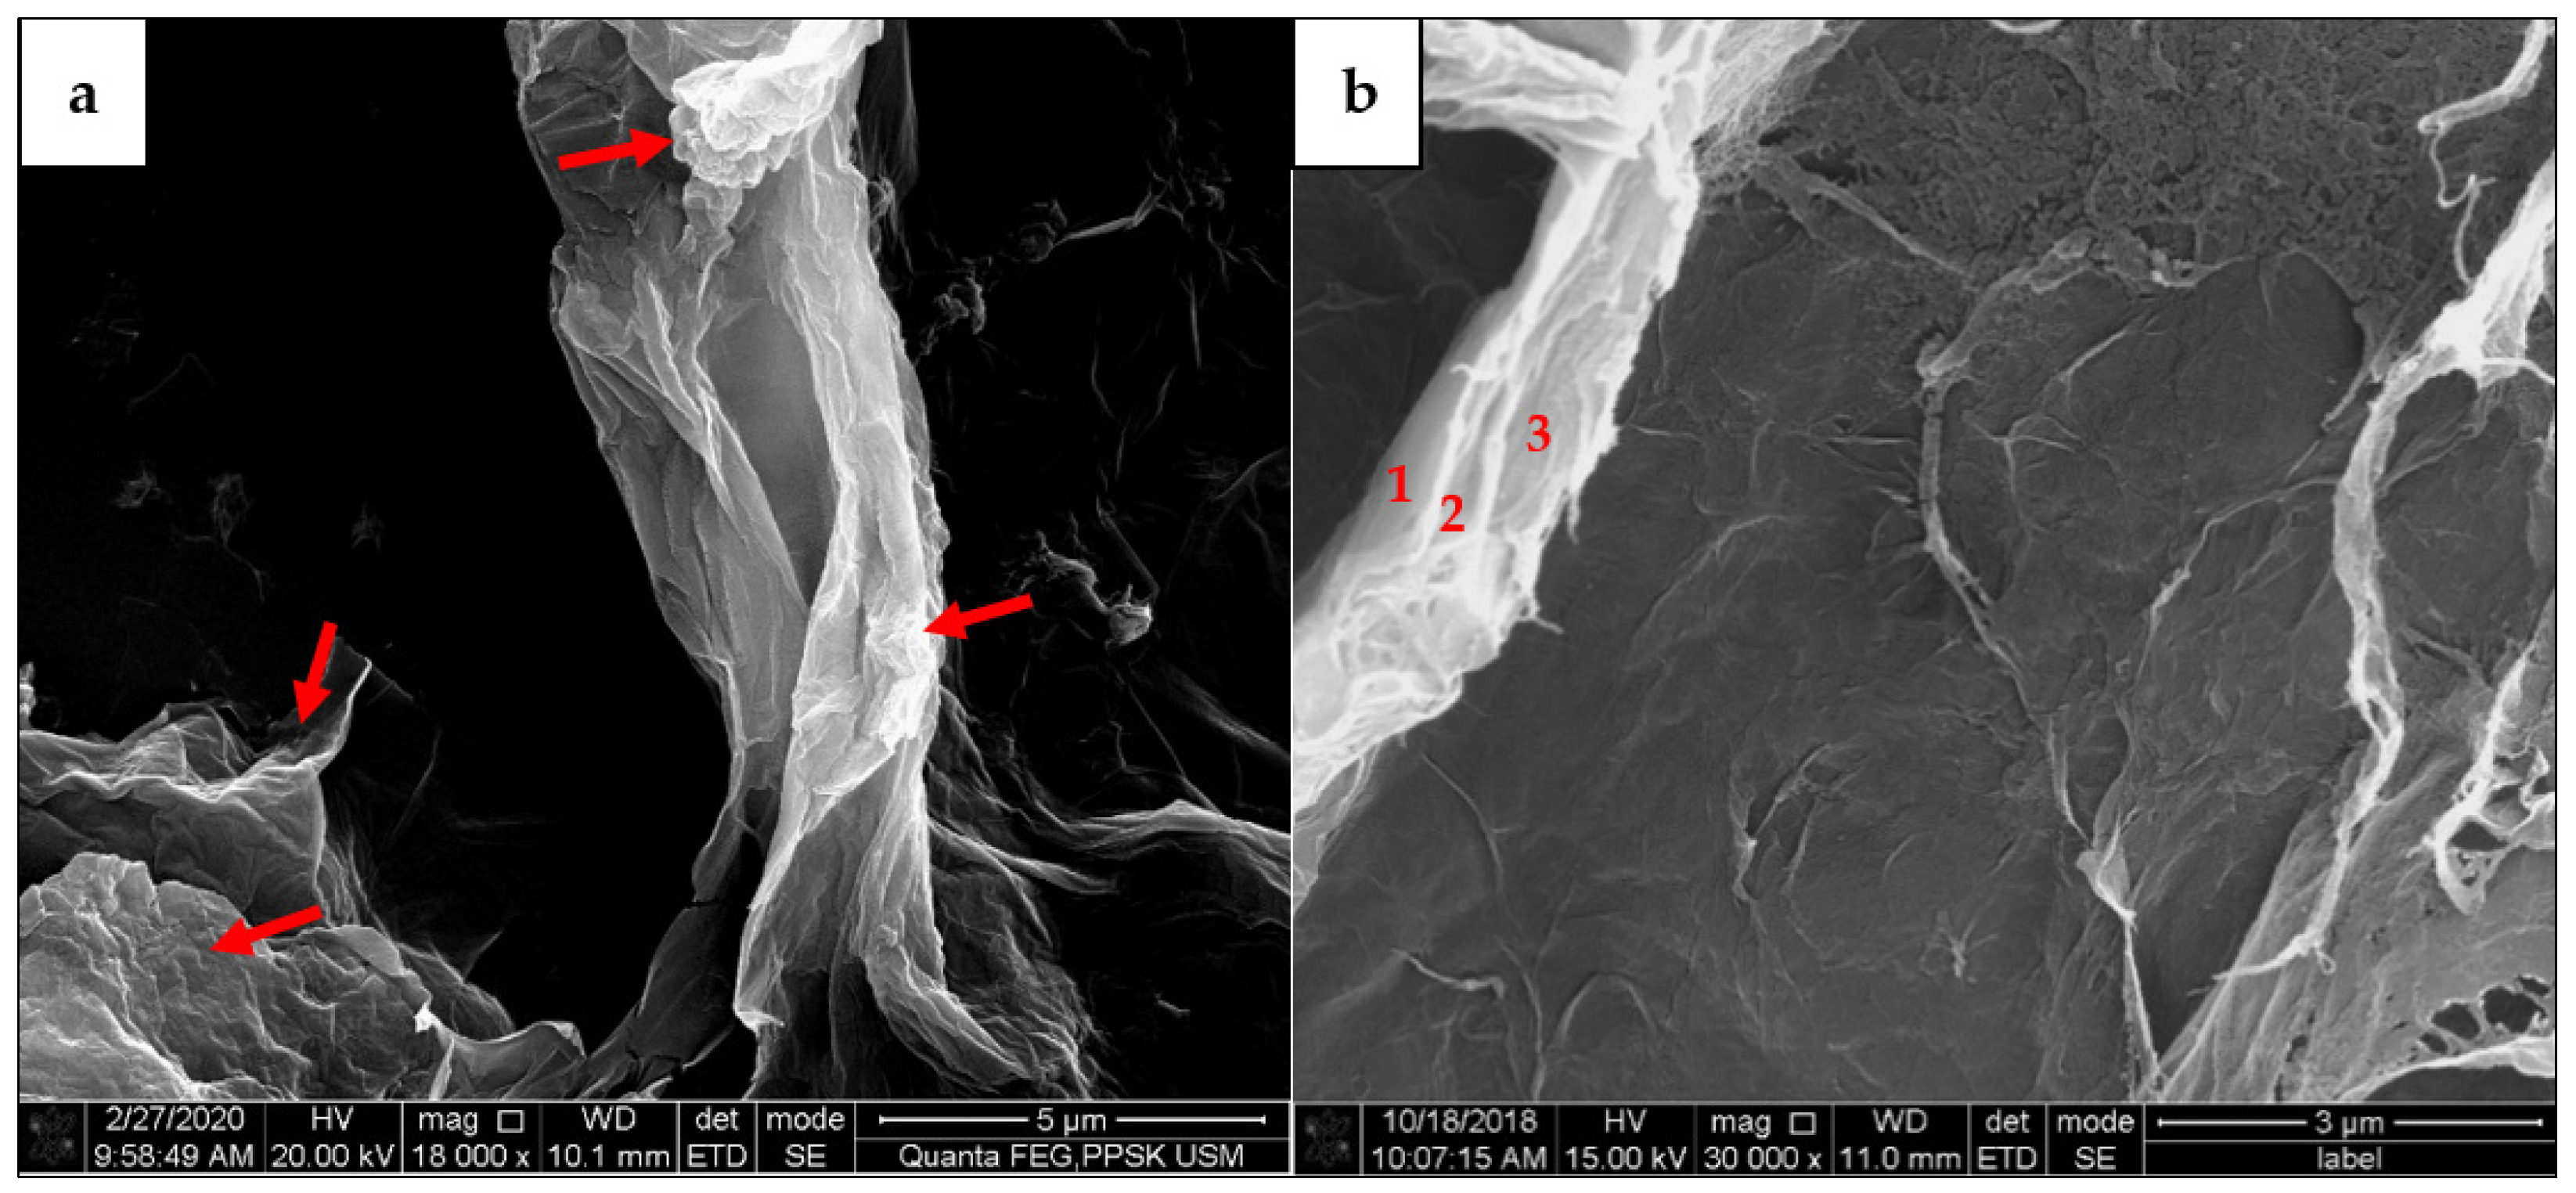
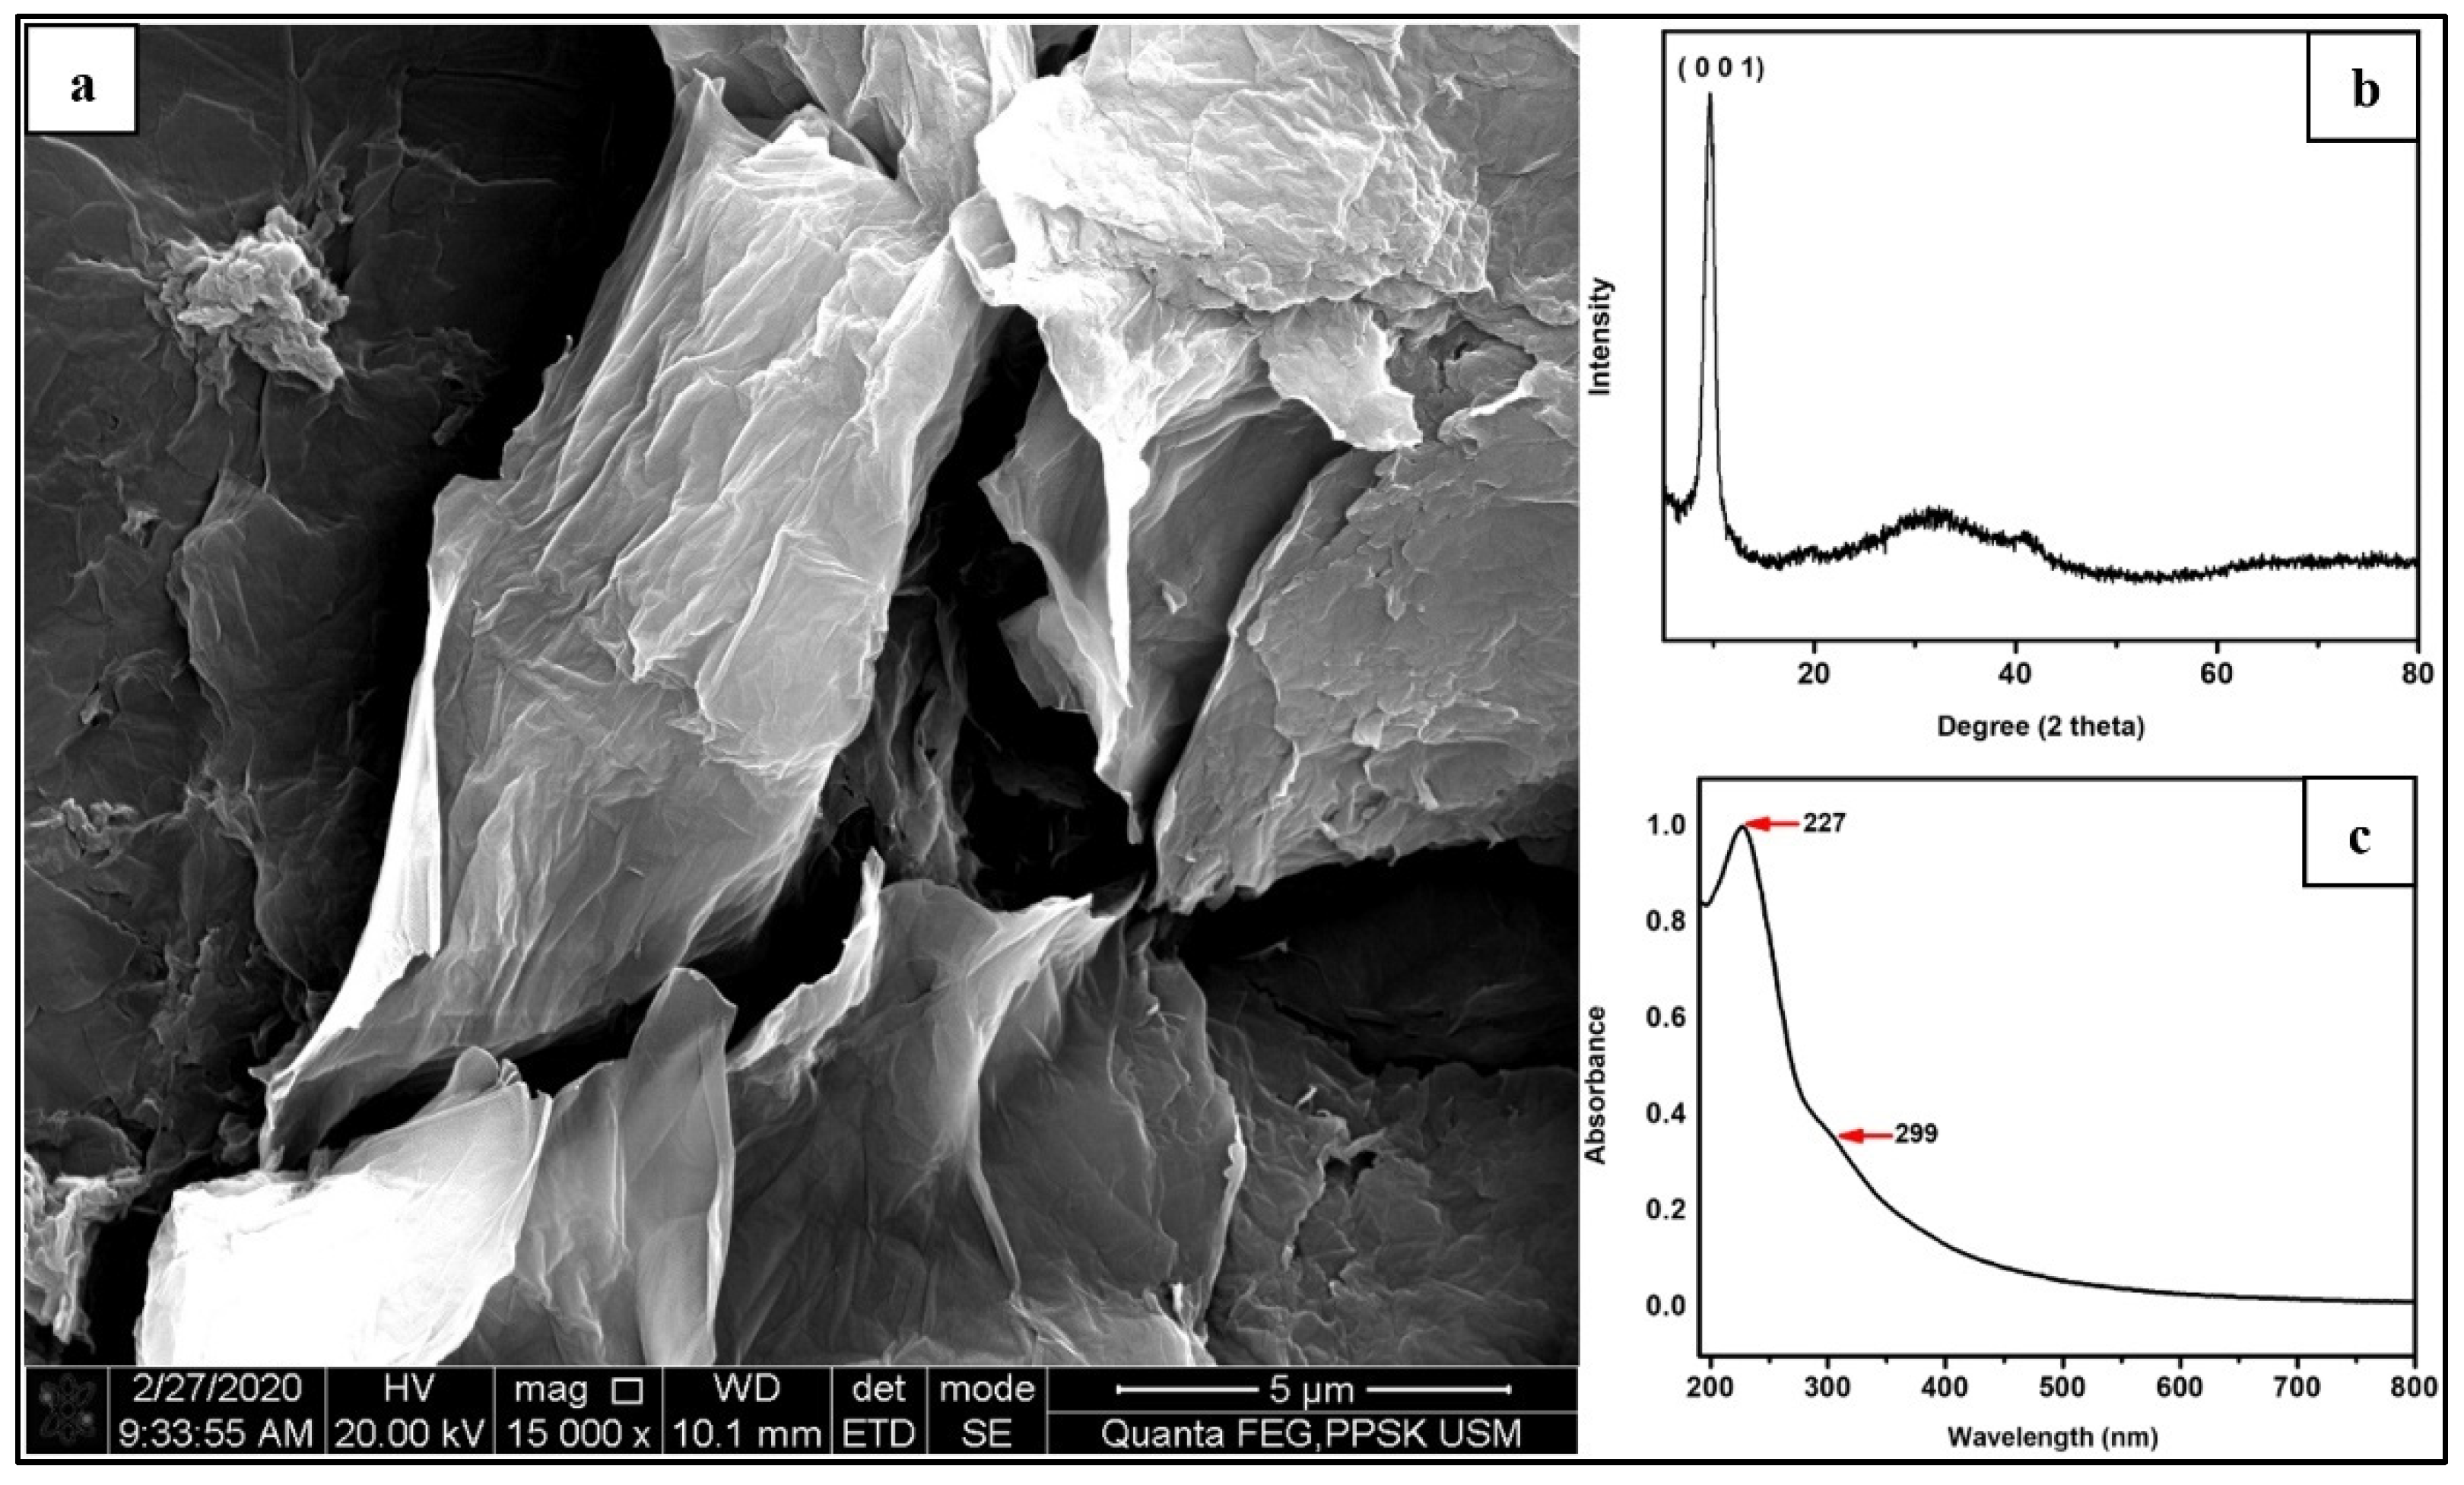
3.1. Characterisation of GO Nanolayers
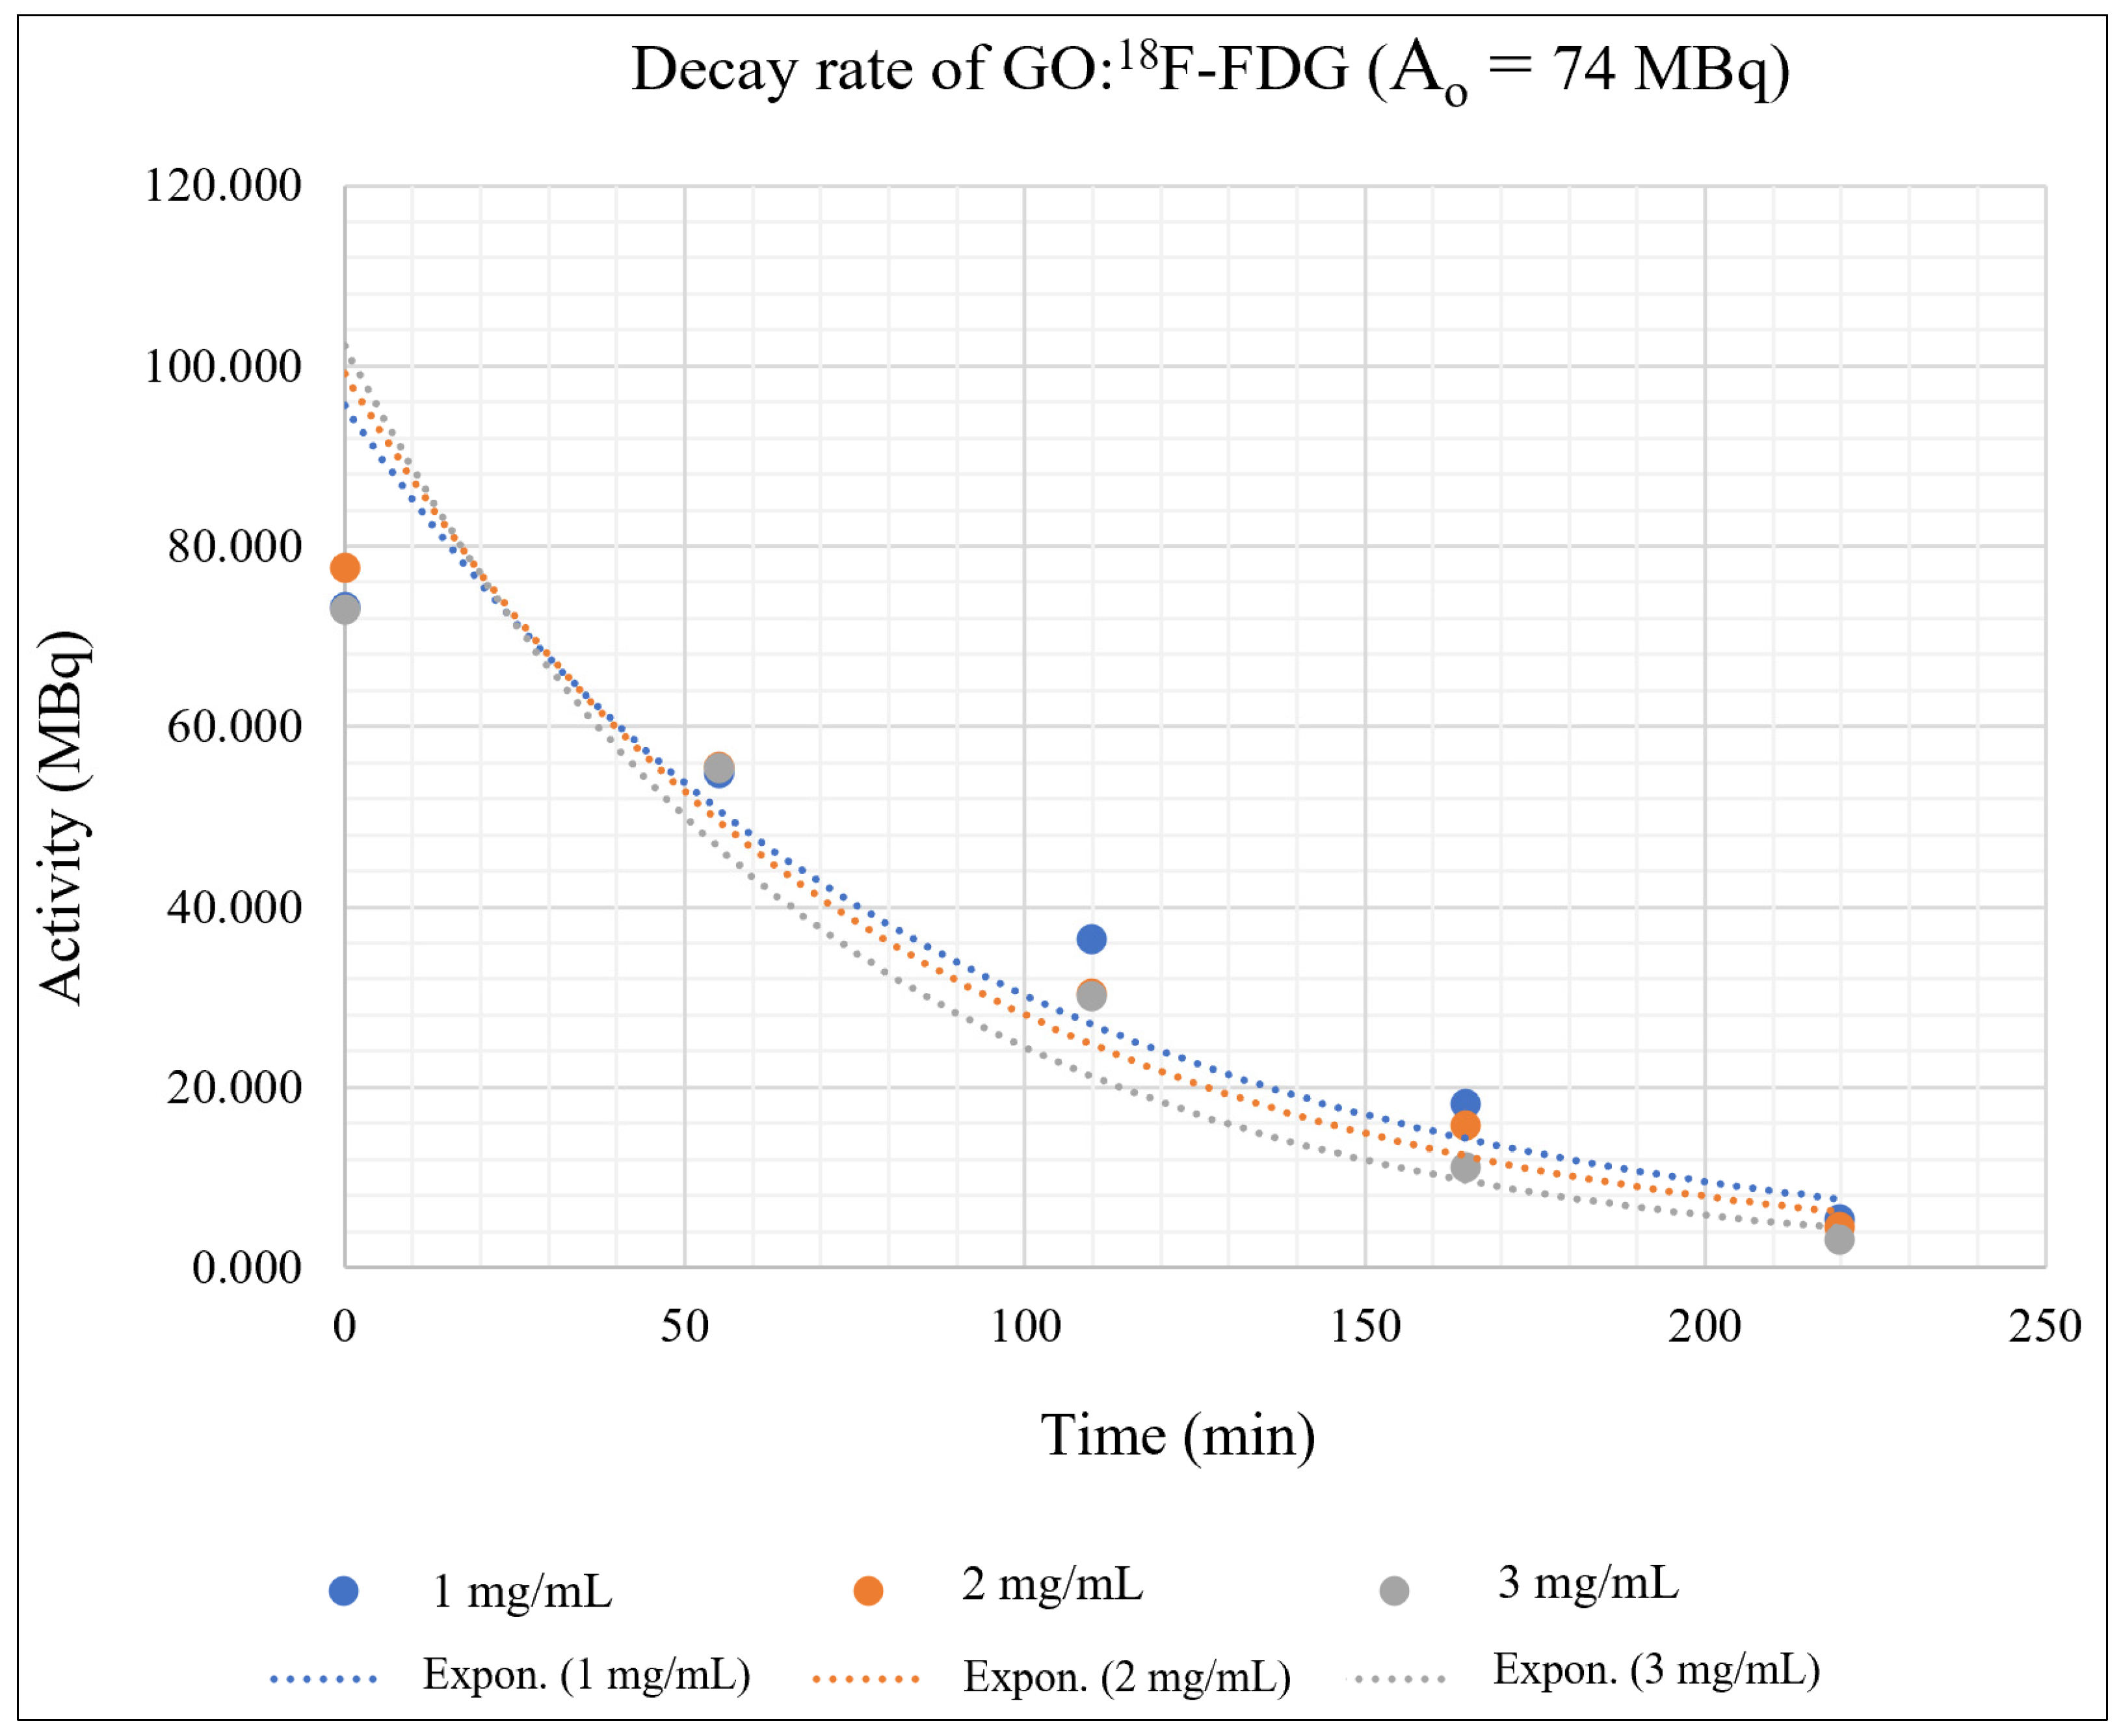
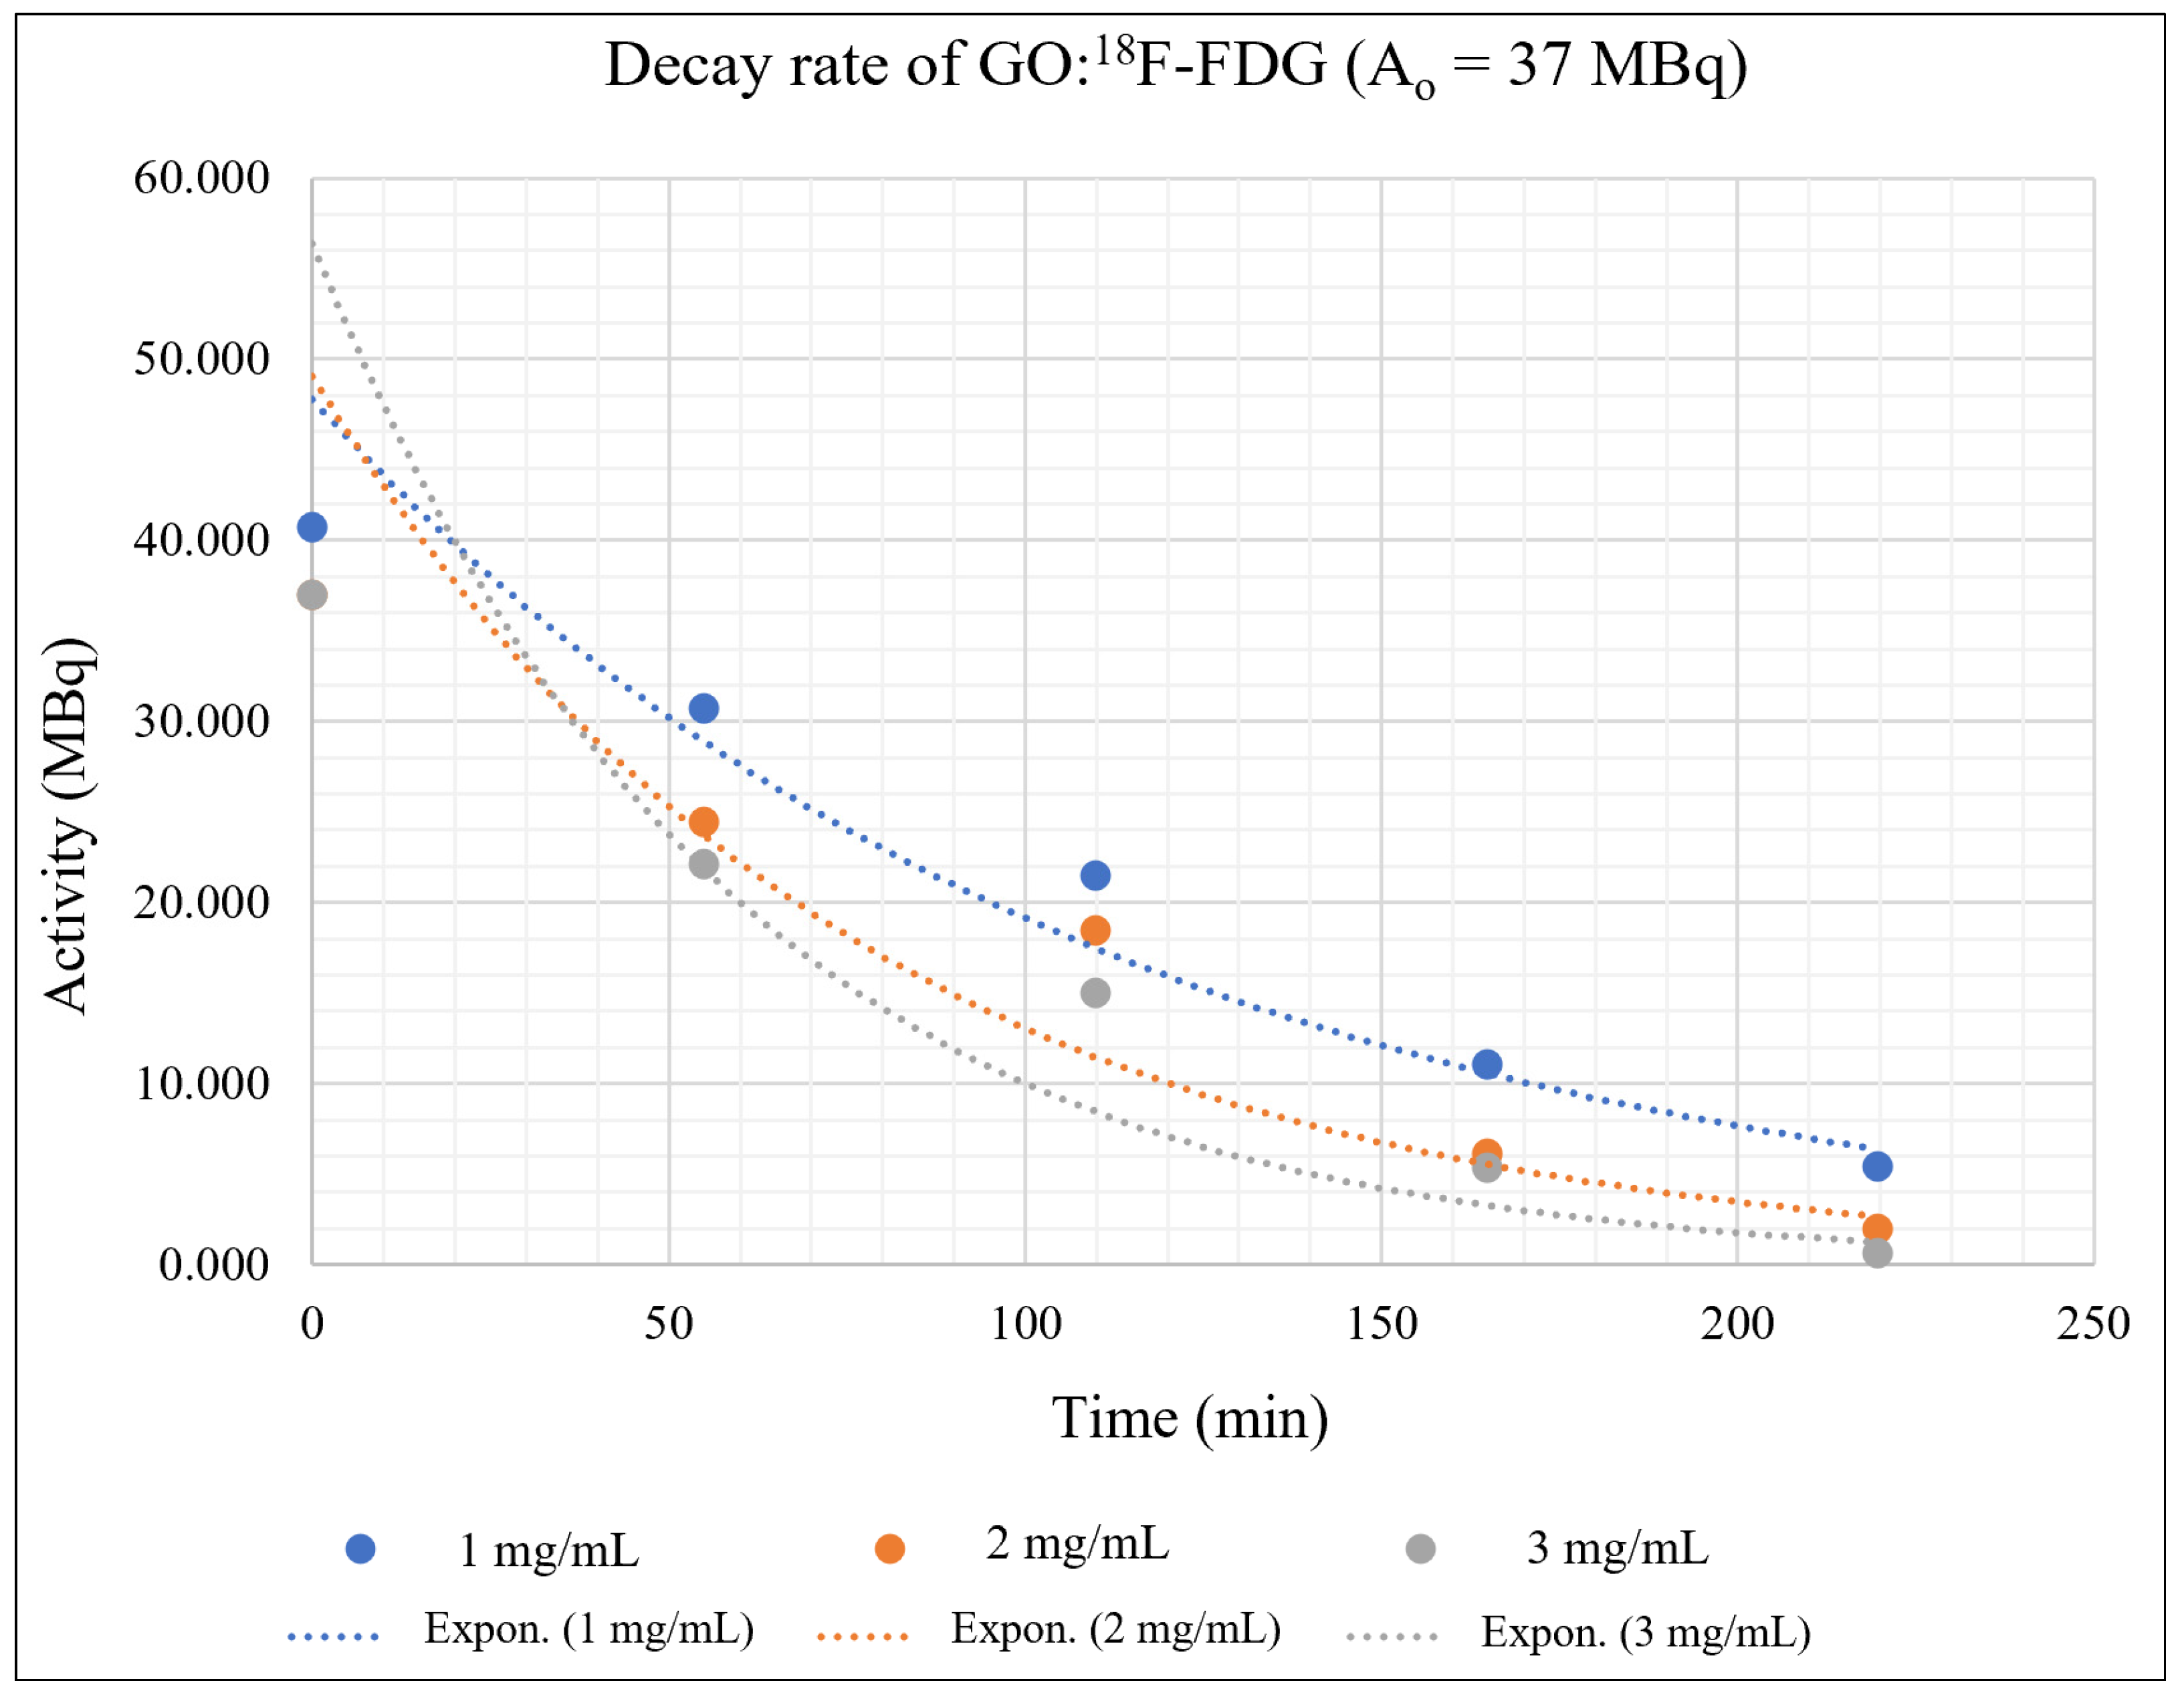
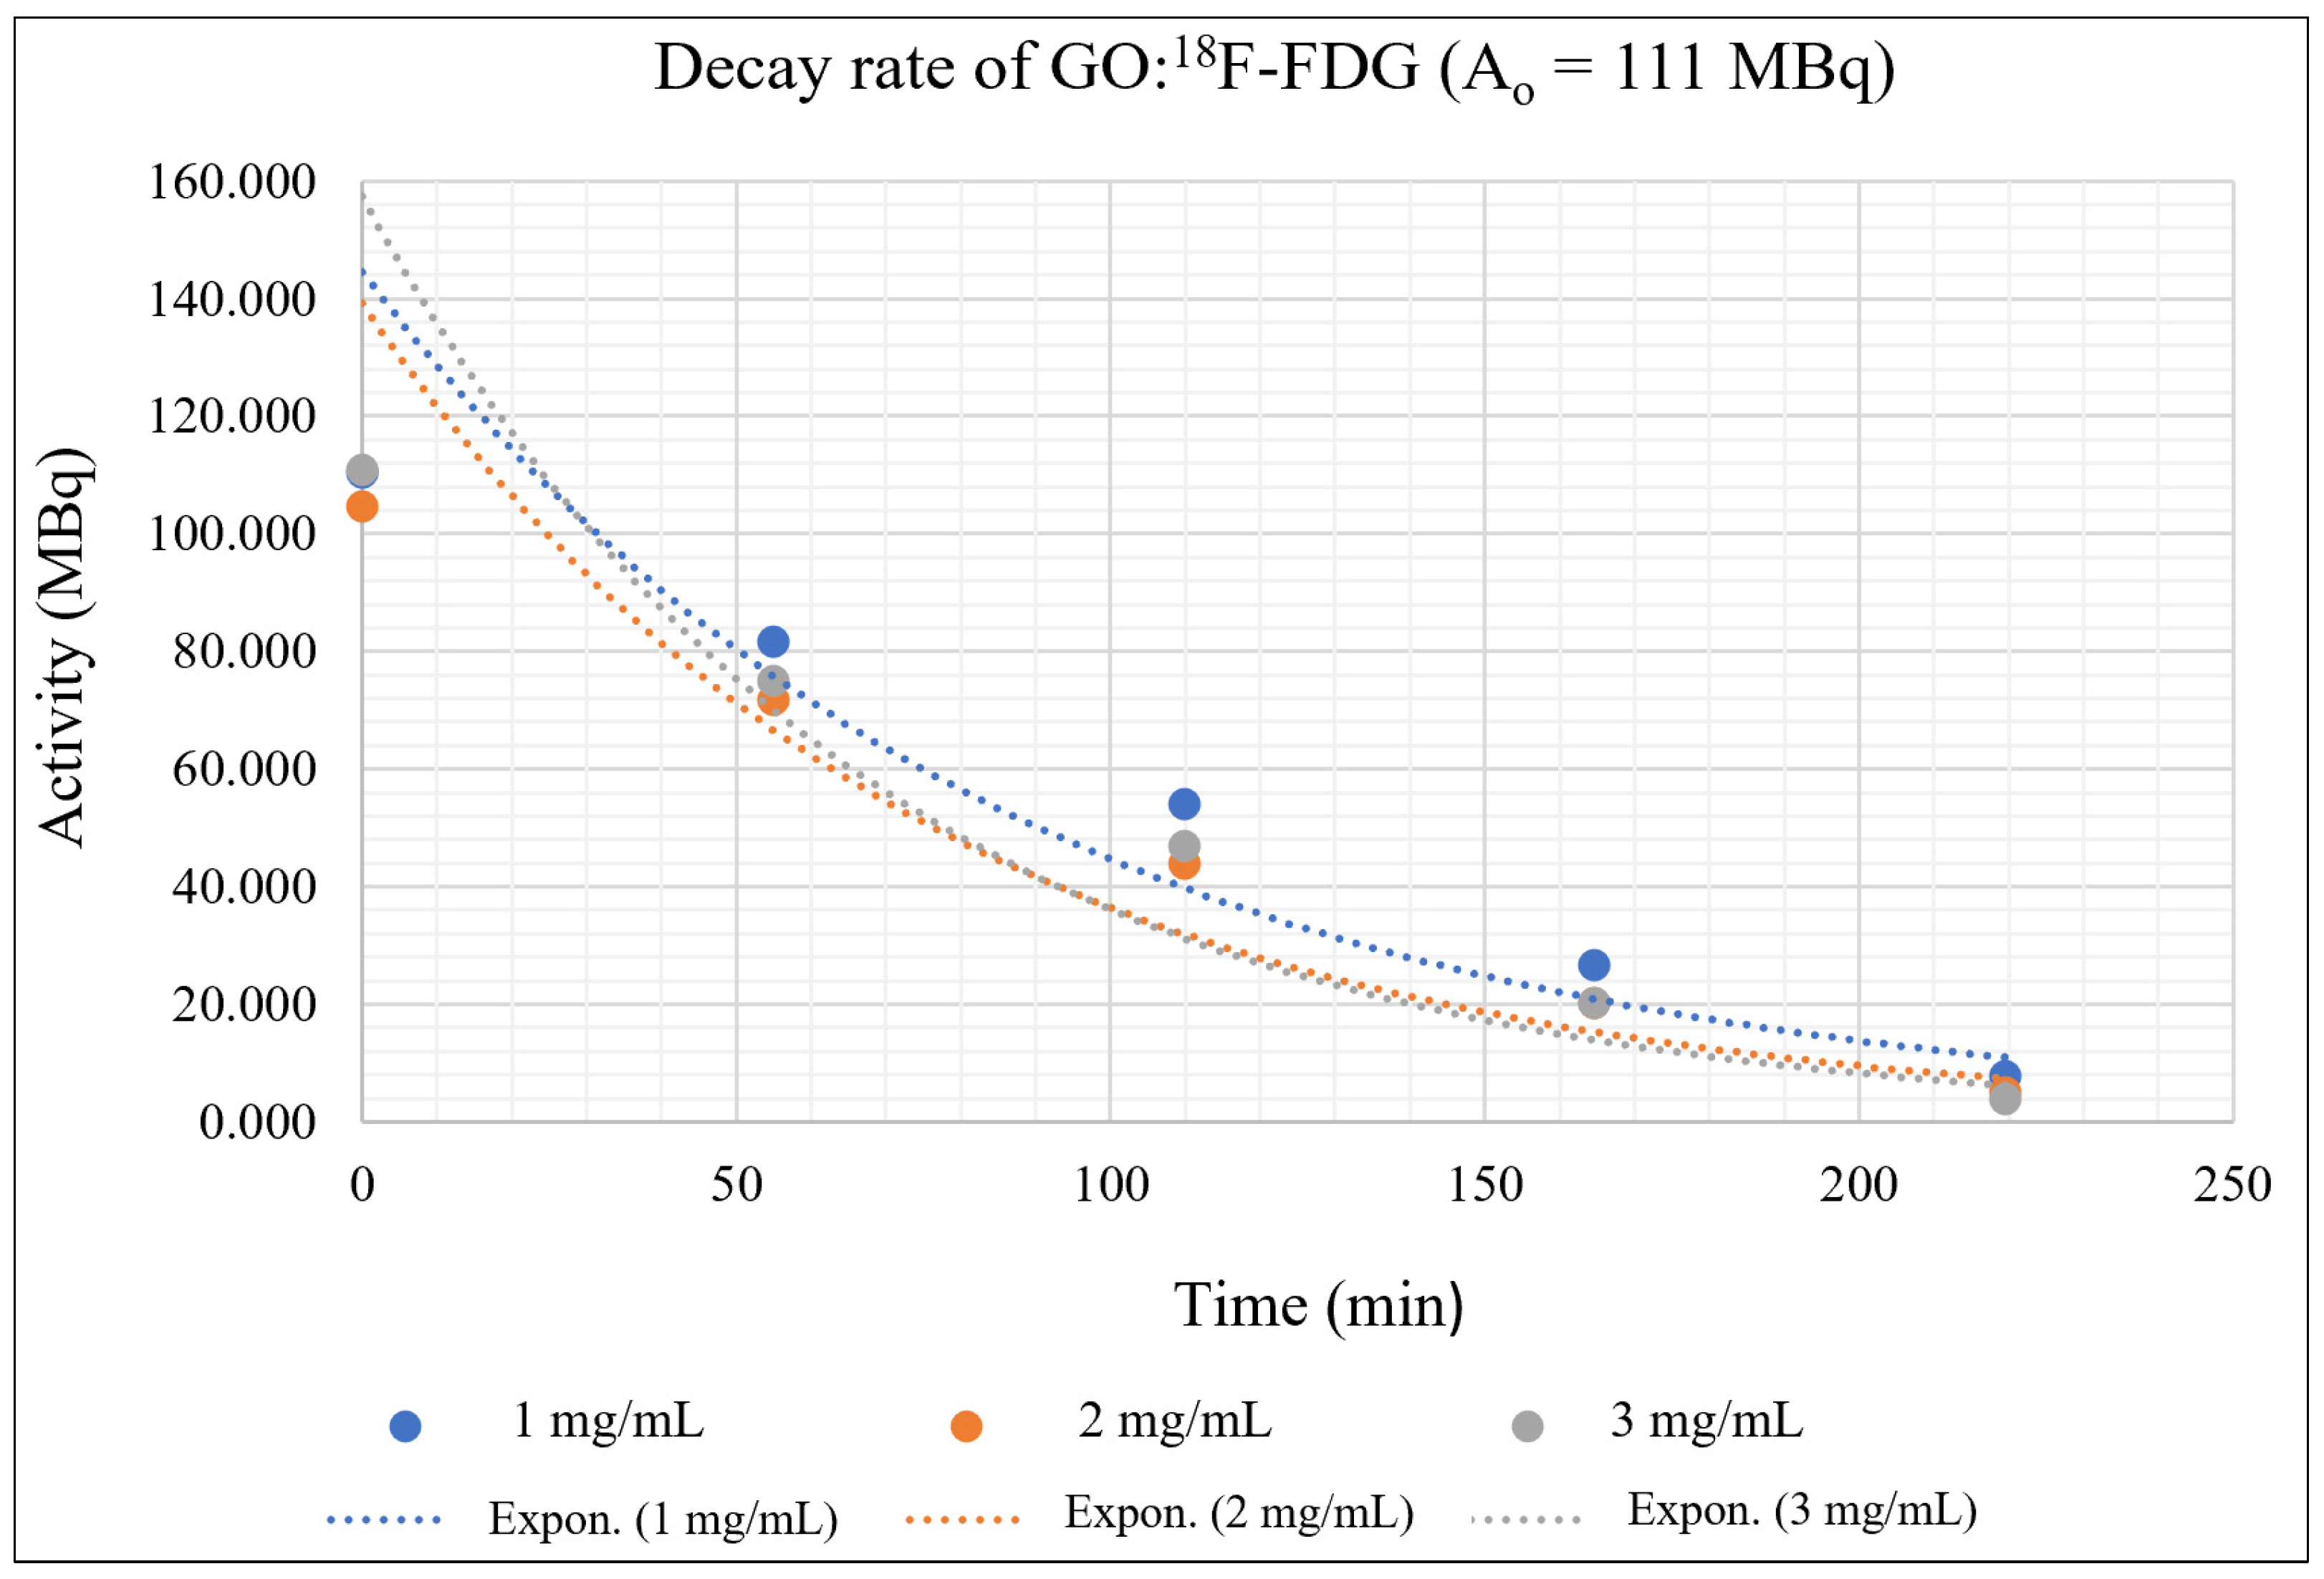
Graphene oxide (GO) images obtained from the FESEM were well defined and interlinked two-dimensional (2D) graphene sheets. Figure 2a,b show random sophisticated 2D structures with different magnifications. The surface appears as a wrinkly ‘wax tissue layer’ with hollow structures (red arrows in Figure 2a) and a continuous vast layer-by-layer surface area with random size of GO flakes (numbering layers in Figure 2b). This feature is advantageous to the GO in terms of ‘wrapping’ or entrapping other materials with various chemical bonds by the numerous carbon functional groups existing at the molecular structure level [32]. It also shows that the ‘wax tissue layer’ [33,34], which resembles the GO sheet, reflects that the deformation of the graphene layers was due to the oxidation process in the synthesised GO. Hence, the carbon lattice became distorted following the addition of oxygen lattice into the structures [35]. The generated hollow pores as shown in Figure 2a could be formed via the hydrothermal method by crumpling graphene sheets together, which results in the formation of voids between the sheets [32]. These features in the GO appear to be advantageous in terms of the hydrophilicity and dispersion into various media, including aqueous and organic solvents.
Stacked GO structures can be clearly seen in Figure 3a,b for 250×, and 500× magnification. The stacking structures enhance the continuous interaction probabilities with other compounds, where the large substrate surface area will participate in the molecular interactions [33]. The interactions probabilities are continuously increased with stacking layers by layers of GO and might be trapped within the compound with increasing depth via complex interactions.
Meanwhile, a single substrate of GO nanolayers can be seen in a close-up micrograph in Figure 4a,b. The micrograph enhances the size of the nano substrate surface for molecular interactions to trap the 18F-FDG and other compounds. Some contaminants on the GO surface can be seen in Figure 4a, which might be due to the incomplete washing of some foreign particles (red arrows). However, Figure 4b shows a significant structure of single wax tissue layers of GO with wrinkles and exfoliated networking lines on the surface (arrows), ready for the adsorption process via the molecular interaction of many available functional groups.
In additions, the complex structures of GO nanolayers have been focused within smaller scales as those shown in Figure 5a,b. The agglomerated ‘wax tissue’ nanolayers with non-uniform structures are shown in Figure 5a. The complex wrinkles and exfoliated structures can be seen via the red arrows, whereas the agglomerated long strand ‘wax-tissue’ nanolayers can be seen on another site. On the other hand, Figure 5b shows the multiple stacking layers that can still be identified from the agglomerated wax tissue layers. These structures demonstrate that the continuous multiplex nanolayers randomly existed for fine focused micrograph and widely spread on the GO substrates.
Moreover, agglomerated wrinkle and exfoliated structures have been further characterized with smaller scales to show a close up image of the 2D single nanolayers of the ‘wax-tissue’ GO structures as shown in Figure 6a,b. It can be seen that the small spherical agglomerated GO nanostructures are randomly attached on the upper site as shown in Figure 6a and the lower site as shown in Figure 6b of the single nanolayers. This phenomenon proves the complex random structures of agglomerated GO nanolayers existed along the stacking surfaces and promote high interactions with any materials via molecular interactions [36]. However, agglomerated unattached spherical nano structures are also randomly seen in Figure 6a, which leads to random complex interactions efficiency during the adsorption process [37].
In Figure 7a, a stacking wrinkles and exfoliated GO nanolayers has been selected for characterization by using X-ray diffraction technique (XRD) (Bruker D2, Bruker Corporation, Billerica, MA, USA) and UV–vis spectrometer. XRD spectrum of the GO is similar to the GO reported in other previous published works. It can be seen in Figure 7b that the characteristic peak of GO centred at 10.0°, which was assigned to the (0,0,1) reflection of GO. The UV–visible adsorption spectra of GO are shown in the Figure 7c. As revealed by the spectrum, two characteristic peaks of GO were observed at 227 and 229 nm, which were π → π* transition of aromatic C-C bond and the n → π* of C = O group, respectively. This is in agreement with the results published elsewhere [38].

3.2. Kinetic Study

The kinetic study of the isolation of GO:18F-FDG mixtures for different concentrations of GO concentrations and RPC activities was extrapolated using the radioactive decay equation as shown in Equation (2), where A is the radionuclide activity, Ao is the initial radionuclide activity, λ is the decay constant, and t is the decay time. Each of the activities (37 MBq, 74 MBq and 111 MBq) that were mixed with different GO concentrations (1, 2, 3 mg/mL) and trapped by using a filter paper were measured using a dose calibrator within specific periods (54.9 min, 109.8 min, 164.7 min, and 219.6 min). The activities were differentiated in order to investigate the influence of the positrons and gamma-ray photons’ production rate on the molecular adsorption process. Three graphs to study the kinetics of the 18F-FDG isolated by GO based on activity over time were plotted for different values of A0 as shown in Figure 8, Figure 9 and Figure 10.
ln (A/Ao) = −λt
Figure 8, Figure 9 and Figure 10 depict the exponentially plotted graph of GO:18F-FDG activities versus time for three different concentrations (1, 2, and 3 mg/ mL). From these graphs, the activity of GO:18F-FDG was exponentially decreased to half from their approximate initial activities within 109.8 min, which is the natural half-life of 18F [39]. From the graph, the first term half-life for three different activities (37 MBq, 74 MBq and 111 MBq) are sharply reduced due to their active decay processes with respect to its initial activities (high activity), becoming stagnant for the second term of its half-life and approximately close to zero for total decay (219.6 min). The decay process depends on the activities of the radionuclide, where higher activities promote active interactions with random decay processes in the nucleus. In this study, the existence of different concentrations of GO with RPC influenced the nuclear decay process within the unstable 18F nucleus, where there are different activities has been measured for different concentrations in a specific natural half-life. This phenomenon might be due to the adsorption of GO at the molecular level which is mostly via van der walls and ionic interactions [40], causing some inter-molecular changes of weak nuclear and electromagnetic forces in 18F during its decay process. Influence of the weak nuclear forces that control the nuclear activities for any radioisotope decay [41], might cause some changes in the decay rate of the materials during complex molecular interactions.
Generally, 1 mg/mL concentration of GO can trap the 18F-FDG effectively, where the activity is always higher in each measured time as shown in Figure 8, Figure 9 and Figure 10. This might be due to random nuclear interaction activities in the 18F nucleus, where vast numbers of electrons for higher concentrations might fluctuate or slow the molecular interactions. Fluctuation at the initial activity due to a high decay rate may be attributed to the reactivity of the orbital electrons of fluorine, which actively tend to be stabilised via complex interaction [42].
The adsorption interactions might also be influenced by the physical volume of the RPC that coagulate with certain GO concentrations, where the insoluble process might occur due to saturated solutions. It also shows that a higher concentration of GO could reduce the activity of 18F-FDG due to the interactions occurring at molecular levels. High activities of 18F-FDG (111 MBq and 74 Mbq) actively produce positron, which originates from the nucleus and leads to an annihilation process rather than adsorption interaction with the GO. Figure 9 and Figure 10 show the undifferentiation for low and high concentrations of GO and their influence on the activity decay of 18F-FDG, where the line is almost redundant with each other. However, the slower decay process provides a likelihood for adsorption interactions, where the line is seen to be identical at 50 min onwards in Figure 6, as well as the whole measurable activity in Figure 8. This might be due to the availability of free electron clouds in 18F-FDG, which have more chance to be interacted with and form functional groups in the GO chemical structures at low activity.

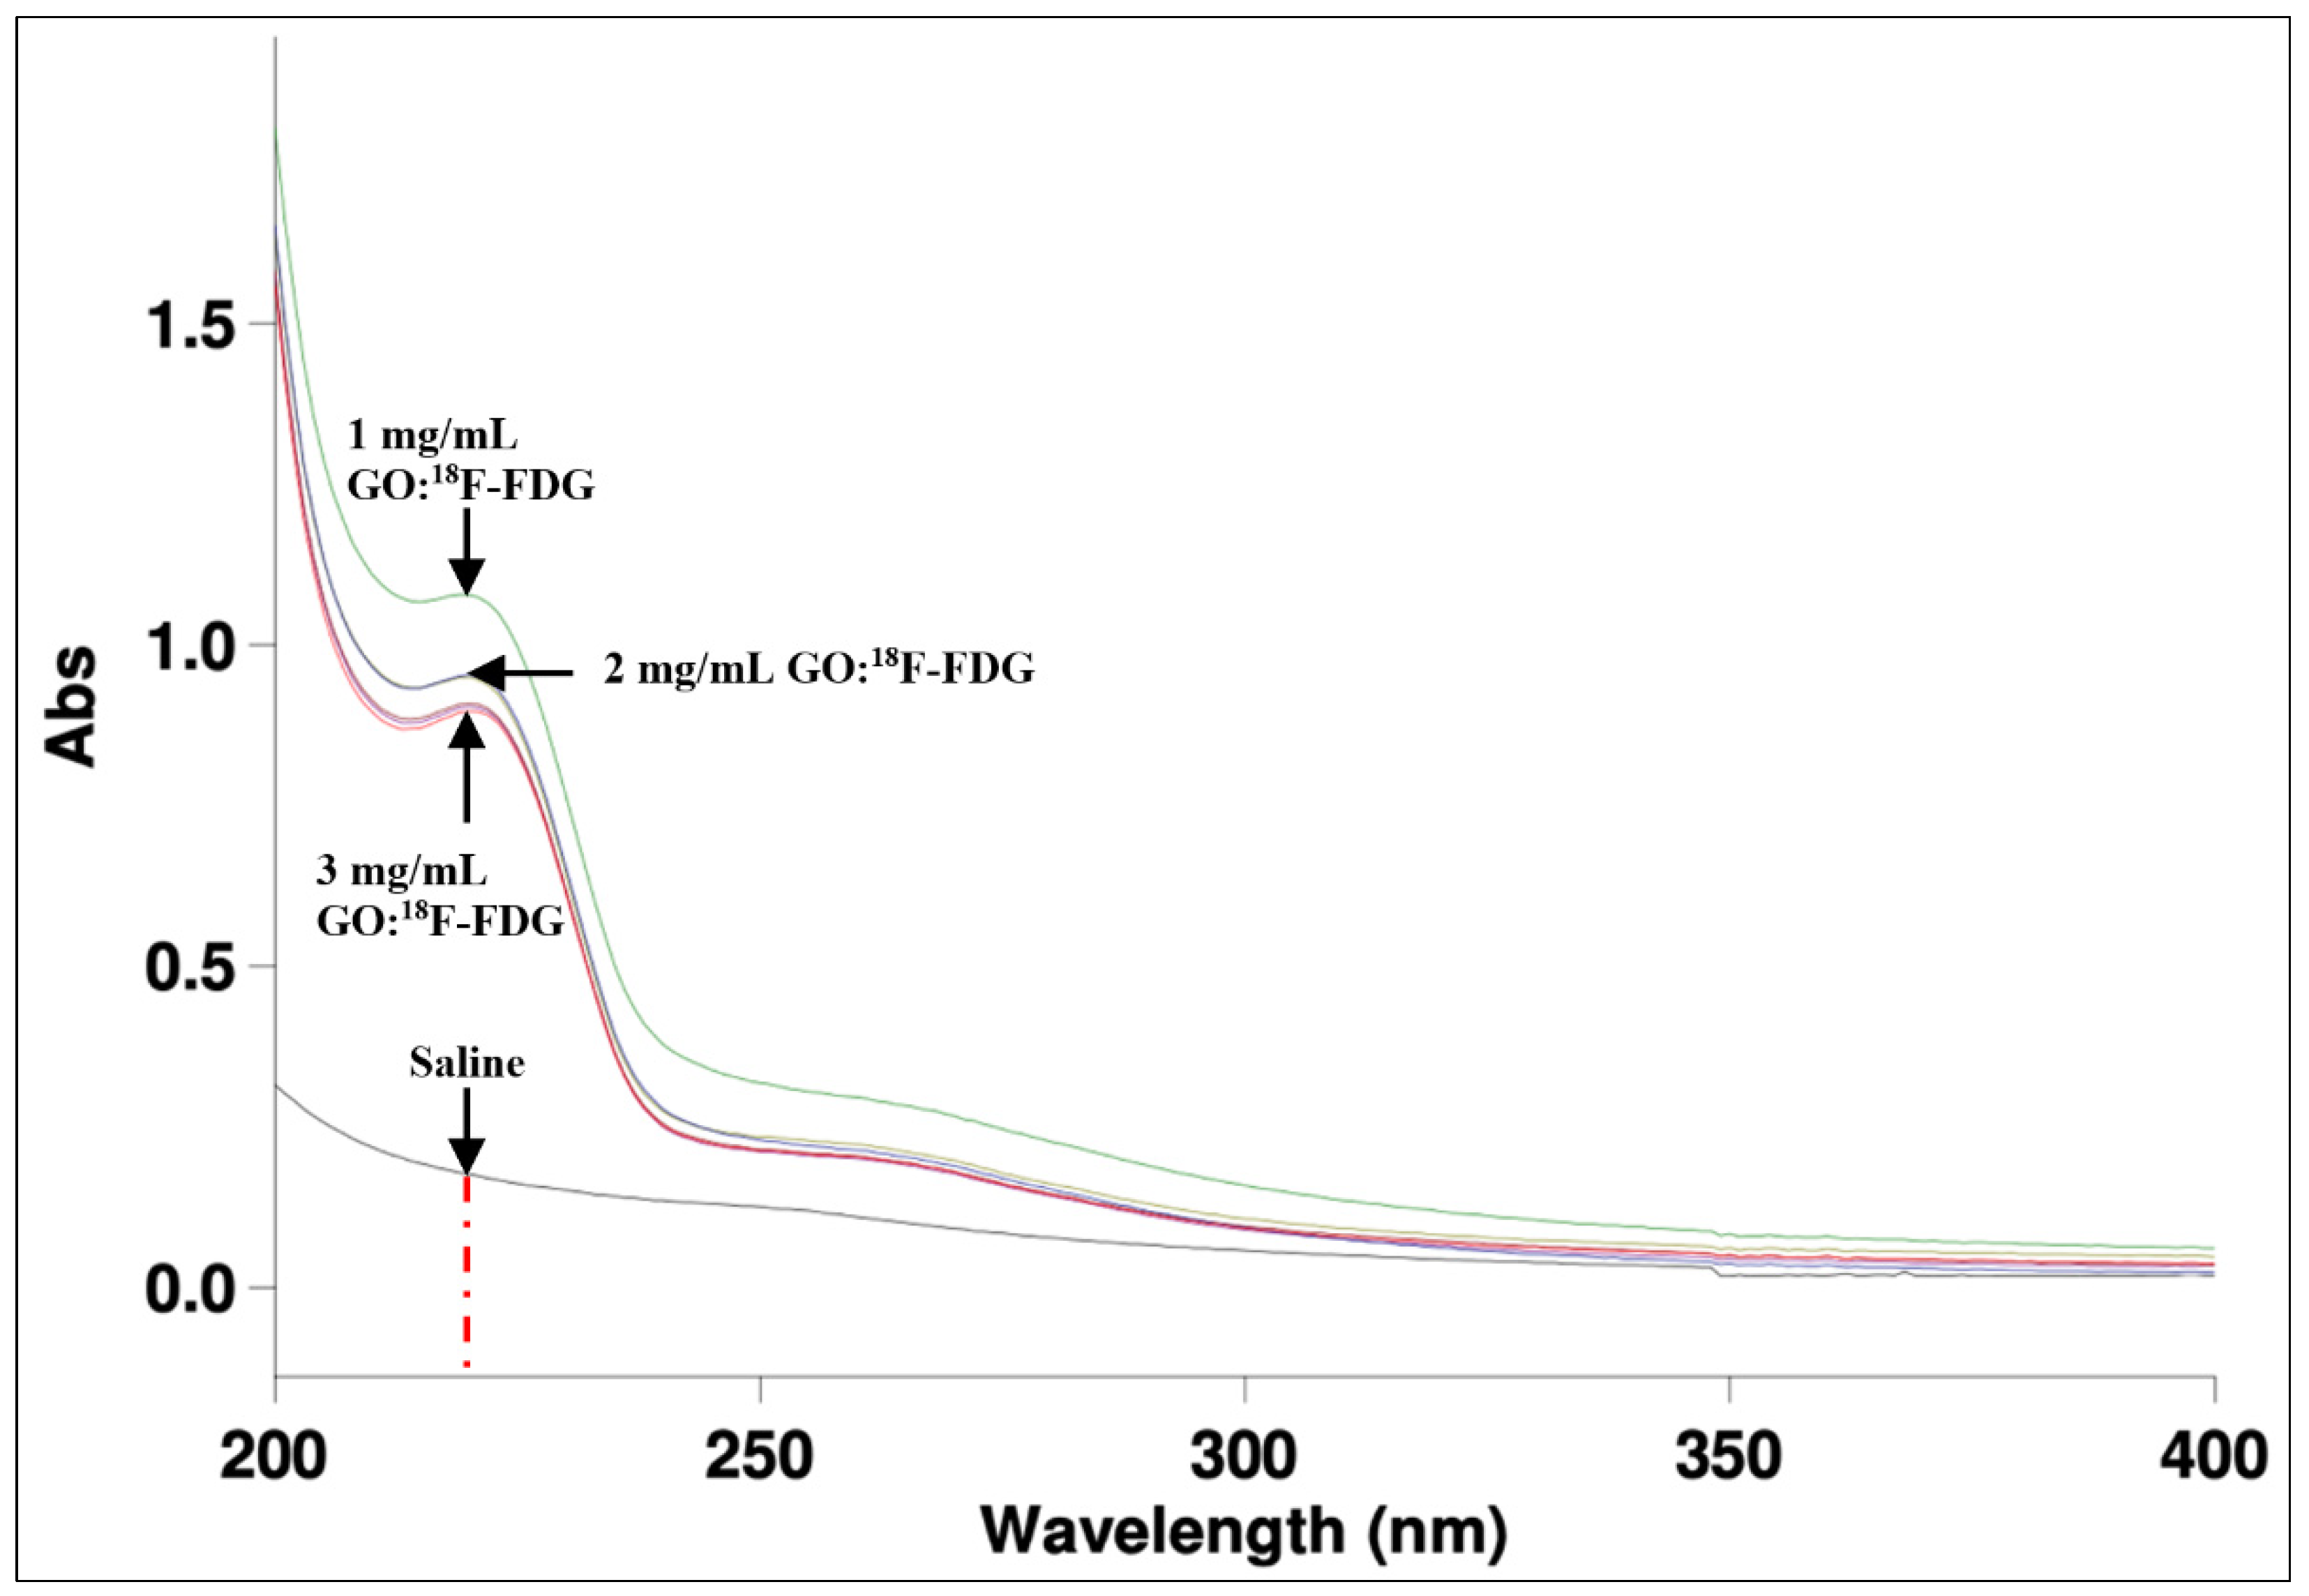
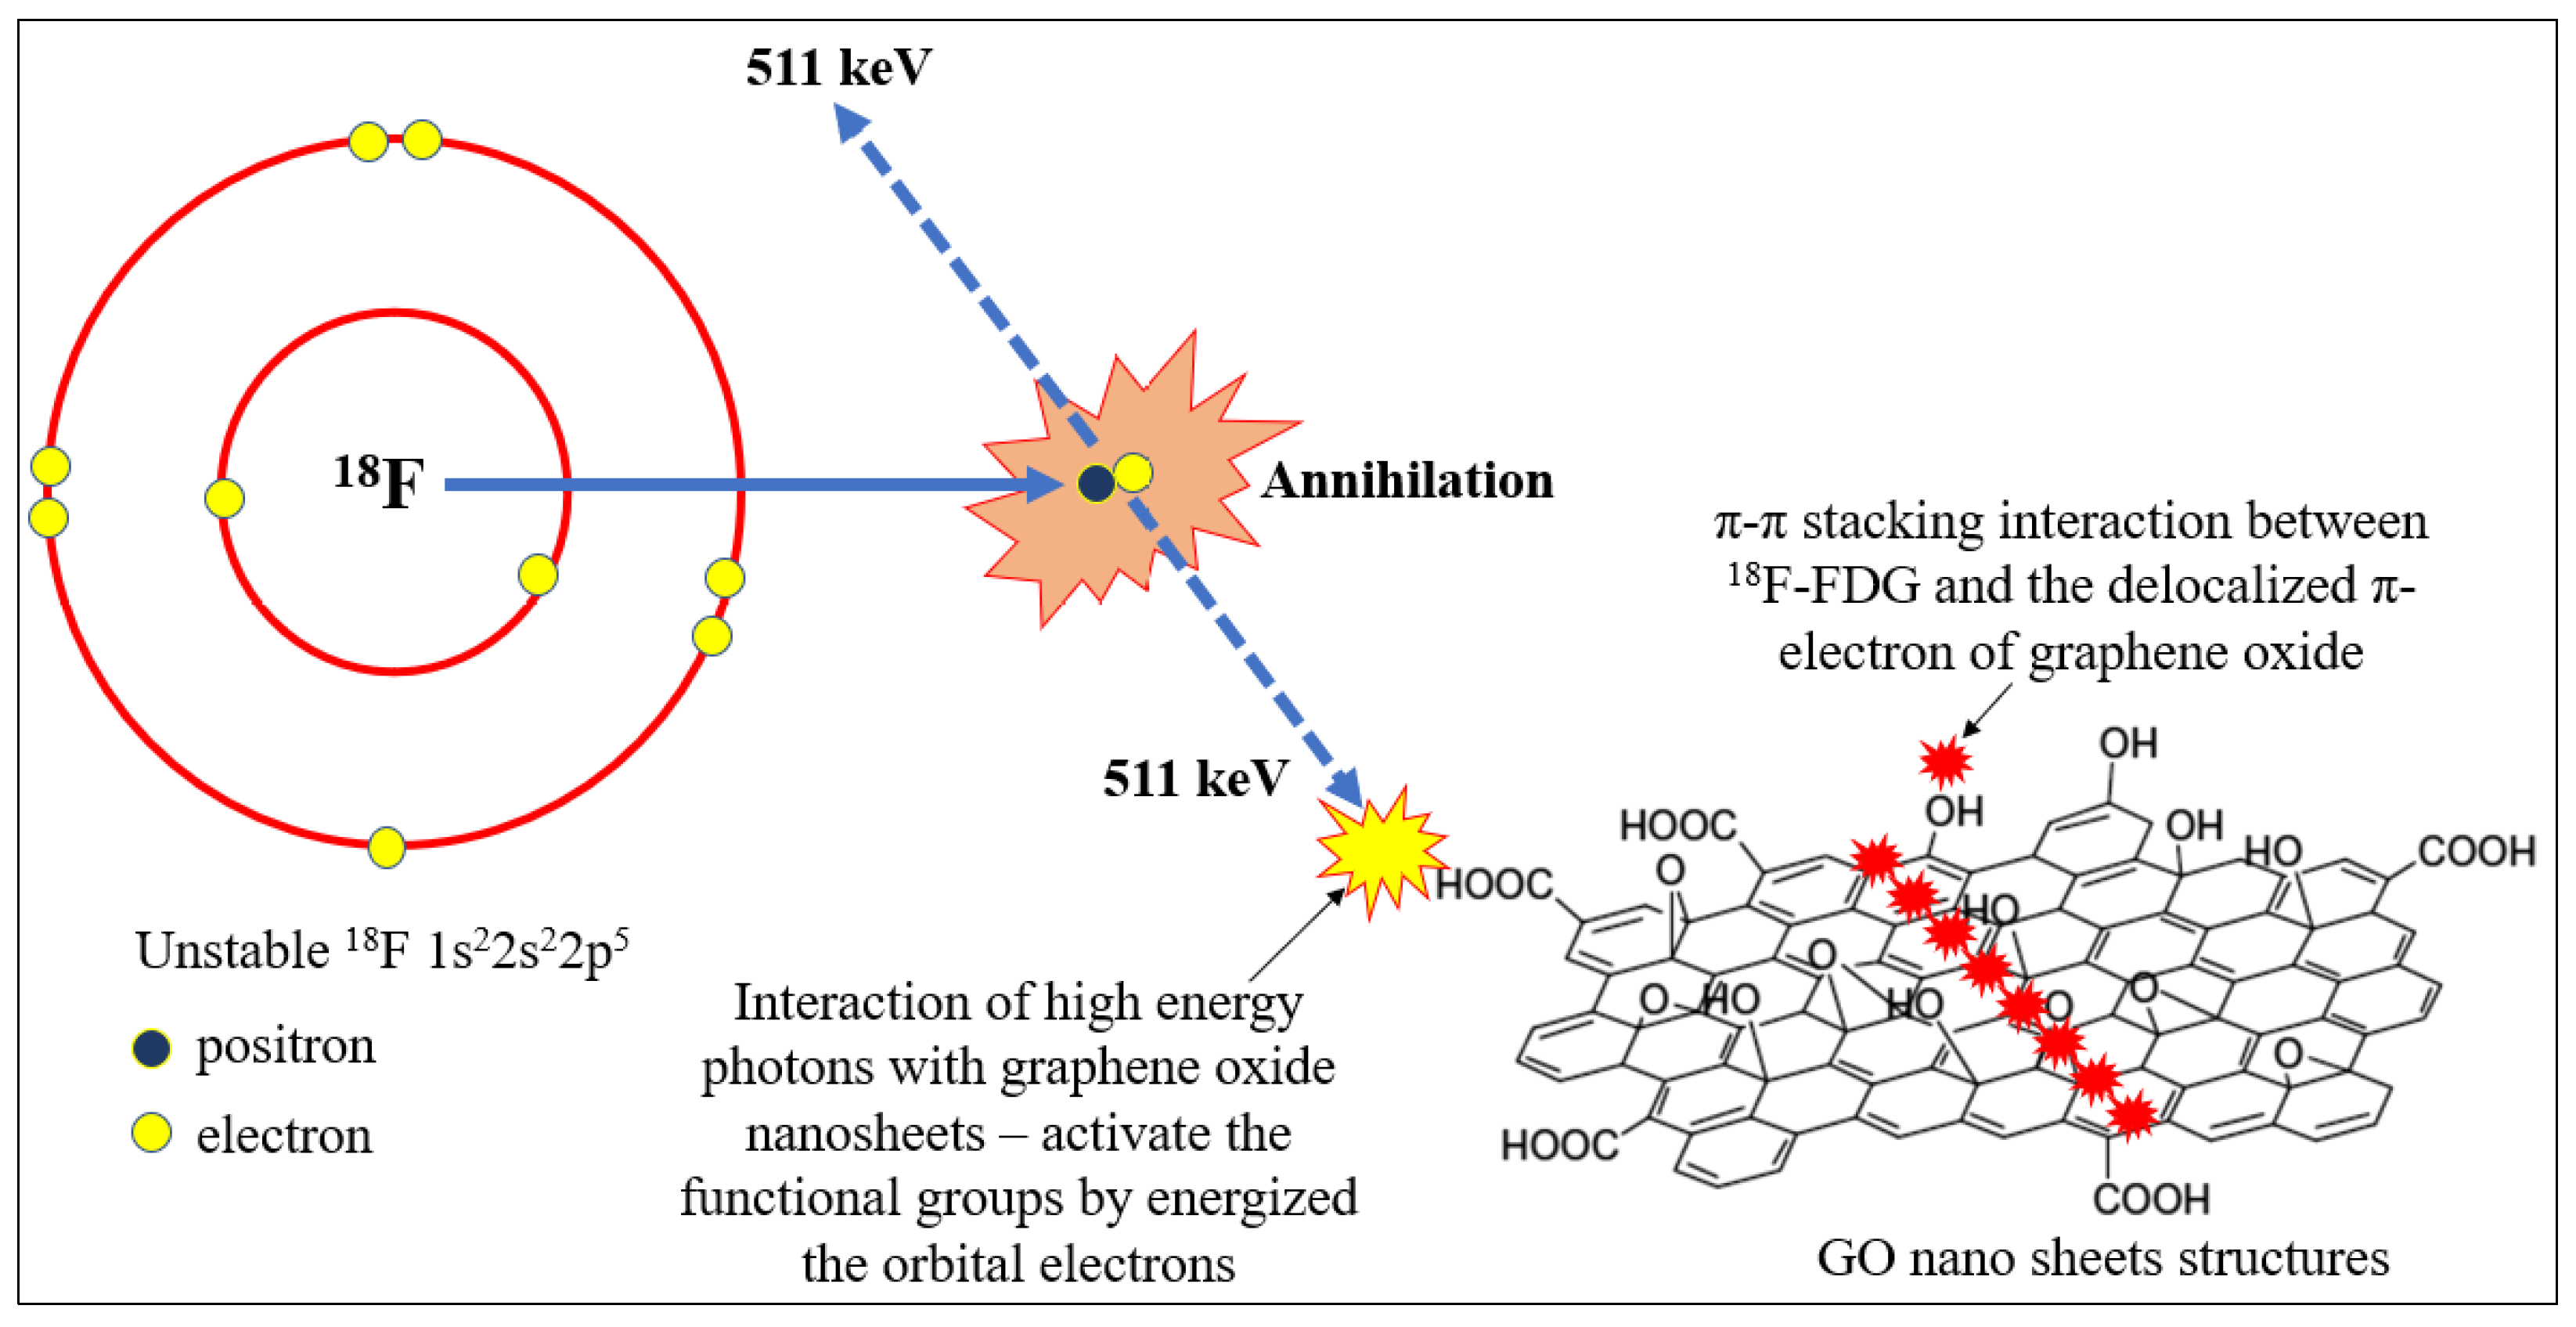
3.3. UV–Vis Spectrometry and Chemical Analysis

The study of absorbability of the graphene oxide and the radionuclide using the UV–vis spectrophotometer provided detailed information about the peak of the wavelength based on the Beer–Lambert law [43]. The GO and 18F-FDG UV–visible adsorption spectra were obtained as shown in Figure 11. A single band GO adsorption peak can be observed, which was centred at 220 nm as depicted by the dashed red line. This band value indicates the π π * , the transition of aromatic C-C bonds, which have numerous sp2 bonds into the molecular mixtures [44]. The molecule absorbs the UV–vis light starting at the wavelength of 200 nm and begins to decline before attaining the peak at 220 nm. Thereafter, the molecule continues to decline to show that the functional group of GO has partially decreased as it passes a higher value of wavelength. The optical adsorption of GO is dominated by the π π * plasmon peak, which is near 230 nm [45]. This occurrence depends on two conjugative effects: clusters of nanometer-scale sp2 and the chromophore unit, such as C = C, C = O and C-O bonds [45].
The chemical structure of 18F is 1s22s22p5 and has a single free orbital electron. It is able to produce high energetic photons with 511 keV which activate the orbital electrons of the functional groups and delocalize on to the GO nano sheets via continuous π π * stacking interactions due to the stacked nanolayers of GO structures. The 511 keV photons energy might eject the orbital electrons at available functional groups to provide free molecular vacancy to be filled in by unstable 18F atoms. The electrons might interact with epoxy bridges, hydroxyl groups, and pairwise carboxyl groups in GO nanolayers [45] and might be influenced by excess energies received during the internal nuclear decay, leading to the annihilation process as shown in Figure 12.
The peak obtained at 220 nm was probably due to the aggregation of chromophore effects that were affected by the mixture of GO:18F-FDG for different GO concentrations [46]. The 1 mg/mL showed the highest peak and the highest adsorbability compared to 2 mg/mL and 3 mg/mL of GO concentrations. This result is in line with the kinetic study illustrated in Figure 8, where a slow decay rate of low 18F-FDG activity provided the chances for the molecular adsorption rate to occur. Higher concentrations might yield a complex saturated phase between the molecular mixtures to interact within a short time, whereas higher activities will generate excess energy to the particles for the annihilation process or eject the electrons from orbitals without interactions. The mixture probably modified the oxygen-containing functional groups, thereby causing the mixture to absorb a slightly lower range of UV–vis wavelength. The wavelength of adsorption also depends on the energy difference between the bonding or antibonding and non-bonding orbital concerned [47].

4. Conclusions

Conclusively, GO has demonstrated high sorption affinity towards the radionuclide of a pure radiopharmaceutical. The high sorption capacity and the ability to coagulate with any reactive elements at molecular structures, such as 18F-FDG, makes it a prime option for alternative radionuclides decontamination. The ‘wax tissue’ nanolayers and vast surface area have been shown to help GO wrap and adsorb radionuclides effectively. The adsorption rate was effective at a slow decay rate of 18F-FDG, where more available free electrons are ready for the adsorption interaction with GO functional groups. Fluctuation of electron interactions and the active annihilation process occurred at high activity, thereby reducing the coagulation process within a short time due to the energetic nuclear process. The optical adsorption of GO with 18F-FDG is dominated by the π π * plasmon peak, which is near 230 nm.

Author Contributions

Conceptualization, M.K.A.A.R. and A.M.N.; methodology, M.K.A.A.R., A.M.N. and N.H.A.; software, N.H.A. and F.A.M.Z.; validation, M.K.A.A.R., A.M.N. and N.H.A.; formal analysis, M.K.A.A.R., F.H.M.H., A.M.N. and F.A.M.Z.; investigation, M.K.A.A.R., N.M.N.; resources, M.K.A.A.R., N.M.N., A.M.N., M.M. and F.A.M.Z.; data curation, F.H.M.H., R.S. and F.I.; writing—original draft preparation, M.K.A.A.R. and F.H.M.H.; writing—review and editing, M.K.A.A.R., N.M.N., A.M.N.; visualization, M.K.A.A.R., A.M.N.; supervision, M.K.A.A.R., N.M.N., N.H.A. and M.M.; project administration, F.H.M.H., R.S. and F.I., M.M.; funding acquisition, M.K.A.A.R. and N.M.N. All authors have read and agreed to the published version of the manuscript.

Funding

This work was supported by a Short-Term Research Grant from Universiti Sains Malaysia [304/PPSK/6315499]. The APC was funded by Universiti Sains Malaysia.

Institutional Review Board Statement

Not applicable.

Informed Consent Statement

Not applicable.

Data Availability Statement

Not applicable.

Acknowledgments

We express our appreciation to Nik Fakurudin Nik Ali and Wan Norhasikin Wan Marizam of the School of Health Sciences, Universiti Sains Malaysia, for their help in obtaining the FESEM micrographs. Our appreciation goes to the Department of Nuclear Medicine, Radiotherapy & Oncology, Hospital Universiti Sains Malaysia and Nuclear Medicine & Molecular Imaging Department, Chancellor Tuanku Muhriz Hospital, Universiti Kebangsaan Malaysia for the use of their facilities when conducting the research project.

Conflicts of Interest

The authors declare no conflict of interest.

References

  1. Payolla, B.; Massabni, A.F.; Orvig, C. Radiopharmaceuticals for Diagnosis in Nuclear Medicine: A short review. Eclet. Quim. 2019, 44, 11–19. [Google Scholar] [CrossRef]
  2. Jacobson, O.; Kiesewetter, D.; Chen, X. Fluorine-18 Radiochemistry, Labeling Strategies and Synthetic Routes. Bioconjugate Chem. 2014, 26, 1–18. [Google Scholar] [CrossRef] [PubMed]
  3. Park, B.; Kitteringham, N. Effects of Fluorine Substitution on Drug Metabolism: Pharmacological and Toxicological Implications. Drug Metab. Rev. 1994, 26, 605–643. [Google Scholar] [CrossRef] [PubMed]
  4. Nawi, N.M.; Ahmad, N.S.; Abdullah, R.; Zainon, W.M.N.W.; Razab, M.K.A.A. Correlation of external dose rate with whole body clearance estimation in radioiodine therapy for rhTSH and THW patients. J. Radiat. Res. Appl. Sci. 2020, 13, 240–245. [Google Scholar] [CrossRef] [Green Version]
  5. Ramesha, G.; Vijaya Kumara, A.; Muralidhara, H.; Sampath, S. Graphene and graphene oxide as effective adsorbents toward anionic and cationic dyes. J. Colloid Interface Sci. 2011, 361, 270–277. [Google Scholar] [CrossRef]
  6. Jiang, W.; Chalich, Y.; Deen, M.J. Sensors for Positron Emission Tomography Applications. Sensors 2019, 19, 5019. [Google Scholar] [CrossRef] [Green Version]
  7. Shivanand, B.; Akchata, S.; Lavanya, K. Influence of decontaminating agents and swipe materials on laboratory simulated working surfaces wet spilled with sodium pertechnetate. Indian J. Nucl. Med. 2017, 32, 173–176. [Google Scholar] [CrossRef] [Green Version]
  8. Lee, W.; Ojovan, M.; Jantzen, C. Radioactive Waste Management and Contaminated Site Clean-Up; Woodhead Publishing: Cambridge, UK, 2013; pp. 301–326. [Google Scholar]
  9. Fu, S.; Sun, Z.; Huang, P.; Li, Y.; Hu, N. Some Basic Aspects of Polymer Nanocomposites: A critical review. Nano Mater. Sci. 2019, 1, 2–30. [Google Scholar] [CrossRef]
  10. Smith, A.; LaChance, A.; Zeng, S.; Liu, B.; Sun, L. Synthesis, properties, and applications of graphene oxide/reduced graphene oxide and their nanocomposites. Nano Mater. Sci. 2019, 1, 31–47. [Google Scholar] [CrossRef]
  11. Sajjad, S.; Leghari, S.A.K.; Iqbal, A. Study of Graphene Oxide Structural Features for Catalytic, Antibacterial, Gas Sensing and Metals Decontamination Environmental Applications. ACS Appl. Mater. Interfaces 2017, 9, 43393–43414. [Google Scholar] [CrossRef]
  12. Zhao, Y.; Zhang, Z.; Pan, Z.; Liu, Y. Advanced Bioactive Nanomaterials for Biomedical Applications. Exploration 2021, 1, 20210089. [Google Scholar] [CrossRef]
  13. Novacek, M.; Jankovsky, O.; Luxa, J.; Sedmidubsky, D.; Pumera, M.; Fila, V.; Lhotka, M.; Klimova, K.; Matejkova, S.; Sofer, Z. Tuning of Graphene Oxide Composition by Multiple Oxidations for Carbon Dioxide Storage and Capture of Toxic Metals. J. Mater. Chem. A 2017, 5, 2739–2748. [Google Scholar] [CrossRef] [Green Version]
  14. Prasadh, S.; Suresh, S.; Wong, R. Osteogenic Potential of Graphene in Bone Tissue Engineering Scaffolds. Materials 2018, 11, 1430. [Google Scholar] [CrossRef] [Green Version]
  15. Raccichini, R.; Varzi, A.; Passerini, S.; Scrosati, B. The Role of Graphene for Electrochemical Energy Storage. Nat. Mater. 2015, 14, 271–279. [Google Scholar] [CrossRef] [PubMed]
  16. Ng, Y.H.; Ikeda, S.; Matsumura, M.; Amal, R. A Perspective on Fabricating Carbon-based Nanomaterials by Photocatalysis and their Applications. Energy Environ. Sci. 2012, 5, 9307–9318. [Google Scholar] [CrossRef]
  17. Wen, J.; Xu, Y.; Li, H.; Lu, A.; Sun, S. Recent Applications of Carbon Nanomaterials in Fluorescence Biosensing and Bioimaging. Chem. Commun. 2015, 51, 11346–11358. [Google Scholar] [CrossRef]
  18. Shtein, M.; Nadiv, R.; Buzaglo, M.; Kahil, K.; Regev, O. Thermally Conductive Graphene Polymer Composites: Size, Percolation and Synergy Effects. Chem. Mater. 2015, 27, 2100–2106. [Google Scholar] [CrossRef]
  19. Zunita, M.; Irawanti, R.; Koesmawati, T.A.; Lugitoa, G.; Wenten, I.G. Graphene Oxide (GO) Membrane in Removing Heavy Metals from Wastewater: A Review. Chem. Eng. Trans. 2020, 82, 415–420. [Google Scholar]
  20. Ng, L.Y.; Chua, H.Y.; Ng, C.Y. Incorporation of Graphene Oxide-based Nanocomposite in the Polymeric Membrane for Water and Wastewater Treatment: A review on Recent Development. J. Environ. Chem. Eng. 2021, 9, 105994. [Google Scholar] [CrossRef]
  21. Aunkor, M.T.H.; Raihan, T.; Prodhan, S.H.; Metselaar, H.S.C.; Malik, S.U.F.; Azad, A.K. Antibacterial Activity of Graphene Oxide Nanosheet Against Multidrug Resistant Superbugs Isolated from Infected Patients. R. Soc. Open Sci. 2020, 7, 200640. [Google Scholar] [CrossRef]
  22. Eigler, S.; Hirsch, A. Chemistry with Graphene and Graphene Oxide—Challenges for Synthetic Chemists. Angew. Chem. Int. Ed. 2014, 53, 7720–7738. [Google Scholar] [CrossRef] [PubMed] [Green Version]
  23. Sabzehmeidani, M.M.; Mahnaee, S.; Ghaedi, M.; Heidari, H.; Roy, V.A.L. Carbon Based Materials: A review of Adsorbents for Inorganic and Organic Compounds. Mater. Adv. 2021, 2, 598–627. [Google Scholar] [CrossRef]
  24. Feltcorn, E. Technology Reference Guide for Radiologically Contaminated Surfaces; U.S. Environmental Protection Agency: Washington, DC, USA, 2006; pp. 11–18.
  25. Zhao, G.; Wen, T.; Yang, X.; Yang, S.; Liao, L.; Hu, J.; Shao, D.; Wang, X. Preconcentration of U(VI) Ions on Few-layered Graphene Oxide Nanosheets from Aqueous Solutions. Dalton Trans. 2012, 41, 6182–6188. [Google Scholar] [CrossRef]
  26. Rauwel, P.; Rauwel, E. Towards the Extraction of Radioactive Cesium-137 from Water via Graphene/CNT and Nanostructured Prussian Blue Hybrid Nanocomposites: A Review. Nanomaterials 2019, 9, 682. [Google Scholar] [CrossRef] [PubMed] [Green Version]
  27. Suksompong, T.; Thongmee, S.; Sudprasert, W. Efficacy of a Graphene Oxide/Chitosan Sponge for Removal of Radioactive Iodine-131 from Aqueous Solutions. Life 2021, 11, 721. [Google Scholar] [CrossRef] [PubMed]
  28. Romanchuk, A.Y.; Slesarev, A.S.; Kalmykov, S.N.; Kosynkin, D.V.; Tour, T.M. Graphene Oxide for Effective Radionuclide Removal. Phys. Chem. Chem. Phys. 2013, 15, 2321–2327. [Google Scholar] [CrossRef]
  29. Noor, A.M.; Yusoff, N.F.A.; Huang, N.M.; Kari, Z.A.; Razab, M.K.A.A.; Bakar, M.H.A.; Lee, S.W.; Abdullah, N.H. Facile Preparation of Graphene Oxide Silver Aerogel for Antibacterial. J. Trop. Resour. Sustain. Sci. 2018, 6, 41–44. [Google Scholar]
  30. Zin FA, M.; Noor, A.M.; Razab, M.K.A.A.; Abdullah, N.H.; Lee, S.W. Synthesis of Silver Graphene Oxide Nanocomposite Reinforced with Kenaf Cellulose Nanofibril Aerogel. AIP Conf. Proc. 2019, 2068, 020045-1–020045-6. [Google Scholar]
  31. Noor, A.M.; Zin, F.M.; Wei, L.S.; Huang, N.M.; Bakar, M.H.A.; Sajab, M.S.; Razab, M.K.A.A.; Abdullah, N.H.; Kari, Z.A. Laser Scribe Silver-reduced Graphene Oxide as Novel Bactericidal Filter. AIP Conf. Proc. 2019, 2068, 020026-1–020026-6. [Google Scholar]
  32. Zobir, S.A.M.; Rashid, S.A.; Tan, T. Recent Development on the Synthesis Techniques and Properties of Graphene Derivatives. In Synthesis, Technology and Applications of Carbon Nanomaterials; Rashid, S.A., Othman, R.N.I.R., Hussein, M.Z., Eds.; Matthew Deans: Oxford, UK, 2019; pp. 77–107. [Google Scholar]
  33. Razab, M.K.A.A.; Mansor, M.S.; Noor, A.M.; Latif, N.F.F.A.; Rozi, S.M.; Jaafar, K.N.; Jamaludin, F. Characterization of GO:I-131 for Radioactive Clinical Waste Water Management in Nuclear Medicine. Mater. Sci. Forum. 2020, 1010, 561–566. [Google Scholar] [CrossRef]
  34. Razab, M.K.A.A.; Mansor, M.S.; Noor, A.M.; Rozi, S.M.; Latif, N.F.F.A.; Jaafar, K.N.; Jamaludin, F. Preliminary Study of the Potential Graphene Oxide as Radioactive Clinical Wastewater Adsorbability in Nuclear Medicine. IOP Conf. Ser. Earth Environ. Sci. 2020, 96, 012037. [Google Scholar] [CrossRef]
  35. Díez-Pascual, A.; Sainz-Urruela, C.; Vallés, C.; Vera-López, S.; San Andrés, M. Tailorable Synthesis of Highly Oxidized Graphene Oxides via an Environmentally-Friendly Electrochemical Process. Nanomaterials 2020, 10, 239. [Google Scholar] [CrossRef] [PubMed] [Green Version]
  36. Yang, N.; Yang, D.; Zhang, G.; Chen, L.; Liu, D.; Cai, M.; Fan, X. The Effects of Graphene Stacking on the Performance of Methane Sensor: A First-Principles Study on the Adsorption, Band Gap and Doping of Graphene. Sensors 2018, 18, 422. [Google Scholar] [CrossRef] [PubMed] [Green Version]
  37. Kamali, N.; Ghasemi, J.B.; Ziarani, G.M.; Moradian, S.; Badiei, A. Design, Synthesis, and Nanoengineered Modification of Spherical Graphene Surface by LDH for Removal of As(III) from Aqueous Solutions. Chin. J. Chem. Eng. 2022, in press. [CrossRef]
  38. Aliyev EFiliz, V.; Khan, M.M.; Lee, Y.J.; Abetz, C.; Abetz, V. Structural Characterization of Graphene Oxide: Surface Functional Groups and Fractionated Oxidative Debris. Nanomaterials 2019, 9, 1180. [Google Scholar] [CrossRef] [Green Version]
  39. Smajlagic, I.; Rowshanpour, R.; Milkin, L.; Dudding, T. Organofluorine Compounds in Fluorine-18 Positron Emission Tomography Imaging. Res. Rev. Health Care Open Acc. J. 2020, 5, 488–491. [Google Scholar]
  40. Kuilla, T.; Bhadra, S.; Yao, D.; Kim, N.H.; Bose, S.; Lee, J.H. Recent Advances in Graphene Based Polymer Composites. Prog. Polym. Sci. 2010, 35, 1350–1375. [Google Scholar] [CrossRef]
  41. Jenkins, D. Nuclear Structure and Radioactive Decay. In Radiation Detection for Nuclear Physics; IOP Publishing: Bristol, UK, 2020; pp. 1–32. [Google Scholar]
  42. Alauddin, M.M. Positron Emission Tomography (PET) Imaging with 18F-based Radiotracers. Am. J. Nucl. Med. Mol. Imaging 2012, 2, 55–76. [Google Scholar]
  43. Yang, S.; Chen, Q.; Shi, M.; Zhang, Q.; Lan, S.; Maimaiti, T.; Li, Q.; Ouyang, P.; Tang, K.; Yang, S.T. Fast Identification and Quantification of Graphene Oxide in Aqueous Environment by Raman Spectroscopy. Nanomaterials 2020, 10, 770. [Google Scholar] [CrossRef] [Green Version]
  44. Zin, F.A.M.; Noor, A.M.; Lee, S.W.; Sajab, M.S.; Razab, M.K.A.A.; Abdullah, N.H.; Ishak, W.M.F.W.; Wong, K.N.S.S.; Zaudin, N.A.C. Graphene Oxide Silver Cellulose Alginate for Antibacterial. Mater. Sci. Forum. 2020, 1010, 590–595. [Google Scholar]
  45. Maslekar, N.; Zetterlund, P.B.; Kumar, P.V.; Agarwal, V. Mechanistic Aspects of the Functionalization of Graphene Oxide with Ethylene Diamine: Implications for Energy Storage Applications. ACS Appl. Nano Mater. 2021, 4, 3232–3240. [Google Scholar] [CrossRef]
  46. Lai, Q.; Zhu, S.; Luo, X.; Zou, M.; Huang, S. Ultraviolet-visible Spectroscopy of Graphene Oxides. AIP Adv. 2012, 2, 032146-1–032146-5. [Google Scholar] [CrossRef]
  47. Yu, L.; Yan, Q.; Ruzsinszky, A. Key Role of Antibonding Electron Transfer in Bonding on Solid Surfaces. Phys. Rev. Mater. 2019, 3, 092801. [Google Scholar] [CrossRef] [Green Version]
Figure 1. (a) GO solution with 1 mg/mL, 2 mg/mL and 3 mg/mL mixed with 18F-FDG of 1mCi (~37 MBq) in glass serum vials. (b) GO:18F-FDG mixture poured into filter papers.
Sustainability 14 04492 g001
Figure 2. GO flake 2D structures with random ‘wax-tissue’ layers and complex hollow structures. (a) Complex hollow structures with wrinkles and exfoliated tissue layers, (b) wrinkles and exfoliated stacked structures with random small flakes.
Sustainability 14 04492 g002
Figure 3. GO substrate surface stacked nanostructures. (a) Random stacks of small-flake GO nano-layers, (b) flat surface of large-flake GO nano-layers.
Sustainability 14 04492 g003
Figure 4. Close-up of single substrate GO nanolayers. (a) Contaminants existed on the GO nano-layers, (b) continuous wrinkle and exfoliated networking lines ready for adsorption interactions.
Sustainability 14 04492 g004
Figure 5. Agglomerated ‘wax-tissues’ GO with stacking layers. (a) Random and long strand agglomerated ‘wax-tissue’ nanolayers, (b) identification of stacking layers on agglomerated GO structures.
Sustainability 14 04492 g005
Figure 6. (a) Attached and free spherical agglomerated GO structures and (b) small spherical agglomerated GO nano structures have been randomly attached on the stacked wrinkles and exfoliated single GO nanolayer.
Sustainability 14 04492 g006
Figure 7. (a) Stacking wrinkles and exfoliated GO nanolayers [34], (b) XRD characterization of GO centred at 10.0°, and (c) UV–vis spectrum characteristic peaks of GO observed at 227 and 229 nm.
Sustainability 14 04492 g007
Figure 8. GO:18F-FDG mixtures with an initial activity of 37 MBq and different concentrations of GO.
Sustainability 14 04492 g008
Figure 9. GO:18F-FDG mixtures with an initial activity of 74 MBq and different concentrations of GO.
Sustainability 14 04492 g009
Figure 10. GO:18F-FDG mixtures with an initial activity of 111 MBq and different concentrations of GO.
Sustainability 14 04492 g010
Figure 11. The UV–vis adsorption of GO:18F-FDG with different concentrations has been seen on at the peak of 220 nm.
Sustainability 14 04492 g011
Figure 12. Illustration of energetic gamma rays produced by unstable 18F when activating the adsorption process with functional groups and GO nanosheet structures.
Sustainability 14 04492 g012
Publisher’s Note: MDPI stays neutral with regard to jurisdictional claims in published maps and institutional affiliations.

