Abstract
Drought is one of the most complex natural phenomena affecting the life and livelihood of people, especially in the current time of human-induced climate change. This research employs ground-based observations to assess the recent spatiotemporal characteristics of meteorological drought events over Rwanda. The drought is examined based on the Standardized Precipitation Evapotranspiration Index (SPEI) and Standardized Precipitation Index (SPI) at seasonal and annual time scales from 1981 to 2020. The Man–Kendal test was used to evaluate the trends in rainfall, temperature, and SPEI values at the annual scale and during the March to May (MAM) and October to December (OND) seasons. The analysis revealed nonsignificant trends in annual (8.4 mm/decade), MAM (−3.4 mm/decade), and OND (4.5 mm/decade) rainfall, while an apparent significant increasing trend in surface air temperature was obtained during the MAM (0.19 °C/decade), OND (0.2 °C/decade), and annual (0.23 °C/decade) time slices. Overall, the SPEI characteristics indicated that the country is more prone to moderate drought events than severe and extreme drought events during MAM and OND seasons. However, the intensity, duration, and frequency differ spatially among seasons. The findings of this study inform policy and decision-makers on the past experienced drought behavior, which can serve as a baseline for future drought mitigation and adaptation plans.
1. Introduction
Climate change and the high population growth rate are increasingly becoming major factors that hinder the sustainability of natural ecosystem conservation as well as human resource development. In the 21st century, where human-induced climate change is altering drought characteristics, drought may no longer be regarded as a natural hazard. As the rise in surface temperature continues unabatedly, the level of global warming impacts society, and the environment escalates. For instance, greenhouse gases are the main cause of a rapid increase in temperature [1,2] and drying conditions resulting in an increased drought in many places worldwide [3,4]. East Africa has frequently experienced severe and prolonged drought events leading to electric shortages and profound impacts on agricultural activities [5,6]. In addition, east African member countries, including Rwanda, depend heavily on the rain-fed agriculture that is being impacted by the changing climate [6]. Therefore, it is paramount to assess drought characteristics at the national level to inform policy and decision-makers on how far the drought has affected the country, which is also helpful for future drought mitigation and adaptation plans.
In the past decades, many drought-related studies have been conducted globally to evaluate its complex dynamics and vulnerability impacts to establish the proper mitigation strategies [7,8,9]. Although concerted efforts have been made, there is still a great concern to understand the evolution, severity, and frequency of drought at regional and local scales [10]. This concern was raised due to the widespread impacts of drought on society compared to other natural disasters. For example, in the Anthropocene, it is hard for scientists and policymakers to determine the exact onset and cessation of either agricultural, meteorological, or hydrological drought events [11,12,13].
Drought occurrences have been reported worldwide with a visible upsurge over the recent decades, resulting from the current human-induced climate change [2,14,15,16]. To mention a few, drought has impacted many countries in America [17,18], Asia [19,20,21] Europe [22,23], and Africa [24,25,26,27]. In addition, Africa and southern Europe experienced an upsurge in drought events, generally linked to the precipitation deficit, resulting in the decadal variations in the Pacific and Indian oceans [28,29,30]. In recent decades, the most significant drought in Sub-Saharan Africa was in 1991/1992, which coincided with severe heatwaves [31]. This humanitarian crisis affected ~86 million people, with approximately 20 million being at risk of starvation as a result of a 75% decrease of their annual rainfall total, which resulted in 70% of crops failing [32]. Consequently, the food imports into the region from April 1992 to June 1993 were six times higher than normal [32].
The East African arid and semi-arid drylands experience potential threats due to the impacts of global warming that worsen aridification, which is progressively increasing land degradation and desertification [9,33,34]. Studies, e.g., [35,36,37], have shown that climate change will still affect the socioeconomic development of less developed countries due to their dependence on climatic conditions even under low emission scenarios. Researchers have also indicated that East Africa has experienced a reduction in Interannual rainfall variability and a quick rise in surface air temperature (SAT), which may further intensify the drought conditions over the region [38,39]. A recent study [40] indicates that rainfall highly fluctuates in the short rainy season during October to November (OND) than the long rainy season of March to May (MAM). However, many previous studies indicated a decline in the MAM rainfall in recent decades [41,42,43], which resulted in severe and frequent famine events. The same decreasing trend in MAM rainfall was revealed over Rwanda [44], while an increasing trend was obtained during the OND season. Unlike rainfall, the SAT has been increasing over the region since the end of the 20th century and in the early 21st century, and it is also anticipated to increase in the future due to climate change [1,38,39].
Colossal studies have been conducted to determine the variability and trends in the drought characteristics, i.e., intensity, severity, duration, and frequency, as well as their respective impacts on water resources, environment, agriculture, and economy in general over EA [45,46,47]. These past studies used numerous drought indices as recommended by World Meteorological Organisation (WMO) [10]. Based on the 12-month Standardized Precipitation Index (SPI-12), the authors of [40] revealed that the eastern parts of EA are getting drier with an average of mild, moderate, and severe drought, while the western areas are getting wetter. Using an updated index of SPI, the Standardized Potential Evapotranspiration Index (SPEI), the authors of [5] indicated a reduction in moderate drought, while severe and extreme drought showed increasing trends in the past decades over Kenya.
At a local scale like Rwanda, a few previous climate-related studies conducted have generally paid attention to assessing spatiotemporal variations in different climatic variables such as rainfall and temperature [44,48,49,50], with no studies at present emphasizing the historical behavior of the characteristics of meteorological drought over Rwanda. Furthermore, the sustainability of water resources and the environment in EA is likely to be affected by an anticipated rise in temperature, more frequent and intense precipitation, and drought events. Therefore, the present study aims to assess recent annual and seasonal meteorological drought trends over Rwanda based on SPEI and SPI. Drought is a natural hazard that greatly impacts agriculture, land use, water resource, and health, leading to economic instability, especially for a country like Rwanda that depends on rain-fed agriculture. Beans, maize, wheat, Irish potato, potato, cassava, and rice are the staple foods in Rwanda. These crops are vulnerable to the changing climate [51]. However, their tolerance to the drought varies from one crop to another and among various crop varieties. For instance, rice was found to be a drought-tolerant crop in Rwanda [52]. Climate change is expected to exacerbate the mean temperature and extreme climate events, which are likely to cause profound grain losses in the future. To reduce the possible impacts of global warming on crop production, it is highly recommended to develop drought-resilient crop cultivars [51]. However, due to the seasonal variations in intensity, frequency, and duration of extreme climate events, it is a challenge to develop a largely adapted cultivar [51]. Thus, investigating historical changes in the meteorological drought offers information that policymakers and decision-makers can use to take mitigation and adaptation strategies to cope with the likely drought risks in the future. The remaining sections of this article are structured as follows. The study domain, data, and methods are explained in Section 2, results and their interpretations are articulated in Section 3. Finally, the discussion is given in Section 4, while the conclusion is provided in the last section.
2. Study Area, Data, and Methods
2.1. Study Area
Rwanda is a landlocked country located in East Africa. It is found within latitude 1.5° S–3° S and longitude 28° E–31° E (Figure 1). The neighboring countries are Tanzania, the Democratic Republic of Congo, Uganda, and Burundi in the east, west, north, and south, respectively. Rwanda is one of the most densely populated countries in EA, where the economy is mainly based on rain-fed agriculture [53]. The local climate is regulated by the complex topographical features of the country. The country experiences a bimodal rainfall pattern, with “long rains” observed from March to May (MAM), while “short rains” occur from September to December (SOND) [44,49,54]. Information on general atmospheric circulations linked to seasonal rainfall climatology can be obtained from past studies [49,55,56,57,58,59,60].
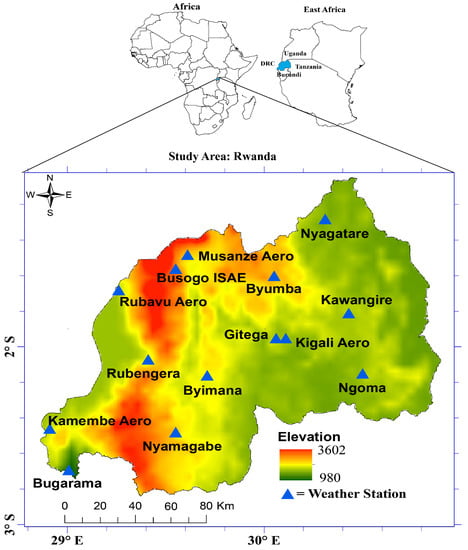
Figure 1.
Location of Rwanda (shaded in blue) in the map of Africa and East Africa, within the geographical delineation of longitude 28° E–31° E and latitude 1.5° S–3° S. The map shows elevation (m) and the distribution of weather stations used in this study. The digital elevation model (DEM) datasets were obtained from the shuttle radar topography mission (SRTM), with 90 m spatial resolution http://dds.cr.usgs.gov/srtm/ (accessed on 14 November 2021).
2.2. Data Description
The present study uses daily ground-based rainfall, minimum and maximum temperature acquired from the Rwanda Meteorology Agency. The datasets were collected from 14 principal stations distributed across the country and recorded from 1981 to 2020. The datasets were subjected to high-quality control checks such as outlier checks, false zero checks for daily rainfall, and homogeneity tests. These checks are routinely done at the meteorology office. Initially, the datasets had some missing values, especially from 1994 till the early 2000s, which were then filled by combining the downscaled and bias-corrected satellite estimates for rainfall and reanalysis for temperature with in situ observations [61].
2.3. Methods
Unlike SPI, which only considers precipitation, SPEI is an improved index that considers both precipitation and the potential evapotranspiration (PET) to identify the anomalous dry and wet conditions of a region [62]. Therefore, this study uses both SPI and SPEI to quantify historical droughts over Rwanda. The SPI and SPEI values were estimated by fitting historical observations into log-logistic distribution. The calculation of PET requires numerous meteorological parameters such as temperature, humidity, and solar radiation as inputs. Thus, there are different methods to compute PET based on the available meteorological data. Due to the limited datasets, the present research used the modified Hargreaves technique, which only requires precipitation, maximum, and minimum temperature datasets. This method has proven not to suffer the inherent disadvantages of the Thornthwaite technique and its performance is relatively close to the well-known Food and Agriculture Organization (FAO) Penman–Monteith equation [63,64,65,66]. More details on the mathematical equations behind the calculations of SPEI and SPI can be found in many past studies, e.g., [45,62]. Following the drought categorization as indicated in Table 1 the present study adopts SPEI and SPI ≤ −1.0 to represent drought conditions while SPEI and SPI ≥ +1.0 to denote wet events over the study region. A similar approach has been employed over the broader region of EA following previous studies [5,34,45].

Table 1.
Classification of drought severity based on SPEI indices as in [34].
Further, the study examines drought features such as drought intensity, duration, and frequency in order to detect the possible effects of climate change in the context of global warming [34,67]. In addition, the severity of drought is evaluated based on the SPEI and SPI drought index levels given in Table 2. This study examines SPEI and SPI at two-time scales, namely SPEI-3/SPI-3 and SPEI-12/SPI12. SPEI-3/SPI-3 denotes the average of the 3-month values within a year, which is very important in assessing flood/drought impacts on agriculture [5,68,69,70]. It is mainly used here to examine the drought characteristics during MAM and OND seasons. SPEI-12/SPI-12 is an index computed from the accumulated 12-month time slice and it gives information on the impacts of drought on hydrology and energy demand [5]. More details of drought characteristics and their respective mathematical functions are described in Table 2.
Table 2.
Description of equations used to calculate various characteristics of drought.
In order to detect the magnitude of change in climatic variables and drought occurrences over the study region, the present research uses the Sen Slope Estimator [71] to assess the past trends and further employs the Mann–Kendall [71] technique to ascertain the significance of the trends. MK is a non-parametric technique and thus, it does not require the data to follow any specific probability distribution function. It also performs well, even on a small sample. The trend significance was tested at the 95% confidence level. This method is common in climate-related studies e.g., [5,44,70,72].
3. Results
3.1. Climatology and Trends of Rainfall and Temperature
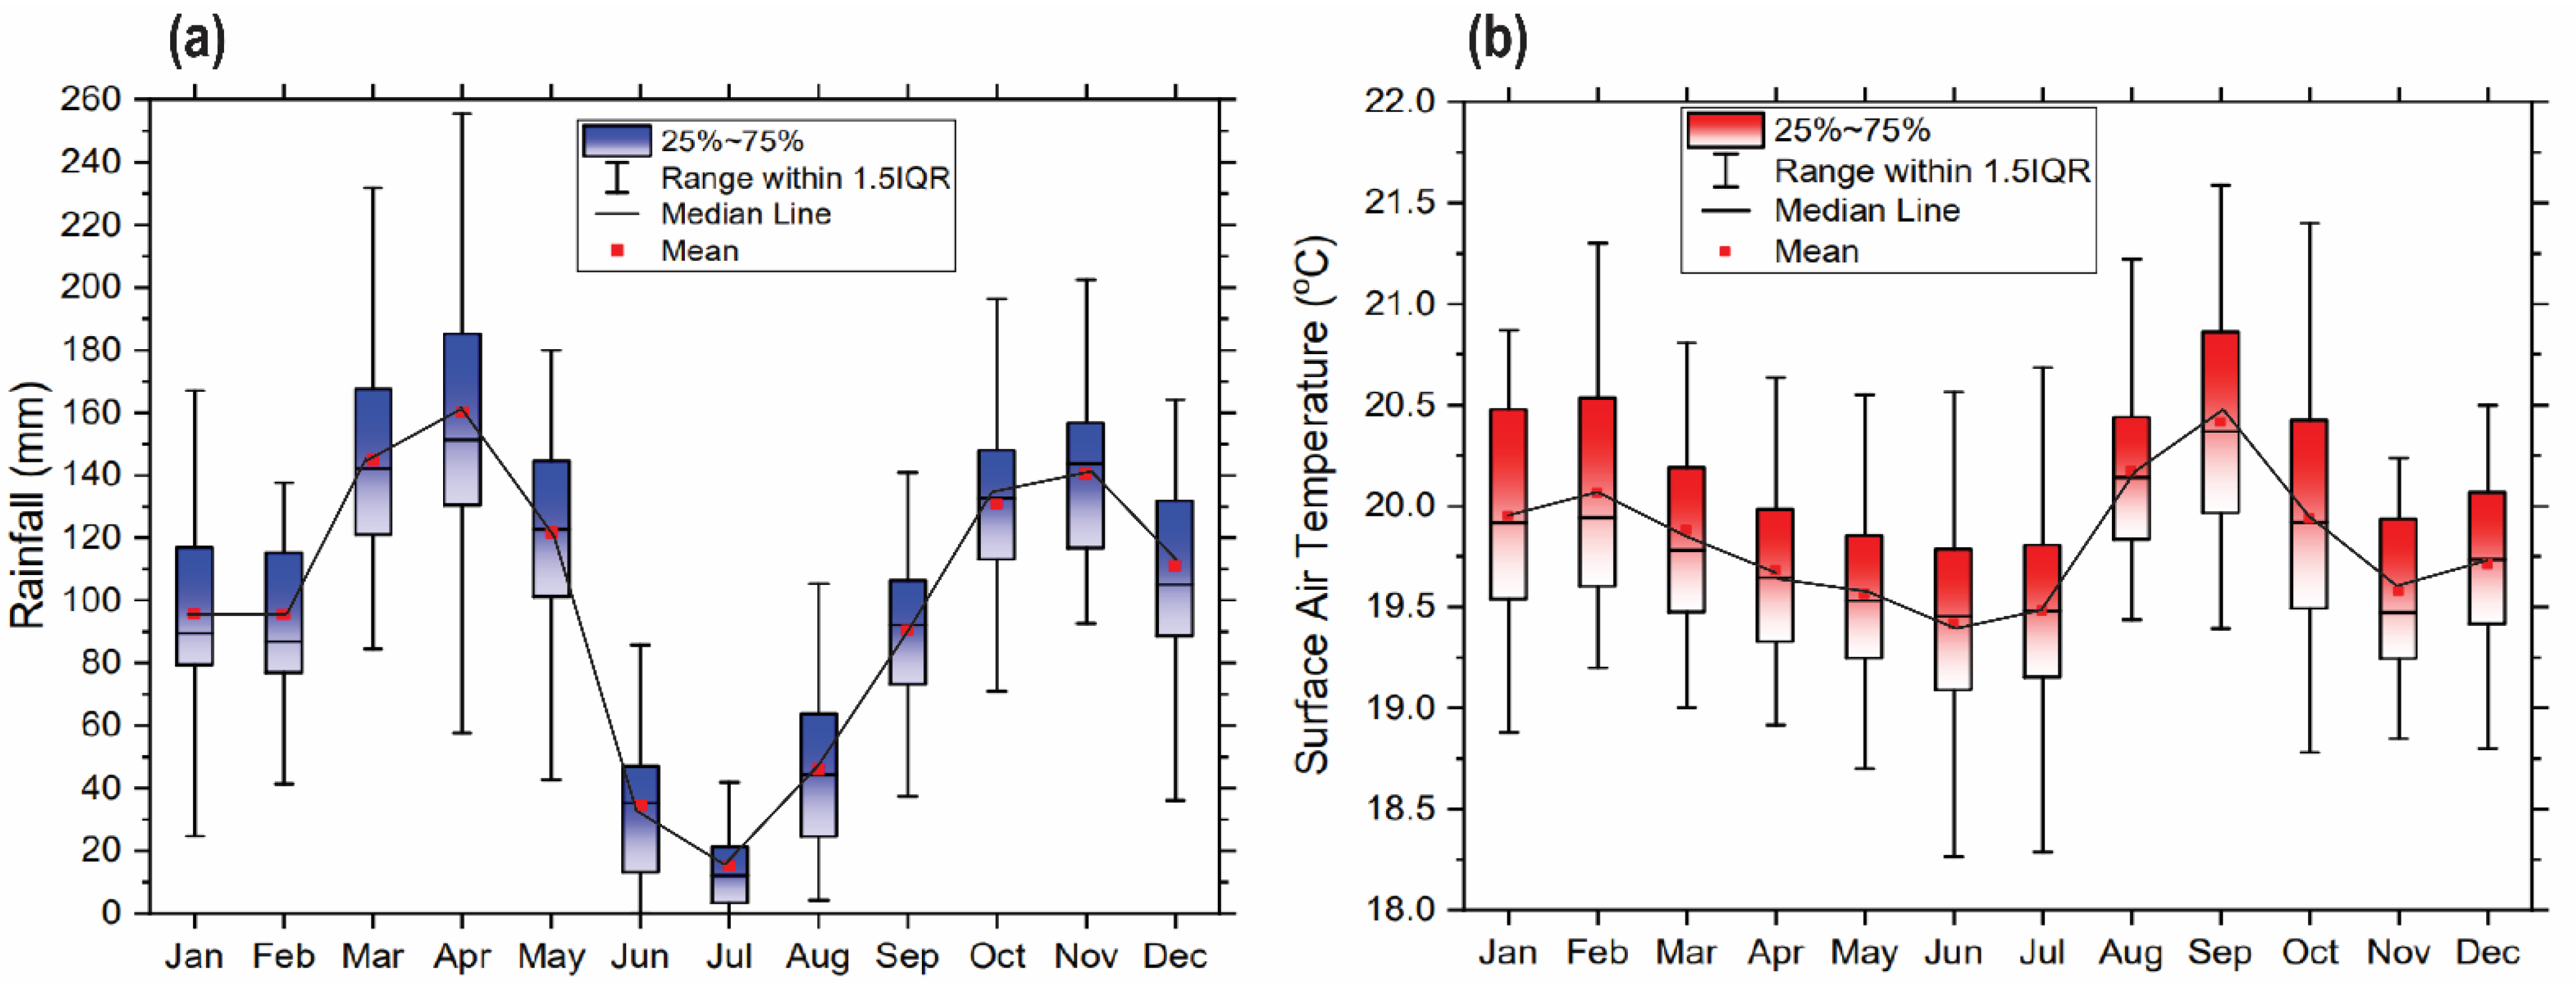
Past studies have remarked the relationship between the occurrence of drought events with variations of meteorological parameters such as rainfall, temperature, and solar radiation, among others [2]. As the first step, the study examines the observed variability and trends in key climatic variables influencing the occurrence of drought events. Figure 2 shows the annual cycle of rainfall and temperature over Rwanda (averaged over all stations). The result indicates that the country exhibits a bimodal rainfall pattern with the long rainy season from March to May (MAM) and the short rainy season from October to December (OND). The monthly rainfall peaks in April during MAM with ~160 mm and in November during OND with ~140 mm. June, July, and August (JJA) receive less rainfall of ~ 35, 15, and 46 mm, respectively. Hence, JJA is referred to as the dry season. The surface air temperature is high in September (~20.4 °C) and February (20.1 °C). The peaks and lows of rainfall and temperature occurrence over the study regions follow the movement of the tropical rain belt, commonly referred to as the Inter-Tropical Convergence Zone. The equatorial rain belt characterized by low-pressure systems oscillates over 15° S to 15° N leading to convective activities like enhanced rainfall over the region during the seasons of MAM and OND, respectively. Meanwhile, the dry season (JJA) observed over the region could be linked to stable atmospheric circulation of cold air mass from the south of the Indian Ocean characterized by high-pressure systems of Mascarene High, which drives the cold air towards the study region [54,72].
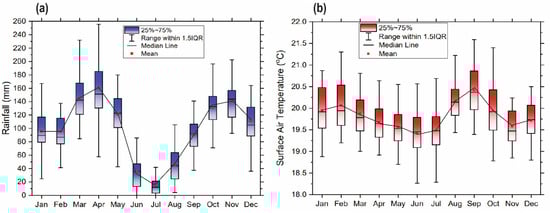
Figure 2.
Summary statistics of the monthly climatology of rainfall (a) and surface air temperature (b) over Rwanda from 1981 to 2020. The box and whiskers indicate the interquartile range of the observed changes in rainfall and temperature climatology over the study region. The black horizontal line in each box represents the median. The bottom and top of the boxes denote the 25th and 75th percentiles, respectively, while the top of the whiskers shows the most extreme values. The mean range is represented by the red dots and the bimodal patterns for rainfall and temperature represented by a continuous black line along with the mean values.
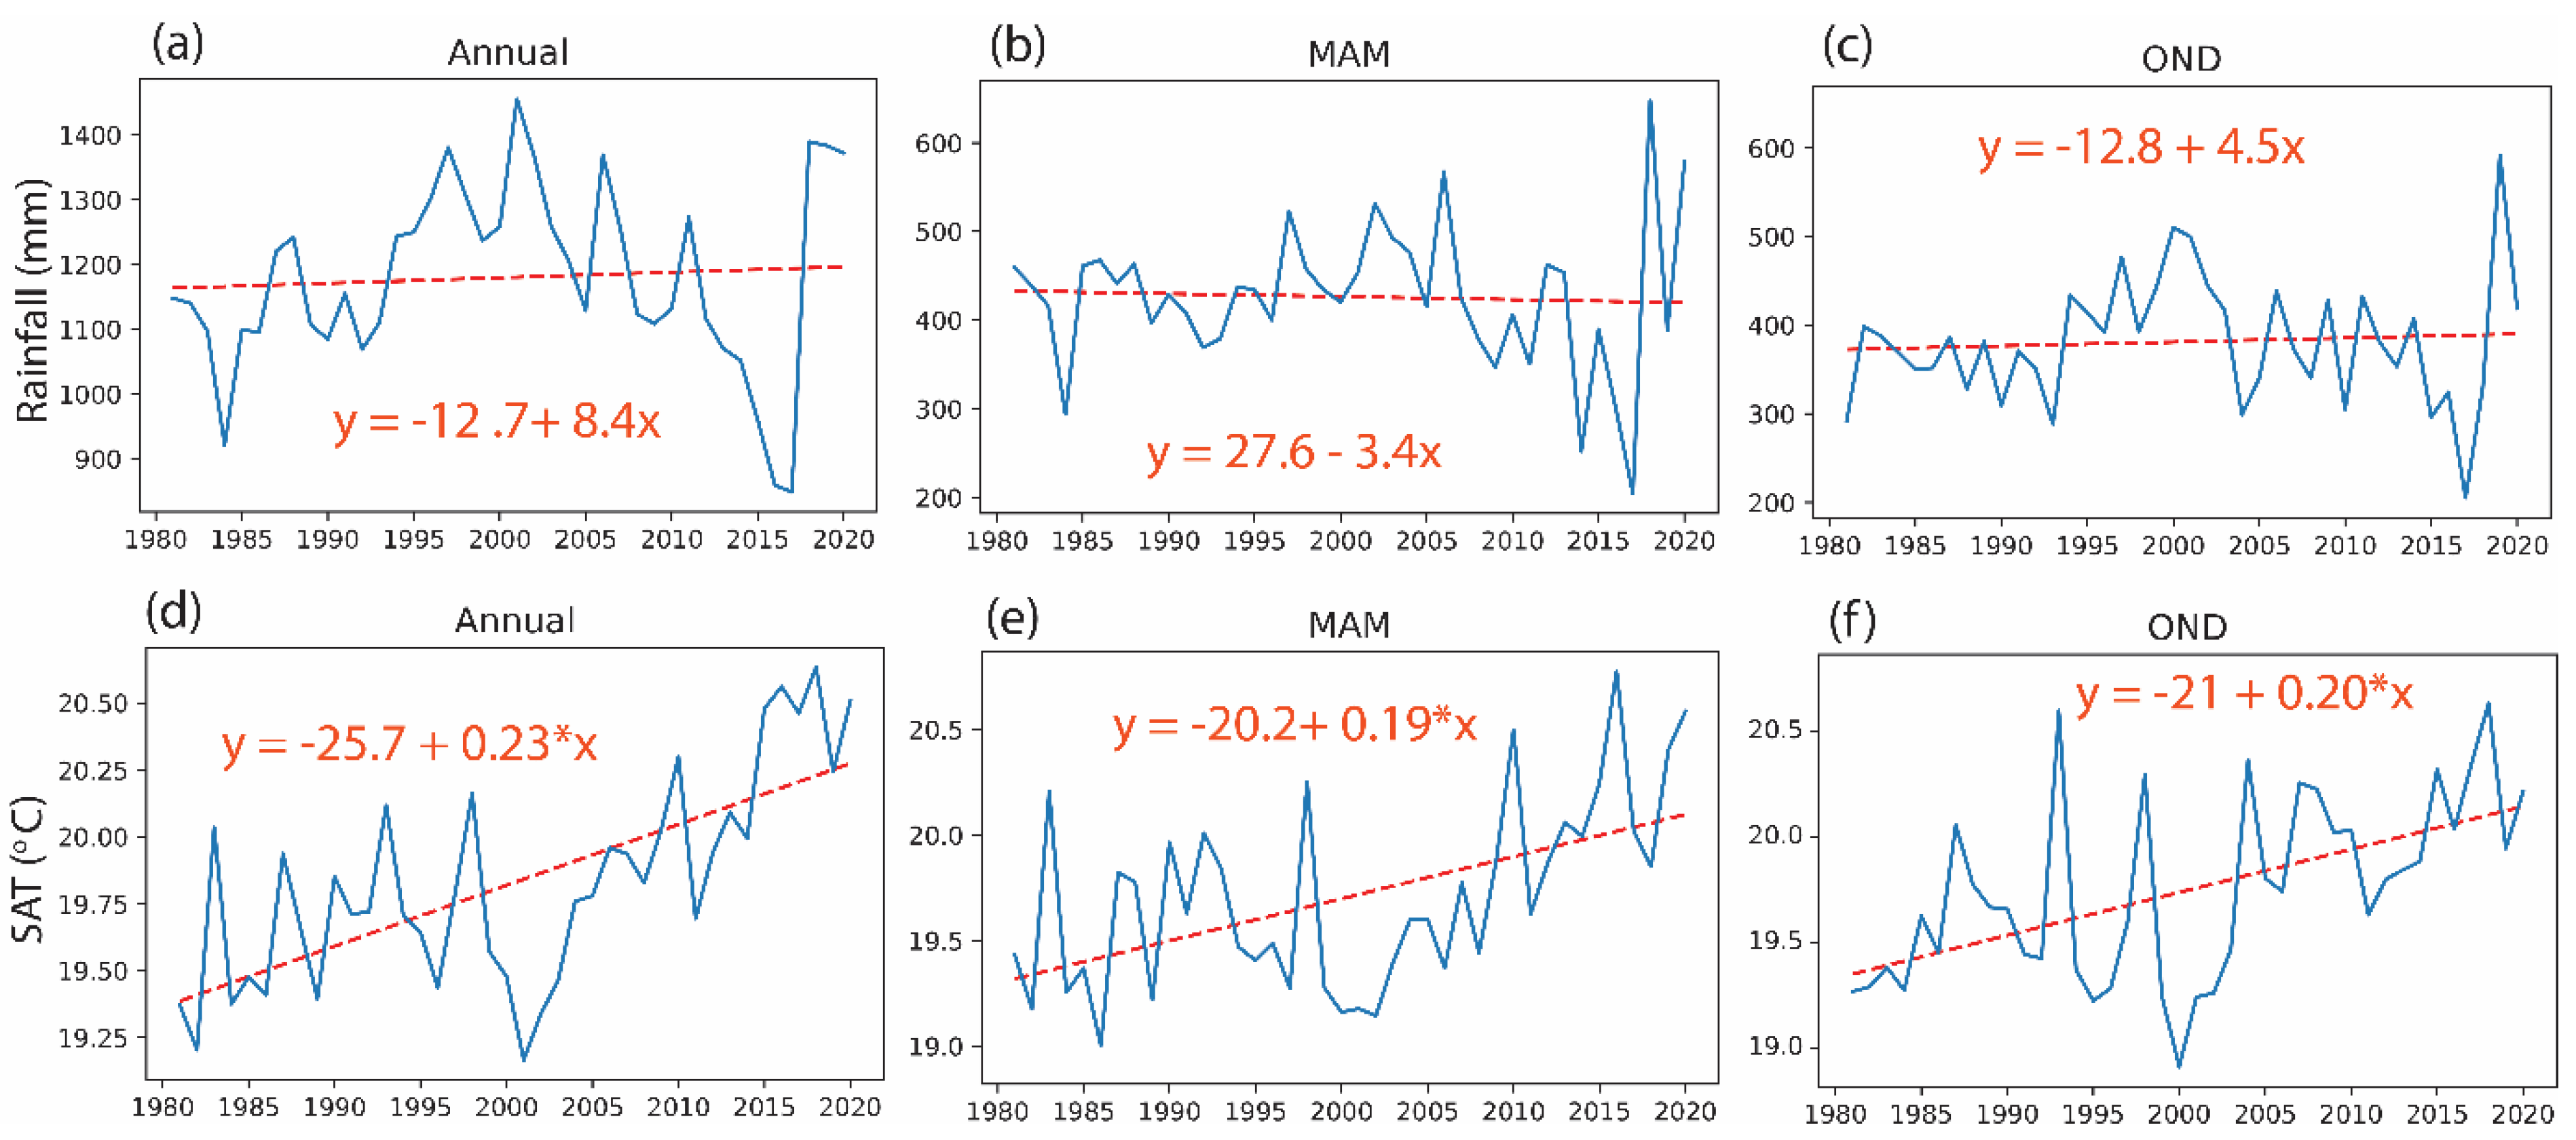
Trend analysis for seasonal and annual variations of rainfall and temperature over the study domain are presented in Figure 3 simultaneously. The trends are assessed at the decadal level to identify the possible increase/decline in the aforementioned variables. The results indicate much variability in rainfall and temperature from 1981 to 2020 but with an exceptional decrease of rainfall from 2010 to 2017 in both seasons and on the annual time scale. The rainfall exhibited an increasing trend of ~8.4 mm/decade at the annual time scale, while an increase (decrease) of ~4.5 mm/decade (−3.4 mm/decade) was observed during OND and MAM seasons respectively. However, the observed increases and decreases were not significant at the 95% confidence level. Contrarily, the SAT experienced a significant increasing trend in both seasons and annual time scales. From 1981 to 2020, the annual SAT has increased by ~0.23 °C per decade, while MAM and OND SAT increased by ~0.19 and 0.2 °C per decade, respectively. The last decade (2010–2020) witnessed a sharp increase in SAT over Rwanda.
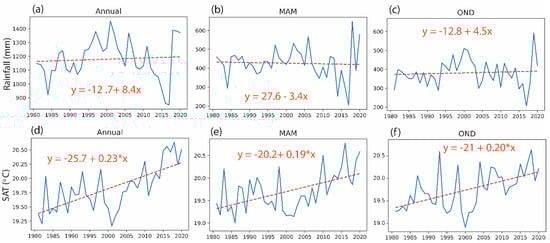
Figure 3.
Linear trends of rainfall (a–c) and air temperature (d–f) for both annual and two main rainy seasons (MAM and OND) over Rwanda. The trend line equation is shown in each time scale and the star symbol around the slope shows the significant trend at the 95% confidence level.
3.2. Temporal Patterns of SPEI and SPI
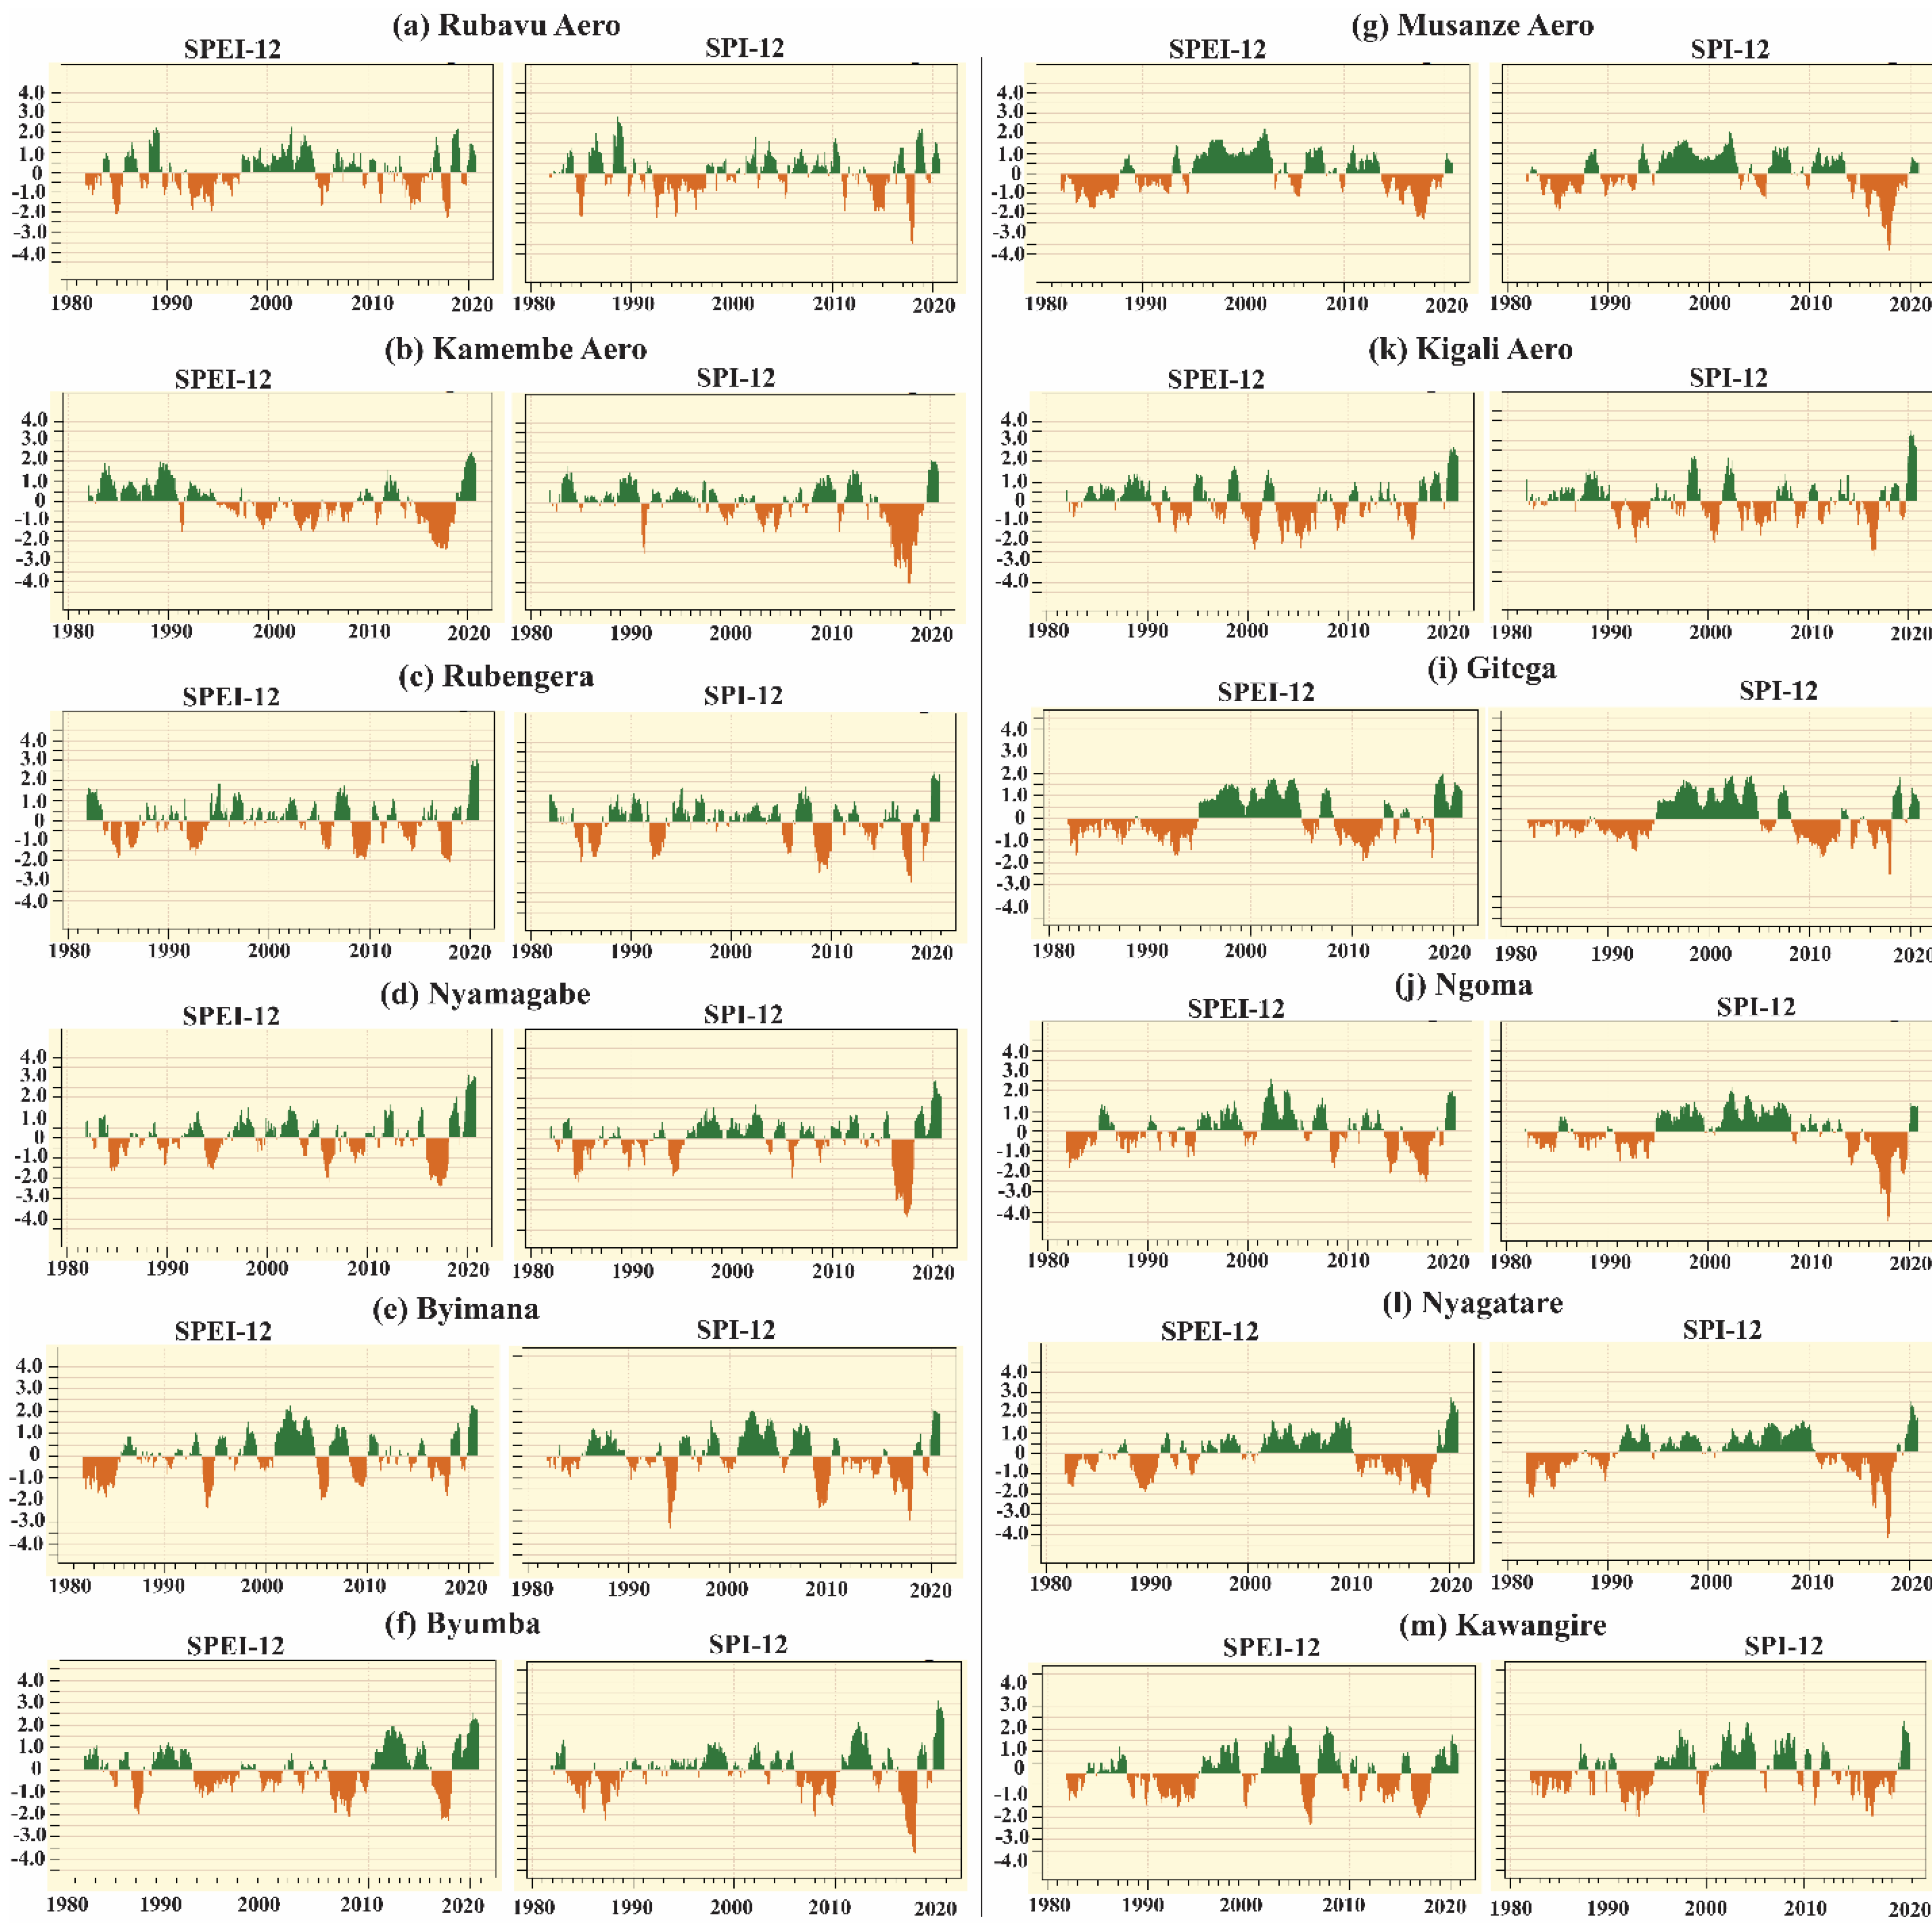
To show the temporal variations in the meteorological drought at a 12-month time scale in Rwanda, the SPEI and SPI indices were calculated and presented for individual stations in Figure 4. Overall, and for all the stations, SPI-12 and SPEI-12 indicate the same temporal variability pattern, but they differ in the magnitude and duration of the drought. The fluctuation in the drought may be due to Rwanda’s high natural climate variability, which is mostly influenced by the complex topography.
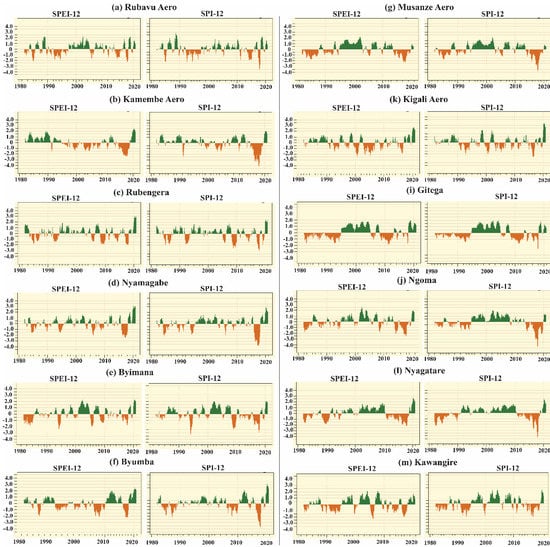
Figure 4.
The temporal variations of SPEI-12 and SPI-12 from 1981 to 2020 for the individual stations used in this study.
Generally, many locations experienced moderate to severe drought events during the 1981–1990 decade, followed by moderate to severely wet events. However, some stations like Kamembe Aero and Kigali Aero experienced moderate to severe wet events between 1981 and 1990. The years 2015, 2016, and 2017 were moderately to severely dry in many locations across the country, with some areas like Kamembe Aero, Nyamagabe, Musanze Aero, Byumba, Nyagatare, Kawangire, and Ngoma exhibiting extreme drought events in the year 2016 to 2017. As shown in Figure 4, there was a sharp reduction in the rainfall and increased surface air temperature in those years, which led to the observed extreme dry events. In addition, the wettest period of 1997/1998 caused by strong El Nino was revealed in 12-month SPEI and SPI, which demonstrates the ability of the SPEI-12 index to capture the mechanisms associated with dry and wet conditions.
We, furthermore, assessed the correlation between SPI and SPEI at 3- and 12-month time scales. The correlation results are depicted in Table S1 (see in Supplementary Materials). It was revealed that both indices are statistically positively correlated, with the lowest correlation of ~0.74 for the 12-month index at Bugarama and the highest of ~0.96 at Gitega and Musanze Aero stations. The correlation at the 3-month time scale ranges between 0.75 (Bugarama) to 0.96 at Musanze Aero, Rubavu Aero, and Nyamagabe. The correlation is higher in most locations at a shorter time scale (3 months) than 12 months. In tropical regions with less interannual variability in temperature than rainfall, the findings imply that SPEI and SPI will mostly respond more to the fluctuations in rainfall, suggesting that rainfall is the main driver of water availability.
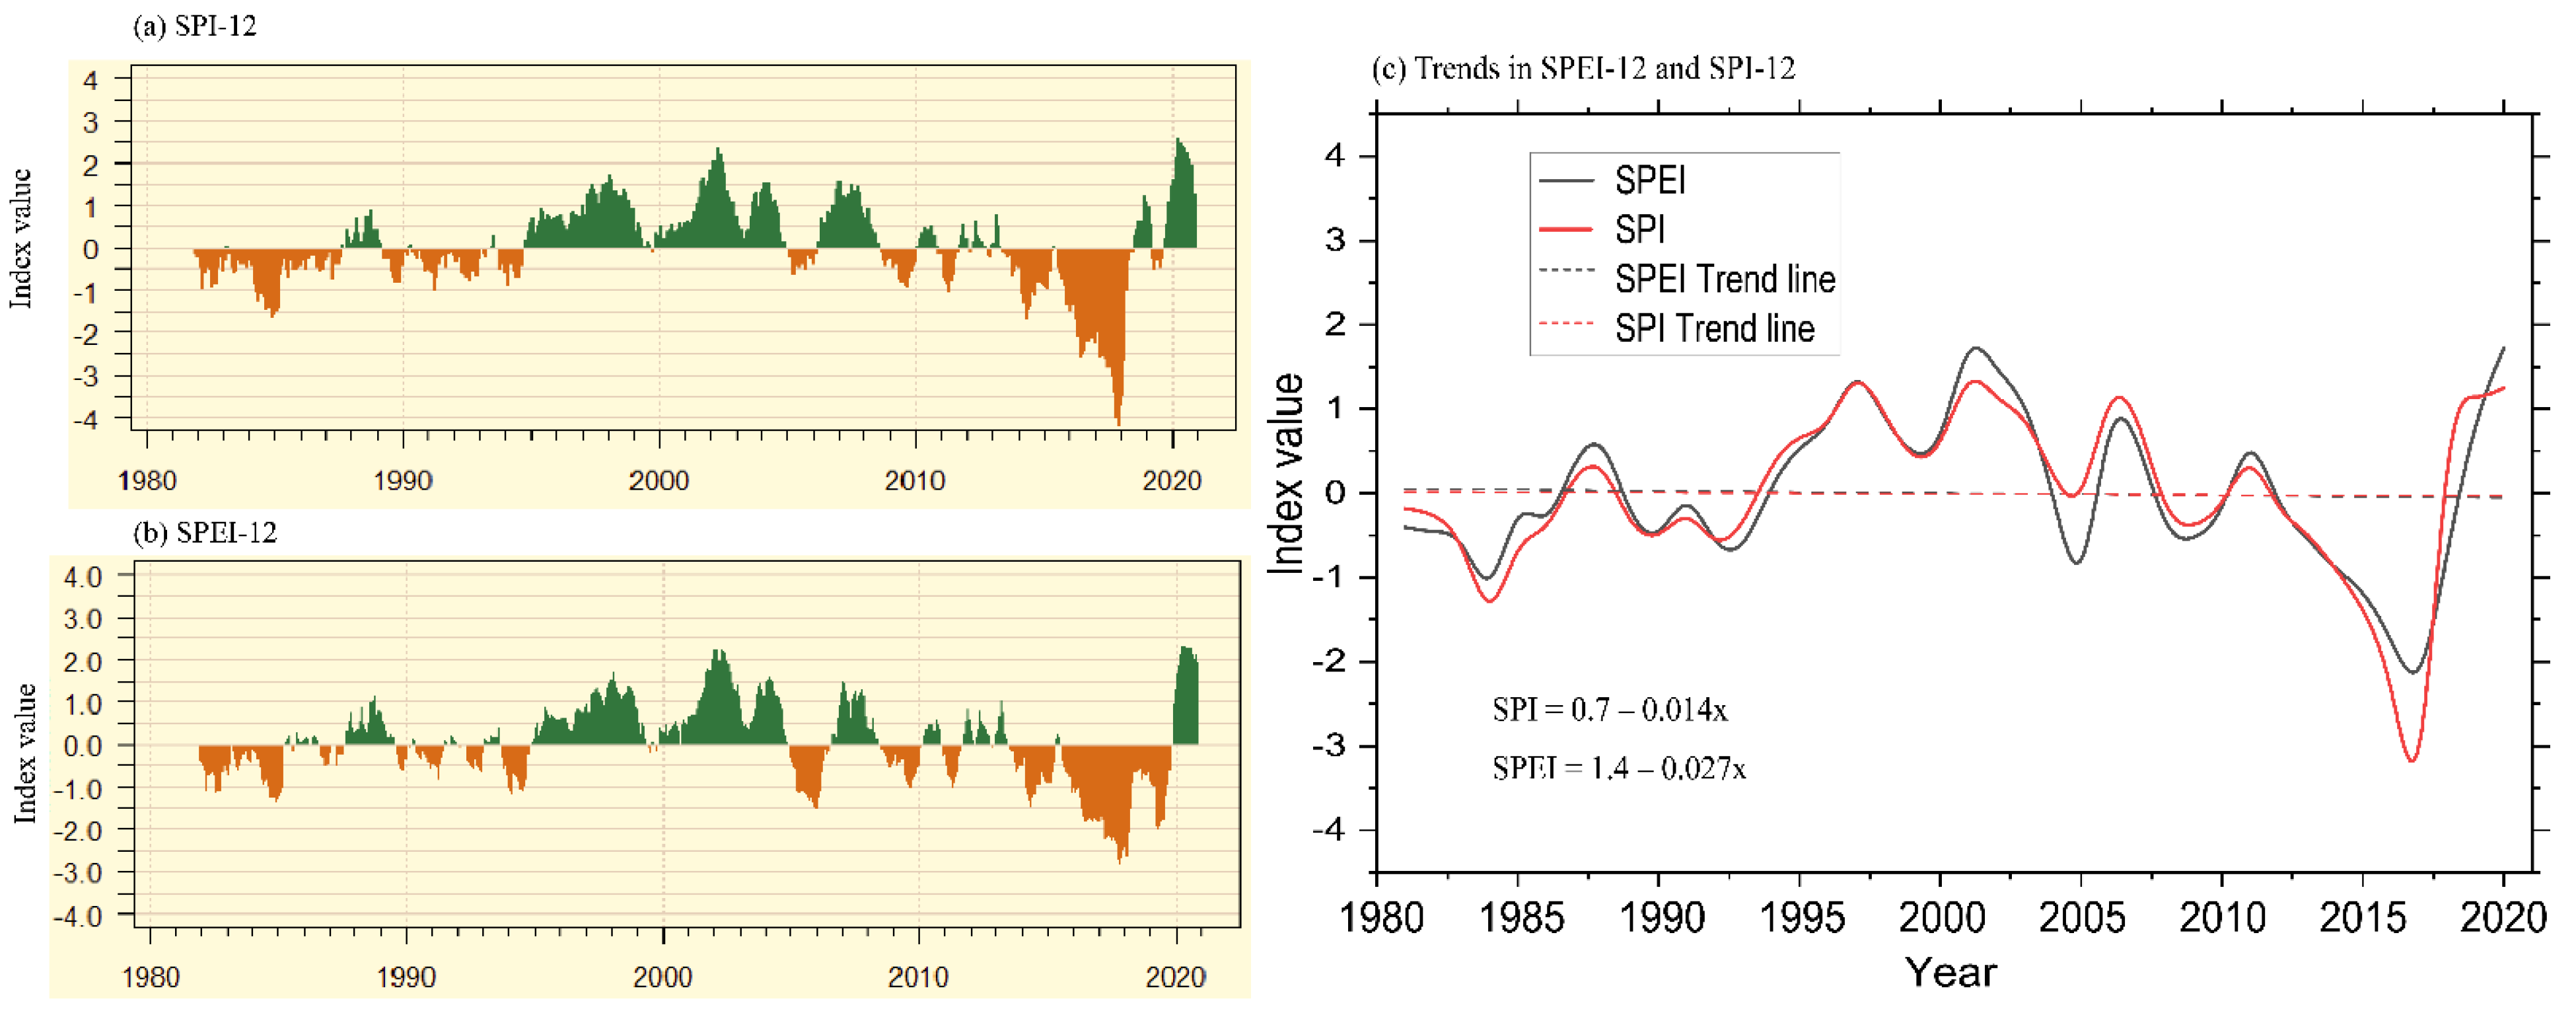
Furthermore, the present study compares the temporal variations of SPI and SPEI at a 12-month time scale over Rwanda. We aggregated the SPI and SPEI values at the country level by averaging individual indices values for all stations considered in this study. Compared to the SPEI, the SPI overestimated dry events, especially from 2015 to 2019 (Figure 5a). However, SPEI also indicates an overestimation of dry events in 2005. This shows that a deeper study is needed to investigate the performance of these two metrics in estimating meteorological drought and their possible link with atmospheric circulations over Rwanda. Overall, except for some overestimation or underestimation of drought magnitude and duration, both metrics show similar patterns in estimating 12-month drought events over Rwanda (Figure 5a,b). The trend analysis revealed non-significant changes in the magnitude of drought across the country.
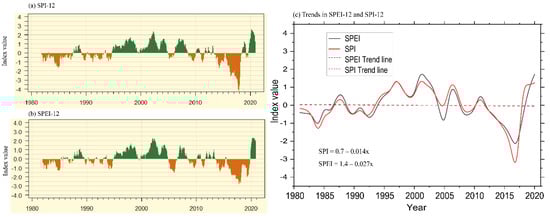
Figure 5.
Temporal variation of SPI-12 (a), SPEI-12 (b), and their trends (c) averaged over Rwanda from 1981 to 2020.
3.3. Seasonal Trends of Meteorological Drought Events
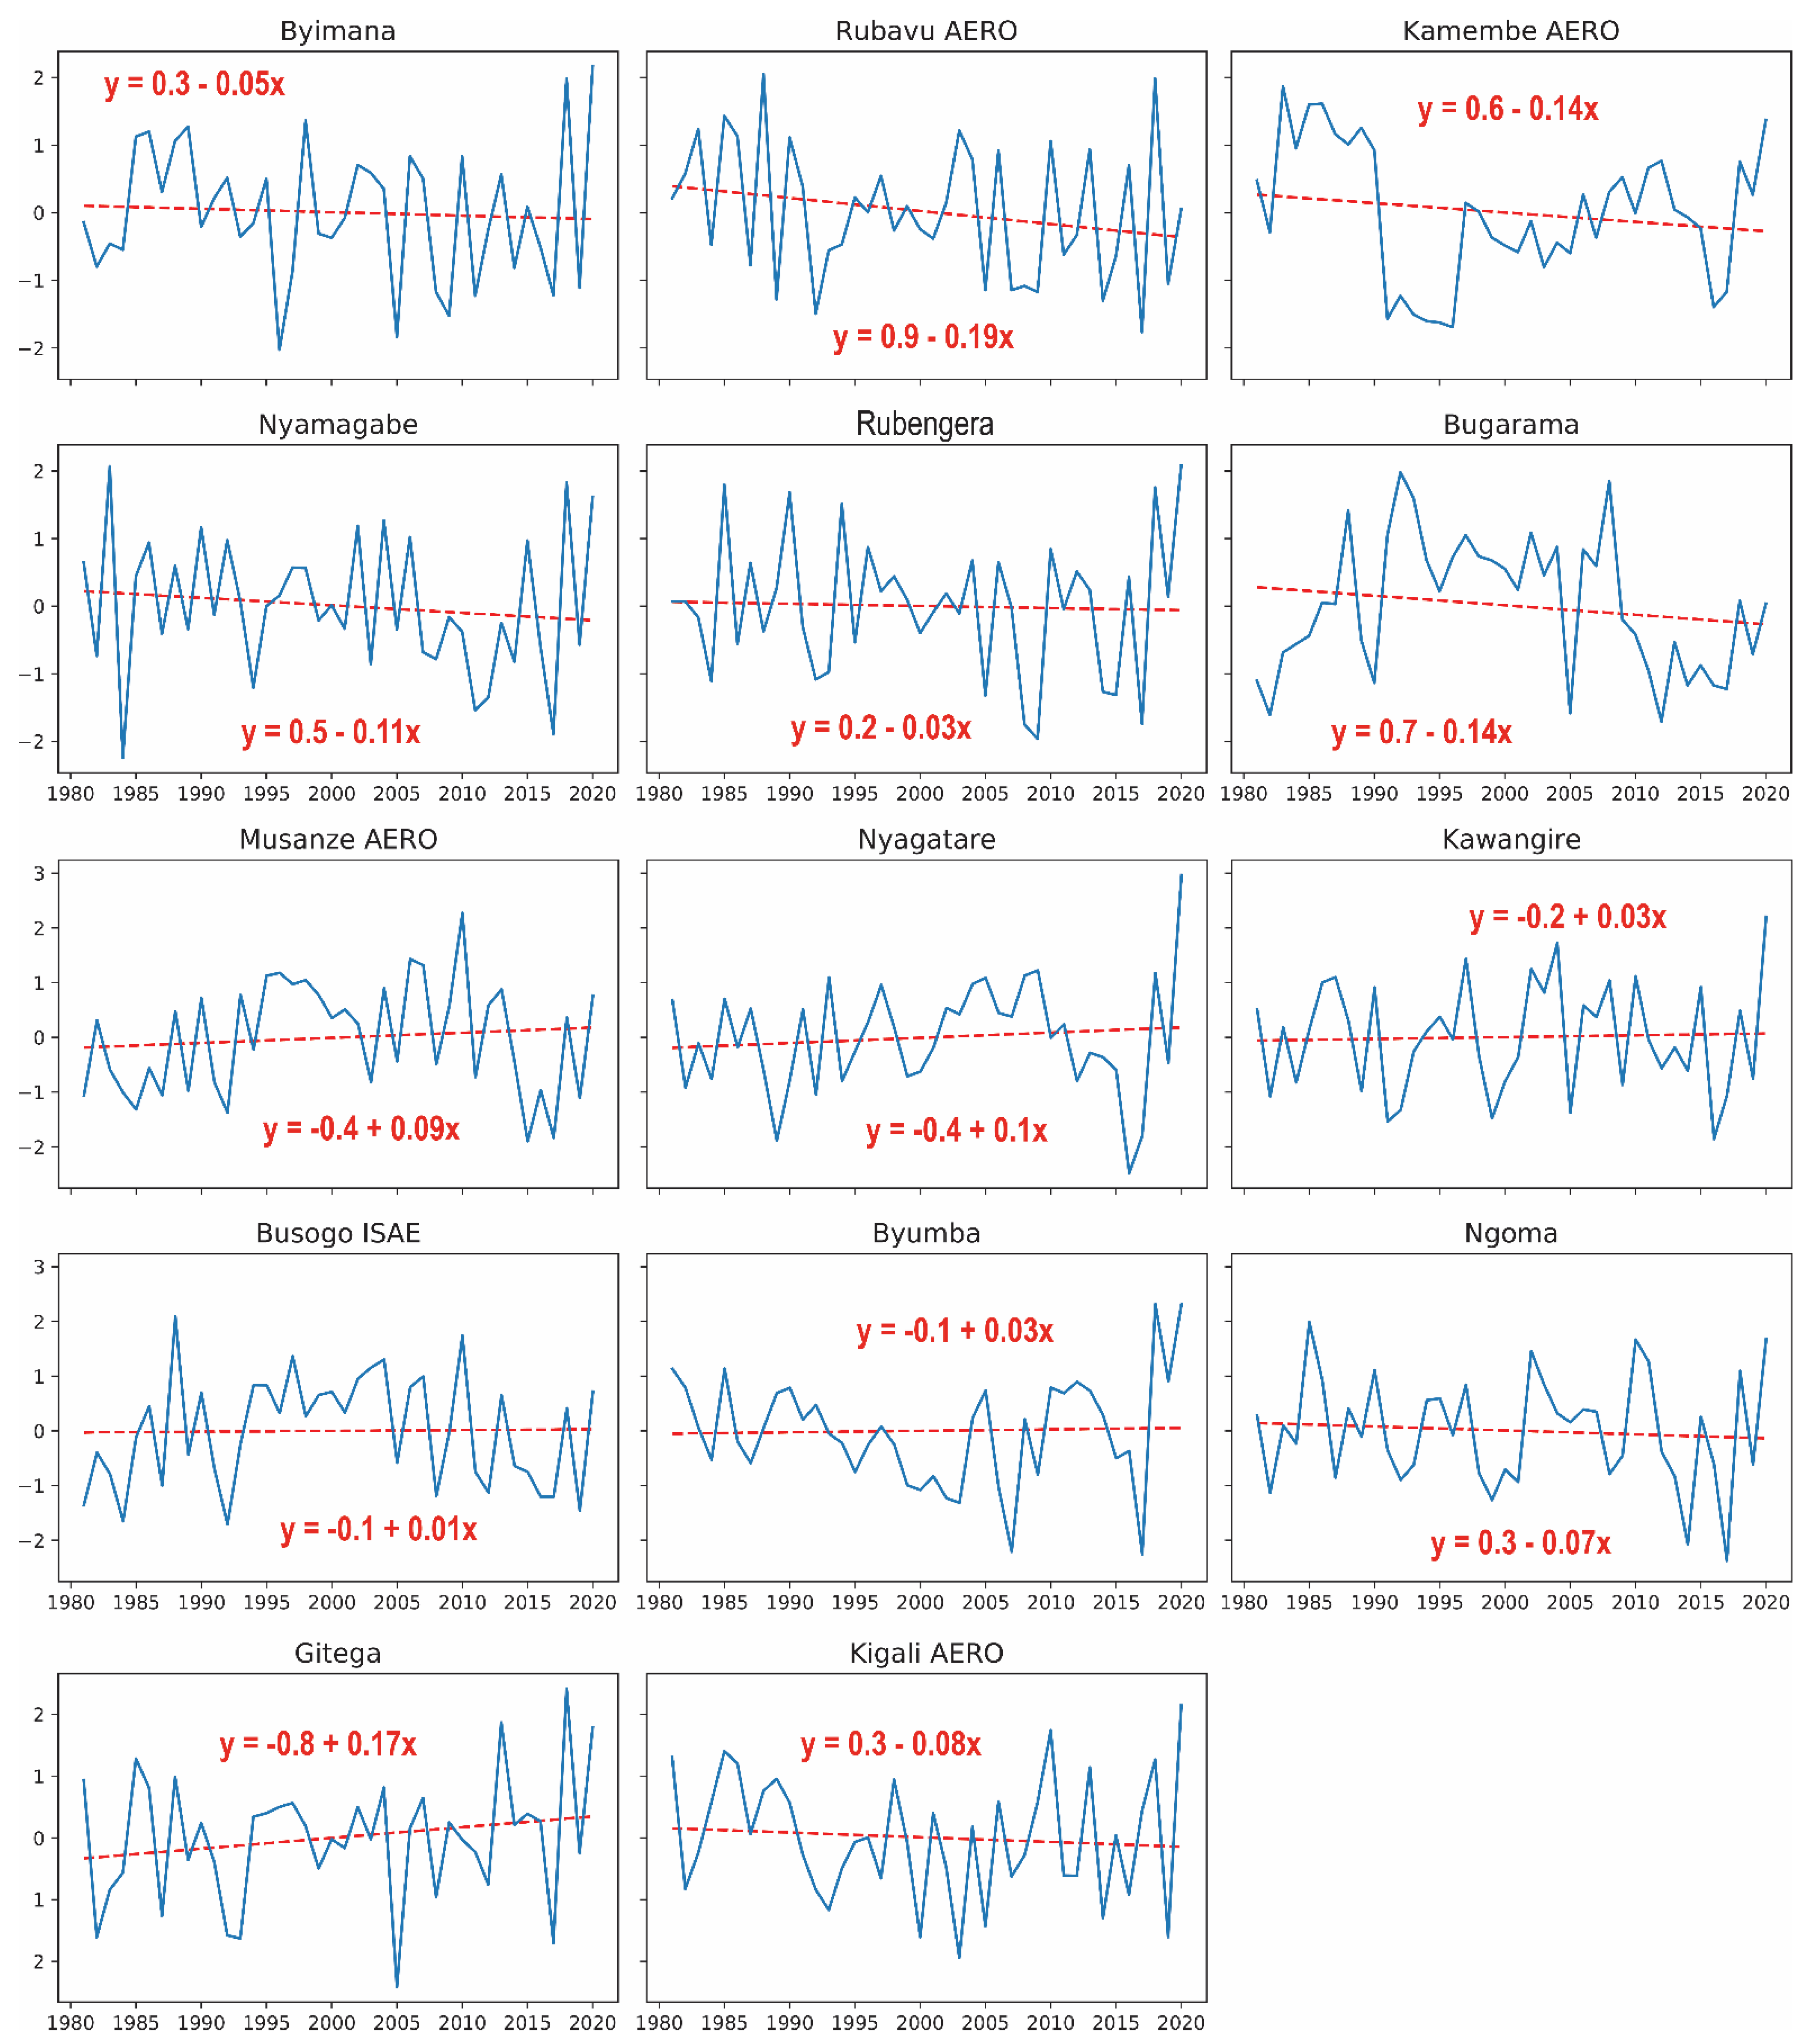
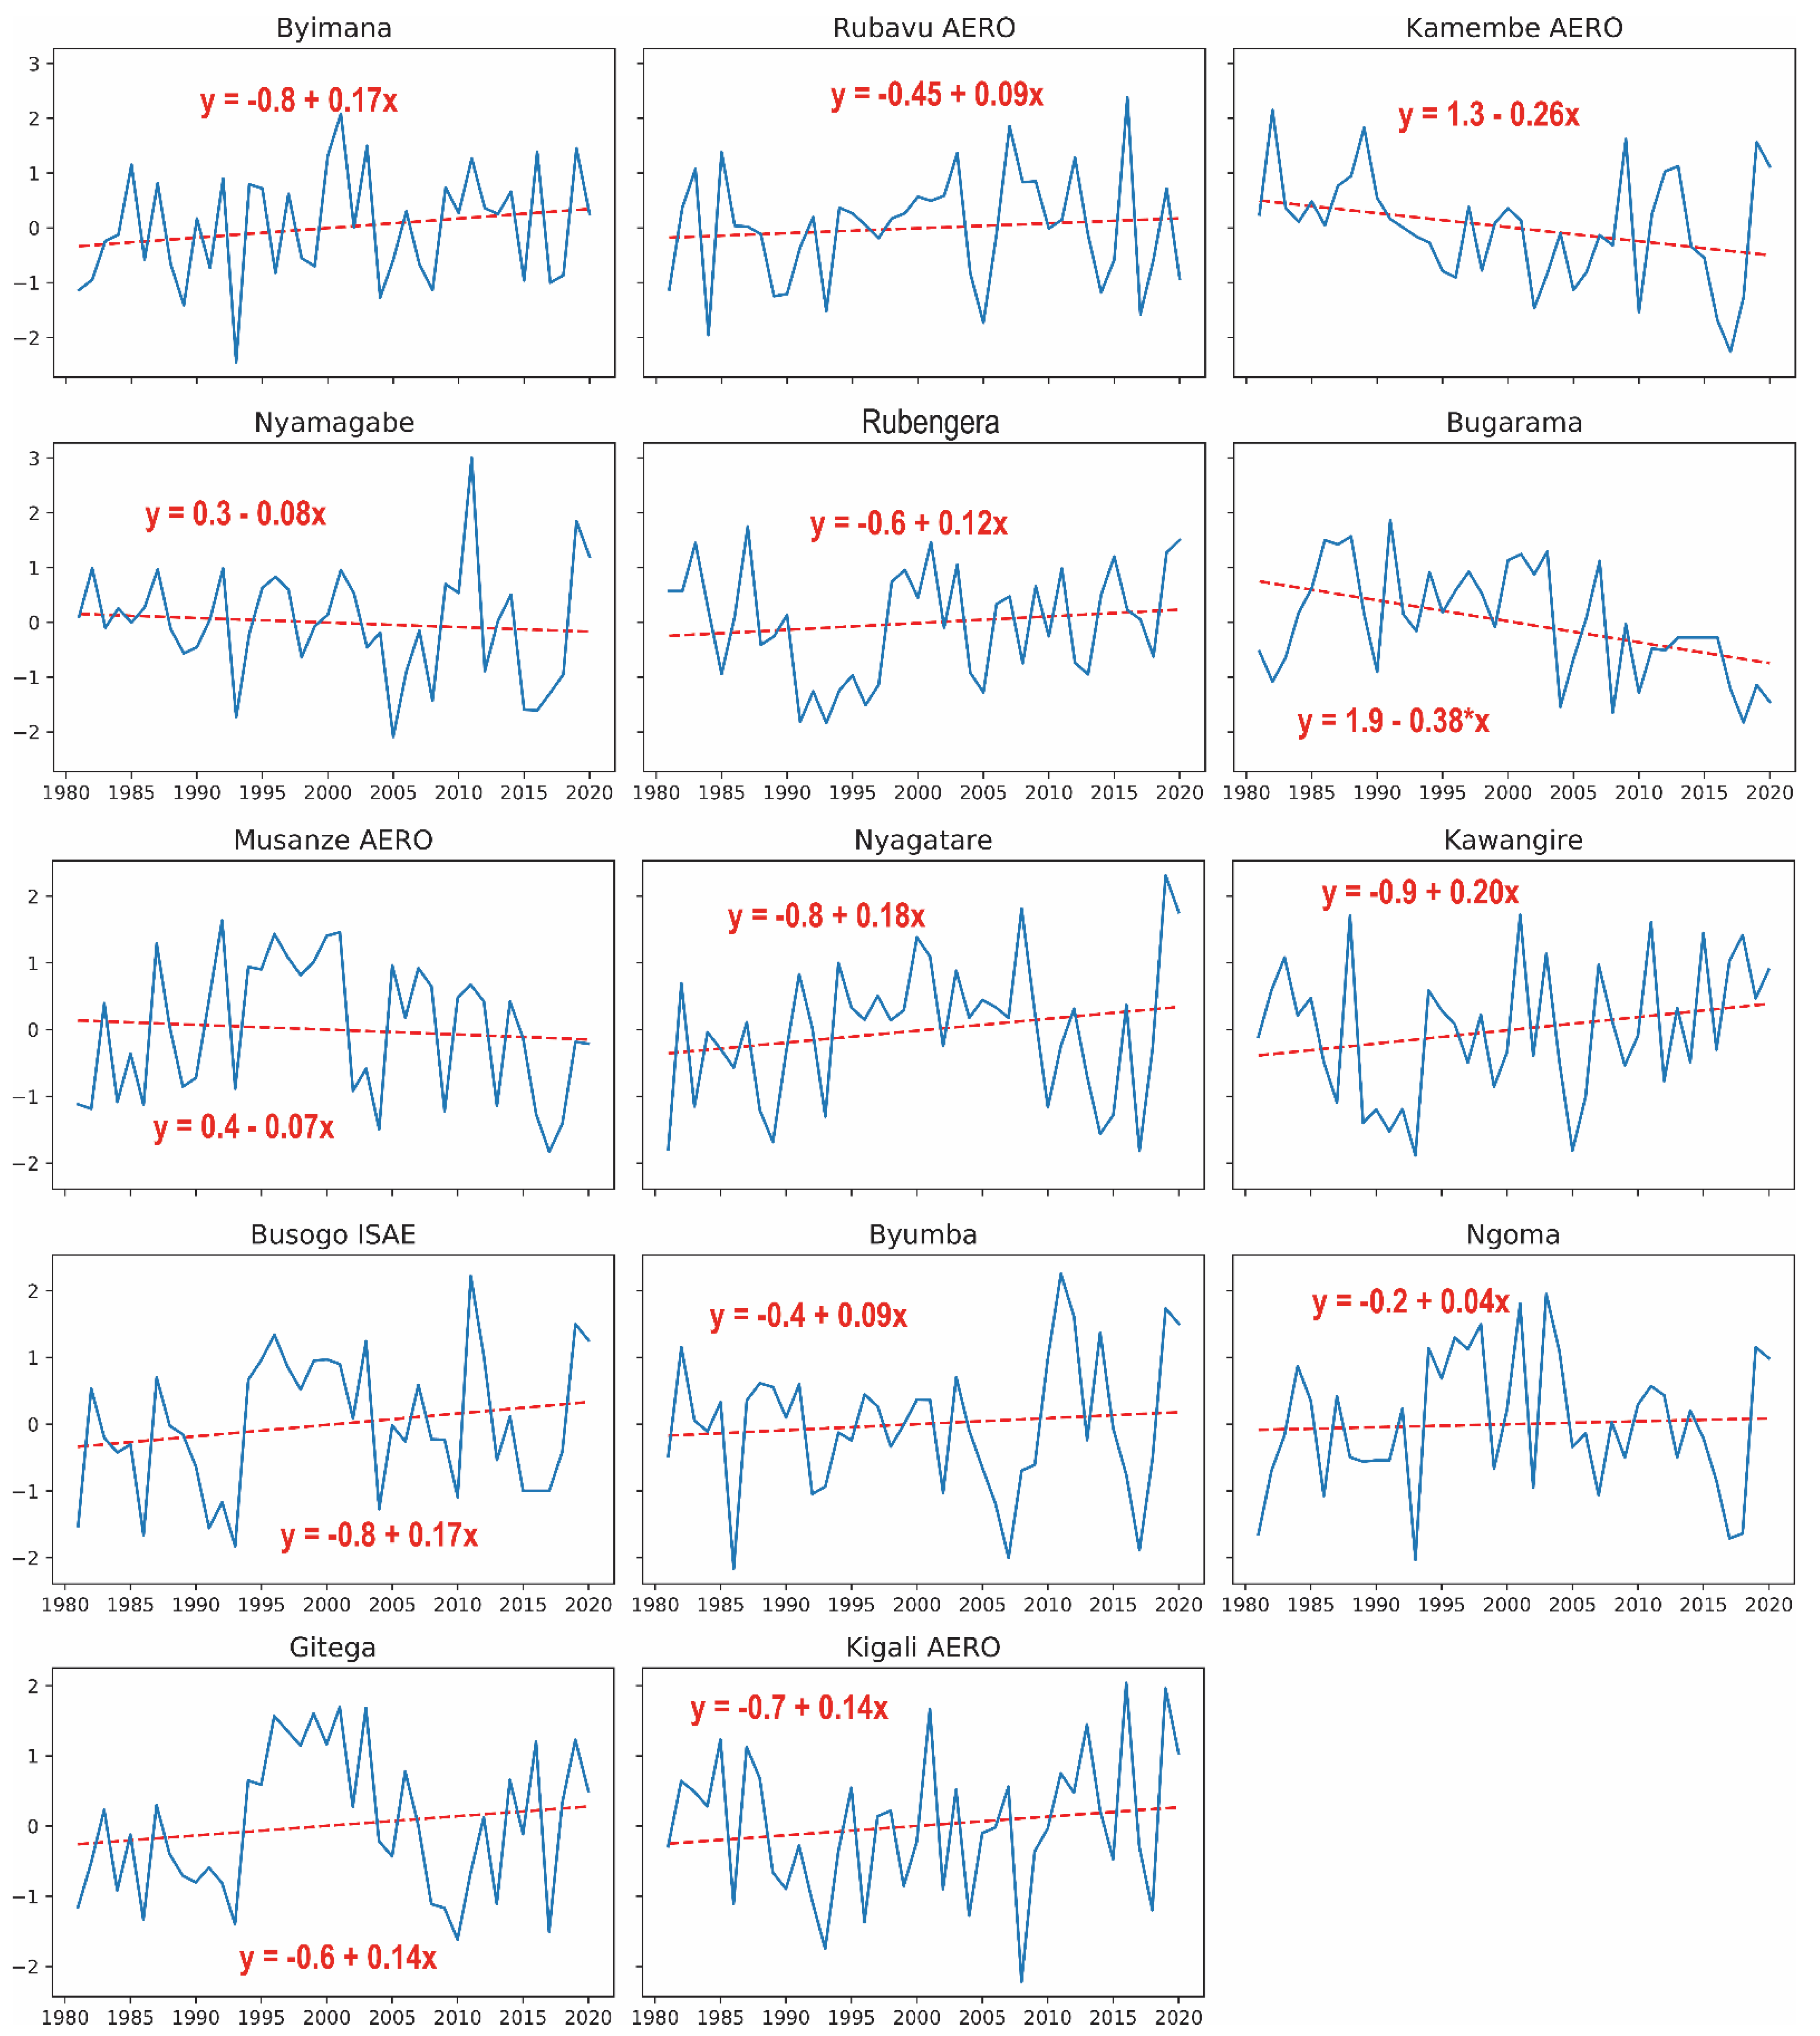
Rwanda is a landlocked country that mostly relies on rain-fed agriculture. The March to May and October to December seasons are the two main rainy seasons and are generally referred to as agricultural seasons A and B. Therefore, it is vital to assess the historical changes in drought events (wet and dry) in these two crucial seasons. This analysis gives us information on which season is most vulnerable to drought events. Figure 6 and Figure 7 demonstrate the linear trends of SPEI-3 from distinct stations used in the present research during MAM and OND seasons, respectively. It was found that seasonal drought intensity behaved differently under these two seasons whereby eight out of fourteen stations indicated a decreasing trend toward the moderate to severe drought during MAM, while only four stations showed negative trends during the OND season (Figure 7). This result agrees with the findings in Figure 3, which shows a decline in MAM rainfall. The highest decrease in intensity of SPEI was −0.19/decade in MAM obtained at Rubavu Aero and −0.38/decade in OND at Bugarama. Contrarily to SPEI-3 during the MAM season, the OND SPEI-3 shows a tendency towards wet events. Although increasing (decreasing) trends were obtained at different locations, most were not significant at the 95% confidence level, except in Bugarama during OND.
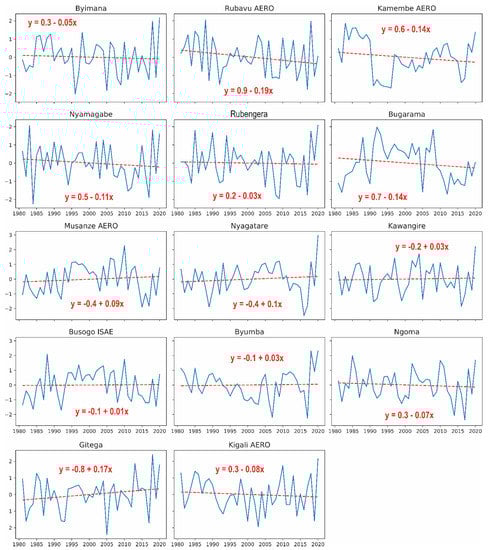
Figure 6.
Linear decadal trends of MAM dry and wet events for SPEI-3 over fourteen different stations, as presented in Figure 1. The trend line equation is shown in each time scale and the star symbol along the slope shows trend that is significant at a 95% confidence level.
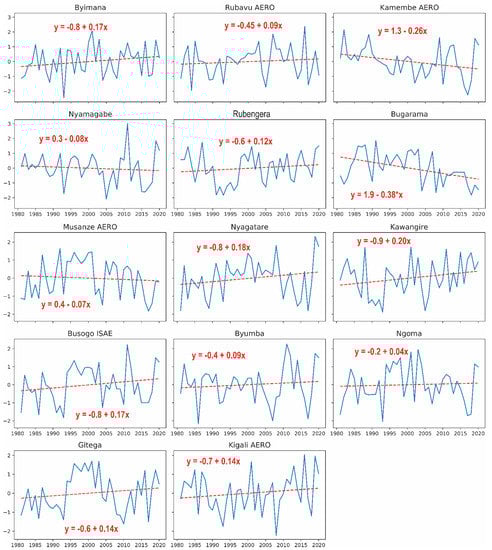
Figure 7.
The same as Figure 5 but for the OND season.
3.4. Annual and Seasonal Variations of Drought Characteristics
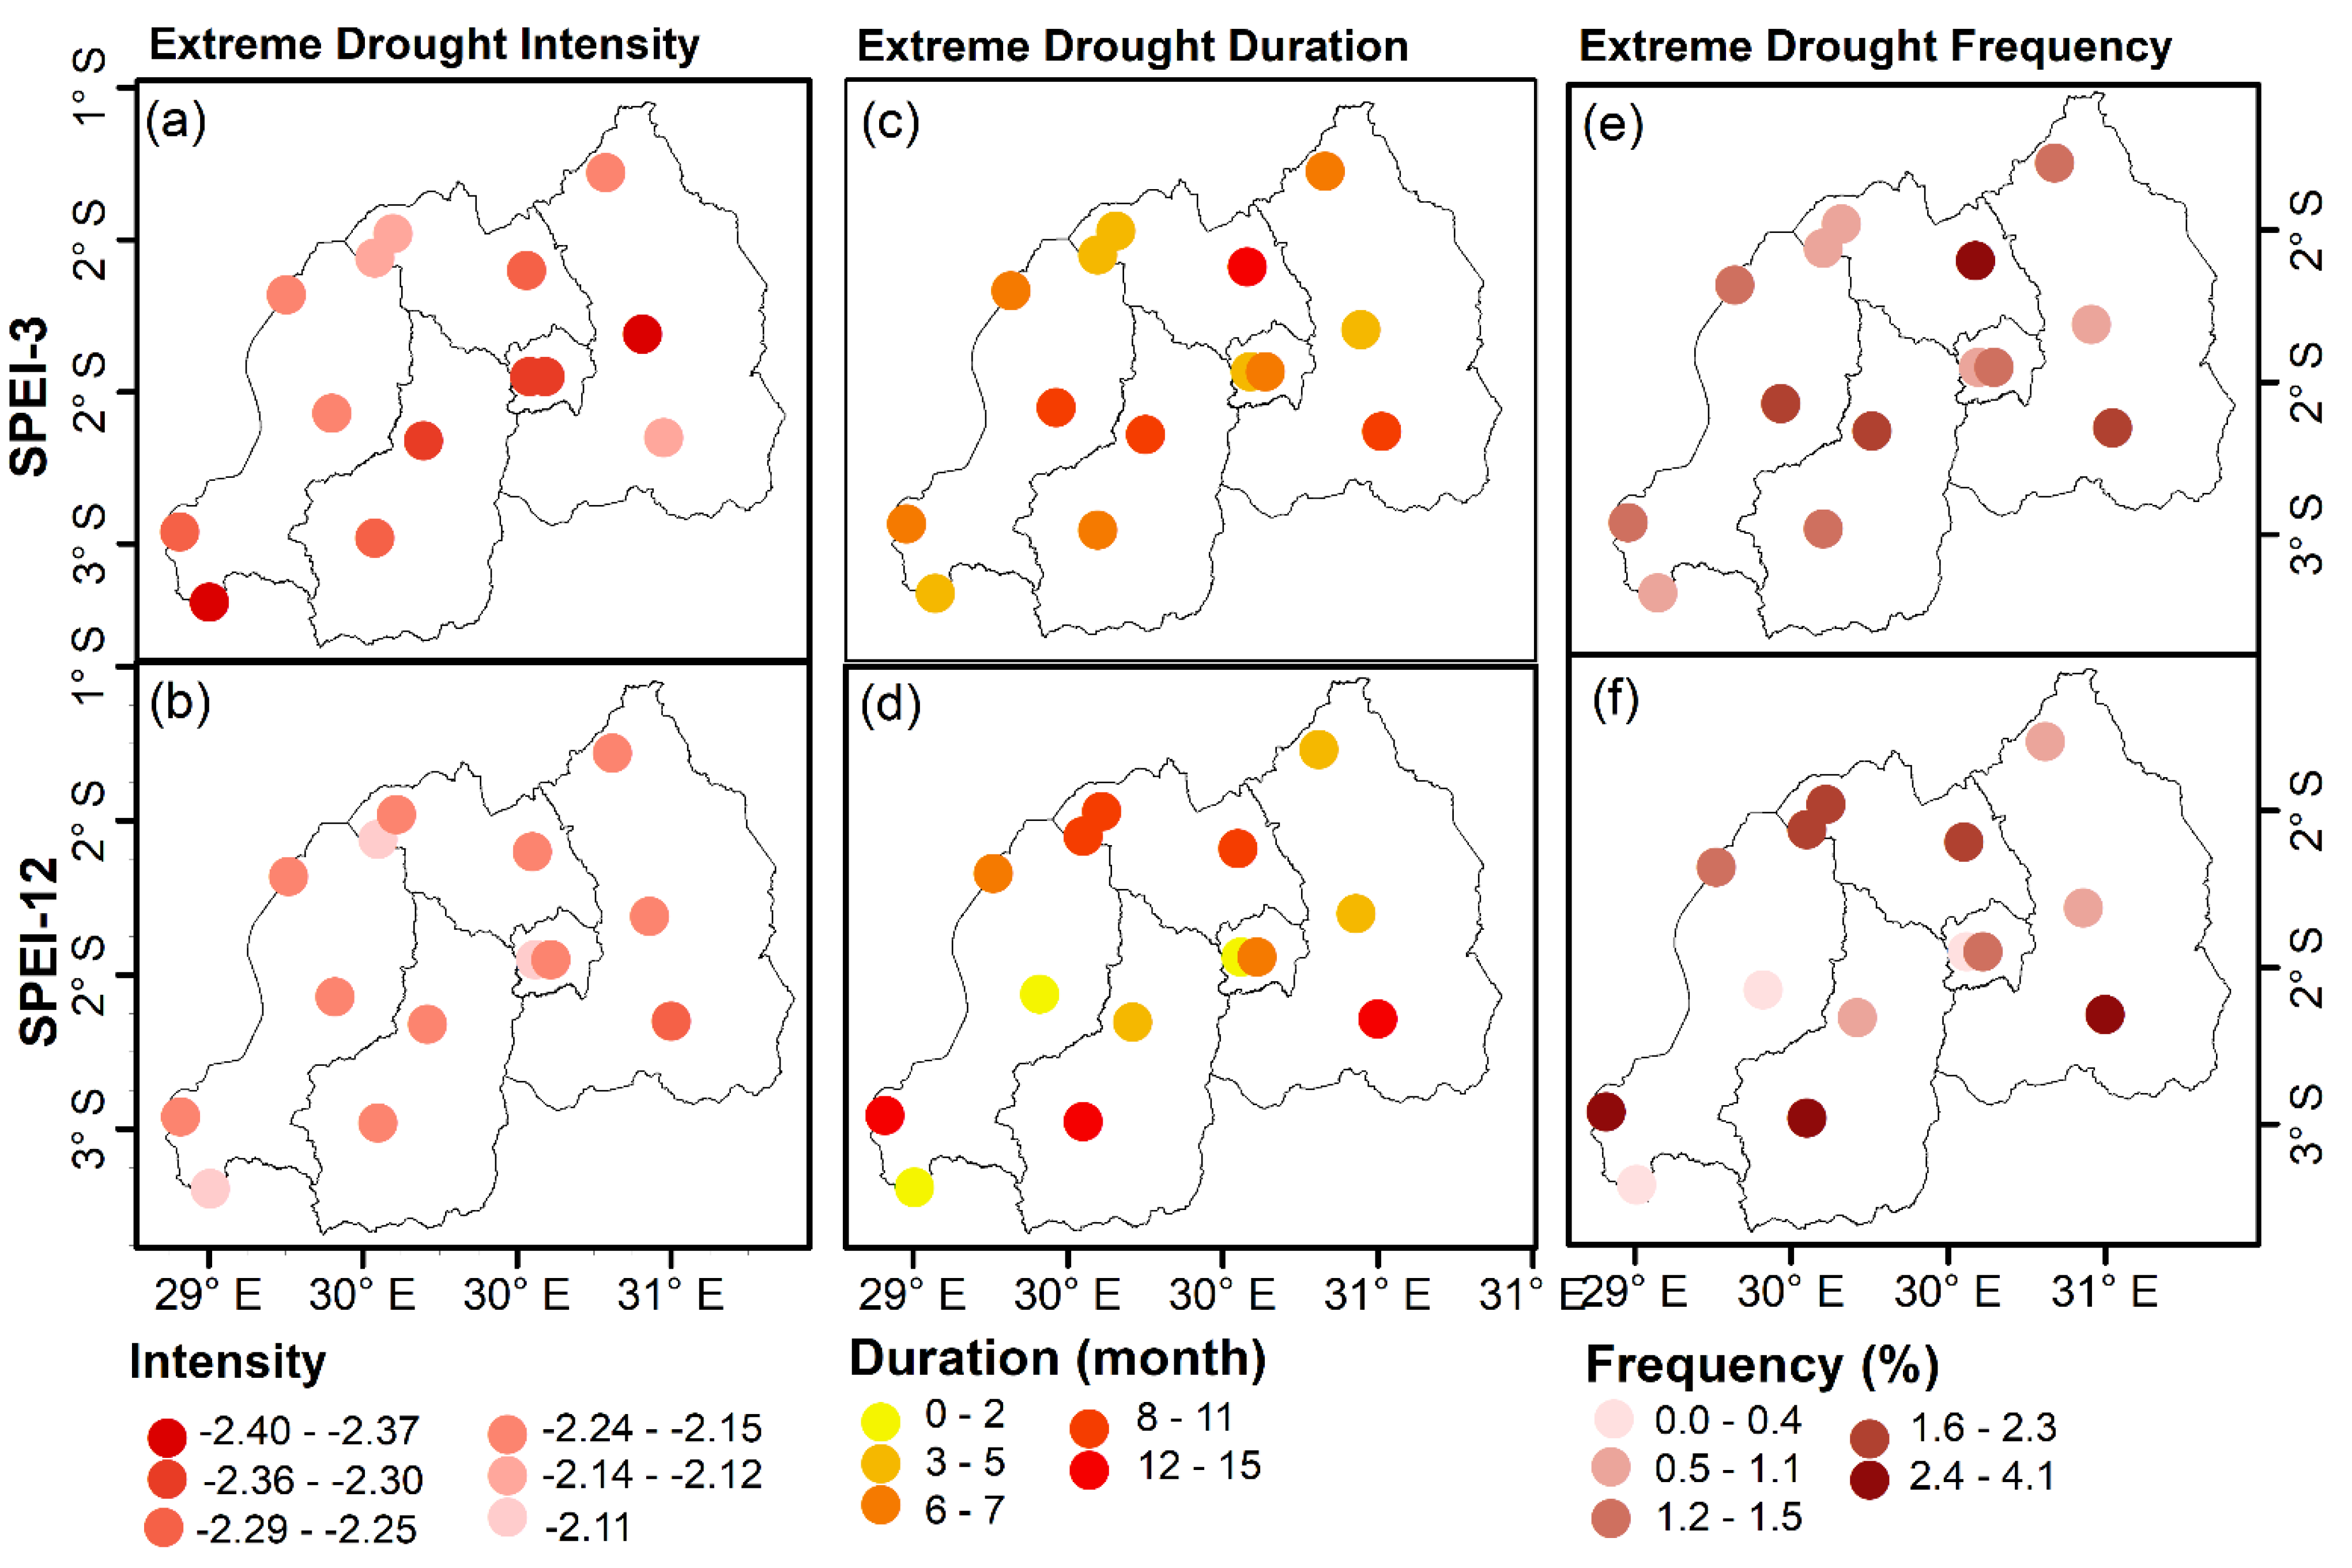
In this study, a drought event is considered only for the period in which the SPEI and SPI values are less than or equal to −1 (SPEI/SPI =< −1) for 3 and 12 months as per the definition given in [34]. In other words, the characteristics (intensity, duration, and frequency) of drought were only assessed for the extreme (SPEI/SPI =< 2), severe (−1.5 ≥ SPEI/SPI > −2.0), and moderate (−1.0 ≥ SPEI/SPI > −1.5) drought categories and the analyses are carried out at annual and seasonal time scales. The results show that the intensity of extreme drought is the highest (−2.4 to −2.37) in the stations located in the east (Kawangire) and southwestern part (Bugarama) of the country for SPEI-3 (Figure 8a). The intensity of extreme drought reduces under SPEI-12 compared to the SPEI-3 (Figure 8b) in many parts of the country. It was revealed that the intensity is low in stations located in mountainous regions of the north and western parts of the country, while eastern parts experienced extreme drought with SPEI ranging between −2.14 and −2.4.
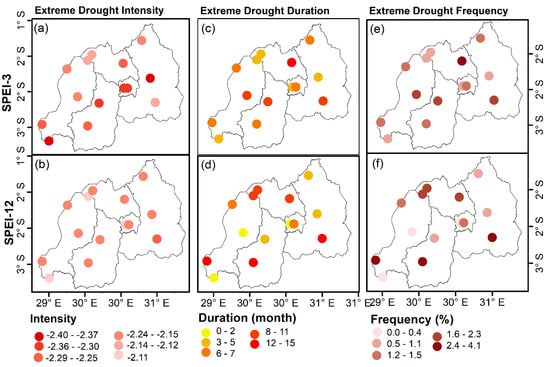
Figure 8.
Characteristics of SPEI-3 (a,c,e) and SPEI-12 (b,d,f) under the extreme drought category (SPEI = <−2) for all stations used in this study from 1981 to 2020. The characteristics considered here are intensity (a,b), duration (c,d) and frequency (e,f).
The duration of extreme drought was the highest for the 12-month SPEI relative to the 3-month SPEI (Figure 8c,d). The locations with the highest duration of extreme drought (by ~12–15 months) are situated in southern parts of the country, i.e., Ngoma in the southeast, Nyamagabe in the south, and Kamembe Aero in the southwest under SPEI-12 (Figure 8d). The same longest duration of extreme drought was also experienced in the northern part (Byuma). Generally, the duration of extreme drought ranges between 0 to 11 months, equivalent to 0–2.3% of the entire study period over most stations considered except the aforementioned stations that recorded the longest duration (2.4–4.1% of the total months) of drought in both longer and shorter drought indices.
The results based on SPI-12 show the highest intensity of extreme drought in most parts of the country compared to SPEI-12 (Supplementary Figure S1a). Based on SPI-12, the highest intensity of ~3.1 was revealed at Bugarama in the southwestern region of the country, while the highest based on SPEI is ~−2.25 at Ngoma in the eastern area. Generally, SPI-12 values show many variations (from −3.1 to −2.0) in the intensity of extreme drought among stations considered. Contrarily, SPEI-12 indicates less difference among stations with intensity ranging between ~−2.25 and −2.0. The intensity of extreme drought reduces under SPEI-12 compared to the SPI-12 (Figure S1a) in many parts of the country. The same patterns were revealed for the duration of extreme drought events where the SPI-12 duration is longer than that estimated using SPEI-12 across the country except at Busogo ISAE station (Figure S1d). The longest duration of 32 months accounted for 6.5% of the total drought events that occurred at Kamembe Aero in the southwestern part of the country based on SPI-12, while the longest was 19 months accounting for 4% of the total drought events at the same location based on SPEI-12 (Figure S1d,g).
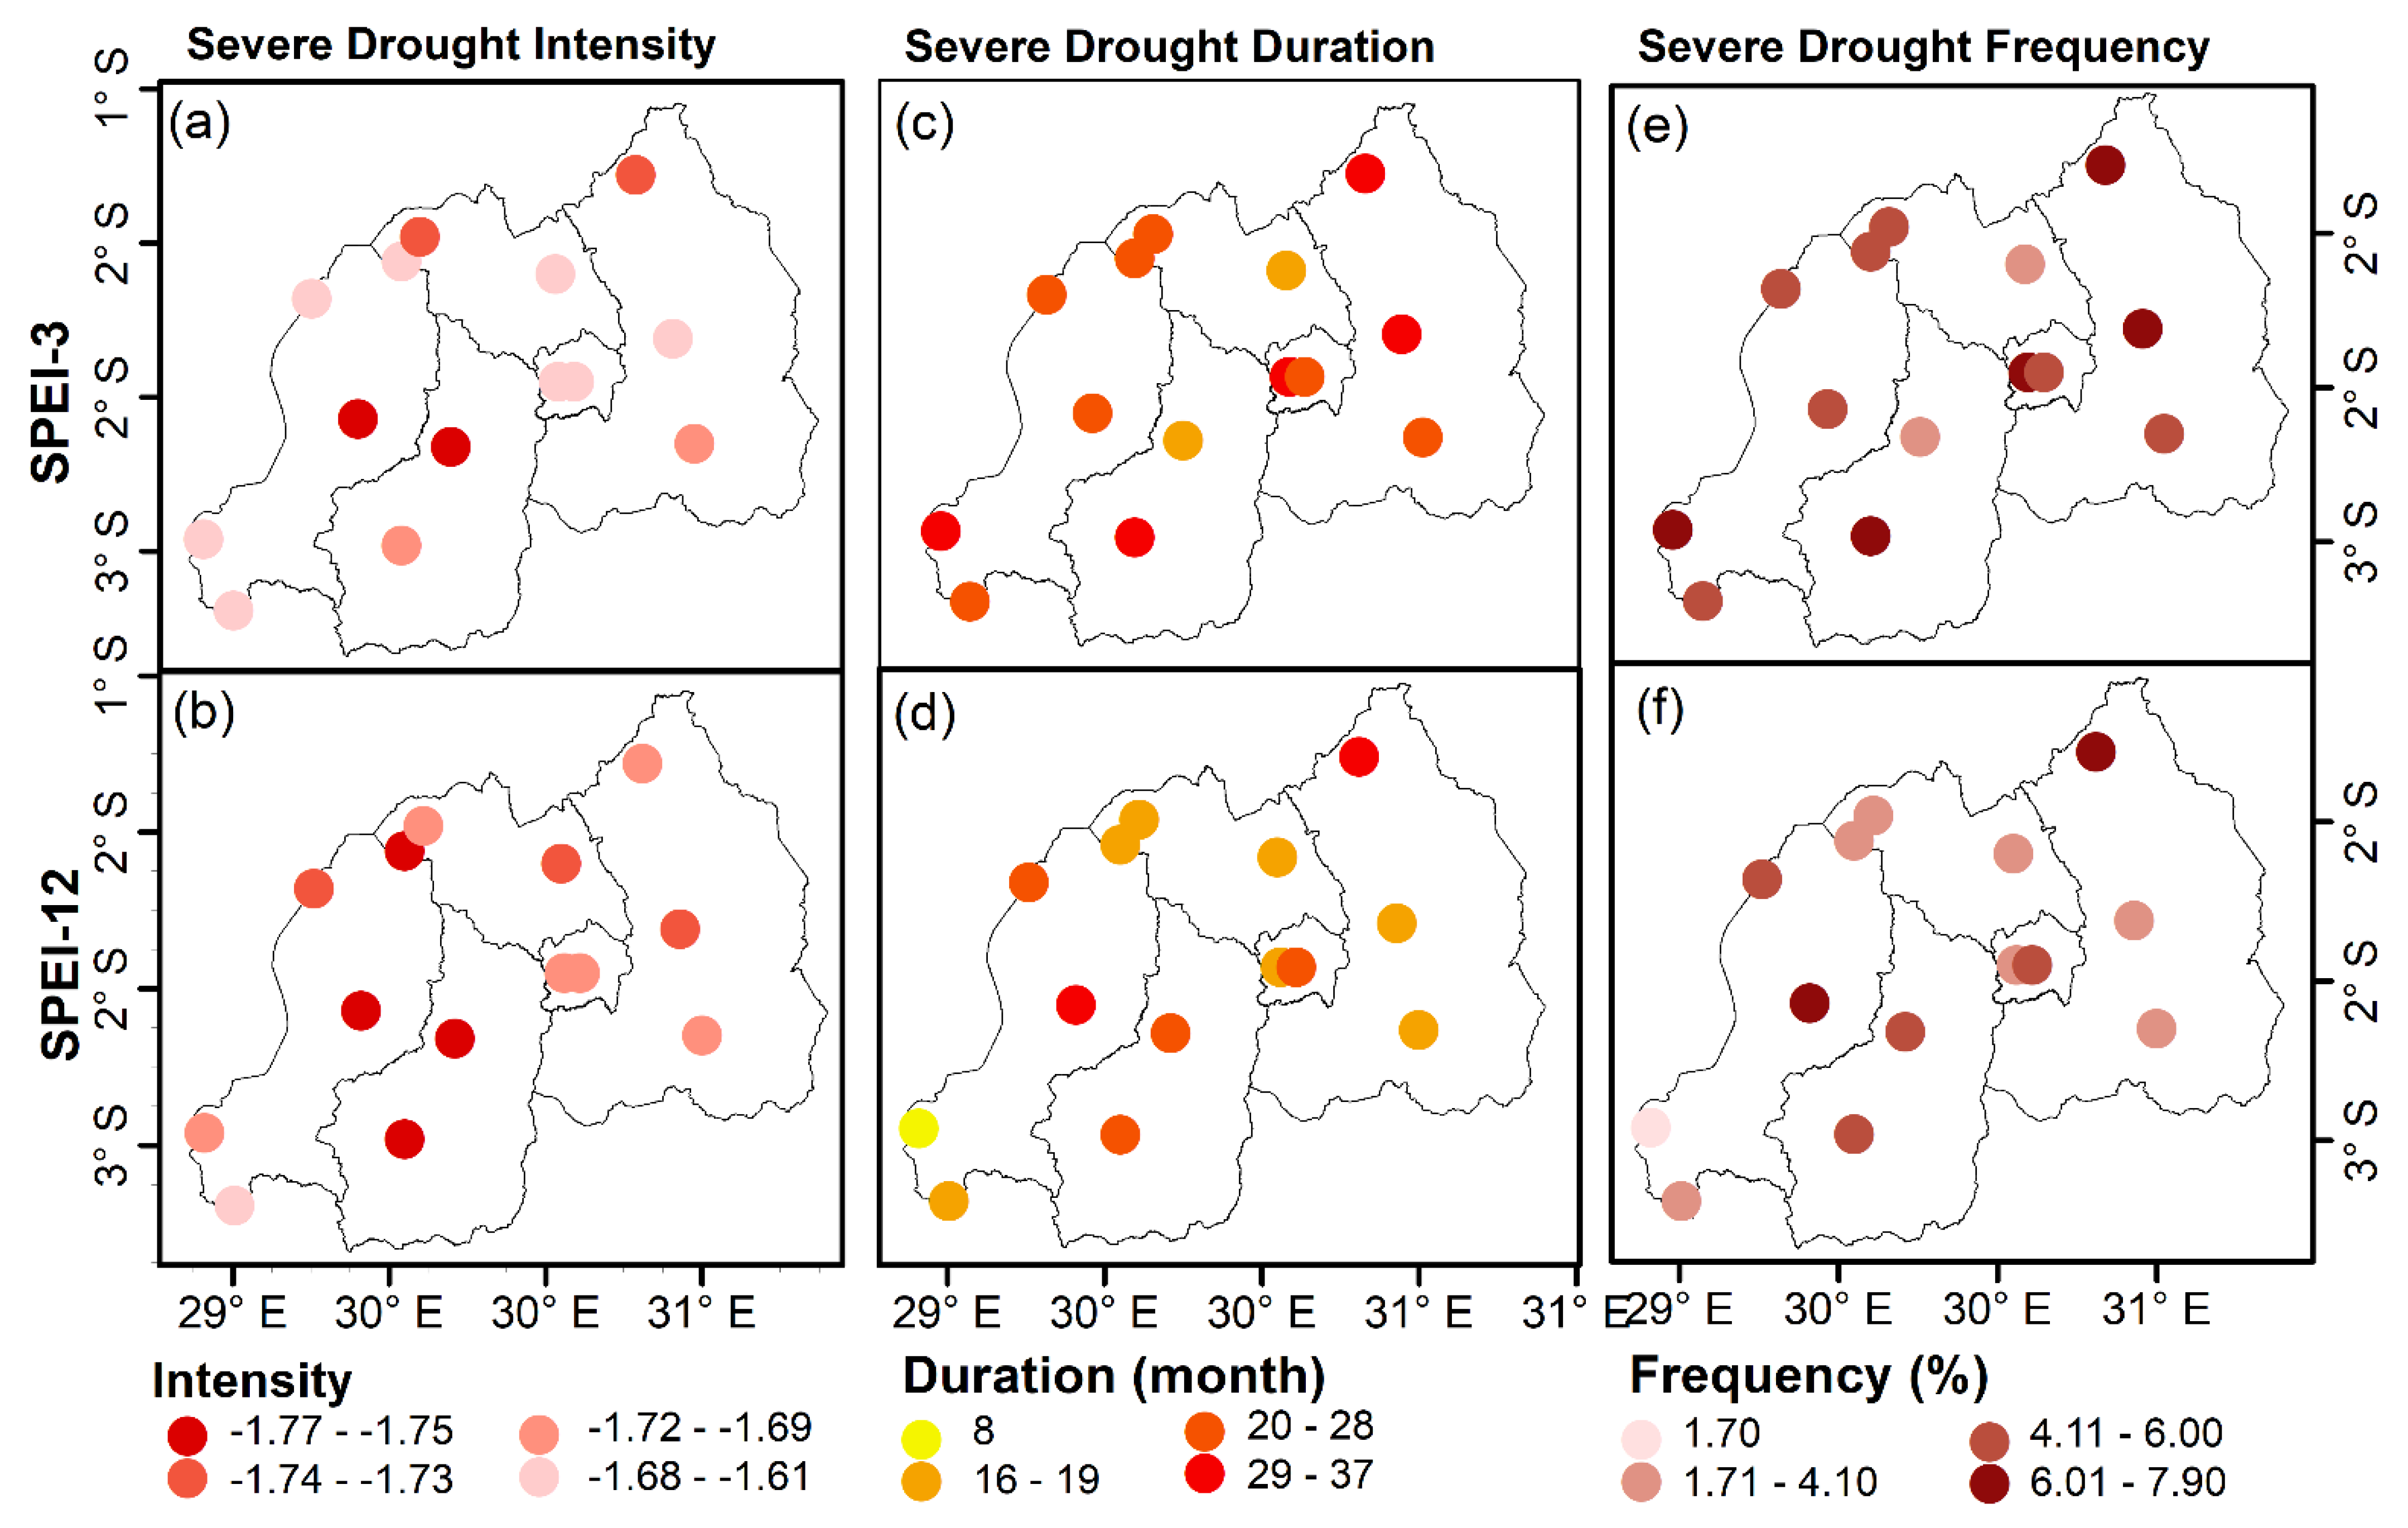
The intensity of severe drought is the highest in many locations based on SPEI-12 compared to SPEI-3 (Figure 9a,b). For SPEI-3, the intensity is high at two stations, i.e., Byimana in the south and Rubengera in the western part of the country, with the magnitude ranging from −1.77 to −1.75, followed by Nyagatare in the east and Byumba in the north of the country (Figure 9a). The rest of the sites accounting for 57.1% of the total stations, experienced an intense, severe drought with a magnitude from −1.68 to −1.73. For SPEI-12, the severe drought intensified further than in SPEI-3. For instance, the highest intensity (−1.77 to −1.75) was observed at four stations when SPEI-12 was used, while only two stations experienced an intensified severe drought based on SPEI-3. Overall, the longer time scale SPEI reveals a higher intensity of severe drought, which could severely impact water demand.
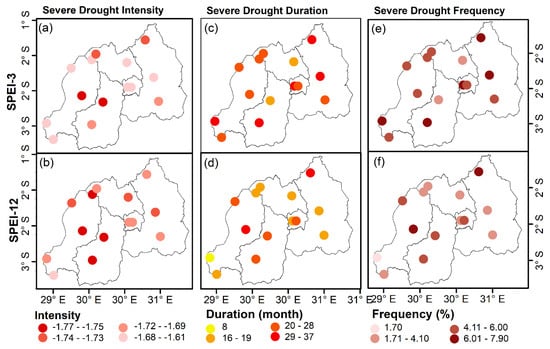
Figure 9.
The same as Figure 8 but under the severe drought category (−1.5 ≥ SPEI > −2.0). The characteristics considered here are intensity (a,b), duration (c,d) and frequency (e,f).
The duration of severe drought is longer at 3 months relative to 12 months SPEI (Figure 9c,d). It ranges between 20 to 37 months, accounting for 85.7% of the total stations under SPEI-3, while only 43% of the total stations experienced a longer duration (20–37 months) of severe drought under SPEI-12 (Figure 9c,d). In comparison to the duration of extreme drought, the country experienced more severe drought than extreme. Similarly, severe droughts occurred more frequently than extreme droughts over the last forty years. Severe droughts frequently occurred at a shorter duration than a longer time scale. For example, the severe drought occurred 6.01–7.9% of the time at five stations under SPEI-3, while two stations experienced the same percentage of occurrence under SPEI-12. The more severe drought events occurred mainly in eastern and southern stations (Figure 9e).
For the severe drought category, the SPI-12 and SPEI-12 intensities are much closer overall, the calculated intensity of severe drought using SPEI and SPI show similar patterns (Figure S1b,e,k). The duration of severe drought events based on SPEI and SPI indices show fewer differences, i.e., they agree with each other except for some areas like Busogo ISAE Kigali Aero and Nyagatare that show many discrepancies between the estimated drought duration (Figure S1e). Contrarily to the extreme drought duration, which indicates that the SPI estimates a longer duration of drought events than SPEI, moderate drought events are longer for SPEI-12 than SPI-12 (Figure S1f). Overall, both metrics show that the duration and frequency of drought increase from extreme drought category to moderate, i.e., the country is more prone to moderate drought than severe and extreme.
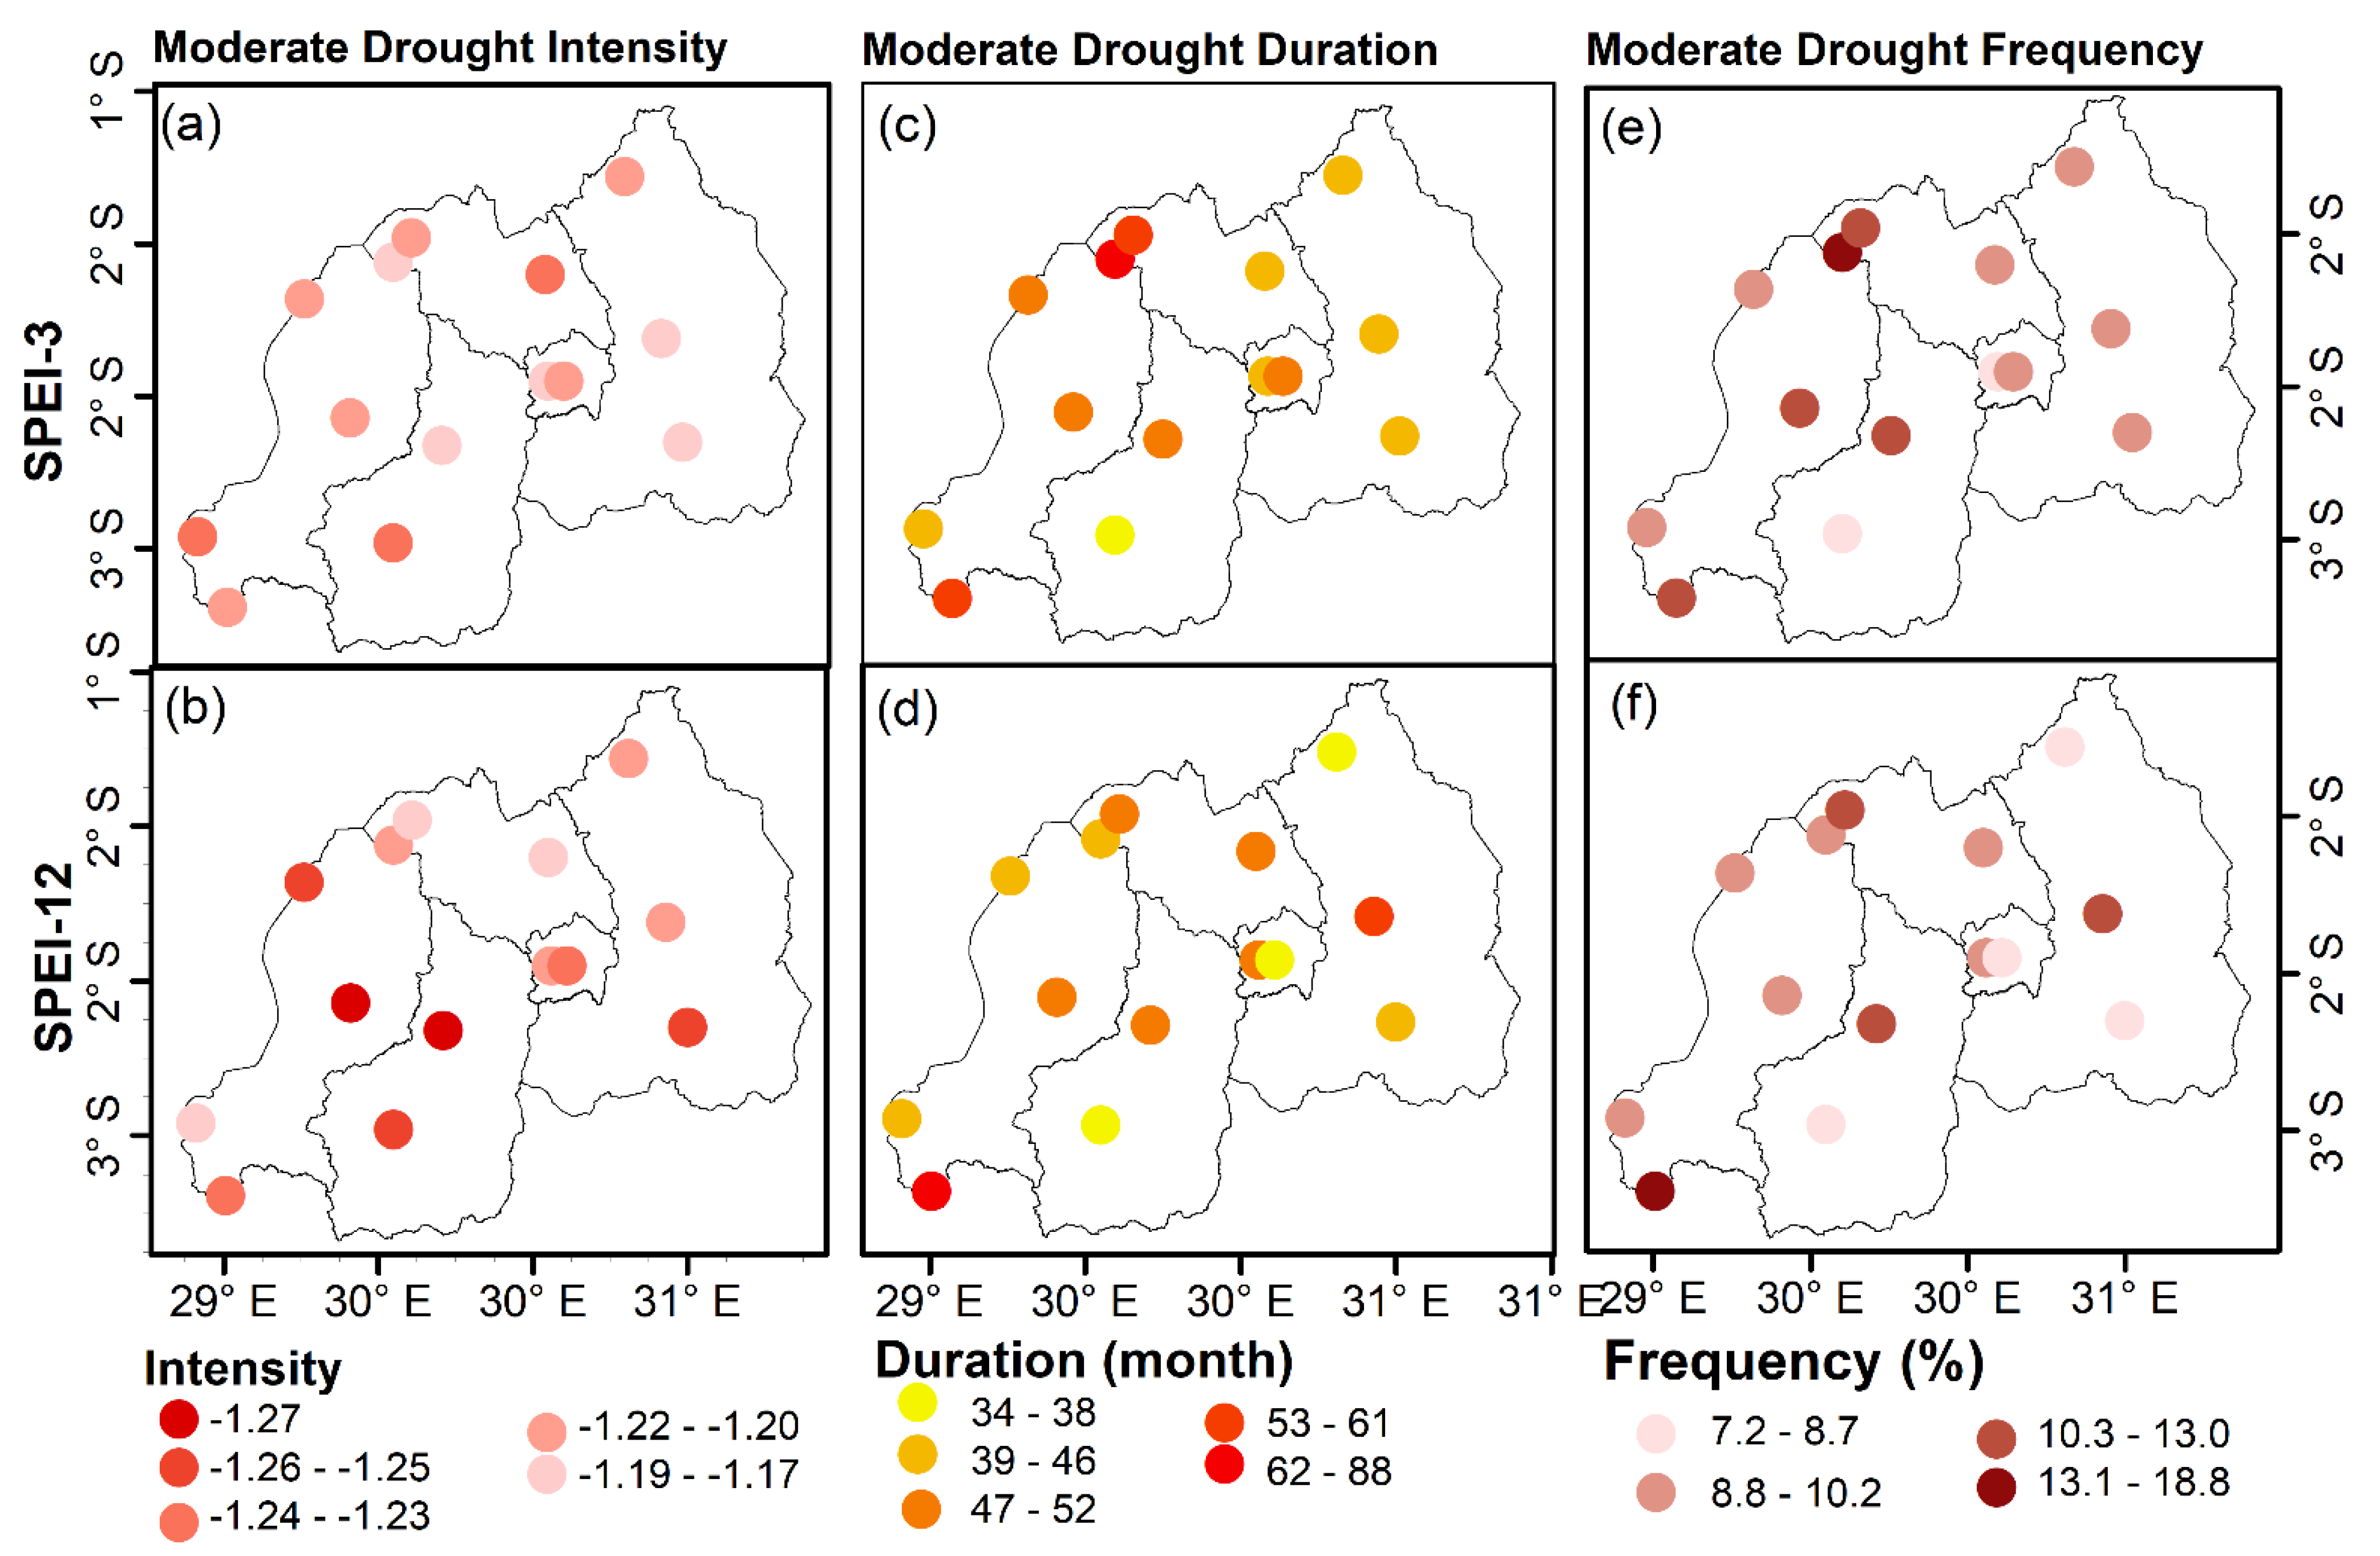
The intensity of moderate drought is higher under a longer time scale SPEI than in a shorter time scale (Figure 10a,b) and its magnitude ranges between −1.27 and −1.23 at 54% and 40% of the total sites based on SPEI-12 and SPEI-3, respectively. The highest intensity occurred on the stations located in southern and western parts of the country under SPEI-12, while a very small difference in intensity of moderate drought is observed at the 3-month SPEI. The duration of moderate drought is longest (62–88 months) at Bugarama in the southwest and Busogo in the northwest at SPEI-12 and SPEI-3, respectively. Unlike severe drought duration, there is not much difference observed in the duration of moderate drought at SPEI-3 and SPEI-12 except at Kawangire in the eastern part, which experienced a longer duration between 53 and 61 months under SPEI-12 and 39–46 months under SPEI-3. Two sites (Busogo and Musanze) in the northern parts also recorded a longer duration of moderate drought ranging between 53 and 88 months when SPEI-3 is used, while 39–52 months of the moderate drought was obtained using SPEI-12. There are many regional variations in the occurrence of moderate drought in both SPEI-12 and SPEI-3. However, the moderate drought frequency ranges between 7.2 and 10.2% in most sites at both SPEI time scales. Overall, the duration and frequency of moderate drought are higher than severe and extreme drought events at annual and 3-month time scales.
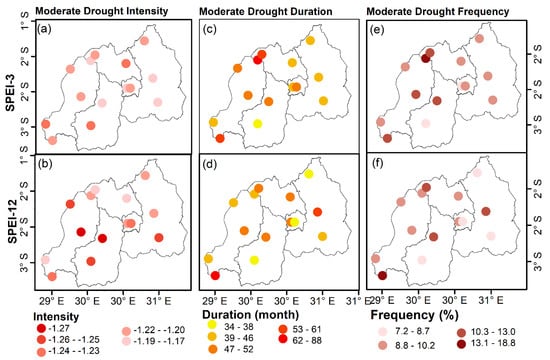
Figure 10.
The same as Figure 8 but under the moderate drought category (−1.0 ≥ SPEI > −1.5). The characteristics considered here are intensity (a,b), duration (c,d) and frequency (e,f).
Furthermore, we assessed the characteristics of meteorological drought during MAM and OND seasons (Figure S2). The results indicated that many sites did not record any seasonal extreme drought events in the recent past years. It was found that only 6 stations among 14 experienced extreme drought events with the intensity spanning between −2.0 to −2.5, for 1 to 2 seasons of the total seasons considered for each season, and its percentage of occurrence ranges between 2.5 and 5% (Figure S2). Thus, it is clear that based on SPEI, extreme drought events are less likely during both MAM and OND seasons in Rwanda (Figure S2A). However, SPI shows the opposite in some locations where SPEI indicated no extreme drought events during MAM. The SPI indicated that the extreme drought occurred at 11 stations out of 14, but with the duration ranging between 1 and 3 months accounting for 1 to 7% of the total drought events from 1981 to 2020 in MAM (Figure S3a,d,g). Both SPI and SPEI indicated no extreme drought event occurred at Busogo ISAE in the north and Bugarama in the southwestern part of the country during MAM. The number of locations that experienced extreme drought during OND is 6 out of 14, less than in MAM (11 stations) based on SPI and SPEI (Figure S4). This confirms that extreme drought events are less likely during OND than in MAM.
In terms of severe drought (Figure S2B), 86% of the stations experienced at least 1 severe drought event from 1981 to 2020 during the MAM season based on SPEI, while 93% of the sites observed at least severe dry event during OND season. The intensity of severe drought is the highest (−1.88 to −1.82) at the Nyagatare site in the east, Musanze in the north during MAM, and the Gicumbi and Musanze stations located in the northern parts of the country during OND season. The longest duration (5 months) of severe drought occurred at Kamembe Aero station in the southwestern area during MAM, followed by Rubavu Aero in the northwest, Busogo in the north, and Nyagatare in the northeast during OND with a duration of ~4 months. The severe droughts are more frequent during OND season than MAM where the drought occurred ~ 5 to 10% at 8 stations during OND and 4 out of 14 during MAM season. This implies that the OND is more likely exposed to severe drought than MAM. The intensity, frequency, and duration of severe drought events obtained using SPEI and SPI show similar patterns during MAM and OND seasons. Only Ngoma did not experience any severe drought event among all stations during MAM (Figure S3e). The severe drought events occurred more frequently with a longer duration than extreme drought in MAM and OND seasons.
Unlike severe drought, most of the sites across the country experienced moderate drought events in both MAM and OND seasons (Figure S2C). The moderate drought highly intensified (−1.3 to −1.26) in many locations during MAM (at 35% of the total stations) compared to the OND (1% of the total stations). The stations with higher intensities are located in eastern, central (Kigali City), and southwestern areas. Though these areas received high intensity of moderate drought, they lasted for a shorter period compared to the other areas in northwestern parts of the country that experienced less intensity of moderate drought but with a longer duration of 6–8 months. Similarly, the same locations received more frequent moderate drought during the OND season compared to MAM. Overall, the country is more prone to moderate drought events than severe and extreme drought events during MAM and OND seasons. However, the intensity, duration, and frequency differ spatially among seasons.
4. Discussion
The climate of Rwanda exhibits large temporal and spatial variability. The meteorological drought events are recurrent features resulting from variability of climatic parameters such as rainfall and temperature from seasonal to annual periods. The drought continues to affect the life and livelihood of people, animals, the environment, and the economy [2,3,4] worldwide. The vulnerability to drought varies from region to region depending on economic status, large dependency on rain-fed agriculture, and others. A recent study [73] that used a multidimensional modeling framework to assess the level of drought vulnerability across all African nations indicated that Rwanda is at a high risk of drought. Considering various factors such as infrastructure and technology, renewable natural capital, human and civic resources, and economy, a recent study [74] ranked Rwanda and Burundi as the first highly vulnerable countries to the drought in East Africa. Therefore, the comprehensive assessment of the historical meteorological drought could help better plan and mitigate such hazards. It is in this regard, the present study attempted to evaluate historical characteristics of meteorological drought events at various locations in Rwanda based on SPEI and SPI indices at seasonal and annual time scales from 1981 to 2020.
The variability and changes in climatic variables have been observed over the region with the most significant change in temperature in past decades. The recently observed temperature change is mainly attributed to greenhouse gas emissions [1] and natural internal variability such as the El Nino Southern Oscillation as well as the Interdecadal Pacific Oscillation [75,76,77,78,79]. The same observations were captured in the recently released sixth Assessment Report of the Intergovernmental Panel on Climate Change (AR6-IPCC), which states that human-induced climate change is the main driver of recent trends in surface air temperature and precipitation change [2]. This observed variability and change in climatic variables had profound impacts on drought occurrence over the region and it is expected to continue in the future if nothing is done to reduce greenhouse gas emissions [34,79,80]. The present study also revealed an increasing annual and seasonal surface air temperature trend. The findings of this research agree with recent studies [41,52]. An unabated rise in surface temperature will likely increase the potential evapotranspiration rate, leading to further dry events over the region.
Previous studies [34,80] indicated that global warming might lead to an upsurge in drought occurrence and severity across many regions, including East Africa, where Rwanda is located. The present study shows an increasing trend towards moderate to severe drought events at annual and seasonal scales. Though the historically observed rate of change in meteorological drought is not significant, the effect of climate change may exacerbate this change in the future. Therefore, it is crucial to assess what models predict at the national level in order to help policy and decision-makers take accurate future drought mitigation and adaptation measures. Nonetheless, a concerted effort has been made by previous researchers to investigate historical and anticipated changes in extremely dry and wet events over East Africa. The region experienced rapid increasing trends in extreme wet and dry scenarios in the later 20th century and early 21st century [45,79]. East Africa also witnessed severe flood events [81] that greatly impacted people’s lives. Thus, more continuous efforts should be put in this area of research to improve the predictability of droughts and floods events and improve the established early warning systems.
The present study compared SPEI and SPEI in estimating meteorological drought characteristics in Rwanda. SPEI is a water balance-based index, while SPI depends only on rainfall. Both indices captured well the temporal variability of meteorological drought and its characteristics at different time scales over the study domain. SPEI captured more severe and moderate droughts than SPI. Contrarily, when considering rainfall alone, SPI revealed more extreme droughts compared to SPEI. Though not very obvious, the SPEI droughts occurred with high magnitude and longer duration than SPI. This may be because temperature enhances the potential evaporation rate, resulting in increased evaporative water balance [45,62] and, therefore, water deficit. The correlation between SPI and SPEI at 3 and 12 months indicated a high positive correlation between these indices, implying that rainfall is a major driver of meteorological drought.
The present study’s findings that assessed meteorological drought over Rwanda based on SPEI and SPI from 1981 to 2020 showed a decreasing pattern towards moderate to severe dry events across many sites considered here, a result that agrees with previous studies conducted in the region [42,82]. In addition, some studies e.g., [27,75,83] attributed the post-1998 increase in the frequency of drought over East Africa to the multi-decadal variability of sea surface temperatures in the tropical Pacific and Indian oceans.
Drought is normally defined as a lack of precipitation over a longer time frame, resulting in a water shortage for some groups, areas, or activities [84]. Water shortage and drought are distinctive phenomena despite the fact that they are susceptible to aggravating the influences of each other. In some areas, the severity and frequency of droughts can lead to water scarcity conditions, whereas overexploitation of existing water resources can worsen the effects of droughts [85]. Various studies demonstrate that drought is among the most dangerous distractive disaster in the current warming world [86,87,88,89], impacting natural resources such as sustainable water and environment, agriculture, ecology, and biodiversity [79,90,91,92]. The present study shows that drought occurrences are increasing, which may lead to severe impacts on water resources and agriculture management in a country with a high population density like Rwanda. It is important to note that this study assesses the historical changes in meteorological drought and did not investigate external factors that could contribute to the drought occurrence. Thus, further studies are needed to investigate the influence of various factors like land cover change, population, and urbanization among others, on the occurrence of drought events in Rwanda.
5. Conclusions
Using ground-based rainfall and temperature data collected from fourteen principal stations distributed across Rwanda, the present research examined recent changes in rainfall and surface air temperature from 1981 to 2020 over Rwanda. Furthermore, the same datasets were used to investigate the spatiotemporal changes in drought characteristics based on SPEI and SPI. The severity of the meteorological drought was analyzed at 3-month and 12-month time scales.
The results showed much variability in rainfall and temperature, with an exceptional annual and seasonal rainfall decrease from 2010 to 2017. The rainfall exhibited an increasing trend of ~8.4 mm/decade at the annual time scale, while an increase (decrease) of ~4.5 mm/decade (−3.4 mm/decade) was observed during the OND and MAM seasons, respectively. However, the observed increases and decreases were found not to be significant at the 95% confidence level. Contrarily, the surface air temperature experienced sharp, significant increasing trends in both seasons and annual time scales. From 1981 to 2020, the annual surface air temperature (SAT) increased by ~0.23 °C per decade, while for MAM and OND, SAT increased by ~0.19 and 0.2 °C per decade, respectively. The last decade (2010–2020) witnessed a sharp increase in SAT over Rwanda.
The SPEI-3 analysis indicated that many locations across Rwanda experienced moderate to severe drought events during the 1981–1990 decade, followed by moderate to severely wet events. The years 2015, 2016, and 2017 were moderately to severely dry in many locations across the country, with some areas like Kamembe Aero, Nyamagabe, Musanze Aero, Byumba, Nyagatare, Kawangire, and Ngoma exhibiting extreme drought events in the year 2016 to 2017. In addition, the wettest period of 1997/1998 caused by strong El Nino was revealed in the 3-month SPEI, which demonstrates the ability of the SPEI-3 index to capture dry and wet conditions. It was found that seasonal drought intensity behaved differently under these two seasons whereby eight out of fourteen stations indicated a decreasing trend toward the moderate to severe drought during MAM, while only four stations showed negative trends during the OND season. Overall, the SPEI and SPI characteristics indicated that the country is more prone to moderate drought events than severe and extreme drought events during both MAM and OND seasons. However, the intensity, duration, and frequency differ spatially among seasons.
Supplementary Materials
The following supporting information can be downloaded at: https://www.mdpi.com/article/10.3390/su14031519/s1, Figure S1: Variations of the characteristics of SPEI and SPI indices at 12-month time scale under Extreme drought category (SPEI/SPI =< −2) for all stations used in this study from 1981-2020. The characteristics considered here are Intensity (a,b,c), Duration (d,e,f) and Frequency (g,k,l); Figure S2: The seasonal characteristics of SPEI-3 during MAM and OND under (A) Extreme drought category (SPEI=< −2), (B) severe drought category (−1.5 ≥ SPEI > −2.0), and (C) moderate drought category (−1.0 ≥ SPEI > −1.5). The characteristics considered here are Intensity (a,b), Duration (c,d) and Frequency (e,f); Figure S3: The MAM seasonal characteristics of SPEI and SPI at 3-month from 1981 to 2020. The characteristics considered here are Intensity (a,b,c), Duration (d,e,f) and Frequency (g,k,l).; Figure S4: The same as Figure S3 but during OND season. The characteristics considered here are Intensity (a,b,c), Duration (d,e,f) and Frequency (g,k,l); Table S1: The correlation between SPI and SPEI at 3 and 12-month time scales for all stations used in this study.
Author Contributions
Conceptualization, J.U. and V.I.; methodology, J.U.; formal analysis, J.U., V.I., I.U., B.A. and Y.J.; investigation, Y.J.; data curation, J.U. and V.I.; writing—original draft preparation, J.U.; writing—review and editing, V.I., B.A. and I.U.; supervision, Y.J.; funding acquisition, Y.J. All authors have read and agreed to the published version of the manuscript.
Funding
This research was funded by the National Natural Science Foundation of China, grant number 41575111 and the Open Research Fund of Key Laboratory of Digital Earth Science, Institute of Remote Sensing and Digital Earth, CAS, grant number 2018LDE003.
Data Availability Statement
The datasets used in the present study can be obtained from Rwanda Meteorology Agency.
Acknowledgments
The authors acknowledge Rwanda Meteorology Agency for providing data used in this study. The first author (Jacqueline Uwimbabazi) is thankful to the World Meteorological Organization, Nanjing University of Information Science and Technology, and the Rwanda Meteorology Agency for sponsoring her Master’s studies. The authors are grateful to the four anonymous reviewers for their constructive and useful comments.
Conflicts of Interest
The authors declare no conflict of interest.
References
- Iyakaremye, V.; Zeng, G.; Siebert, A.; Yang, X. Contribution of external forcings to the observed trend in surface temperature over Africa during 1901–2014 and its future projection from CMIP6 simulations. Atmos. Res. 2021, 254, 105512. [Google Scholar] [CrossRef]
- Masson-Delmotte, L.; Zhai, V.P.; Pirani, A.; Connors, S.L.; Péan, C.; Berger, S.; Caud, N.; Chen, Y.; Goldfarb, T.W.; Gomis, M.I.; et al. IPCC Summary for Policymakers. In Climate Change 2021: The Physical Science Basis. Contribution of Working Group I to the Sixth Assessment Report of the Intergovernmental Panel on Climate Change; Yelekçi, O., Ed.; Cambridge University Press: New York, NY, USA, 2021. [Google Scholar]
- Ault, T.R.; Mankin, J.S.; Cook, B.I.; Smerdon, J.E. Relative impacts of mitigation, temperature, and precipitation on 21st-century megadrought risk in the American Southwest. Sci. Adv. 2016, 2, e1600873. [Google Scholar] [CrossRef] [PubMed] [Green Version]
- Leng, G.; Tang, Q.; Rayburg, S. Climate change impacts on meteorological, agricultural and hydrological droughts in China. Glob. Planet. Change 2015, 126, 23–34. [Google Scholar] [CrossRef]
- Ayugi, B.; Tan, G.; Niu, R.; Dong, Z.; Ojara, M.; Mumo, L.; Babaousmail, H.; Ongoma, V. Evaluation of Meteorological Drought and Flood Scenarios over Kenya, East Africa. Atmosphere 2020, 11, 307. [Google Scholar] [CrossRef] [Green Version]
- Agutu, N.O.; Awange, J.L.; Zerihun, A.; Ndehedehe, C.E.; Kuhn, M.; Fukuda, Y. Assessing multi-satellite remote sensing, reanalysis, and land surface models’ products in characterizing agricultural drought in East Africa. Remote Sens. Environ. 2017, 194, 287–302. [Google Scholar] [CrossRef] [Green Version]
- Sheffield, J.; Wood, E.F.; Roderick, M.L. Little change in global drought over the past 60 years. Nature 2012, 491, 435–438. [Google Scholar] [CrossRef] [PubMed]
- Wang, G.; Gong, T.; Lu, J.; Lou, D.; Hagan, D.F.T.; Chen, T. On the long-term changes of drought over China (1948–2012) from different methods of potential evapotranspiration estimations. Int. J. Climatol. 2018, 38, 2954–2966. [Google Scholar] [CrossRef]
- Huang, J.; Li, Y.; Fu, C.; Chen, F.; Fu, Q.; Dai, A.; Shinoda, M.; Ma, Z.; Guo, W.; Li, Z.; et al. Dryland climate change: Recent progress and challenges. Rev. Geophys. 2017, 55, 719–778. [Google Scholar] [CrossRef]
- WMO. Experts Recommend Agricultural Drought Indices for Improved Understanding of Food Production Conditions; World Meteorological Organization and Global Water Partnership: Murcia, Geneva, 2016. [Google Scholar]
- Łabędzki, L. Estimation of local drought frequency in central Poland using the standardized precipitation index SPI. Irrig. Drain. 2007, 56, 67–77. [Google Scholar] [CrossRef]
- Mishra, A.K.; Singh, V.P. A review of drought concepts. J. Hydrol. 2010, 391, 202–216. [Google Scholar] [CrossRef]
- Svoboda, M.; Fuchs, B. Handbook of Drought Indicators and Indices. 2016. Available online: https://digitalcommons.unl.edu/cgi/viewcontent.cgi?article=1118amp;context=droughtfacpub (accessed on 6 December 2021).
- Dai, A. Characteristics and trends in various forms of the Palmer Drought Severity Index during 1900–2008. J. Geophys. Res. 2011, 116, D12115. [Google Scholar] [CrossRef] [Green Version]
- Dai, A. Increasing drought under global warming in observations and models. Nat. Clim. Change 2013, 3, 52–58. [Google Scholar] [CrossRef]
- Trenberth, K.E.; Dai, A.; Van Der Schrier, G.; Jones, P.D.; Barichivich, J.; Briffa, K.R.; Sheffield, J. Global warming and changes in drought. Nat. Clim. Change 2014, 4, 17–22. [Google Scholar] [CrossRef]
- Zhu, Y.; Liu, Y.; Wang, W.; Singh, V.P.; Ren, L. A global perspective on the probability of propagation of drought: From meteorological to soil moisture. J. Hydrol. 2021, 603, 126907. [Google Scholar] [CrossRef]
- AghaKouchak, A.; Cheng, L.; Mazdiyasni, O.; Farahmand, A. Global warming and changes in risk of concurrent climate extremes: Insights from the 2014 California drought. Geophys. Res. Lett. 2014, 41, 8847–8852. [Google Scholar] [CrossRef] [Green Version]
- Rajbanshi, J.; Das, S. The variability and teleconnections of meteorological drought in the Indian summer monsoon season: Implications for staple crop production. J. Hydrol. 2021, 603, 126845. [Google Scholar] [CrossRef]
- Liang, L.; Zhao, S.-H.; Qin, Z.-H.; He, K.-X.; Chen, C.; Luo, Y.-X.; Zhou, X.-D. Drought Change Trend Using MODIS TVDI and Its Relationship with Climate Factors in China from 2001 to 2010. J. Integr. Agric. 2014, 13, 1501–1508. [Google Scholar] [CrossRef]
- Sun, S.; Chen, H.; Wang, G.; Li, J.; Mu, M.; Yan, G.; Xu, B.; Huang, J.; Wang, J.; Zhang, F.; et al. Shift in potential evapotranspiration and its implications for dryness/wetness over Southwest China. J. Geophys. Res. Atmos. 2016, 121, 9342–9355. [Google Scholar] [CrossRef] [Green Version]
- Spinoni, J.; Naumann, G.; Vogt, J.V.; Barbosa, P. The biggest drought events in Europe from 1950 to 2012. J. Hydrol. Reg. Stud. 2015, 3, 509–524. [Google Scholar] [CrossRef]
- Hoerling, M.; Eischeid, J.; Perlwitz, J.; Quan, X.; Zhang, T.; Pegion, P. On the Increased Frequency of Mediterranean Drought. J. Clim. 2012, 25, 2146–2161. [Google Scholar] [CrossRef] [Green Version]
- Masupha, T.E.; Moeletsi, M.E.; Tsubo, M. Prospects of an agricultural drought early warning system in South Africa. Int. J. Disaster Risk Reduct. 2021, 66, 102615. [Google Scholar] [CrossRef]
- Archer, E.; du Toit, J.; Engelbrecht, C.; Hoffman, M.T.; Landman, W.; Malherbe, J.; Stern, M. The 2015-19 multi year drought in the Eastern Cape, South Africa: It’s evolution and impacts on agriculture. J. Arid Environ. 2022, 196, 104630. [Google Scholar] [CrossRef]
- Kalisa, W.; Zhang, J.; Igbawua, T.; Ujoh, F.; Ebohon, O.J.; Namugize, J.N.; Yao, F. Spatio-temporal analysis of drought and return periods over the East African region using Standardized Precipitation Index from 1920 to 2016. Agric. Water Manag. 2020, 237, 106195. [Google Scholar] [CrossRef]
- Lyon, B.; DeWitt, D.G. A recent and abrupt decline in the East African long rains. Geophys. Res. Lett. 2012, 39. [Google Scholar] [CrossRef] [Green Version]
- Dai, A. The influence of the inter-decadal Pacific oscillation on US precipitation during 1923–2010. Clim. Dyn. 2013, 41, 633–646. [Google Scholar] [CrossRef] [Green Version]
- Dai, A.; Zhao, T. Uncertainties in historical changes and future projections of drought. Part I: Estimates of historical drought changes. Clim. Change 2017, 144, 519–533. [Google Scholar] [CrossRef]
- Huang, J.; Guan, X.; Ji, F. Enhanced cold-season warming in semi-arid regions. Atmos. Chem. Phys. 2012, 12, 5391–5398. [Google Scholar] [CrossRef] [Green Version]
- Harrington, L.J.; Otto, F.E.L. Reconciling theory with the reality of African heatwaves. Nat. Clim. Change 2020, 10, 796–798. [Google Scholar] [CrossRef]
- FAO. The Impact of Disasters and Crises on Agriculture and Food Security: 2021; FAO-UN: New York, NY, USA, 2021. [Google Scholar]
- Park, C.-E.; Jeong, S.-J.; Joshi, M.; Osborn, T.J.; Ho, C.-H.; Piao, S.; Chen, D.; Liu, J.; Yang, H.; Park, H.; et al. Keeping global warming within 1.5 °C constrains emergence of aridification. Nat. Clim. Change 2018, 8, 70–74. [Google Scholar] [CrossRef] [Green Version]
- Haile, G.G.; Tang, Q.; Hosseini-Moghari, S.; Liu, X.; Gebremicael, T.G.; Leng, G.; Kebede, A.; Xu, X.; Yun, X. Projected Impacts of Climate Change on Drought Patterns Over East Africa. Earth’s Futur. 2020, 8, e2020EF001502. [Google Scholar] [CrossRef]
- Iyakaremye, V.; Zeng, G.; Zhang, G. Changes in extreme temperature events over Africa under 1.5 and 2.0 °C global warming scenarios. Int. J. Climatol. 2020, 41, joc.6868. [Google Scholar] [CrossRef]
- Nangombe, S.S.; Zhou, T.; Zhang, W.; Zou, L.; Li, D. High-Temperature Extreme Events Over Africa Under 1.5 and 2 °C of Global Warming. J. Geophys. Res. Atmos. 2019, 124, 4413–4428. [Google Scholar] [CrossRef] [Green Version]
- Nangombe, S.S.; Zhou, T.; Zhang, W.; Wu, B.; Hu, S.; Zou, L.; Li, D. Record-breaking climate extremes in Africa under stabilized 1.5 °C and 2 °C global warming scenarios. Nat. Clim. Change 2018, 8, 375–380. [Google Scholar] [CrossRef]
- Ayugi, B.; Ngoma, H.; Babaousmail, H.; Karim, R.; Iyakaremye, V.; Sian, K.T.L.K.; Ongoma, V. Evaluation and projection of mean surface temperature using CMIP6 models over East Africa. J. Afr. Earth Sci. 2021, 181, 104226. [Google Scholar] [CrossRef]
- Ongoma, V.; Chen, H.; Gao, C. Projected changes in mean rainfall and temperature over East Africa based on CMIP5 models. Int. J. Climatol. 2018, 38, 1375–1392. [Google Scholar] [CrossRef]
- Gebrechorkos, S.H.; Hülsmann, S.; Bernhofer, C. Analysis of climate variability and droughts in East Africa using high-resolution climate data products. Glob. Planet. Change 2020, 186, 103130. [Google Scholar] [CrossRef]
- Ongoma, V.; Chen, H. Temporal and spatial variability of temperature and precipitation over East Africa from 1951 to 2010. Meteorol. Atmos. Phys. 2017, 129, 131–144. [Google Scholar] [CrossRef]
- Williams, A.P.; Funk, C. A westward extension of the warm pool leads to a westward extension of the Walker circulation, drying eastern Africa. Clim. Dyn. 2011, 37, 2417–2435. [Google Scholar] [CrossRef] [Green Version]
- Makula, E.K.; Zhou, B. Changes in March to May rainfall over Tanzania during 1978–2017. Int. J. Climatol. 2021, 41, 5663–5675. [Google Scholar] [CrossRef]
- Jonah, K.; Wen, W.; Shahid, S.; Ali, A.; Bilal, M.; Habtemicheal, B.A.; Iyakaremye, V.; Qiu, Z.; Almazroui, M.; Wang, Y.; et al. Spatiotemporal variability of rainfall trends and influencing factors in Rwanda. J. Atmos. Solar-Terr. Phys. 2021, 219, 105631. [Google Scholar] [CrossRef]
- Polong, F.; Chen, H.; Sun, S.; Ongoma, V. Temporal and spatial evolution of the standard precipitation evapotranspiration index (SPEI) in the Tana River Basin, Kenya. Theor. Appl. Climatol. 2019, 138, 777–792. [Google Scholar] [CrossRef]
- Mutsotso, R.B.; Sichangi, A.W.; Makokha, G.O. Spatio-Temporal Drought Characterization in Kenya from 1987 to 2016. Adv. Remote Sens. 2018, 7, 125–143. [Google Scholar] [CrossRef] [Green Version]
- Kew, S.F.; Philip, S.Y.; Hauser, M.; Hobbins, M.; Wanders, N.; van Oldenborgh, G.J.; van der Wiel, K.; Veldkamp, T.I.E.; Kimutai, J.; Funk, C.; et al. Impact of precipitation and increasing temperatures on drought trends in eastern Africa. Earth Syst. Dyn. 2021, 12, 17–35. [Google Scholar] [CrossRef]
- Zhou, X.; Chen, L.; Umuhoza, J.; Cheng, Y.; Wang, L.; Wang, R. Intraseasonal oscillation of the rainfall variability over Rwanda and evaluation of its subseasonal forecasting skill. Atmos. Ocean. Sci. Lett. 2021, 14, 100099. [Google Scholar] [CrossRef]
- Umutoni, M.A.; Japheth, L.P.; Lipiki, E.J.; Kebacho, L.L.; Limbu, P.T.S.; Makula, E.K. Investigation of the 2016 March to May extreme rainfall over Rwanda. Nat. Hazards 2021, 108, 607–618. [Google Scholar] [CrossRef]
- Ngarukiyimana, J.P.; Fu, Y.; Sindikubwabo, C.; Nkurunziza, I.F.; Katchele Ogou, F.; Vuguziga, F.; Ogwang, B.A.; Yang, Y. Climate Change in Rwanda: The Observed Changes in Daily Maximum and Minimum Surface Air Temperatures during 1961–2014. Front. Earth Sci. 2021, 9, 106. [Google Scholar] [CrossRef]
- Mukamuhirwa, A.; Hovmalm, H.P.; Bolinsson, H.; Ortiz, R.; Nyamangyoku, O.; Johansson, E. Concurrent Drought and Temperature Stress in Rice—A Possible Result of the Predicted Climate Change: Effects on Yield Attributes, Eating Characteristics, and Health Promoting Compounds. Int. J. Environ. Res. Public Health 2019, 16, 1043. [Google Scholar] [CrossRef] [Green Version]
- Mukamuhirwa, A.; Hovmalm, H.P.; Ortiz, R.; Nyamangyoku, O.; Prieto–Linde, M.L.; Ekholm, A.; Johansson, E. Effect of intermittent drought on grain yield and quality of rice (Oryza sativa L.) grown in Rwanda. J. Agron. Crop Sci. 2020, 206, 252–262. [Google Scholar] [CrossRef]
- Malunda, D. Report for the African Centre for Economic Transformation (ACET) Rwanda: Case Study on Economic Transformation; IPAR: Kigali, Rwanda, 2012. [Google Scholar]
- Ntwali, D.; Ogwang, B.A.; Ongoma, V. The Impacts of Topography on Spatial and Temporal Rainfall Distribution over Rwanda Based on WRF Model. Atmos. Clim. Sci. 2016, 6, 145–157. [Google Scholar] [CrossRef] [Green Version]
- Ngarukiyimana, J.P.; Fu, Y.; Yang, Y.; Ogwang, B.A.; Ongoma, V.; Ntwali, D. Dominant atmospheric circulation patterns associated with abnormal rainfall events over Rwanda, East Africa. Int. J. Climatol. 2018, 38, 187–202. [Google Scholar] [CrossRef]
- Ogwang, B.A.; Chen, H.; Tan, G.; Ongoma, V.; Ntwali, D. Diagnosis of East African climate and the circulation mechanisms associated with extreme wet and dry events: A study based on RegCM4. Arab. J. Geosci. 2015, 8, 10255–10265. [Google Scholar] [CrossRef]
- Ayugi, B.O.; Tan, G.; Ongoma, V.; Mafuru, K.B. Circulations Associated with Variations in Boreal Spring Rainfall over Kenya. Earth Syst. Environ. 2018, 2, 421–434. [Google Scholar] [CrossRef]
- Hastenrath, S.; Polzin, D.; Camberlin, P. Exploring the predictability of the‘Short Rains’ at the coast of East Africa. Int. J. Climatol. 2004, 24, 1333–1343. [Google Scholar] [CrossRef]
- Nicholson, S.E. Climate and climatic variability of rainfall over eastern Africa. Rev. Geophys. 2017, 55, 590–635. [Google Scholar] [CrossRef] [Green Version]
- Kebacho, L.L. Large-scale circulations associated with recent interannual variability of the short rains over East Africa. Meteorol. Atmos. Phys. 2022, 134, 10. [Google Scholar] [CrossRef]
- Siebert, A.; Dinku, T.; Vuguziga, F.; Twahirwa, A.; Kagabo, D.M.; del Corral, J.; Robertson, A.W. Evaluation of ENACTS-Rwanda: A new multi-decade, high-resolution rainfall and temperature data set—Climatology. Int. J. Climatol. 2019, 39, 3104–3120. [Google Scholar] [CrossRef] [Green Version]
- Vicente-Serrano, S.M.; Beguería, S.; López-Moreno, J.I. A Multiscalar Drought Index Sensitive to Global Warming: The Standardized Precipitation Evapotranspiration Index. J. Clim. 2010, 23, 1696–1718. [Google Scholar] [CrossRef] [Green Version]
- Beguería, S.; Vicente-Serrano, S.M.; Reig, F.; Latorre, B. Standardized precipitation evapotranspiration index (SPEI) revisited: Parameter fitting, evapotranspiration models, tools, datasets and drought monitoring. Int. J. Climatol. 2014, 34, 3001–3023. [Google Scholar] [CrossRef] [Green Version]
- Awal, R.; Habibi, H.; Fares, A.; Deb, S. Estimating reference crop evapotranspiration under limited climate data in West Texas. J. Hydrol. Reg. Stud. 2020, 28, 100677. [Google Scholar] [CrossRef]
- Droogers, R.G.; Peter, A. Estimating Reference Evapotranspiration Under Inaccurate Data Conditions. Irrig. Drain. Syst. 2002, 16, 33–45. [Google Scholar] [CrossRef]
- Hargreaves, G.H.; Allen, R.G. History and Evaluation of Hargreaves Evapotranspiration Equation. J. Irrig. Drain. Eng. 2003, 129, 53–63. [Google Scholar] [CrossRef]
- SGebrechorkos, H.; Hülsmann, S.; Bernhofer, C. Regional climate projections for impact assessment studies in East Africa. Environ. Res. Lett. 2019, 14, 044031. [Google Scholar] [CrossRef]
- Balint, Z.; Mutua, F.; Muchiri, P.; Omuto, C.T. Monitoring Drought with the Combined Drought Index in Kenya. Dev. Earth Surf. Processes 2013, 16, 341–356. [Google Scholar]
- Manatsa, D.; Mukwada, G.; Siziba, E.; Chinyanganya, T. Analysis of multidimensional aspects of agricultural droughts in Zimbabwe using the Standardized Precipitation Index (SPI). Theor. Appl. Climatol. 2010, 102, 287–305. [Google Scholar] [CrossRef]
- Musonda, B.; Jing, Y.; Iyakaremye, V.; Ojara, M. Analysis of Long-Term Variations of Drought Characteristics Using Standardized Precipitation Index over Zambia. Atmosphere 2020, 11, 1268. [Google Scholar] [CrossRef]
- Sen, P.K. Estimates of the Regression Coefficient Based on Kendall’s Tau. J. Am. Stat. Assoc. 1968, 63, 1379–1389. [Google Scholar] [CrossRef]
- Ayugi, B.O.; Tan, G. Recent trends of surface air temperatures over Kenya from 1971 to 2010. Meteorol. Atmos. Phys. 2019, 131, 1401–1413. [Google Scholar] [CrossRef]
- Ahmadalipour, A.; Moradkhani, H. Multi-dimensional assessment of drought vulnerability in Africa: 1960–2100. Sci. Total Environ. 2018, 644, 520–535. [Google Scholar] [CrossRef]
- Naumann, G.; Barbosa, P.; Garrote, L.; Iglesias, A.; Vogt, J. Exploring drought vulnerability in Africa: An indicator based analysis to be used in early warning systems. Hydrol. Earth Syst. Sci. 2014, 18, 1591–1604. [Google Scholar] [CrossRef] [Green Version]
- Lyon, B. Seasonal Drought in the Greater Horn of Africa and Its Recent Increase during the March–May Long Rains. J. Clim. 2014, 27, 7953–7975. [Google Scholar] [CrossRef]
- Gu, G.; Adler, R.F. Interdecadal variability/long-term changes in global precipitation patterns during the past three decades: Global warming and/or pacific decadal variability? Clim. Dyn. 2013, 40, 3009–3022. [Google Scholar] [CrossRef]
- Dai, A. Future Warming Patterns Linked to Today’s Climate Variability. Sci. Rep. 2016, 6, 19110. [Google Scholar] [CrossRef] [PubMed] [Green Version]
- Dong, B.; Dai, A. The influence of the Interdecadal Pacific Oscillation on Temperature and Precipitation over the Globe. Clim. Dyn. 2015, 45, 2667–2681. [Google Scholar] [CrossRef]
- Tan, G.; Ayugi, B.; Ngoma, H.; Ongoma, V. Projections of future meteorological drought events under representative concentration pathways (RCPs) of CMIP5 over Kenya, East Africa. Atmos. Res. 2020, 246, 105112. [Google Scholar] [CrossRef]
- Nguvava, M.; Abiodun, B.J.; Otieno, F. Projecting drought characteristics over East African basins at specific global warming levels. Atmos. Res. 2019, 228, 41–54. [Google Scholar] [CrossRef]
- Nicholson, S.E. The Predictability of Rainfall over the Greater Horn of Africa. Part I: Prediction of Seasonal Rainfall. J. Hydrometeorol. 2014, 15, 1011–1027. [Google Scholar] [CrossRef]
- Tierney, J.E.; Ummenhofer, C.C.; DeMenocal, P.B. Past and future rainfall in the Horn of Africa. Sci. Adv. 2015, 1, e1500682. [Google Scholar] [CrossRef] [Green Version]
- Shongwe, M.E.; van Oldenborgh, G.J.; van den Hurk, B.; van Aalst, M. Projected Changes in Mean and Extreme Precipitation in Africa under Global Warming. Part II: East Africa. J. Clim. 2011, 24, 3718–3733. [Google Scholar] [CrossRef] [Green Version]
- Becker, S.; Sparks, P. It never rains in California’: Constructions of drought as a natural and social phenomenon. Weather Clim. Extrem. 2020, 29, 100257. [Google Scholar] [CrossRef]
- Liu, M.; Ma, X.; Yin, Y.; Zhang, Z.; Yin, Z.; Ullah, I.; Arshad, M. Non-stationary frequency analysis of extreme streamflow disturbance in a typical ecological function reserve of China under a changing climate. Ecohydrology 2021, 14, e2323. [Google Scholar] [CrossRef]
- Ullah, I.; Ma, X.; Yin, J.; Saleem, F.; Syed, S.; Omer, A.; Habtemicheal, B.A.; Liu, M.; Arshad, M. Observed changes in seasonal drought characteristics and their possible potential drivers over Pakistan. Int. J. Climatol. 2021, joc.7321. [Google Scholar] [CrossRef]
- Ullah, I.; Ma, X.; Yin, J.; Asfaw, T.G.; Azam, K.; Syed, S.; Liu, M.; Arshad, M.; Shahzaman, M. Evaluating the meteorological drought characteristics over Pakistan using in situ observations and reanalysis products. Int. J. Climatol. 2021, 41, joc.7063. [Google Scholar] [CrossRef]
- Shahzaman, M.; Zhu, W.; Ullah, I. Comparison of Multi-Year Reanalysis, Models, and Satellite Remote Sensing Products for Agricultural Drought Monitoring over South Asian Countries. Remote Sens. 2021, 13, 3294. [Google Scholar] [CrossRef]
- Sein, Z.M.M.; Zhi, X.; Ullah, I.; Azam, K.; Ngoma, H.; Saleem, F.; Xing, Y.; Iyakaremye, V.; Syed, S.; Hina, H.; et al. Recent variability of sub-seasonal monsoon precipitation and its potential drivers in Myanmar using in-situ observation during 1981–2020. Int. J. Climatol. 2021. [Google Scholar] [CrossRef]
- Igbawua, T.; Zhang, J.; Yao, F.; Zhang, D. Assessment of moisture budget over West Africa using MERRA-2’s aerological model and satellite data. Clim. Dyn. 2019, 52, 83–106. [Google Scholar] [CrossRef]
- Liu, Q.; Zhang, S.; Zhang, H.; Bai, Y.; Zhang, J. Monitoring drought using composite drought indices based on remote sensing. Sci. Total Environ. 2020, 711, 134585. [Google Scholar] [CrossRef] [PubMed]
- Sallam, A.; Alqudah, A.M.; Dawood, M.F.A.; Baenziger, P.S.; Börner, A. Drought Stress Tolerance in Wheat and Barley: Advances in Physiology, Breeding and Genetics Research. Int. J. Mol. Sci. 2019, 20, 3137. [Google Scholar] [CrossRef] [Green Version]

Publisher’s Note: MDPI stays neutral with regard to jurisdictional claims in published maps and institutional affiliations. |
© 2022 by the authors. Licensee MDPI, Basel, Switzerland. This article is an open access article distributed under the terms and conditions of the Creative Commons Attribution (CC BY) license (https://creativecommons.org/licenses/by/4.0/).